
Abstract
Superoxide anions are highly reactive radicals overproduced in many pathological situations such as inflammation and ischemia. One of the major factors in the protection from superoxide anions is the enzyme superoxide dismutase (SOD), which catalyzes the dismutation of superoxide to hydrogen peroxide. This study presents a quantitative histochemical method to estimate SOD activity in rat brain tissue sections. This method is based on the cerium capture method and 3,3'-diaminobenzidine amplification of transition cerium compounds. Substrate for SOD was provided by reduction of oxygen during the autoxidation of riboflavin in the presence of UV light. This histochemical method reveals the overall activity of the three different forms of SOD described in mammalian tissues: cytosolic copper-zinc SOD, mitochondrial manganese SOD, and the high molecular weight extracellular SOD. Eventually, this method can be used to quantify SOD activity in tissue sections by image analysis.
S
Different mechanisms protect cells from O2 −. and related radicals such as H2O2 and OH−. The most important one is the dismutation of O2 −. to H2O2 + O2 and the subsequent dismutation of H2O2 to O2 and H2O. The first reaction is catalyzed by superoxide dismutase (SOD), the second one by catalase.
In the nervous system, SOD activity is unbalanced during neuronal apoptosis (Troy and Shelanski 1994; Luetjens et al. 2000), cerebral ischemia (Murakami et al. 1998; Fujimura et al. 1999), and in a familiar form of amyotrophic lateral sclerosis (Deng et al. 1993; Rosen et al. 1993). As a consequence, SOD is considered to be a major factor in protection of the nervous tissue against excitotoxic and ischemic/hypoxic lesions (Nelson et al. 1992).
The localization and quantification of SOD activity in tissues is of great interest and can give information about the tissue responses to oxidative stresses. At present it is possible to localize and quantify the amount of SOD enzyme immunohistochemically by use of specific antibodies, but not its activity (Moreno et al. 1997).
Previous experience led to histochemical techniques able to localize SOD activity in situ, but these techniques could not be used to quantify the signal (Frederiks and Bosch 1997; Okabe et al. 1998). Therefore, we developed a new quantitative histochemical method to evaluate SOD activity in the rat CNS.
This method is based on riboflavin-UV as a source of O2 −. (Segura-Aguilar 1993; Okabe et al. 1998) and cerium capture method to reveal H2O2 production (Frederiks and Bosch 1997). In the presence of UV light, riboflavin reduces oxygen to superoxide radical (Beauchamp and Fridovich 1971). The resulting H2O2 produced by SOD reacts with cerium ions, giving rise to an insoluble reaction product (cerium per-hydroxide: Ce[OH]2OOH) (Briggs et al. 1975) which, in a second step, oxidizes diaminobenzidine (Angermuller and Fahimi 1988). The resulting brown product was quantitatively analyzed using a computer-assisted image analysis system to provide an estimate of SOD activity in situ. This histochemical method reveals the sum of the activities of the three different forms of SOD described in mammalian tissues: cytosolic copper–zinc SOD (Cu/Zn–SOD), mitochondrial manganese SOD (Mn–SOD), and the high molecular weight extracellular SOD (EC-SOD) (Weisiger and Fridovich 1973; Marklund 1982).
Materials and Methods
Animals
Twelve adult male Sprague–Dawley rats from our own colony (200–250 g body weight) were housed in groups of two on standard conditions with a 12-hr light–dark cycle (lights from 0700 to 1900) and kept on a laboratory diet and water ad lib. The animals were handled daily to reduce stress due to the manipulation. All other parameters fulfilled the requirements of the “Guide for the Care and Use of Laboratory Animals” by the National Research Council, implemented by EU and local rules.
Brain Removal, Freezing, and Sectioning
The animals were sacrificed by decapitation during the light phase of the cycle to minimize circadian variation. The brain was quickly removed and either directly frozen by immersion in 2-methylbutane cooled in dry ice or first homogenized on ice for 2–3 min (tissue standards) and then transferred into small tubes and frozen in dry ice. Frozen brains and brain pastes were then stored at −80C until sectioning with the cryostat. Cryostat sections (50 μm thick) were cut at −20C and mounted on precleaned glass slides (single frosted; Sigma, Milan, Italy).
Histochemical Staining Procedure
1. Fixation step. The sections were fixed in cold buffered 0.5% glutaraldehyde in 0.1 M, pH 7.4, PBS for 5 min, washed two times in 0.1 M phosphate buffer, pH 7.4, for 5 min each, and then in 0.1 M Tris buffer, pH 8.0, for 5 min.
2. Incubation step. Sections were incubated with a thin film of freshly prepared incubation medium [0.5 mM riboflavin + 10 mM cerium chloride (Sigma) + 0.5% Triton X-100 in Tris-HCl, pH 8] and irradiated under a UV lamp for 30 min.
3. Intensification step. After incubation, sections were rinsed in 100 mM Tris-HCl, pH 8.0, and incubated for 30 min in 1.4 mM 3,3'-diaminobenzidine (DAB; Sigma) + 100 mM NaN3 + 0.6 mM H2O2 in 100 mM Tris-HCl, pH 7.6.
After washing in PBS, sections were dehydrated in ethanol 85%, 95%, and 100% for 5 min each, cleared in xylene, and coverslipped with Permount.
Immunohistochemistry
Alternate sections were stained with the histochemical procedure as above or with immunohistochemistry for the Zn/Cu-SOD isoform as detailed here.
Sections were fixed for 5 min in formaldehyde 4% in PBS. After washing in PBS, sections were treated for 30 min with H2O2 0.3% in methanol, washed again in PBS, and incubated in mouse anti-SOD (Sigma) 1:400 in PBS + 10% normal bovine serum (NBS) overnight at 4C. After three washes in PBS, sections were incubated in biotinilated anti-mouse antibody (Vector; Burlingame, CA) 1:100 + 10% NBS in PBS for 1 hr at room temperature (RT). Sections were then washed three times in PBS and then incubated with ABC (Vector) for 1 hr according to the supplier's instructions. After three washes in PBS, the signal was visualized with 0.1% DAB + 0.02% H2O2 in PBS for 10 min in the dark at RT. The reaction was then stopped with cold PBS, the sections dehydrated in alcohol, cleared in xylene, and coverslipped with Permount.
Control Experiments
The following variables were changed during the histochemical staining of sections of tissue standards to test the specificity and the optimal conditions for SOD histochemistry.
Fixation. Sections were stained without fixation in glutaraldehyde.
UV Irradiation. To reduce the formation of superoxide, sections were not exposed to UV irradiation during the incubation with riboflavin.
DAB. The intensification step with DAB was omitted to evaluate the intensity of the signal deriving from cerium ions.
Diethyldithiocarbamate. Superoxide dismutase activity was inhibited adding 10 mM diethyldithiocarbamate (Carlo Erba; Milan, Italy) in the first incubation medium (Frederiks and Bosch 1997).
Methodological Validation of SOD Histochemistry
To validate the histochemical assay as a quantitative tool, the relationship between time of incubation, section thickness, and the densitometrically measured reaction product was studied to fulfill general quantitative methodological requirements detailed by Stoward (1980). The relationship between section thickness and optical density (OD) was analyzed using tissue sections of increasing thickness (25, 50, 75, and 100 μm) and the standard staining procedure.
The relationship between time of incubation and OD was analyzed using 50-μm-thick tissue sections incubated at increasing times during the first step of UV exposure (0, 0.5, 1, 2, 5, 10, 15, and 30 min).
Image Analysis
Brain sections and tissue standards were analyzed at low magnification (obj. X0.5) with a Zeiss Axioskop 20 equipped with high-resolution analogic monochrome camera Hamamatsu C5405. Images were digitized (box size 1024 × 1024; pixel size 1.5 μm) using an MCID-2 board and analyzed with AIS imaging (Imaging Research; St. Catherines, Ontario, Canada). The regions of interest were outlined and the relative optical density [ROD = log (256/gray level)] calculated. The background ROD (unstained tissue) was also calculated. All data were then reported after subtraction of background OD to get an absolute scale (0 OD = unstained tissue).
The light intensity (Köler illumination) was adjusted to avoid saturation in blank fields and in the regions of interest. A blue filter (λ = 440 ± 10 nm) was used to filter out green and red visible light. Light stability was checked over time using the illuminator device of an MCID system. Neutral glasses of defined transmission were used to calibrate the system and check the densitometric linearity.
The camera gain was set to 0 to minimize noise. Slices were always in focus during measurement and each image was averaged over 16 digitized images. Four different measurements were taken on each standard section and four different standard sections were used for each time/section thickness point: therefore, 16 measurements were obtained for each standard.
A blank field was digitized before every session for shading correction. All other parameters were adjusted according to the guidelines in Hardie et al. (2002), Jonker et al. (1997), and Böcking et al. (1997).
Statistics
Each measurement was repeated four to ten times on different sections. Measurements were statistically analyzed calculating the regression coefficient for thickness-OD and time of incubation–OD relationships, or testing different conditions in control experiments by ANOVA and planned comparisons with Student's t-test for non-paired data. All data in the graphs have been reported as mean ± SE.
Results
Histochemical Staining Procedure
The three-step histochemical procedure described here is easy to perform and gives reproducible results. Moreover, the use of standards allows comparison of experiments executed at different times.
This technique requires a first step in glutaraldehyde to preserve morphological details and to fix SOD activity in situ. After the fixation, repeated washes of the tissue sections in PBS before the incubation step effectively remove red blood cells that could interfere during the intensification step with DAB.
Sections are then incubated in a solution containing an O2 −. -producing system (riboflavin–UV) and a capture system for H2O2 (cerium). Oxidized riboflavin is reduced under UV irradiation and then undergoes autoxidation to release superoxide radicals (Segura-Aguilar 1993). These are highly reactive and diffusible species and, in turn, are locally dismutated in H2O2 by SOD in brain sections. H2O2 reacts locally with cerium ions, giving rise to an insoluble product (Frederiks and Bosch 1997). Eventually, the reaction is intensified by DAB, which is oxidized in presence of H2O2 and oxidized cerium, giving rise to an insoluble brown product (Frederiks and Bosch 1997). Sodium azide was added to prevent peroxidase-dependent DAB oxidation (Angermuller and Fahimi 1988).
The morphological details of the neurons, due to the prevalent localization of the enzyme in the soma, are very good (Figure 1). SOD activity is localized mainly in neuronal soma, whereas the neuropil is less reactive (Figure 1). The staining is more evident in the neuronal cytoplasm than in the nucleus (Figure 1). Myelin and white matter appear unstained (Figure 2).
Positive neurons are widespread in the nervous system, across different regions and different neuronal types in the same region. However, some neurons are more intensely stained than others. For example, pyramidal cells of the hippocampus, granule cells in the cerebellum, deep cerebellar nuclei, and some neuronal subsets in the reticular nuclei of the brainstem neurons showed the highest intensity (Figures 2 and 3). Endothelial and ependymal cells, and cells of choroid plexus, are also intensely stained. White matter was generally unstained.
Immunohistochemistry
Alternate sections treated with the histochemical reaction (SOD activity) or immunostained for SOD protein displayed the same staining pattern (Figure 3). The immunohistochemical localization of the cytoplasmic SOD isoenzyme shows a higher definition of cell contours, whereas the histochemical SOD reaction shows some signal also in the neuropil, possibly due to the identification of the extracellular SOD isoenzymes (see also Frederiks and Bosch 1997).
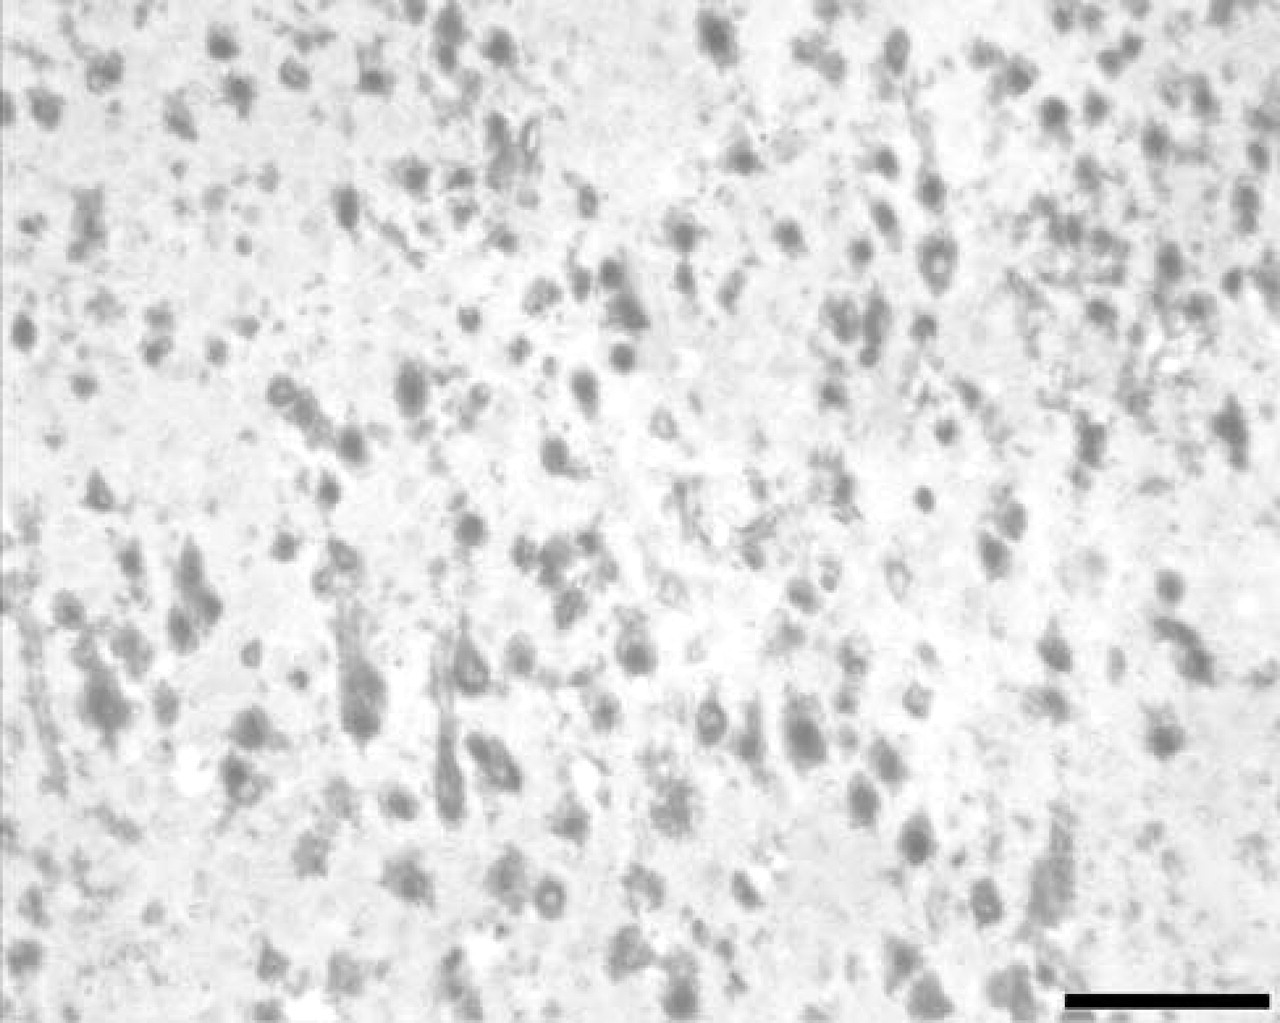
SOD histochemistry in rat cerebral cortex. Note intense staining of pyramidal and granular cells. The neuropil is less intensely stained and the nuclei appear unstained. Bar = 100 μm.
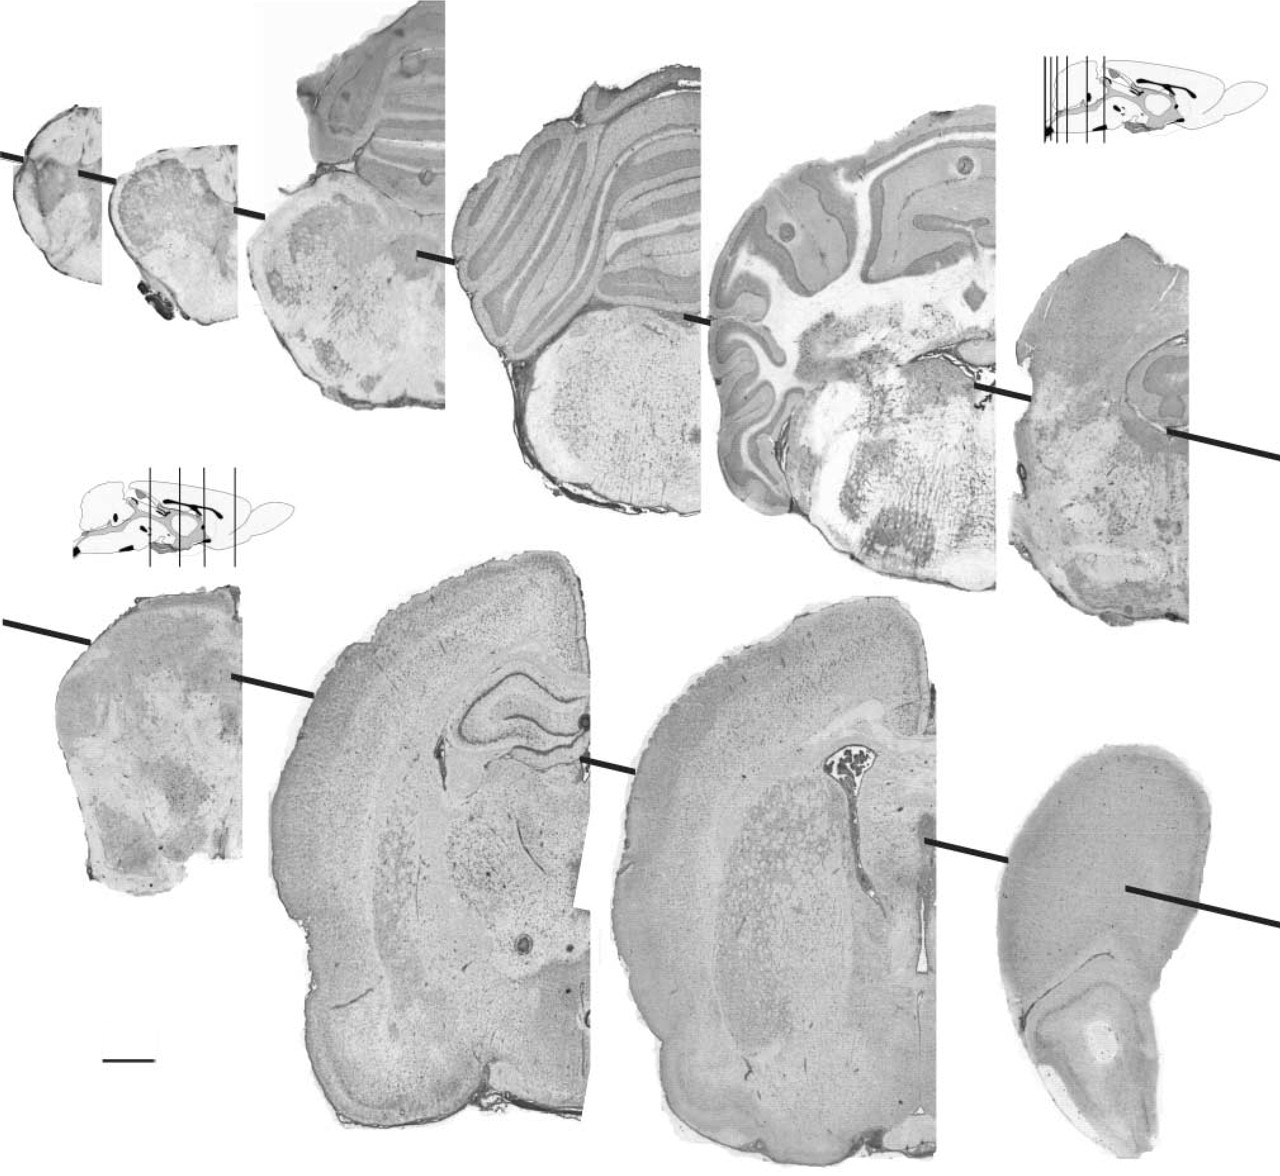
SOD histochemistry at different levels of the rat brain (coronal sections). The activity appears to be widely expressed in the gray matter, the white matter being unstained. Some regions are more densely stained, such as the choroid plexuses, pyramidal cells of the hippocampus, granule cells in the cerebellum, deep cerebellar nuclei, and some nuclei in the brainstem.
Specificity and Optimal Conditions of the Histochemical Reaction
A balance is needed between optimal enzyme activity and good tissue preservation, because a totally unfixed brain shows several artifacts and is poorly stained (control = 0.0969 ± 0.008 OD; no fixation = 0.0169 ± 0.008 OD; t-test p<0.05; Figure 4) due to the loss of SOD enzyme in the reaction buffer. The best conditions were no perfusion-fixation and post-fixation on slides for 5 min with 0.5% glutaraldehyde.
The reaction product was significantly reduced without UV irradiation in the incubation step, although residual staining persisted in both paste standards and brain sections (control = 0.0969 ± 0.008 OD; no UV = 0.0437 ± 0.004 OD; t-test p<0.05; Figure 4). The absence of the intensification step resulted in a significant decrease of the reaction product (control = 0.0969 ± 0.008 OD; no DAB = 0.0290 ± 0.003 OD; p<0.05, Figure 4).
Superoxide dismutase inhibitors such as diethyldithiocarbamate (DTC) significantly inhibited the signal (control = 0.0969 ± 0.008 OD; DTC = 0.02 ± 0.006 OD; p<0.05).
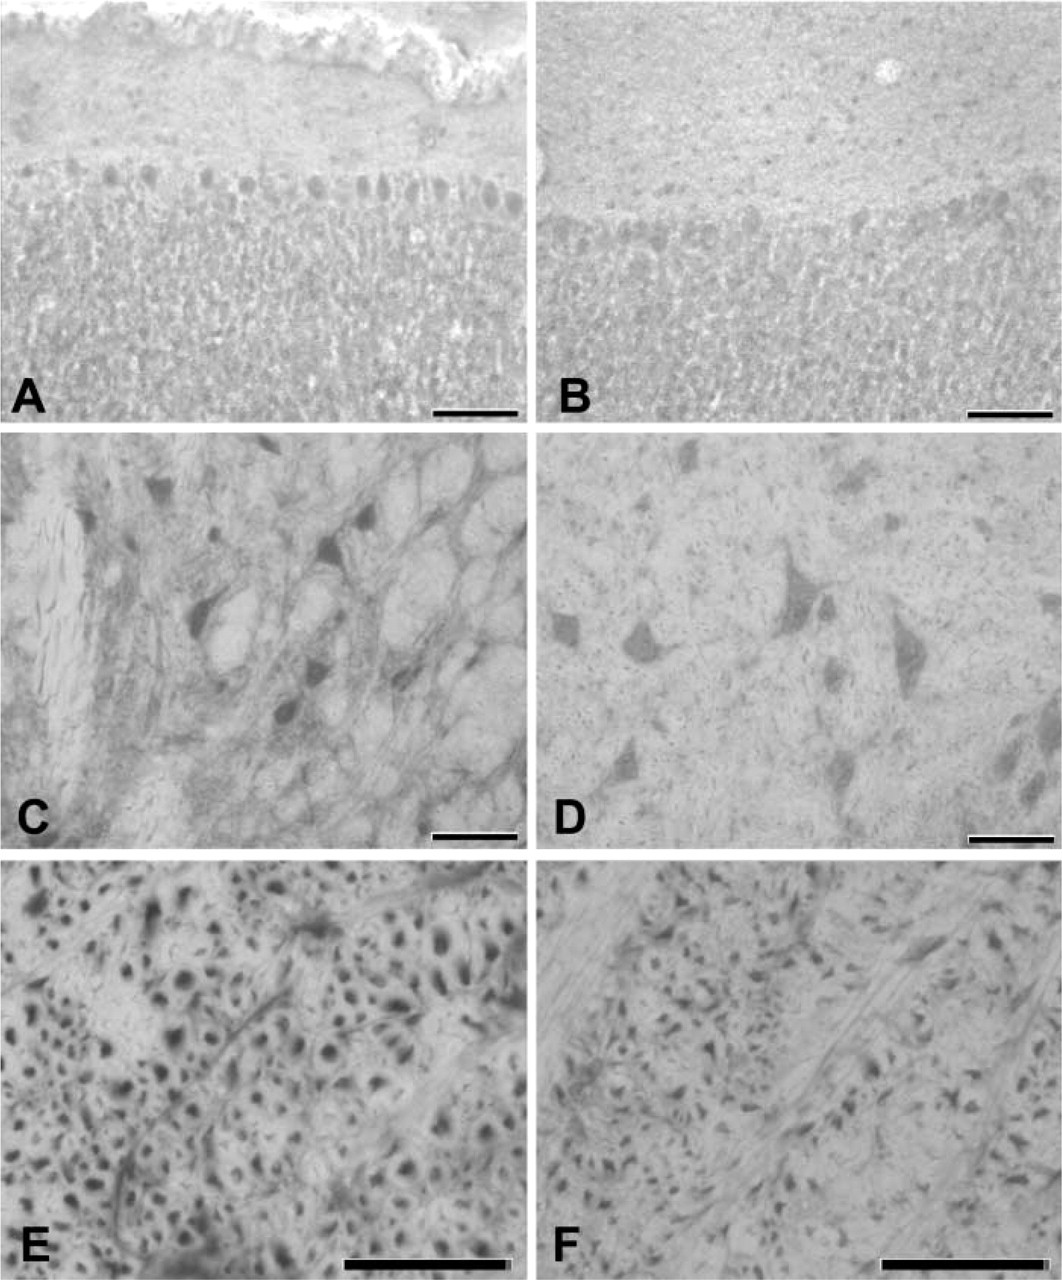
Comparison between SOD immunohistochemistry (left) and histochemistry (right) in the cerebellar cortex (
Methodological Validation
As shown in Figure 4, there is a high correlation between section thickness and OD (r=0.98; p≪0.05) and between time of incubation and OD (r=0.935; p≪0.05).
Discussion
A great deal of work in the literature is based on the immunolocalization of SOD enzyme, a few papers focusing on the localization of SOD activity in tissue sections.
Previous work by Frederiks and Bosch (1997) demonstrated SOD activity using the hypoxanthine–xanthine oxidase system to produce O2 −. The final reaction product was then visualized using the cerium capture method. Unfortunately, the originally described xanthine–hypoxanthine method (Frederiks and Bosch 1997; Ukeda et al. 1997) required a very dense solution so that the sections were severely damaged during the histochemical procedure. Moreover, an aspecific signal was always present outside the section, making this technique not useful for quantitative purposes.
Another histochemical technique was based on blotting the tissue sections on a filter and then staining the filter using the principle of inhibition of autoxidation of nitroblue tetrazolium in the presence of SOD (Okabe et al. 1998). Unfortunately the blot itself does not allow display of the morphological details.
The present study shows that SOD activity can be determined and quantified by autoxidation of riboflavin in the presence of UV light as the source of substrate (superoxide radicals) for SOD activity (Traber et al. 1982). One product of this enzymatic activity, H2O2, reacts with cerium ions, giving rise to insoluble cerium perhydroxide that is visualized by the brown reaction product formed by oxidized 3,3'-diaminobenzidine. Using OD analysis, it is then possible to quantify this product and therefore SOD activity.
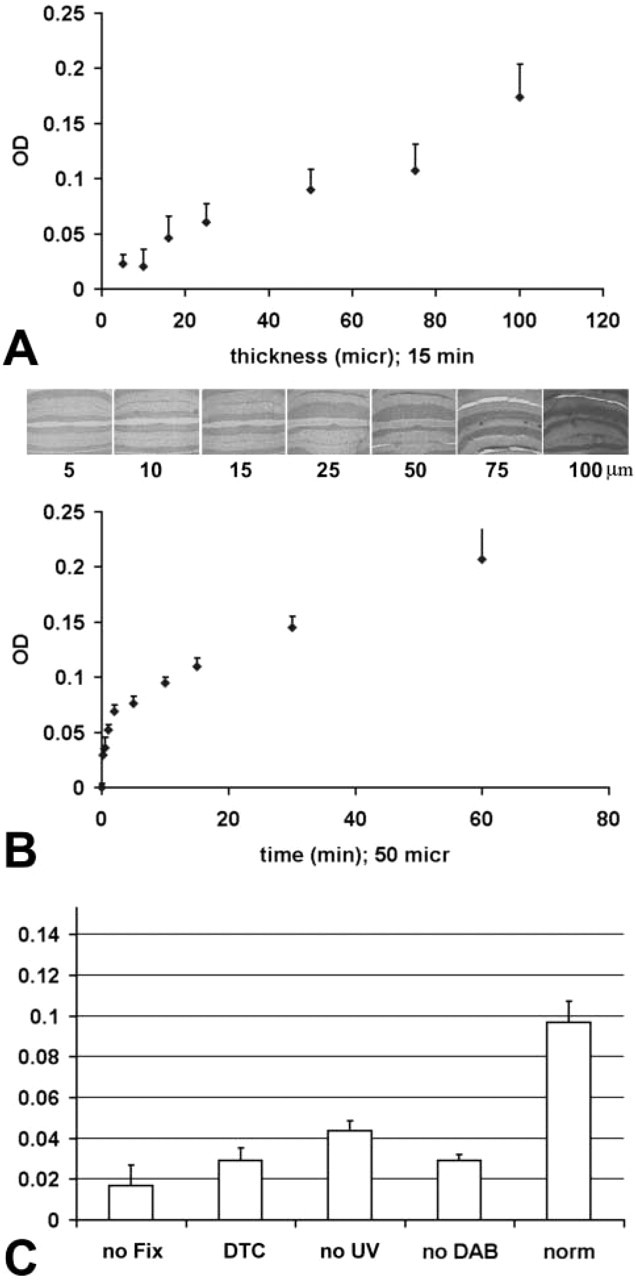
Effect of section thickness (
The advantage of the technique reported here is the possibility of visualizing SOD activity with high resolution and of quantifying the reaction product. Our technique showed high SOD activity in hippocampal pyramidal and granular cells and in the granular layer of cerebellum, in agreement with previous data (Moreno et al. 1997; Okabe et al. 1998). The specificity of this new method has been established by the use of diethyldithiocarbamate, a specific SOD inhibitor.
It is interesting to note that without UV irradiation (therefore without an external source of superoxide anions) there is weak residual staining in both paste standards and brain sections, possibly due to ROS production in the section (Wentworth et al. 2001) or to lipid hydroperoxides that might react with cerium ions (Halliwell and Chirico 1993).
The optical density (OD) of the sections was highly correlated with the duration of incubation time and the section thickness, fulfilling general quantitative methodological requirements detailed by Stoward (1980): (a) there must be a way to subtract non-specific staining (background subtraction); (b) the change in OD must be linear with the incubation period and with (c) tissue section thickness.
However, because cerium ions have a low degree of penetration, detergents (Triton X-100 in our case; Robinson 1985) must be used to obtain fully linear results also for thicker sections (see also Van Noorden and Frederiks 1993 for alternative methods to allow cerium ions to penetrate).
Some differences between SOD histochemistry and immunohistochemistry, particularly from a quantitative point of view, may depend on the activity of different forms of SOD enzymes (Cu/Zn–SOD, Mn–SOD, and extracellular SOD) with the histochemical method, whereas immunolocalization allows the determination of one type of SOD isoform due to the specificity of the antibody (see also Okabe et al. 1998 for a discussion of the similarity between the histochemical and immunohistochemical techniques).
Moreover, the histochemical method could be sensitive to the enzymatic activity/inactivity of SOD in the section, modulated by oxidative substances (Jewett et al. 1989). It is therefore possible that the ratio of active SOD to inactive SOD results in a quantitatively different signal using SOD immunolocalization and SOD histochemistry.
Footnotes
Acknowledgements
We are grateful to anonymous referees for useful comments.