
Abstract
Thymic nurse cells (TNC) and T-cell stromal rosettes (ROS) are two in vivo models for stromal cell–thymocyte interactions. We describe a simplified enrichment method for TNC and ROS that overcomes the necessity for large amounts of tissue. The complexes were further analyzed with confocal microscopy, and three subunits of ROS were defined on the basis of their central cell phenotype, i.e., macrophage, dendritic, or epithelial cell rosettes. Because adhesion molecules are proposed to play a crucial role in T-cell development, we investigated CD44, LFA-1, and ICAM-1 expression in such complexes. The epithelial component of TNC expresses CD44 and ICAM-1, whereas intra-TNC thymocytes are LFA-negative. With regard to ROS, all subsets expressed CD44, and macrophage and dendritic cell ROS were also ICAM-1-positive and LFA-1-positive. The current protocol opens the possibility for further in vivo analysis of stromal cell–thymocyte interactions, e.g., for studies of scarce gene mutant mice.
I
Two in vivo models for such stromal cell–thymocyte interactions are the thymic nurse cells (TNC) and thymocyte stromal cell rosettes (ROS). TNC are cortical multicellular complexes composed of intra-TNC thymocytes (TNC-T) enclosed within epithelial cell vacuoles (Wekerle et al. 1980; Wick et al. 1991). ROS are characterized by thymocytes bound to a central stromal cell (Kyewski et al. 1982). We have previously reported in functional studies that TNC are a site for positive selection and maturation of T-cells (Wick and Oberhuber 1986; Penninger et al. 1990,1994; Penninger and Wick 1992; Ricker et al. 1995).
During their intrathymic journey, thymocytes rely on adhesion molecules and receptors for extracellular matrix proteins as important driving force (Lannes–Vieira et al. 1991; Savino et al. 1993). It is reasonable to assume that some of these molecules might also play a role in TNC and ROS formation in vivo.
A main limitation of current enrichment methods for studying such thymic cellular complexes is the large amounts of tissue needed. In this report we describe a simplified enrichment method for TNC and ROS that allows experiments with small amounts of tissue (e.g., two thymuses). In addition to quantification, the phenotype of the heterotypic cellular complexes can be studied. Therefore, using confocal scanning microscopy, we divided ROS into three subsets on the basis of their central cell phenotypes: macrophages (MØ-ROS), dendritic (DC-ROS), or epithelial cell (Ep-ROS) rosettes. Furthermore, TNC and ROS expression of CD44, LFA-1, and ICAM-1 adhesion molecules was investigated.
Materials and Methods
Mice
Four- to 6-week-old female C57BL/6 mice were obtained from the Central Laboratory Animal Facility, University of Innsbruck, Medical School. They were maintained at a 12-hr light–dark cycle with food and water ad libitum.
Enrichment of TNC and ROS
Using a modification of a method previously described by Kyewski et al. (1982), TNC and ROS were separately enriched from two pooled thymuses. The thymic lobes had their capsules gently cut and were washed twice with medium RPMI 1640 under slight magnetic stirring for 30 min at 4C. Then the thymic tissue was digested four times with collagenase (collagenase IV, 100 U/ml in RPMI medium, supplemented with 2% fetal calf serum) (Sigma, Diesenhofen, Germany) at 15-min intervals at increasing temperatures (25, 27, 30, and 37C) and under slight magnetic stirring. The digestion-derived cell suspensions were pooled and are here called ROS suspensions. The remaining tissue was digested four times with dispase–collagenase [collagenase IV (Sigma) 100 U/ml in RPMI medium; dispase grade I (Boehringer Mannheim, Mannheim, Germany) 2 U/ml; DNAse (Boehringer Mannheim) 10 U/ml; aprotinin (Sigma) 12 TUI/ml, supplemented with 2% fetal calf serum] at 15-min intervals at 37C and under agitation. This dispase–collagenase treatment yielded a TNC-enriched suspension. Both ROS and TNC suspensions were filtered to remove remaining tissue debris and washed with RPMI. After centrifugation for 7 min at 100 × g and 4C, ROS and TNC were resuspended in a volume up to 4 ml with RPMI and PBS/EDTA (20 mM, pH 7.4), respectively. TNC and ROS were then further enriched by sedimentation on fetal calf serum for 1 hr at 1 × g (2 ml cell suspension on 12 ml of fetal calf serum). After washing, cell suspensions were counted, placed on glass slides, air-dried, and stored at −80C for later analysis. TNC and ROS counts were normalized per mg thymus weight.
Immunostaining
For phenotyping of TNC and ROS, we used double staining immunofluorescence. Primary and secondary antibodies were diluted in PBS with 1% bovine serum albumin and 10% normal mouse serum, and each labeling step lasted 30 min at room temperature (RT). The TNC epithelial component (Ep-TNC) was identified with rabbit polyclonal anti-human pan-keratin (Dako; Glostrup, Denmark), and TNC and TNC-T nuclei were stained with propidium iodide. ROS central cells were labeled with the rat monoclonal antibody (MAb) F4/80 anti-MØ (Hume et al. 1983), hamster MAb M342 anti-DC (Agger et al. 1992), or the anti-keratin polyclonal. Expression of adhesion molecules CD44, LFA-1, and ICAM-1 was visualized with FITC-conjugated rat MAb anti-CD44 (clone IM7), anti-LFA-1 (clone M17/4), and anti-ICAM-1 (Pharmingen; San Diego, CA). As secondary antibodies, we used TRITC-conjugated swine anti-rabbit Ig, FITC-conjugated swine anti-rabbit Ig (Dako), TRITC-conjugated F(ab')2 fragment rabbit anti-rat IgG, and biotin-conjugated F(ab')2 fragment rabbit anti-hamster IgG (Jackson Immunoresearch; West Grove, PA) combined with Cy-Chrome–streptavidin (Pharmingen).
To quantify ROS subsets, we used an immunocytochemical double staining technique. Primary and secondary antibodies were diluted in buffer (Tris 0.01 M, NaCl 0.15 M) containing 1% bovine serum albumin and 10% normal mouse serum. Each sample was preincubated in an NaN3–H2O2 solution for 30 min to block endogenous peroxidase activity, and each labeling step lasted for 30 min at RT. As secondary antibodies, we used horseradish peroxidase-conjugated rabbit anti-rat Ig (Dako), alkaline phosphatase-conjugated F(ab')2 fragment donkey anti-rabbit IgG, biotin-conjugated F(ab')2 fragment rabbit anti-hamster IgG (Jackson Immunoresearch), and alkaline phosphatase-conjugated streptavidin (Boehringer Mannheim). For detection, Fast DAB with metal enhancer and Fast Red enzyme substrate were used, respectively (Sigma; St Louis, MO). In all immunostaining experiments, nonimmune species-matched Ig or serum was used as negative control for each primary antibody. Optimal dilution of all primary antibodies and visualization reagents was determined in pilot studies.
Microscopic Analysis
Immunoenzymatic staining of ROS was analyzed by light microscopy. Immunofluorescence-stained samples were analyzed with an LSM 10 confocal laser scanning microscope (Zeiss; Oberkochen, Germany). Digital images of fluorescence were acquired in response to excitation with a helium neon laser (543 nm), filter setting BP 575–640, for cells stained with TRITC or Cy-Chrome, and an argon laser (488 nm), filter setting BP 530/30 or LP 520, for FITC-stained cells. Images were collected at a scan rate of 8 sec. Digital images were transferred to a high-resolution RGB color video photomonitor (Lucius and Baer; Geretsried, Germany) and were photographed with Fujicolor Super HG 200 film.
Results and Discussion
This simplified enrichment method, modified from a protocol described by Kyewski et al. (1982), yielded an average of 830 TNC and 550 ROS per mg of thymus (Figure 1). TNC and ROS formation have been investigated in vitro with regard to thymocytes phenotype and potential involvement of adhesion molecules (Rouby et al. 1985; Wood et al. 1988; Li et al. 1992; Villa–Verde et al. 1994). Using only two thymuses per assay, the present method allows studies for thymic heterotypic cell–cell interaction in vivo with scarce mutant mice or after expensive experimental manipulations and leads to a significant reduction of the number of experimental animals in general.
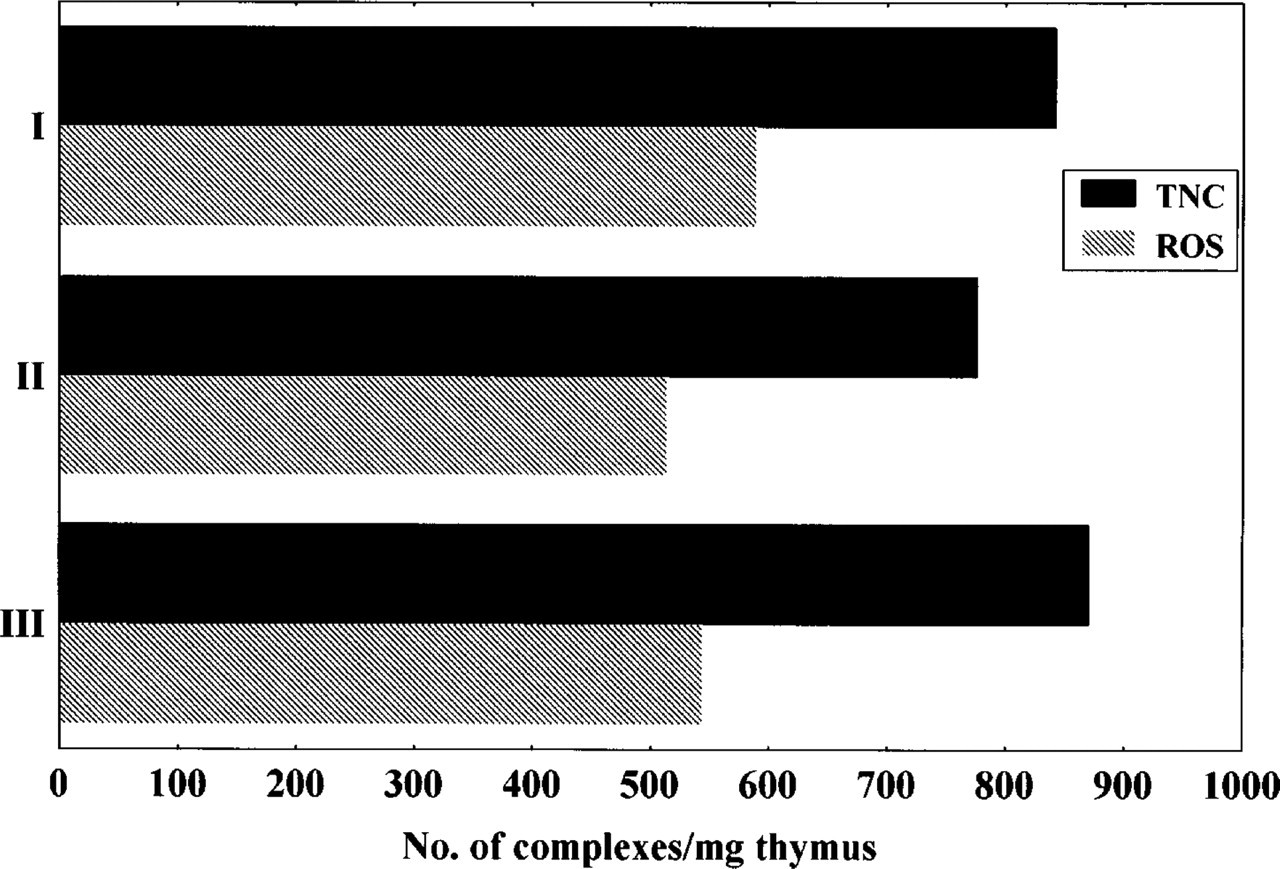
Murine TNC and ROS counts. Results from three independent experiments are shown.
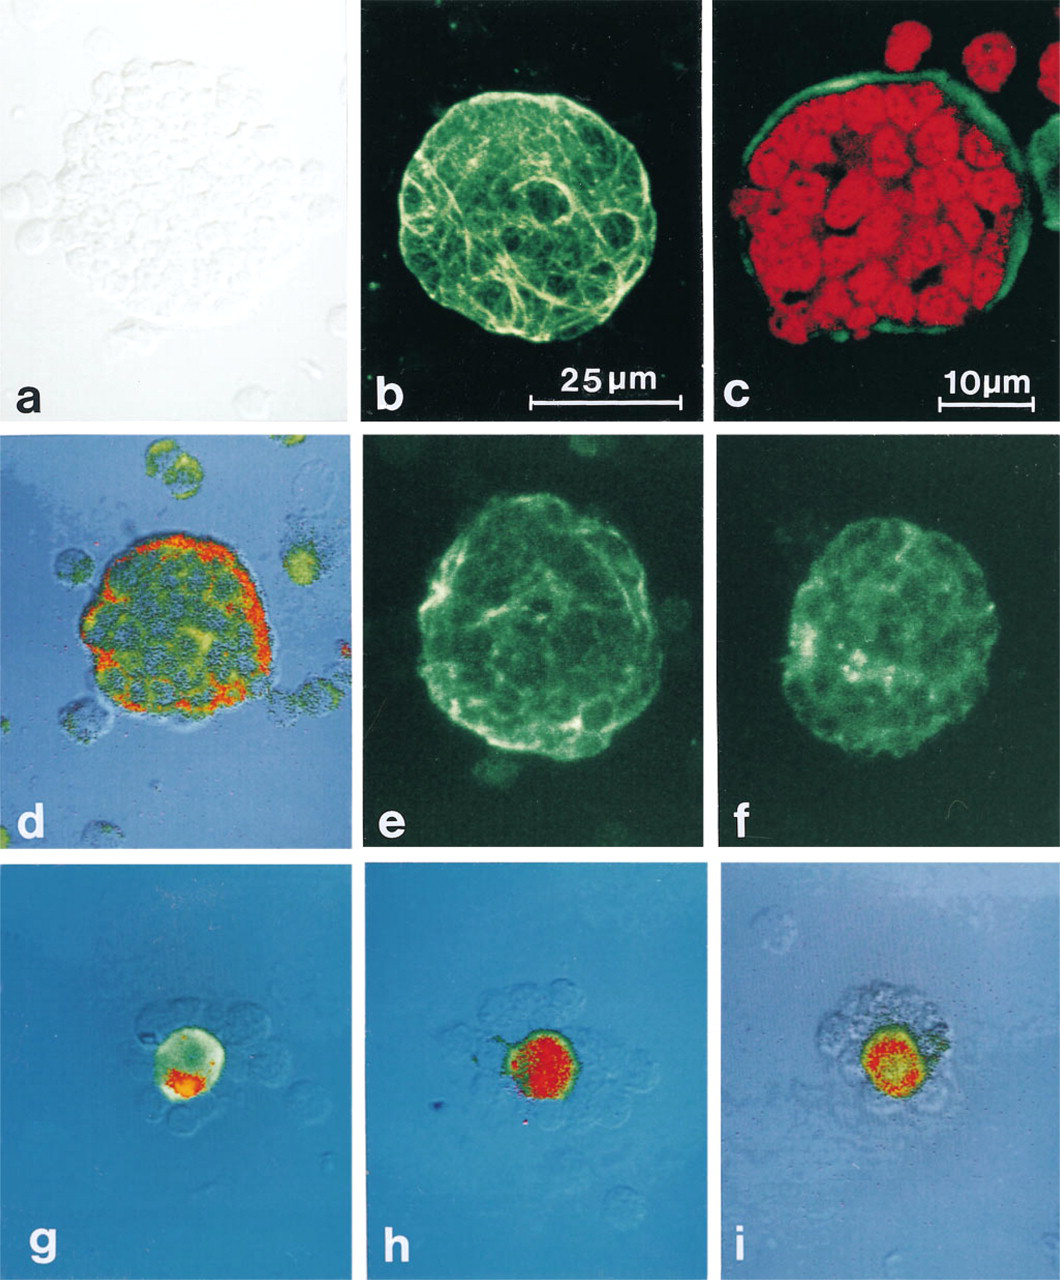
Confocal scanning microscopy analysis of murine TNC and ROS. (
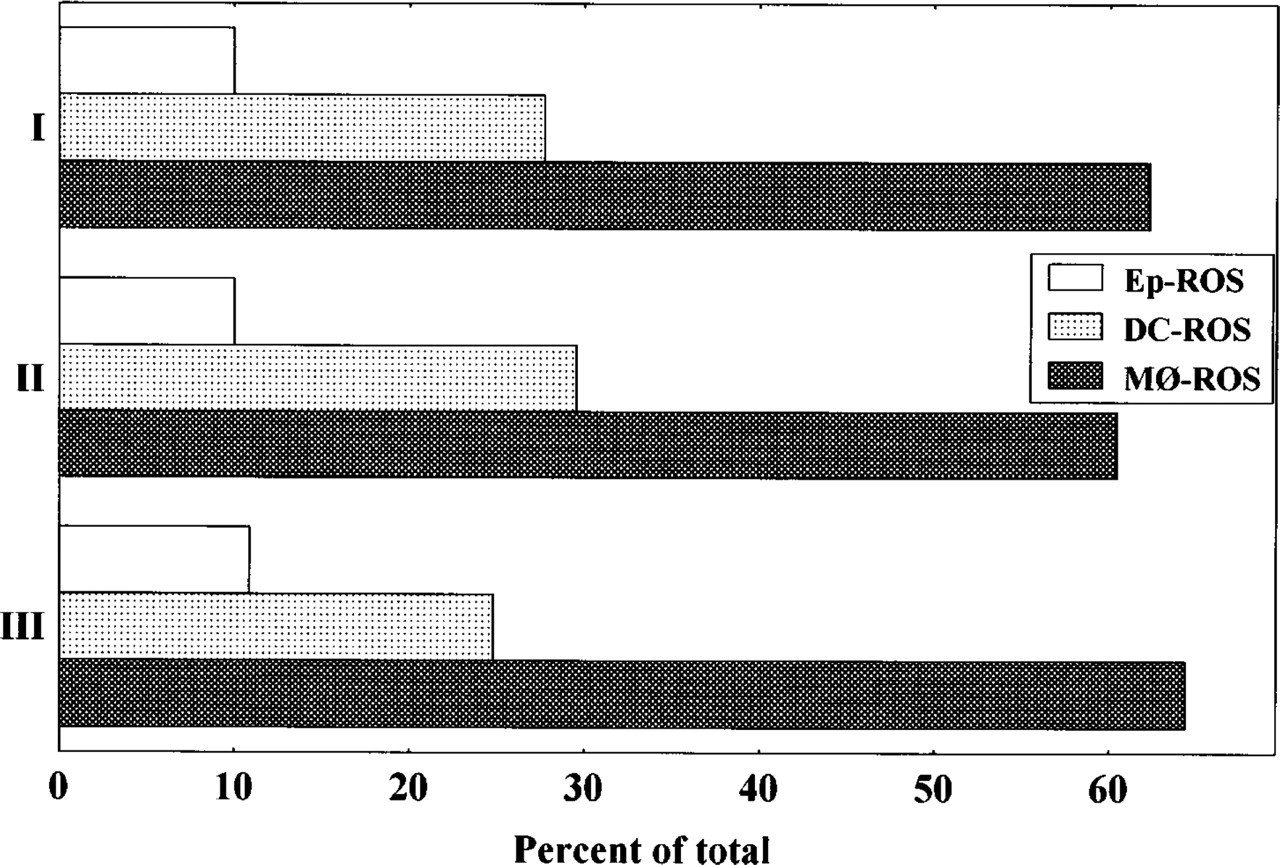
ROS subsets in murine thymus. Results from three independent experiments are shown. Samples were analyzed by immunoenzymatic assays and a minimum of 200 ROS were counted per slide.
Phenotype studies of multicellular complexes require multiple markers and good morphological definition. That is especially true for TNC with their three-dimensional structure and up to 200 thymocytes enclosed within individual vacuoles (Figure 2a). Therefore, we analyzed TNC and ROS obtained with this simplified method using confocal laser scanning microscopy. The Ep-TNC can be identified by its cytokeratin expression, which builds up a cytoplasmic network (Figure 2b). Furthermore, TNC-T can have their nuclei visualized by DNA markers, like propidium iodide (Figure 2c), or can be identified by membrane markers, e.g., CD3 (Figure 2d). With regard to adhesion molecule expression, Ep-TNC are positive for CD44 (Figure 2e). Interestingly, the large majority of TNC express ICAM-1 (Figure 2f), whereas TNC-T appear to be LFA-1-negative. Thymocytes are mainly LFA-1-positive, and it has been shown that LFA-1/ICAM-1 interaction mediates thymocyte–thymic epithelial cell binding in vitro (Nonoyama et al. 1989; Singer et al. 1990). It is possible that ICAM-1 binds other ligands in TNC complexes yet to be identified. Alternatively, TNC-T could downregulate LFA-1 expression once enclosed in the Ep-TNC vacuoles.
ROS were grouped into three subsets on the basis of their stromal components. A quantitative analysis using immunocytochemically stained samples showed a majority of MØ-ROS (63%), together with 27% of DC-ROS and 10% of Ep-ROS (Figure 3). All ROS subsets show CD44-positive stromal cells (Figures 2g-2i), and MØ- and DC-ROS also express LFA-1 and ICAM1 (data no shown), suggesting that these adhesion molecule can be involved in the formation of such complexes.
In conclusion, this simplified method for TNC and ROS enrichment, combined with subtyping of ROS complexes, will allow further investigation into the role of such complexes in T-cell development. Our group is currently addressing the question of when TNC and ROS are formed during T-cell development and which adhesion molecules are involved, using a gene-targeted mouse with different blocks in T-cell differentiation and adhesion molecule expression.
Footnotes
Acknowledgements
Supported by the Austrian Research Council (grant no. 10654) and by the EU Human Capital Mobility Program (contract no. CHRXCT 930246) (to GW).