
Abstract
Phosphate-activated glutaminase (PAG) converts glutamine to glutamate as part of the glutaminolysis pathway in mitochondria. Two genes, GLS1 and GLS2, which encode for kidney-type PAG and liver-type PAG, respectively, differ in their tissue-specific activities and kinetics. Tissue-specific PAG activity and its kinetics were determined by metabolic mapping using a tetrazolium salt and glutamate dehydrogenase as an auxiliary enzyme in the presence of various glutamine concentrations. In kidney and brain, PAG showed Michaelis-Menten kinetics with a Km of 0.6 mM glutamine and a Vmax of 1.1 µmol/mL/min when using 5 mM glutamine. PAG activity was high in the kidney cortex and inner medulla but low in the outer medulla, papillary tip, glomeruli and the lis of Henle. In brain tissue sections, PAG was active in the grey matter and inactive in myelin-rich regions. Liver PAG showed allosteric regulation with a Km of 11.6 mM glutamine and a Vmax of 0.5 µmol/mL/min when using 20 mM glutamine. The specificity of the method was shown after incubation of brain tissue sections with the PAG inhibitor 6-diazo-5-oxo-L-norleucine. PAG activity was decreased to 22% in the presence of 2 mM 6-diazo-5-oxo-L-norleucine. At low glutamine concentrations, PAG activity was higher in periportal regions, indicating a lower Km for periportal PAG. When compared with liver, kidney and brain, other tissues showed 3-fold to 6-fold less PAG activity. In conclusion, PAG is mainly active in mouse kidney, brain and liver, and shows different kinetics depending on which type of PAG is expressed.
Introduction
Phosphate-activated glutaminase (PAG, EC 3.5.1.2) catalyzes the conversion of glutamine to glutamate as is shown in Fig. 1 (Curthoys 1995; Botman et al. In Press). PAG is considered to be a mitochondrial enzyme, although PAG activity has also been found in nuclei (Campos-Sandoval et al. 2007; Olalla et al. 2002). The conversion of glutamine to glutamate by PAG is the first step in glutaminolysis (Plaitakis et al. 2011; Mastorodemos et al. 2009, 2005). The second step is the conversion of glutamate to α-ketoglutarate (α-KG) by glutamate dehydrogenase (GDH). Glutaminolysis has emerged as a potential therapeutic target in brain tumors (van Lith et al. 2014; van Lith et al. In Press; Mohrenz et al. 2013; Seltzer et al. 2010). In particular, secondary glioblastoma, which possesses an isocitrate dehydrogenase (IDH) 1 or 2 mutation (Balss et al. 2008; Parsons et al. 2008; Ichimura et al. 2009; Nobusawa et al. 2009; Sanson et al. 2009; Yan et al. 2009; Bleeker et al. 2010, 2008), is considered to be sensitive to glutaminolysis inhibition because its product, α-KG, is the substrate for mutated IDH1 and IDH2. To enable metabolic mapping of glutaminolysis, we developed and optimized methods for the metabolic mapping of GDH (Botman et al. In Press) and PAG; the latter is described here.
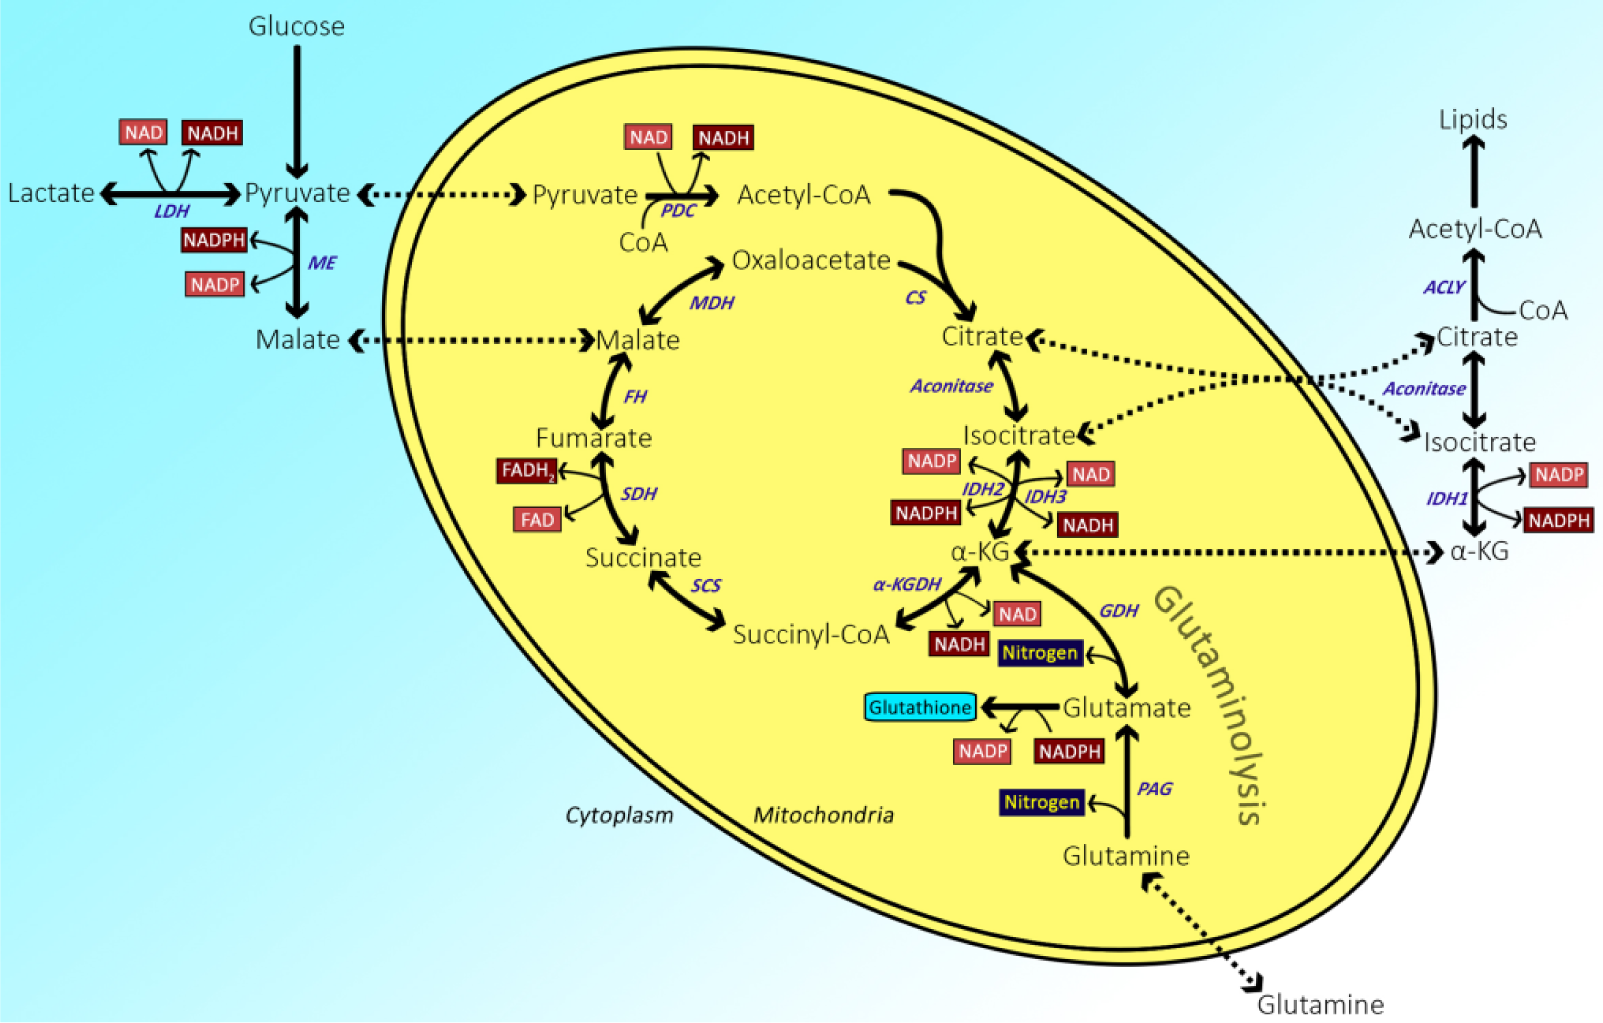
Cellular carbohydrate metabolism. Abbreviations: ACLY, ATP citrate lyase; α-KG, α-ketoglutarate; α-KGDH, α-ketoglutarate dehydrogenase; CS, citrate synthase; FH, fumarate hydratase; GDH, glutamate dehydrogenase; IDH, isocitrate dehydrogenase; LDH, lactate dehydrogenase; MDH, malate dehydrogenase; ME, malic enzyme; PAG, phosphate-activated glutaminase; PDC, pyruvate dehydrogenase complex; SCS, succinyl coenzyme A synthetase; SDH, succinate dehydrogenase. (Reproduced from Botman et al. In Press in this issue).
Glutaminolysis is involved in a number of cellular processes. α-KG derived from glutamine can be used in the tricarboxylic acid (TCA) cycle, a process referred to as anaplerosis (DeBerardinis et al. 2008, 2007; Reitzer et al. 1979). Anaplerosis can raise ATP production by oxidation. α-KG can also be converted by wild-type IDH1 or IDH2 and aconitase to citrate and subsequently to acetyl coenzyme A (AcCoA) for lipid biosynthesis (Brose et al. 2013; Filipp et al. 2012; Metallo et al. 2012; Mullen et al. 2011; Collins et al. 2011; DeBerardinis et al. 2007). Glutamine can be converted to pyruvate and subsequently to malate along with the concomitant generation of NADPH, which can be used for cellular stress protection and lipid biosynthesis (Wise et al. 2008; DeBerardinis et al. 2007; Koehler and Van Noorden 2003). Glutamate produced by PAG is also a precursor of glutathione (Xiang et al. 2013; Shoshan 2013; Daye and Wellen 2012; Romero-Garcia et al. 2011; Rajagopalan and DeBerardinis 2011; DeBerardinis et al. 2007; Amores-Sánchez and Medina 1999). NH3+ derived from glutamine conversion serves as a nitrogen source for the synthesis of nucleotides and proteins (Zhao et al. 2013; Daye and Wellen 2012; Romero-Garcia et al. 2011; Israël and Schwartz 2011; Rajagopalan and DeBerardinis 2011; Dang 2010; Meng et al. 2010; Matés et al. 2009; Wise et al. 2008; DeBerardinis et al. 2007; Labow and Souba 2000). Therefore, PAG is important for cell proliferation and thus for cancer cells (Wang et al. 2011; Meng et al. 2010; Wise et al. 2008; DeBerardinis et al. 2007). Moreover, NH3+ can be used to raise the intracellular pH levels, which are generally low in cancer cells (Huang et al. 2013). Finally, hepatic PAG produces the majority of NH3+ for carbamoyl phosphate production, which is used for urea formation (Brosnan and Brosnan 2002; Nissim et al. 1992).
Two PAG genes encoding four forms of PAG have been characterized in humans. GLS1 encodes two isoforms of kidney-type PAG: kidney-PAG (K-PAG) and glutaminase C (GAC). In the present study, K-PAG activity is considered to be representative of the activities of both K-PAG and GAC. GLS1 is expressed in kidney, brain, heart, placenta, lung and pancreas (Turner and McGivan 2003; Porter et al. 2002; Aledo et al. 2000; Elgadi et al. 1999). GLS2 encodes two isoforms of liver-type glutaminase: liver-PAG (L-PAG) and PAG-B (GAB), which are mainly expressed in the liver (Martín-Rufián et al. 2012; de la Rosa et al. 2009; Aledo et al. 2000; Gómez-Fabre et al. 2000). In the present study, the activities of L-PAG and GAB are referred to as L-PAG activity. K-PAG has a low Km for glutamine (2–5 mM), whereas the Vmax has not been reported. L-PAG has a high Km for glutamine (17 mM) and a Vmax of 0.80 µmol/mL/min (DeBerardinis et al. 2008; Curthoys 1995; McGivan et al. 1985; Snodgrass and Lund 1984; Patel and McGivan 1984; Pestana et al. 1968; Katsunuma et al. 1968). L-PAG shows allosteric regulation with a sigmoidal activity curve against the glutamine concentration whereas K-PAG shows Michaelis-Menten kinetics (de la Rosa et al. 2009; Curthoys 1995; McGivan et al. 1985; Snodgrass and Lund 1984; Patel and McGivan 1984; Pestana et al. 1968; Katsunuma et al. 1968).
A method for metabolic mapping of PAG activity is currently not available. Therefore, we developed a novel method with GDH as an auxiliary enzyme using a two-step reaction (Fig. 2; Botman et al. In Press; Van Noorden and Frederiks 1992). Metabolic mapping with a two-step reaction has been used before for other enzymes that also do not use NAD+ or NADP+ as coenzyme to visualize their activity by using the activity of an enzyme that can convert a tetrazolium salt into formazan (Van Noorden and Frederiks 1992).
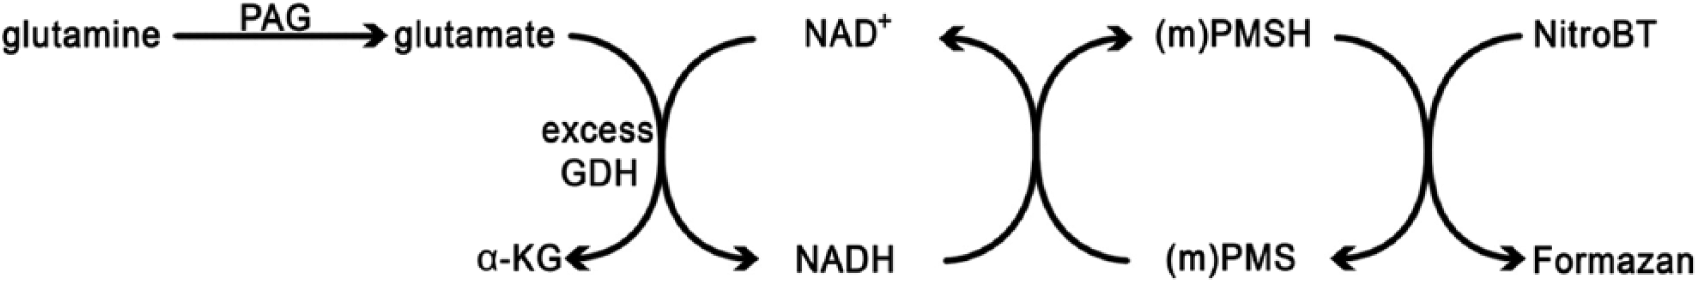
Principle of metabolic mapping of phosphate-activated glutaminase (PAG) using a tetrazolium salt as final electron acceptor. By adding a surplus of glutamate dehydrogenase (GDH) underneath the tissue sections it is possible to stain PAG activity because GDH uses NAD(P)+ as coenzyme. Abbreviations: (m)PMS, (methoxy)phenazine methosulfate; NitroBT, nitrotetrazolium blue chloride.
Materials & Methods
Mice Samples
Various tissues were obtained from male wild-type C57Bl/6J control mice, purchased from the Animal Institute of the Academic Medical Center. The obtained tissues were snap-frozen in liquid nitrogen and stored at -80C. Animals were treated according to the Institutional Standards for Human Care and Use of Laboratory Animals. The Institutional Animal Care and Use Committee approved the experiments.
Metabolic Mapping
We developed a method to detect PAG activity in unfixed cryostat tissue sections. A film of exogenous GDH is present in between the cryostat section and the glass slide, which directly converts the generated glutamate by PAG to α-KG. GDH concomitantly reduces NAD+ to NADH in the reaction media. Subsequently, NADH reduces the electron carrier phenazine methosulfate (PMS), which in turn reduces the water-soluble yellow NitroBT into a water-insoluble blue formazan precipitate. Formazan absorbance in the tissue section is a direct measure of PAG activity, as PAG is the rate-limiting step in the reaction method (Chieco et al. 2013; Van Noorden 2010; Jonker et al. 1996; Van Noorden and Frederiks 1992). Unfixed cryostat sections are used in this method to determine the enzyme activity in its intact cellular microenvironment without any chemical fixation that would affect (usually inhibit) enzyme activity. With excess GDH underneath the cryostat section, formazan is generated within the section at sites where PAG is active. Additionally, to ensure the precise localization of enzyme activity, a water-soluble polymer, polyvinyl alcohol (PVA), is added to the incubation medium to limit diffusion of large molecules, such as enzymes, out of the section into the medium. In contrast, small molecules, such as coenzymes, substrates and tetrazolium salts, can diffuse freely in this PVA-containing media (Van Noorden and Frederiks 1992; Van Noorden and Vogels 1989). Another advantage of PVA is the preservation of tissue morphology. All post-translational modifications of PAG and tissue-specific conditions remain intact, resulting into a genuine representation of enzyme activity in its own cellular environment in a specific tissue.
Metabolic Mapping of the GDH Film
To measure PAG activity, 41 U GDH (Serva Electrophoresis, GmbH; Heidelberg, Germany), dissolved in 50% glycerol, was placed on glass slides and equally distributed by spreading the solution across the glass slide with a coverglass. The glass slides were dried at room temperature in a vacuum (<1-6 bar). Afterwards, 7-µm-thick cryostat tissue sections were cut (for lung tissues, 8-µm-thick sections were cut), captured onto GDH-coated glass slides, and stored at -80C. Before incubation, tissue sections were air dried at room temperature for 30 min.
In order to ensure excess GDH activity and its even spreading over the glass, GDH activity was measured by incubating the GDH films after pouring on top of the films incubation medium containing 18% PVA (Sigma-Aldrich; St. Louis, MO), 0.1 M phosphate buffer (pH 8.0), 5 mM NitroBT (Sigma-Aldrich), 3 mM NAD+ (Roche Applied Science; Basel, Switzerland), 2 mM ADP (Roche Applied Science), and 0.32 mM PMS (Serva Electrophoresis, GmbH) in the presence of 10 mM glutamate (Merck; Darmstadt, Germany). NitroBT was dissolved by heating NitroBT in a 1:1 solution of 100% ethanol and dimethylformamide with a final concentration of 2% v/v (0.34 M ethanol and 0.26 M dimethylformamide) for each solvent.
Metabolic Mapping of PAG
To determine PAG kinetics, PAG enzyme activity was measured in brain, kidney and liver tissues harvested from three mice. Cryostat sections were incubated for 30 min at 37C after pouring on top of the sections incubation medium containing 18% PVA, 0.1 M phosphate buffer (pH 8.0), 5 mM NitroBT, 3 mM NAD+, 2 mM ADP, 0.32 mM PMS and 0-50 mM L-glutamine (Merck). Per sample, three sections were measured.
Tissue-specific PAG activity was measured in the presence of 37.5 mM glutamine and one tissue section per mouse was measured (for liver, brain and kidney, PAG activity was obtained from enzyme kinetic studies in the presence of 30 mM glutamine).
For the tissue thickness series, mouse brain tissue sections of 4, 6, 8, 10, 12, and 16 µm were cut (De Witt Hamer et al. 2006) and captured onto GDH-coated glass slides. Metabolic mapping of PAG was performed as previously described, with tissue sections incubated for 20 min at 37C. At least eight tissue sections per condition were measured.
To test the specificity of the method, PAG activity was stained in the presence of 0.5 mM glutamine as substrate and either 0, 0.5 or 2 mM 6-diazo-5-oxo-L-norleucine (DON; Sigma-Aldrich) as inhibitor (Thangavelu et al. 2014). Per condition, 10 sections from one mouse were measured.
PMS solution was stored as a stock solution in the dark at 4C. NAD+, ADP, NitroBT and glutamine solutions were prepared freshly before incubation. For all experiments, control reactions in the absence of either glutamine or NAD+ and ADP were performed.
After incubation, enzyme reactions were directly stopped and the incubation medium was removed from the tissue sections by rinsing with phosphate buffer, pH 5.3, at 60C for 30 min. Subsequently, sections were rinsed with tap water and distilled water, dried on a warm plate and mounted in glycerol jelly (Dako; Glostrup, Denmark).
Image Analysis
Image cytometry was performed as described by Chieco et al. (2013) to quantify the amount of formazan as a measure of PAG activity. Images were recorded with a Vanox-T microscope (Olympus; Tokyo, Japan), a Scion cfw-1312 gray scale camera (Scion; Tucson, AZ) and the software ImageJ (Schneider et al. 2012; Abràmoff et al. 2004). Sections were recorded with a 10× objective for liver and a 20× objective for all other tissues. The following regions were recorded: liver, periportal and pericentral areas of liver lobules; pancreas, exocrine tissue; kidney, cortex; cerebrum, cortex; cerebellum, molecular layer, granular cell layer, Purkinje cell layer and whiter matter; stomach, gastric glands; small intestines, epithelium of villi; colon, epithelium of crypts; skeletal muscle, muscle tissue; spleen, red and white pulp; lung, alveoli with surrounding structures; heart, muscle tissue; tongue, skeletal muscle. To measure exclusively the absorbance of formazan, a monochromatic 585-nm filter was used in combination with an infrared blocking filter (Jonker et al. 1997; Butcher 1978). Before images were recorded, the equipment was calibrated with a 10-step calibration glass slide. In serial sections, the same regions were recorded in each section when possible. When this was not possible, comparable regions were measured. Regions of interest were selected with the ImageJ plugin ObjectJ (Chieco et al. 2013) and the mean absorbance was determined as a measure of PAG activity in the selected regions.
Statistical Analysis
Mean absorbance values of all test reactions were obtained with ImageJ and were corrected for nonspecific background staining and converted into enzyme activity (μmol converted substrate per mL per min) using Excel 2013 (Microsoft; Redmond, WA, USA). Conversion was performed using the law of Lambert-Beer: A=є·c·d, where A is absorbance; є, extinction coefficient (16.000 at 585 nm); c, concentration of formazan; and d, light traveling distance (intended section thickness; 7 or 8 µm); Butcher 1978). Statistics were performed with Graphpad Prism 6 (GraphPad Software; La Jolla, CA, USA).
Results
Exogenous GDH Is Needed for Optimum PAG Activity Staining
To ascertain whether the auxiliary GDH activity of the GDH films between cryostat sections and glass slides were available throughout the tissue sections in a zero order manner (i.e., not rate limiting), we determined the distribution of GDH activity over the glass slides (Fig. 3A). GDH activity on the glass slides showed little variation over the entire set of films, indicating that GDH was equally distributed across the glass slides. Furthermore, no significant differences in absorbance (i.e., GDH activity) was found between the tested films (one-way ANOVA at α=0.01).
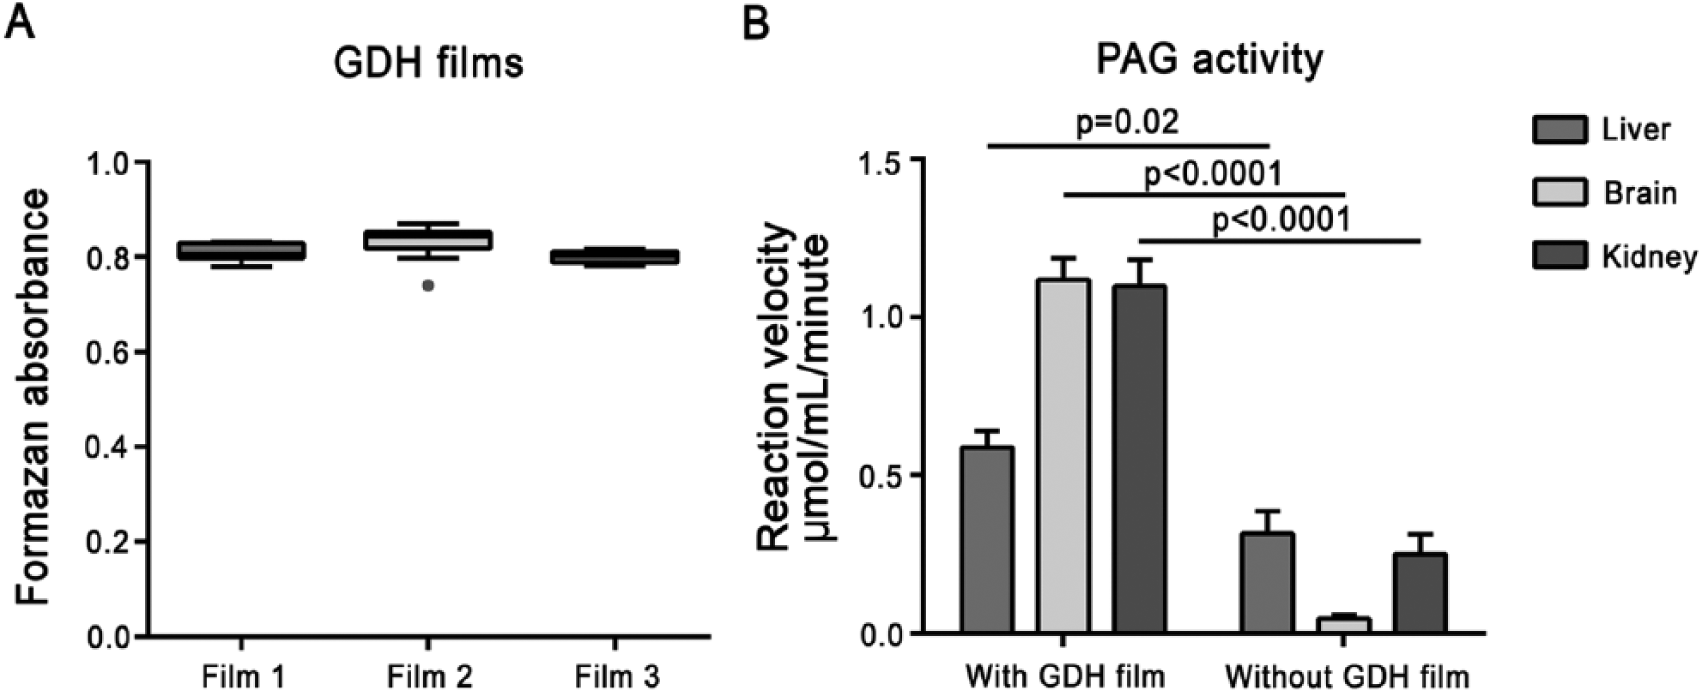
(A) Box-and-whisker plot (Tukey test) of formazan absorbance as a measure of the activity of glutamate dehydrogenase (GDH) films on glass slides. GDH was evenly distributed over the glass slides (n=10 measurements for films 1 and 3, n=11 measurements for film 2). Dot in film 2 data respresents outlier. (B) Phosphate-activated glutaminase (PAG) activity in liver, brain and kidney sections in either the presence or absence of an auxiliary GDH film underneath the cryostat tissue sections. All absorbance measurements were corrected for nonspecific background staining in the absence of substrate. Activity is presented as the mean reaction velocity ± SEM (n=3).
To verify whether endogenous GDH activity in the tissue sections is sufficient and necessary for the detection of first-order activity of PAG, tissue sections of brain, liver and kidney were metabolically mapped for PAG activity with and without an auxiliary GDH film underneath the tissue sections (Fig. 3B). In all three tissues, the presence of the GDH film underneath the tissue section resulted in higher PAG activity staining (Students t-test, p=0.02 for liver and p<0.0001 for brain and kidney).
Tissue Sections of 6–12-µm Thickness Show Optimal Staining with a GDH Film underneath the Tissue Sections
PAG activity was stained for in a series of brain tissue sections with varying thicknesses to determine whether the thickness of the tissue section affects the detection of first-order reaction rates of PAG activity (Fig. 4). Figure 4 shows that 4-µm-thick sections were not reliable and 16-µm-thick sections were apparently too thick for the auxiliary GDH film to generate glutamate throughout the tissue sections. A thickness range of 6–12 µm showed similar PAG activity per µm tissue section thickness (Fig. 4B). This indicates that, in this tissue-thickness range, all glutamate produced by PAG was efficiently converted by the auxiliary GDH film, which resulted in reliable PAG staining in tissue sections ranging from 6–12 µm.
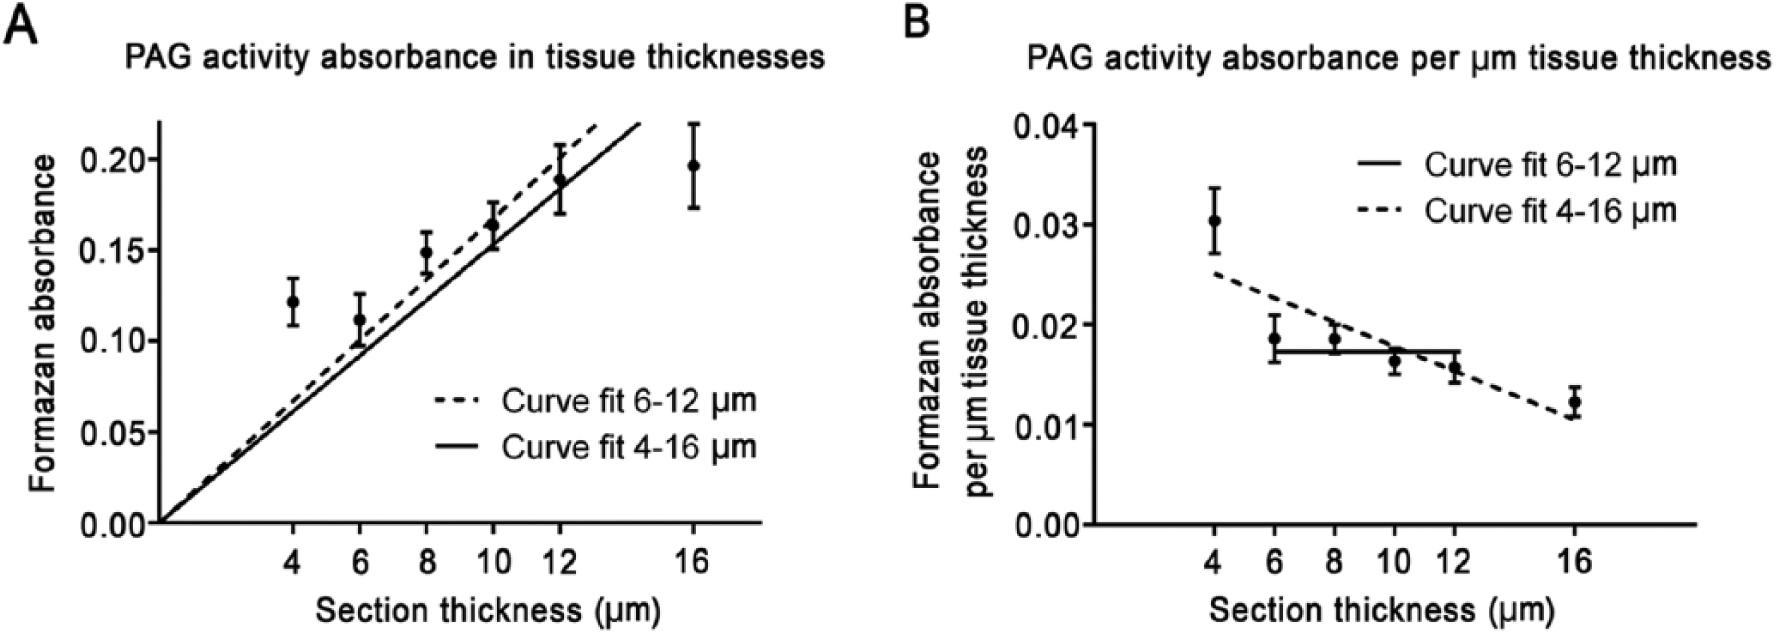
(A) Metabolic mapping of phosphate-activated glutaminase (PAG) activity in the presence of 37.5 mM glutamine in tissue sections from mouse brain of various thicknesses. (B) Absorbance, as calculated per µm tissue section thickness. All test reactions were corrected for nonspecific background staining in the absence of substrate. Absorbance is presented as the mean absorbance ± SEM (n=8 measurements for 4, 6, 10 and 16 µm and n=9 measurements for 8 and 12 µm).
PAG Activity Staining Is Specific
To confirm the specificity of the PAG activity staining method, PAG activity in brain tissue was examined in the presence of the PAG inhibitor DON (Fig. 5). PAG activity staining was significantly reduced to 22% in the presence of 2 mM DON as compared with the staining in the absence of DON (Students t-test, p<0.0001).
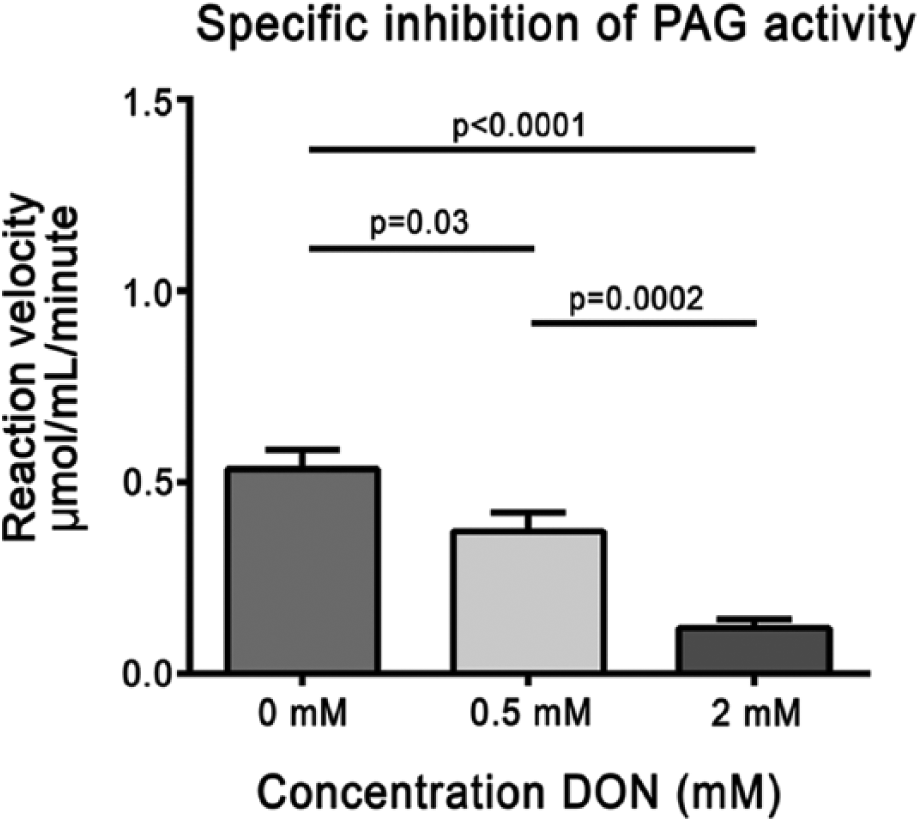
Phosphate-activated glutaminase (PAG) activity in brain tissue sections of a mouse in the presence of 0 mM, 0.5 mM, and 2 mM 6-diazo-5-oxo-L-norleucine (DON; PAG-specific inhibitor). PAG activity was inhibited dose-dependently by DON. All test reactions were corrected for nonspecific background staining in the absence of substrate. Error bars indicate SEM (n=10).
PAG Activity Staining Method Is Solid and Reproducible
To determine the reproducibility of the PAG activity staining method and variation within the samples, tissue sections were stained for PAG activity under identical conditions with varied glutamine concentrations (Fig. 6). The staining method showed the highest variation at low glutamine concentrations. Variations in our method of determining PAG activity was not significantly different from other methods, such as the metabolic mapping method to demonstrate GDH activity (analyzed for liver tissue; F-test at α=0.05; data not shown).
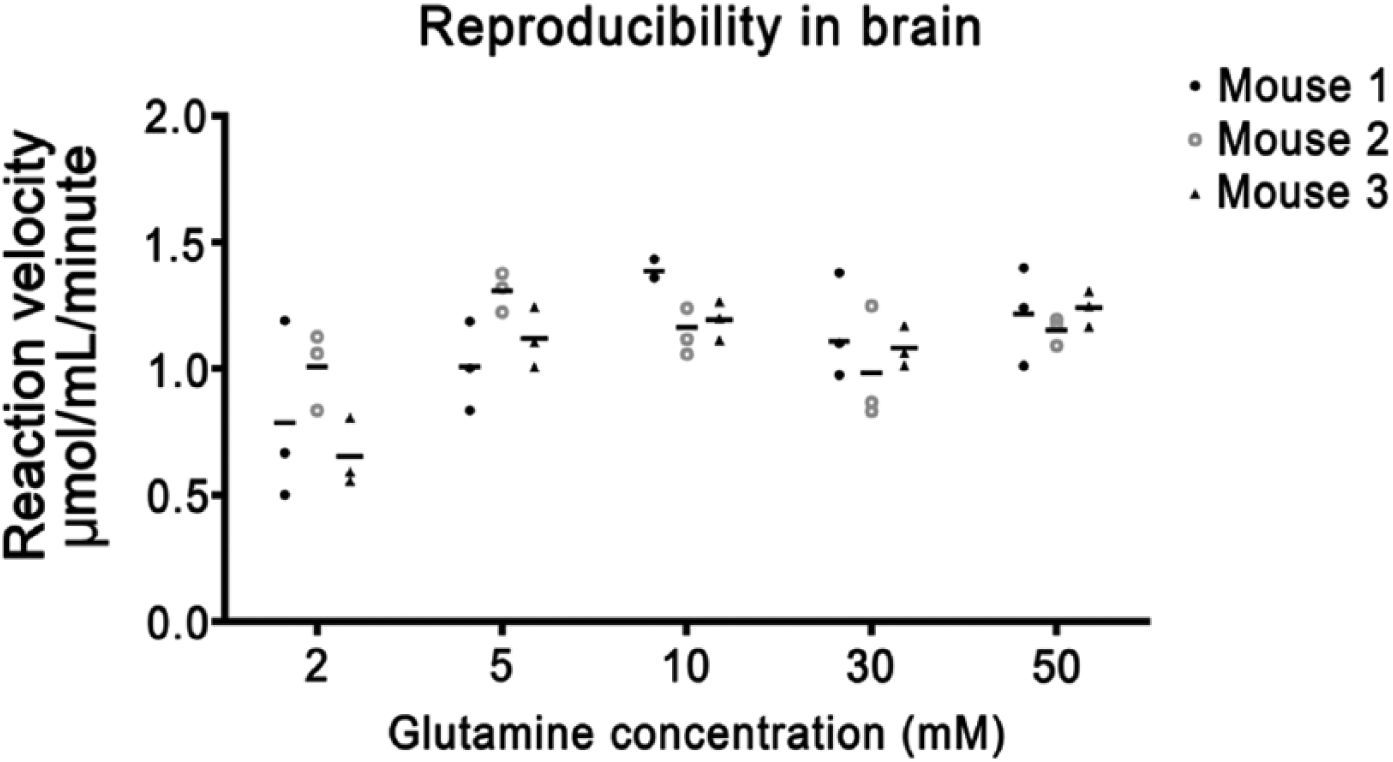
Phosphate-activated glutaminase (PAG) activity in brain tissue sections. All test reactions were corrected for nonspecific background staining in the absence of substrate. For each glutamine concentration, three tissue sections per mouse were analyzed.
Metabolic Mapping of PAG Activity Showed L-PAG and K-PAG Kinetics
PAG showed two distinct patterns of enzyme kinetics (Fig. 7, Table 1). In liver sections, a sigmoidal curve of the reaction velocity versus glutamine concentration was obtained, indicating allosteric regulation of PAG activity. As compared with PAG kinetics in brain and kidney, L-PAG exhibited a relatively high Km of 11.6 mM and a low Vmax of 0.54 µmol/mL/min. PAG kinetics in the brain and kidney showed K-PAG characteristics with Michaelis-Menten kinetics, a relatively low Km for glutamine of 0.6 mM, and a high Vmax of 1.1 µmol/mL/min.
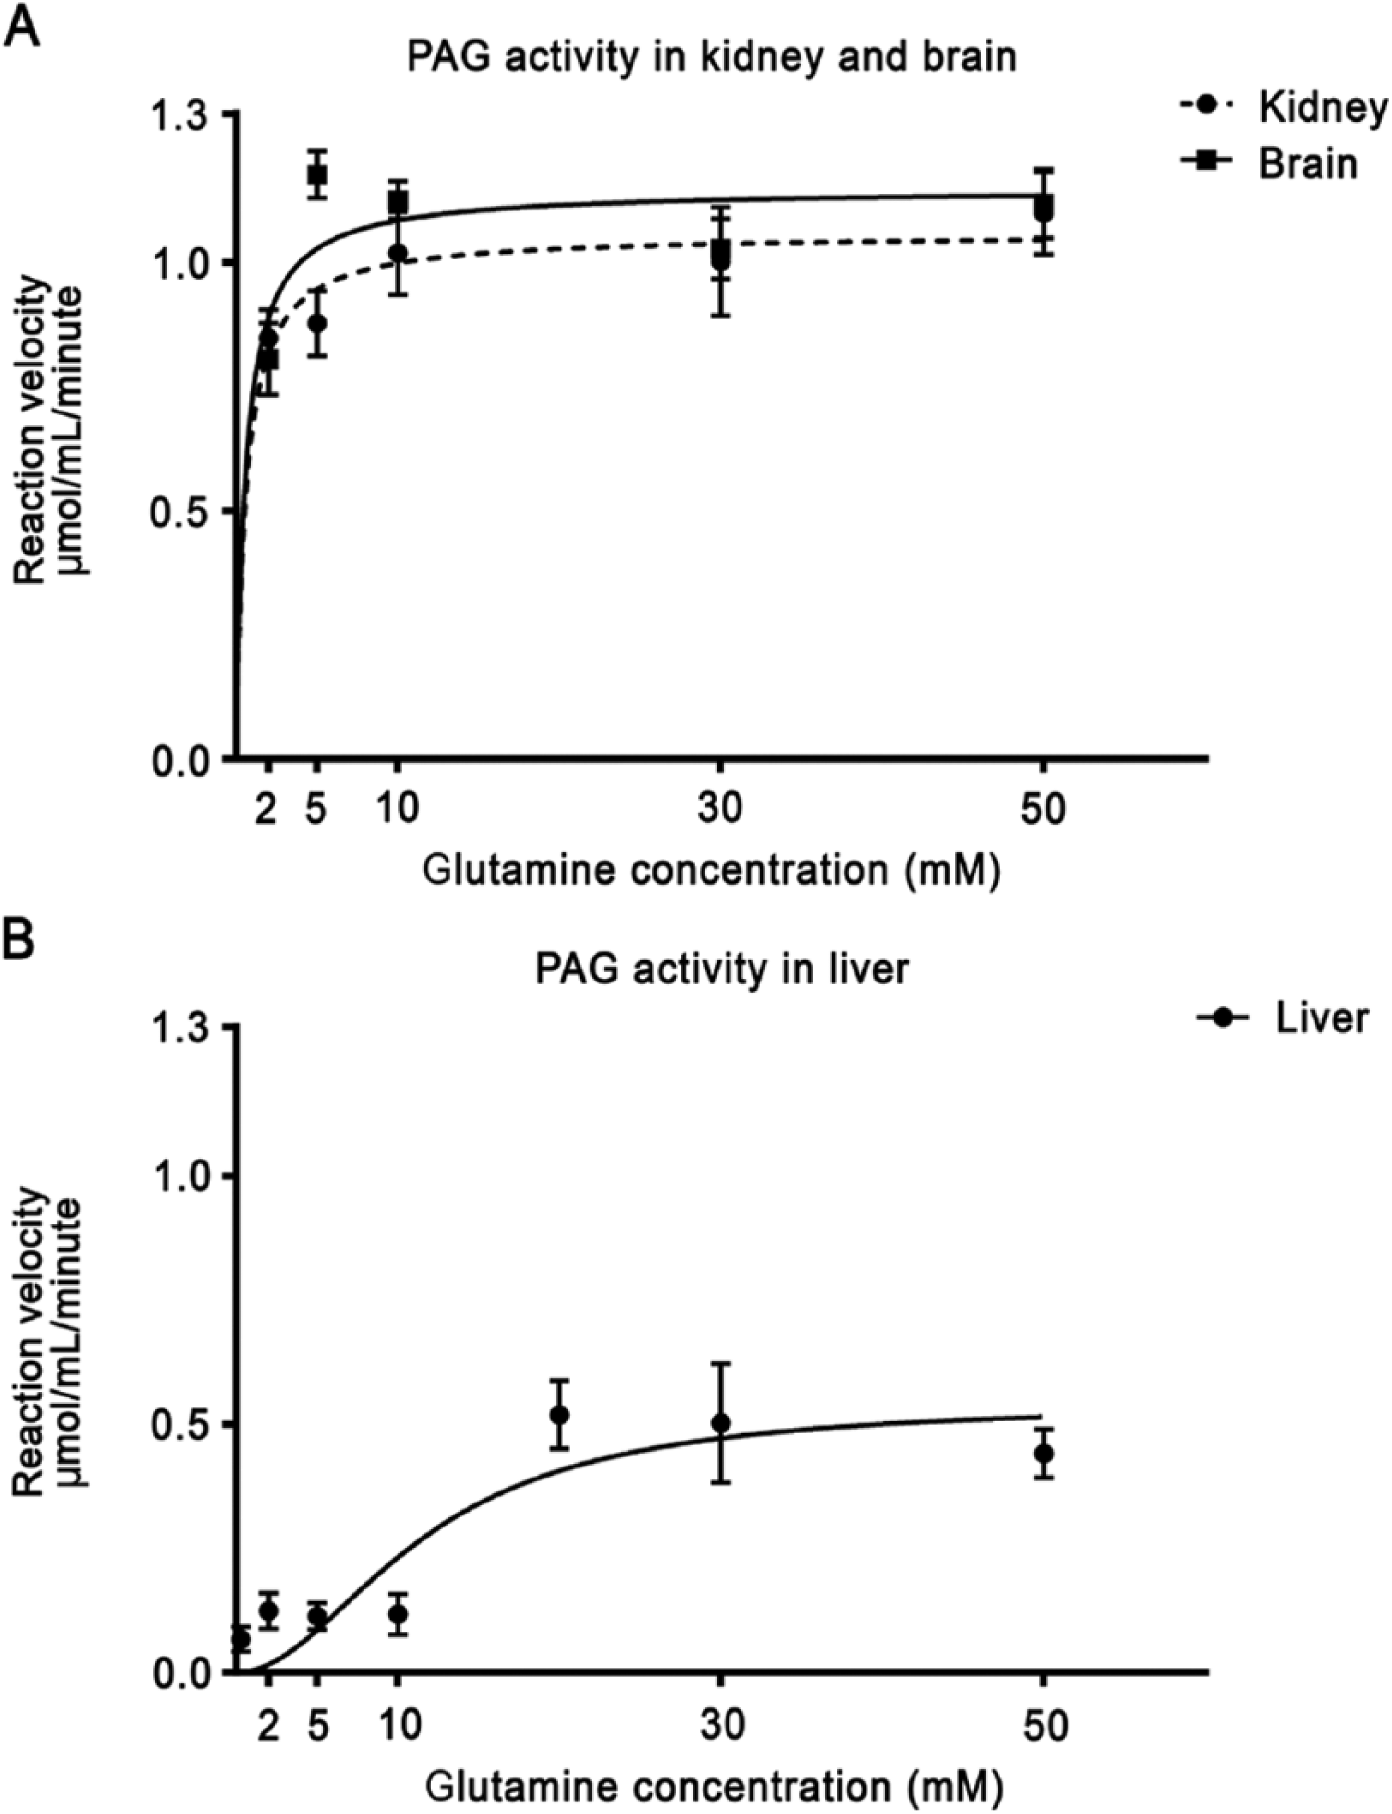
(A) Kinetics of phosphate-activated glutaminase (PAG) activity in mouse kidney and brain tissue sections plotted against glutamine concentration. (B) Kinetics of PAG activity in mouse liver tissue sections plotted against various glutamine concentrations. Bars indicate SEM (n=3).
PAG Kinetic Parameters in Mouse Kidney, Brain and Liver Tissue Sections.
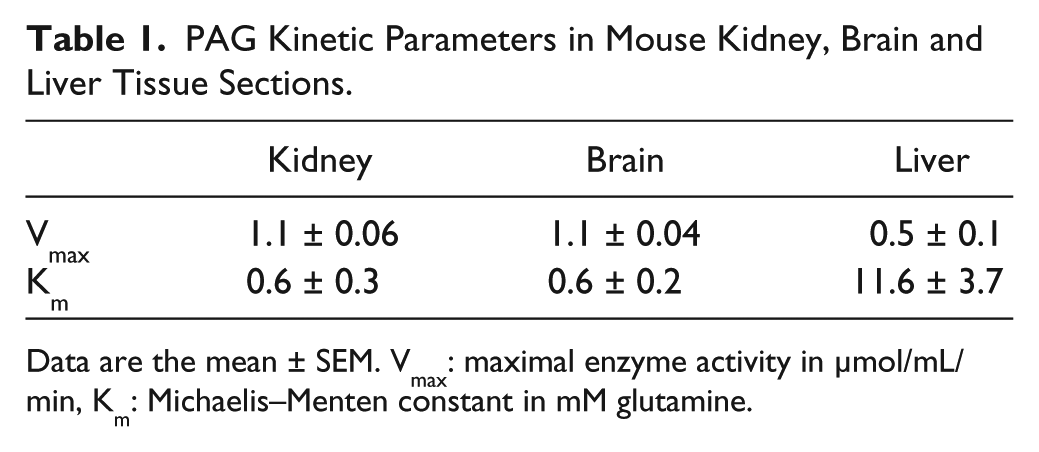
Data are the mean ± SEM. Vmax: maximal enzyme activity in µmol/mL/min, Km: Michaelis–Menten constant in mM glutamine.
In kidney, PAG activity was high in the cortex and inner medulla but low in the outer medulla, papillary tip and glomeruli (Fig. 8). The outer medulla showed regions with low activity that were most likely clusters of lis of Henle.
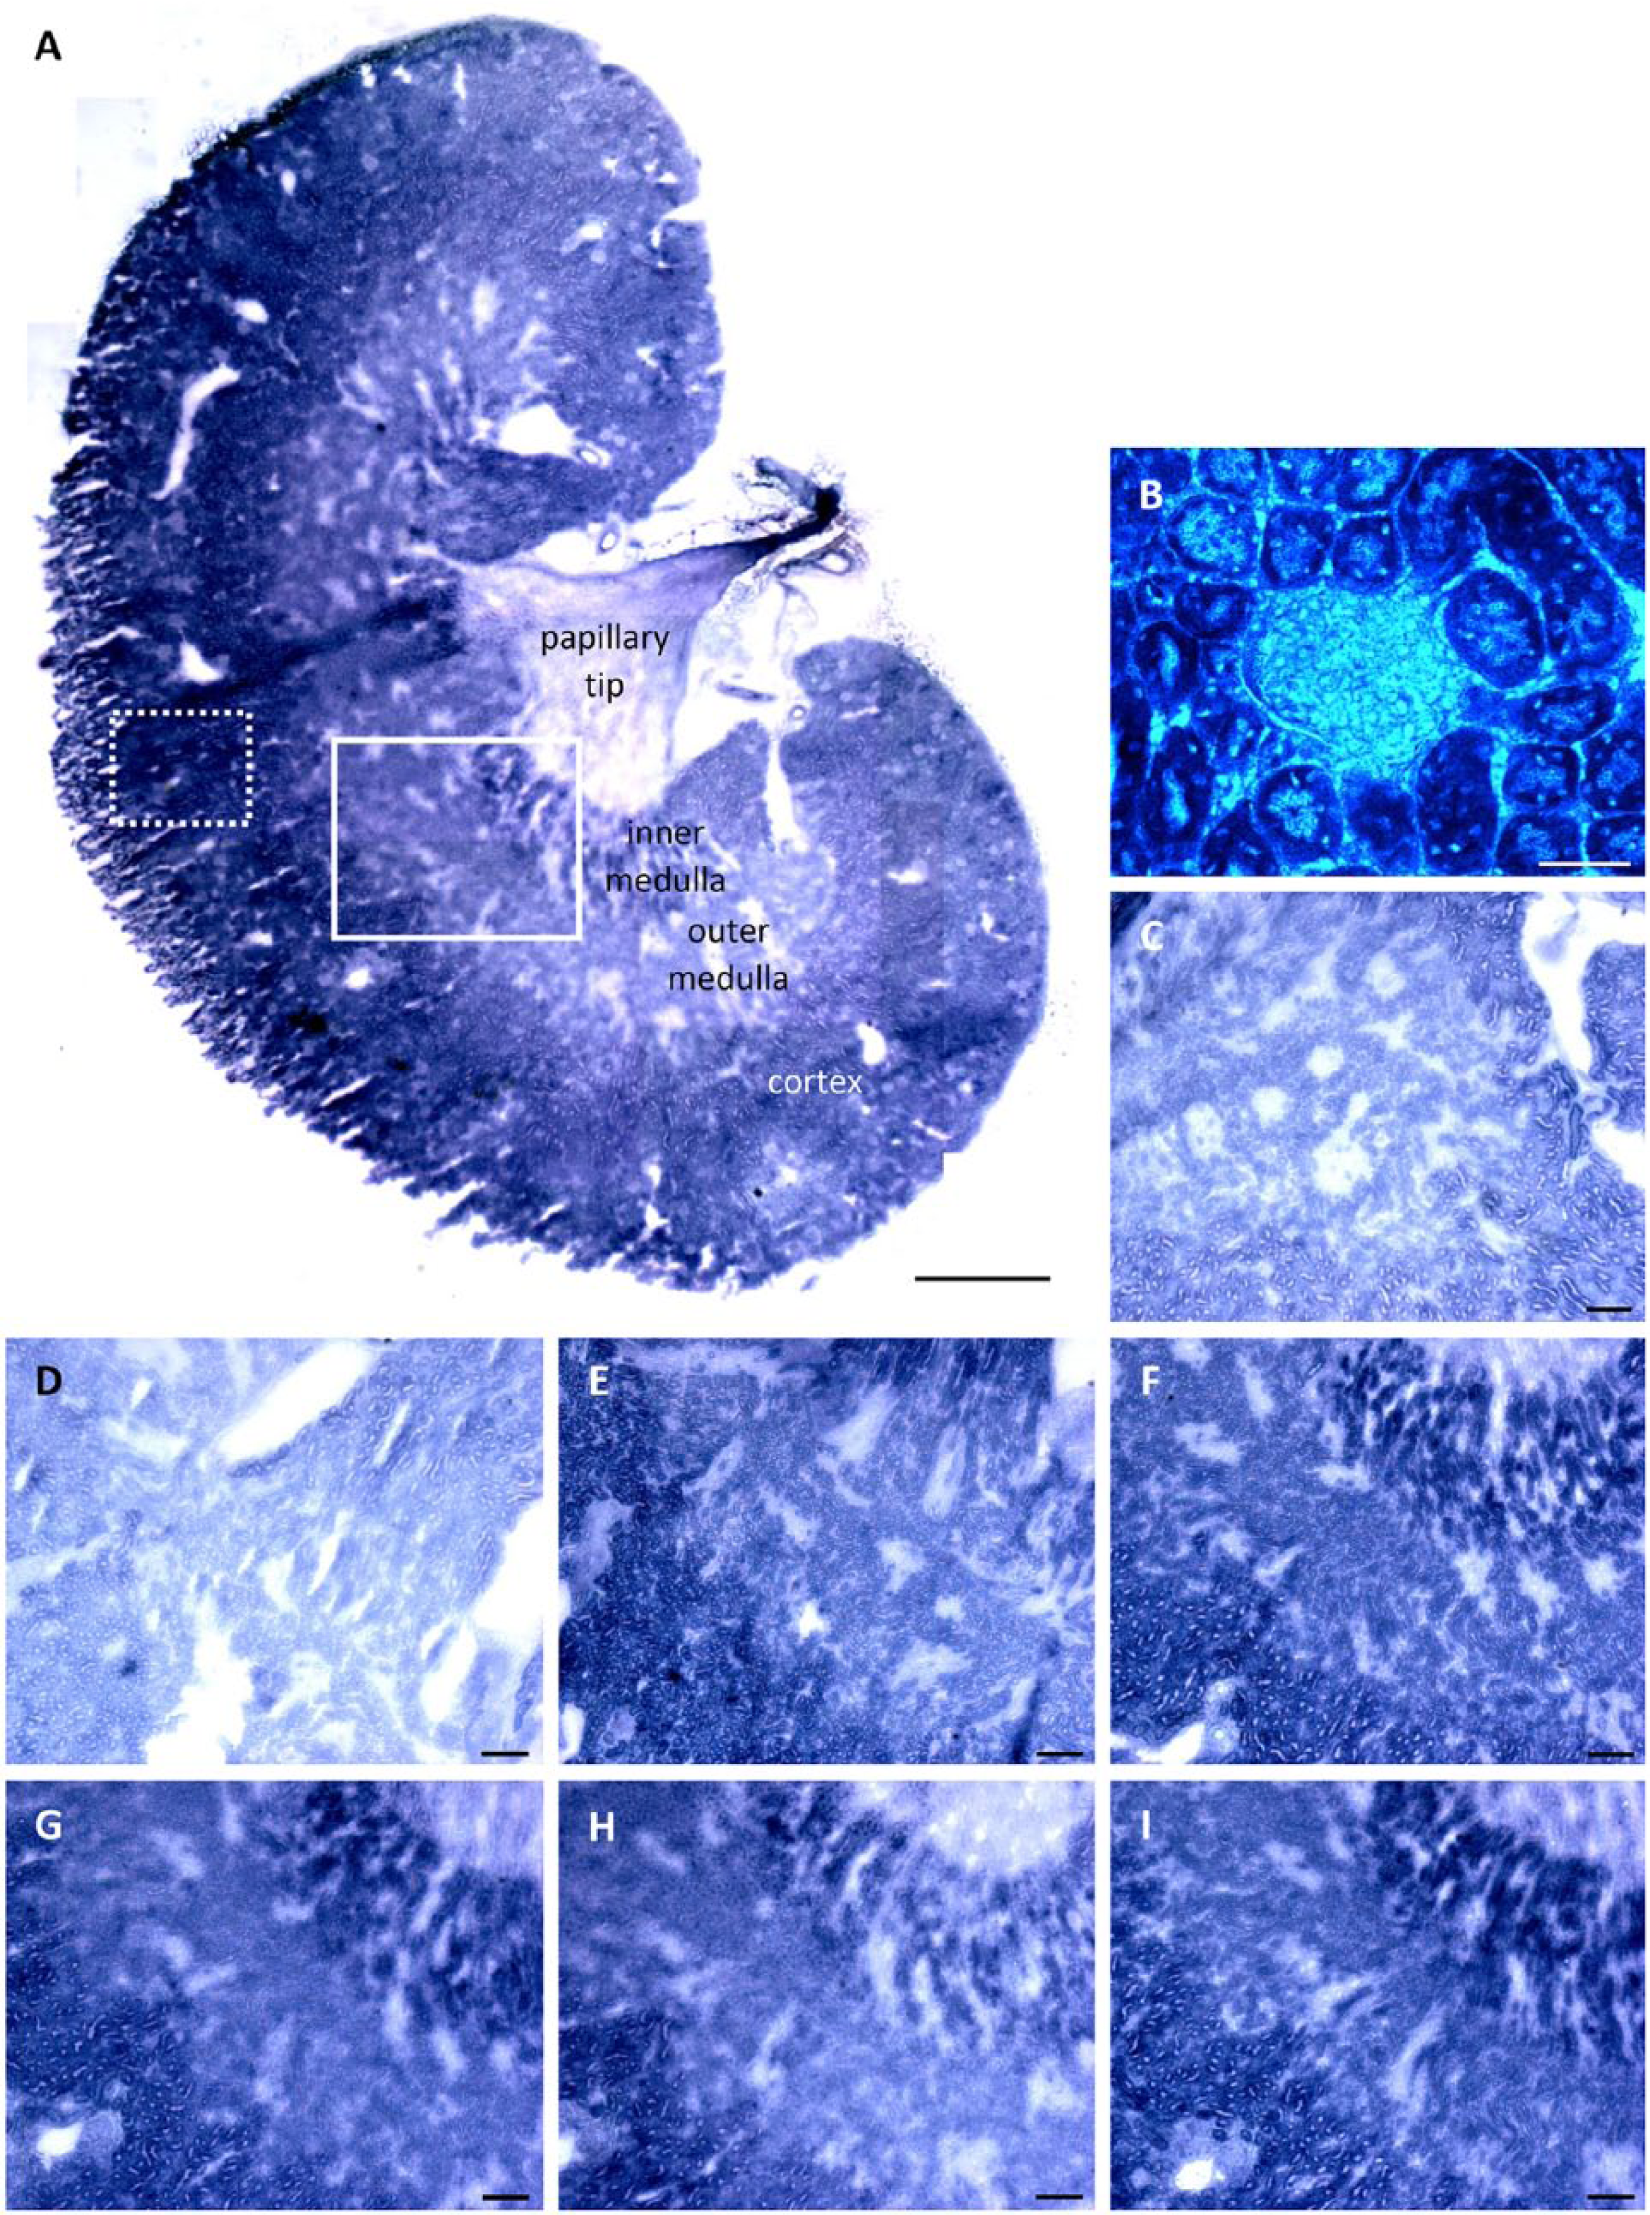
Phosphate-activated glutaminase (PAG) activity staining in kidney tissue. (A) Stitched overview image of PAG activity in mouse kidney cryostat sections in the presence of 30 mM glutamine. Scale, 1 mm. (B) Example of PAG activity in a glomerulus. Scale, 50 µm. (C) PAG activity staining in the presence of 50 mM glutamine without glutamate dehydrogenase (GDH) underneath the tissue section. PAG activity was stained with GDH underneath the tissue sections in the presence of (D) 0 mM, (E) 2 mM, (F) 5 mM, (G) 10 mM, (H) 30 mM and (I) 50 mM glutamine. Boxes show measured (dotted line) and enlarged (continues line) areas in the specific tissue sections. Scale (C–I), 200 µm. Image stitching was performed using Adobe Photoshop CS6 (Adobe, San Jose, CA).
In the brain, PAG showed a high and evenly distributed activity in the cortex (Fig. 9) and a low activity in myelin-rich structures (e.g., the corpus callosum).
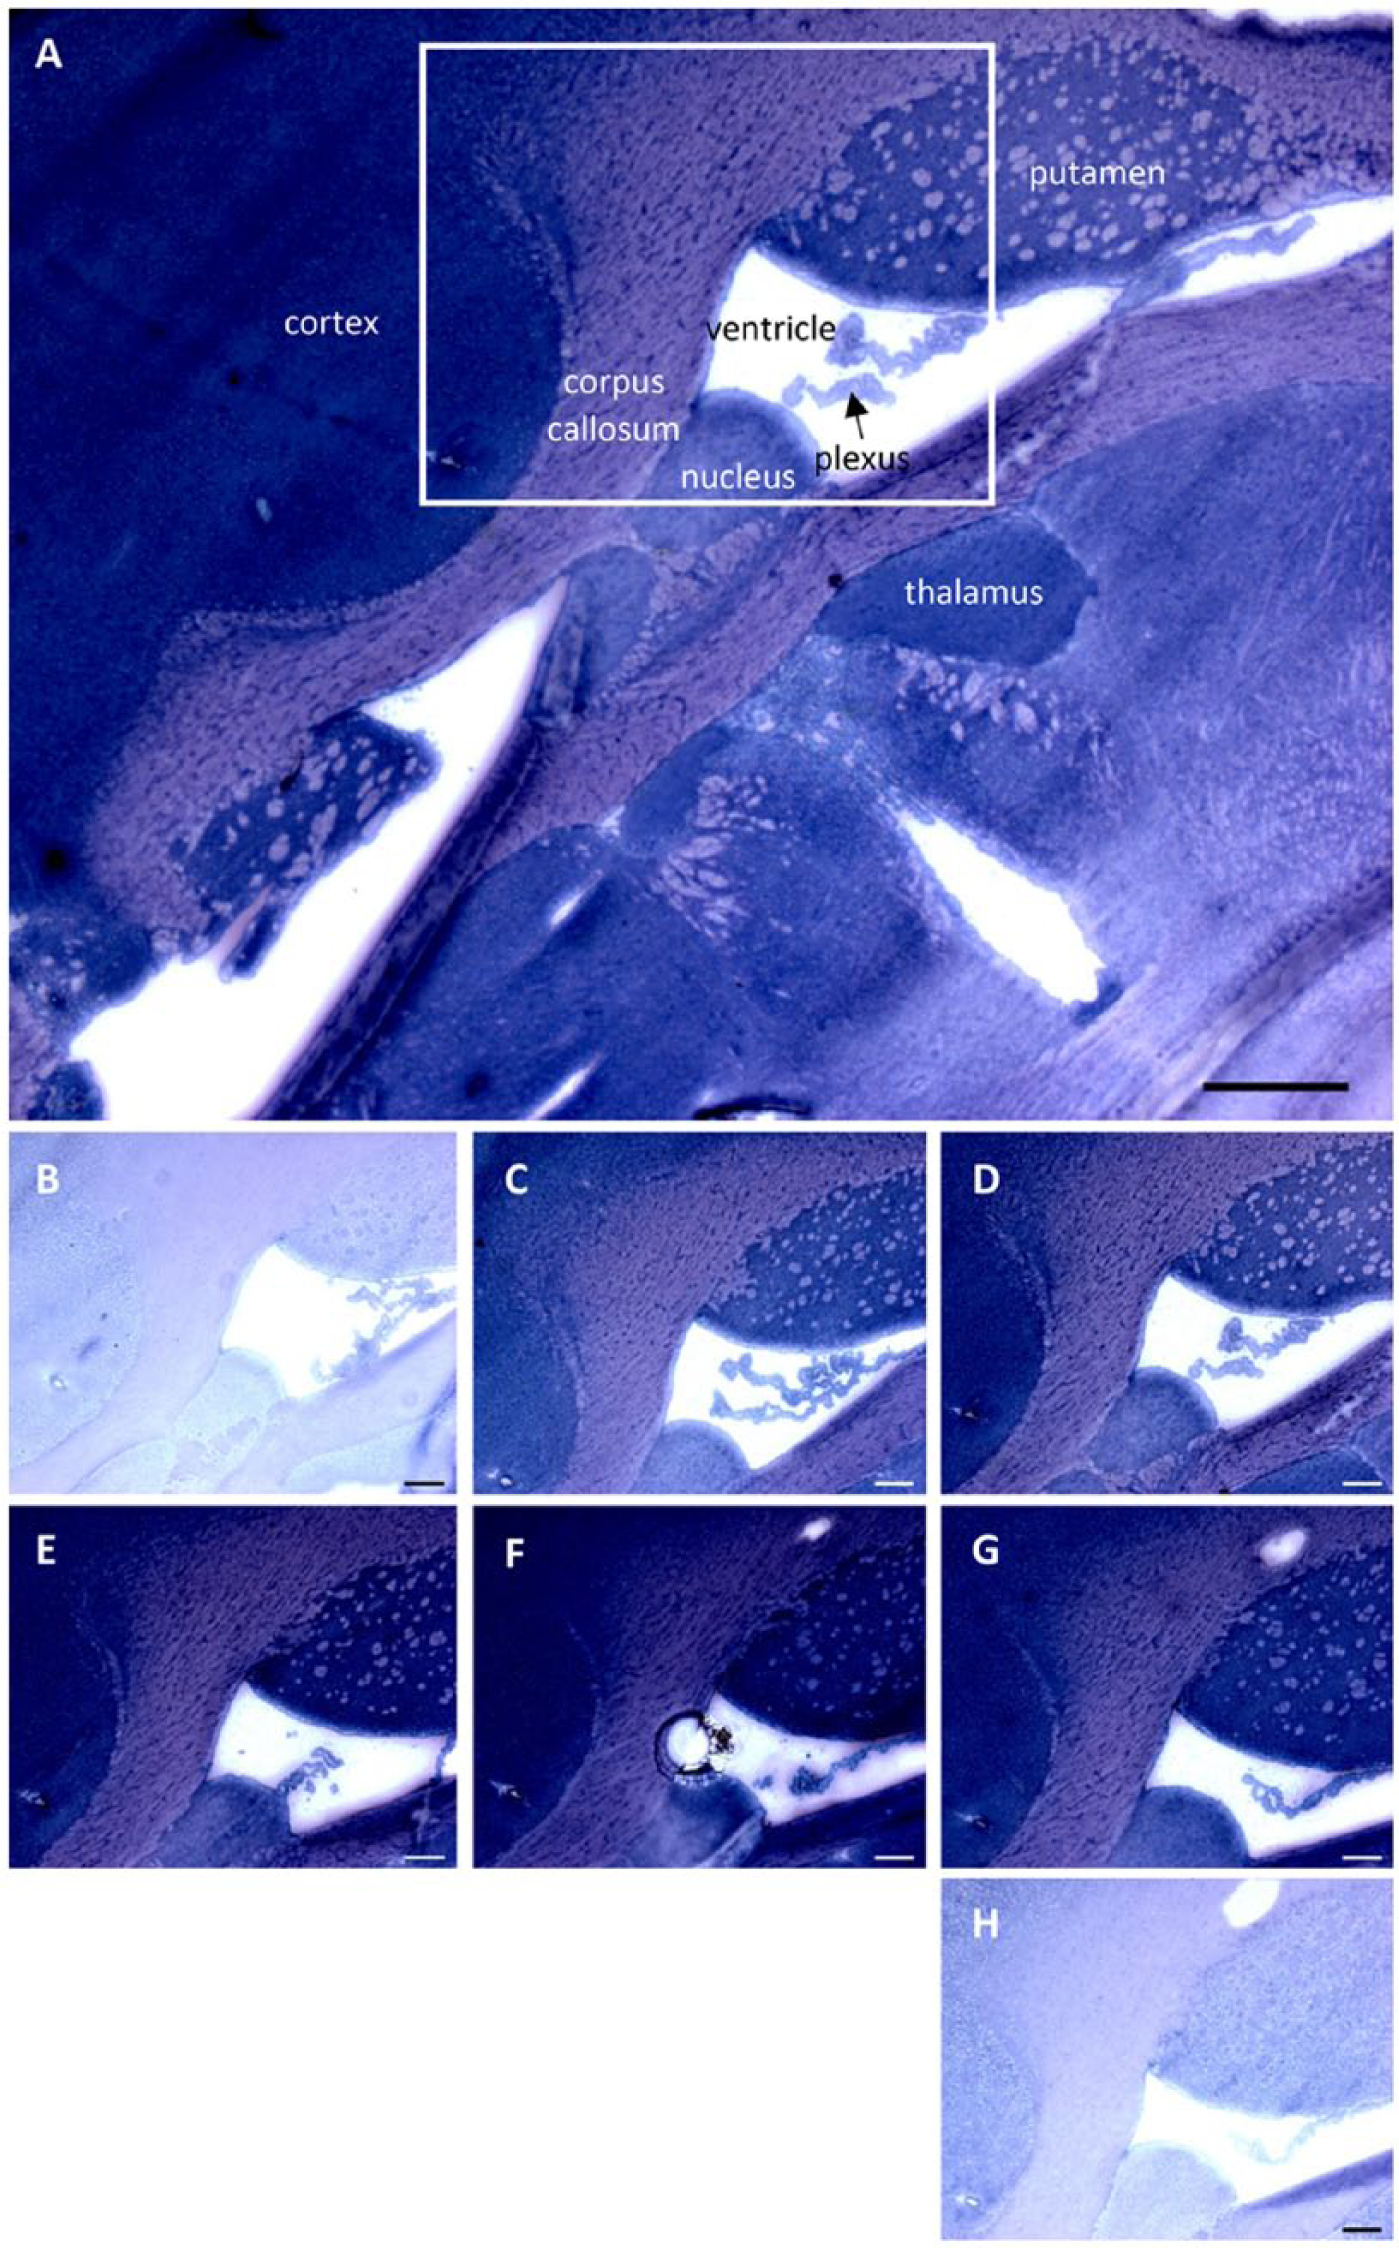
Phosphate-activated glutaminase (PAG) activity staining in mouse brain cryostat sections. (A) Overview of PAG activity in mouse brain tissue in the presence of 5 mM glutamine. Scale, 0.5 mm. PAG activity was stained with glutamate dehydrogenase (GDH) underneath the tissue sections in the presence of (B) 0 mM, (C) 2 mM, (D) 5 mM, (E) 10 mM, (F) 30 mM and (G) 50 mM glutamine and (H) without GDH underneath the tissue section. Box shows the enlarged area in the tissue sections. Scale (B–H), 200 µm.
In the liver, PAG activity in the presence of low glutamine concentrations was highest in periportal areas as compared to pericentral areas after correcting for nonspecific background staining (e.g., staining in the absence of glutamine, Fig. 10). In the presence of 2 and 5 mM glutamine, PAG activity was approximately 1.5-fold higher in the periportal areas as compared with the pericentral areas. With glutamine concentrations higher than 5 mM, PAG activity zonation did not occur.
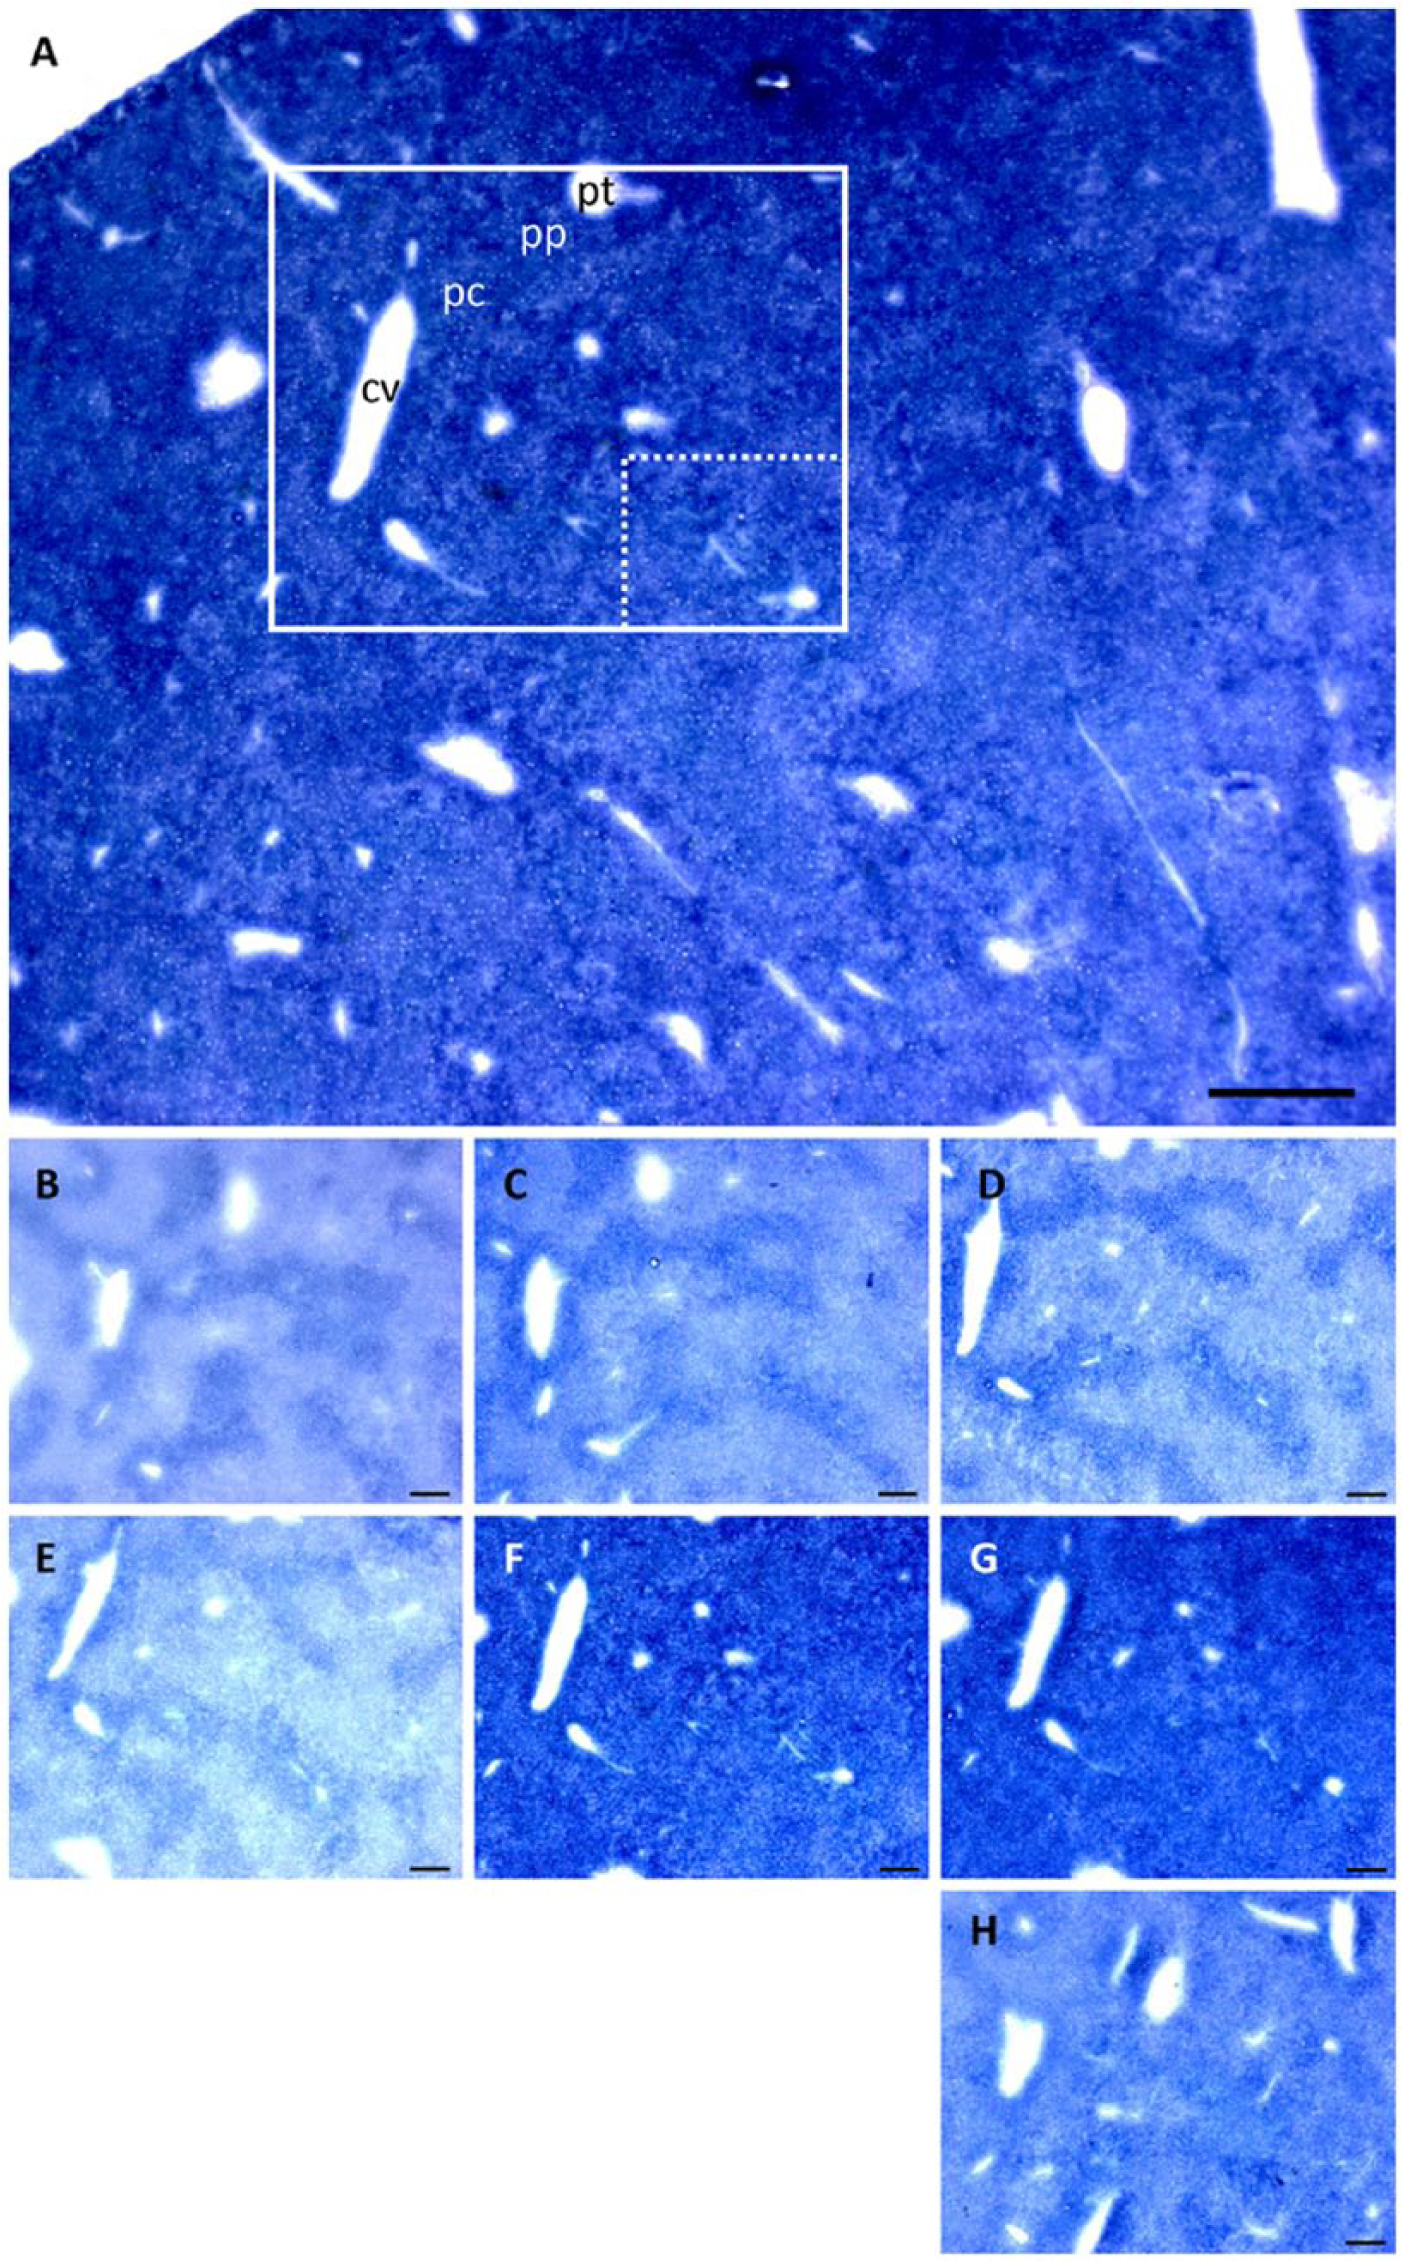
Phosphate-activated glutaminase (PAG) activity staining in mouse liver cryostat sections. (A) Overview of PAG activity in mouse liver tissue in the presence of 30 mM glutamine. Scale, 0.5 mm. PAG activity was stained with glutamate dehydrogenase (GDH) underneath the tissue sections in the presence of (B) 0 mM, (C) 2 mM, (D) 5 mM, (E) 10 mM, (F) 30 mM and (G) 50 mM glutamine and (H) without GDH underneath the tissue section. Boxes show the measured (dotted line) and enlarged (continues line) areas in the tissue sections. Scale (B–H), 200 µm.
PAG Is Active in Liver, Kidney and Brain
Various mouse tissues were metabolically mapped for PAG activity. PAG was mainly active in the liver, kidney and brain (Fig. 11). PAG was twice more active in the kidney and cerebrum than in the liver. Other tissues showed low PAG activity (at least 3-fold less active as compared with liver tissue, and at least 6-fold less as compared with kidney and cerebrum).
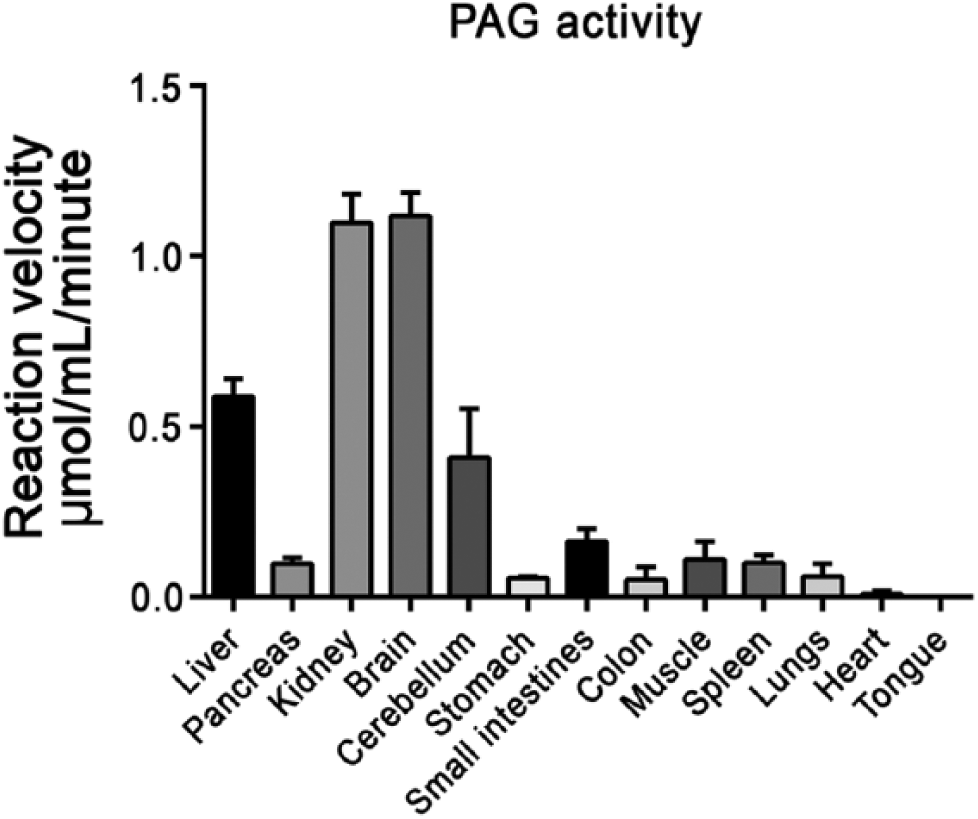
Phosphate-activated glutaminase (PAG) activity in the presence of 37.5 mM or 30 mM glutamine (for liver, kidney and brain tissue) in various mouse tissues. All test reactions were corrected for nonspecific staining in the absence of substrate. Activity is presented as mean reaction velocity ± SEM (n=3).
Discussion
In the present study, a novel method for metabolic mapping of PAG activity is reported based on the addition of an auxiliary GDH enzyme film in between sections and glass slides to stain PAG activity by a 2-step reaction (Fig. 2). In this reaction, endogenous PAG in the tissue section produces glutamate, which is in turn converted by excess GDH activity in the film underneath the tissue sections. The conversion of glutamate to α-KG by GDH results in formazan formation, which acts as a measure of PAG activity, as PAG is the rate-limiting enzyme.
To ensure an even distribution of GDH activity over the glass slides, three GDH films were metabolically mapped for GDH activity. The GDH activity showed little variation and no difference in absorbance among the films (Fig. 3A), indicating that the method can be validly applied. The GDH film situated between the section and the glass slide was required to determine in situ PAG activity in all tissues tested. Using various tissue thicknesses, we showed that PAG activity can only be metabolically mapped in tissue sections in the range of 6–12 µm (Fig. 4). We have previously performed an extensive study of variations in the thickness of cryostat sections (De Witt Hamer et al. 2006), and the variation in section thickness in the present study is comparable. We determined that metabolic mapping of PAG activity was specific; this was because, in the presence of 2 mM PAG inhibitor, DON, PAG activity staining in the brain decreased to 22% as compared with that in the absence of the inhibitor. This experiment was performed in the presence of a low glutamine concentration (0.5 mM) to determine the degree of glutaminase inhibition by DON. Because the Km value was 0.6 mM, our substrate concentration was sufficient to ascertain the specific inhibition of glutaminase activity by DON in brain tissue (Fig. 5; Table 1).
Figure 6 demonstrates acceptable variation in the method. Mainly test reactions in the presence of low glutamine concentrations showed variation, probably caused by the high sensitivity of the enzymatic activity at low glutamine concentrations. The variation at higher glutamine concentrations is probably caused by tissue heterogeneity, variations in cryostat tissue section thicknesses (De Witt Hamer et al. 2006), or other experimental variations (e.g., variations in capturing the tissue sections on the glass slides). The degree of variation in the present method, however, is not different from other metabolic mapping methods, such as metabolic mapping of GDH, indicating that the method described in the present study is reliable and accurate.
Determination of PAG kinetics in kidney, brain and liver tissues sections showed the kinetics of both L-PAG and K-PAG (Fig. 7, Table 1; Curthoys 1995; McGivan et al. 1985; Snodgrass and Lund 1984; Patel and McGivan 1984; Pestana et al. 1968; Katsunuma et al. 1968). Brain and kidney showed K-PAG kinetics with a low Km value (0.6 mM) and a high Vmax (1.1 µmol/mL/min) as compared to L-PAG (Curthoys 1995; Pestana et al. 1968). The obtained Km value is 4-fold lower than that measured in in vitro homogenate studies, indicating that PAG localization and post-translational modifications affect its activity (Pestana et al. 1968). As far as we know, we determined the K-PAG Vmax for the first time.
In kidney tissue, the PAG activity was high in the cortex and the inner medulla but low in the outer medulla, papillary tip, glomeruli and the lis of Henle (Fig. 8). This is in full agreement with previous findings (Curthoys 2001; Curthoys and Lowry 1973). In kidney, the generated NH3+ by PAG serves as a cation for the excretion of acids in the urine (Curthoys 2001, 1995).
In brain tissue sections, PAG activity was high in neuron-rich structures, such as the cortex, and was uniformly distributed, especially in the cortex (Fig. 9); this expression pattern is in accordance with mRNA expression patterns determined previously for rat brain (Najlerahim et al. 1990). The PAG activity is probably high in order to produce glutamate, which is an important neurotransmitter in the central nervous system. Low PAG activity was found in myelin-rich structures, indicating that PAG is not needed in axons. The lower PAG activity in cerebellum was also in accordance with PAG mRNA levels found previously (Olalla et al. 2002; Najlerahim et al. 1990).
Measurements of PAG activity in the liver showed a Vmax of 0.54 µmol/mL/min and a Km of 11.6 mM. The obtained Km value is in line with those found in homogenate measurements performed by Pestana et al. (1968), whereas the Vmax value determined by us is 2-fold lower. The reason for this could be because we kept the cellular environment intact in our study (Van Noorden 2010). Our rationale for maintain tissues intact is supported by the previous findings that in situ conditions in the mitochondria affect L-PAG kinetics (Patel and McGivan 1984). Kinetics of L-PAG show a sigmoidal curve, indicating allosteric regulation, as described previously (Curthoys 1995; McGivan et al. 1985; Snodgrass and Lund 1984; Patel and McGivan 1984; Pestana et al. 1968; Katsunuma et al. 1968). Allosteric regulation of PAG activity is caused by phosphate-mediated protein polymerization at higher glutamine concentrations (Patel and McGivan 1984; Godfrey et al. 1977; Katsunuma et al. 1968). The allosteric regulation functions as a regulator of urea synthesis (Curthoys 1995; Snodgrass and Lund 1984; Marshall et al. 1961). Glutamate is the precursor for acetyl-glutamate, which is needed for carbamoyl synthase. Besides this, the NH3+ generated by glutamine conversion is also a substrate for carbamoyl phosphate synthesis. Therefore, PAG activity regulates urea synthesis and its allosteric regulation enables the fast removal of excess glutamine via the urea cycle.
Metabolic mapping showed that the maximum L-PAG activity in the presence of glutamine concentrations was at least 20 mM. At lower glutamine concentrations (2–5 mM), L-PAG showed a 1.5-fold higher activity in periportal areas as compared with pericentral areas (Fig. 10). This indicates that the Km value of periportal PAG is lower than that of pericentral PAG. The absence of zonation of PAG activity at higher glutamine concentrations indicates that all PAG enzymes have the same Vmax. The higher activity of PAG (at lower glutamine concentrations) in periportal areas is in agreement with the 2-fold higher periportal mRNA and activity levels of PAG noted by others (Watford and Smith 1990). Several studies have shown that the high activity of PAG in liver tissue is related to hepatic urea synthesis and gluconeogenesis (Brosnan and Brosnan 2002; Curthoys 1995; Nissim et al. 1992; Watford and Smith 1990; Snodgrass and Lund 1984; Marshall et al. 1961).
Various mouse tissues were metabolically mapped for PAG activity. In tissues other than kidney, brain and liver, low activity was found, which is in accordance with PAG gene expression patterns found in other mouse studies (Martín-Rufián et al. 2012; Wu et al. 2009; Lattin et al. 2008; Turner and McGivan 2003; Aledo et al. 2000; Elgadi et al. 1999). The low activity in the tissues other than kidney, brain and liver is probably because of the need for glutamine metabolism or T-lymphocyte proliferation in these tissues (Wang et al. 2011; Labow and Souba 2000; Curthoys 1995).
In conclusion, we have developed a novel method to measure validly in situ PAG activity by metabolic mapping. We show that PAG—the enzyme that catalyzes the first reaction in glutaminolysis—is predominantly active in kidney, brain and liver. Additionally, we determined distinct kinetics of K-PAG and L-PAG in these tissues. Glutaminase activity in brain and kidney showed Michaelis-Menten kinetics whereas glutaminase activity in the liver showed allosteric regulation, which is in accordance with K- and L-PAG kinetics, respectively. Through this novel method, it is possible to analyze quantitatively in situ PAG activity in pathological conditions such as IDH1- and IDH2-mutated secondary glioblastoma (van Lith et al. 2014; van Lith et al. In Press).
Footnotes
Acknowledgements
We thank M. Arendse for the preparation of the manuscript and Dr. A. Jonker for his help with image analysis. We also thank H. van Veen, for helping with drying of the GDH films and R.J. Molenaar for critical reading of the manuscript.
Declaration of Conflicting Interests
The authors declared no potential conflicts of interest with respect to the research, authorship, and/or publication of this article.
Funding
The authors received no financial support for the research, authorship, and/or publication of this article.