
Abstract
In this study we sought to develop a method for the co-localization of proteins in living cells utilizing the enhanced green fluorescent protein (EGFP) and a redshifted EGFP variant, EYFP (enhanced yellow fluorescent protein). EYFP was expressed as an unsubstituted molecule while EGFP was fused to NF1 (EGFP-NF1), a transcription factor found exclusively in the nucleus. The Leica TCS SP laser scanning confocal microscope was used. This microscope allows the user to monitor the emitted light at defined wavelengths owing to the presence of a monochrometer in the emission light path. pEGFP-NF1 and pEYFP were co-expressed in the same cell and excited with the 476–nm and 488–nm argon laser lines. To separate the EYFP and EGFP fluorescence, EGFP-NF1 emission was recorded between 496 and 505 nm. These wavelengths are on the left shoulder of the EGFP emission peak and exclude most of the EYFP fluorescence. The EYFP emission was followed between 670 and 754 nm, utilizing the tail of EYFP emission that extends well beyond that for EGFP. Under these conditions we obtained excellent discrimination between EYFP fluorescence and EGFP-NF1 emission. These observations demonstrate that EYFP- and EGFP-substituted chimeras can be used for simultaneous detection in living cells.
T
Here we describe a method to study the co-localization of proteins in living cells using the EGFP and EYFP chromophores. EYFP was expressed as an unsubstituted molecule in mouse mammary carcinoma cells, where it is localized throughout the cell. The EGFP chromophore was fused to NF1 (EGFP-NF1), a transcription factor expected to localize within the nucleus (Cordingley et al. 1987). Imaging was performed with a Leica TCS SP laser scanning confocal microscope, which has the advantage of using a monochrometer in the emission path. This allows monitoring of “emission windows” of defined wavelengths, not possible with currently available filter sets. To separate the fluorescence of the EYFP from EGFP chromophores, the EGFP-NF1 emission window was set at 496–505 nm and the EYFP emission window was set at 670–754 nm. The 476-nm and 488-nm argon laser lines were used for activation of both EYFP and EGFP. Under these conditions we were able to functionally separate EYFP and EGFP emission. These results demonstrate that EYFP- and EGFP-substituted chimeras can be used for direct co-localization of proteins in living cells.
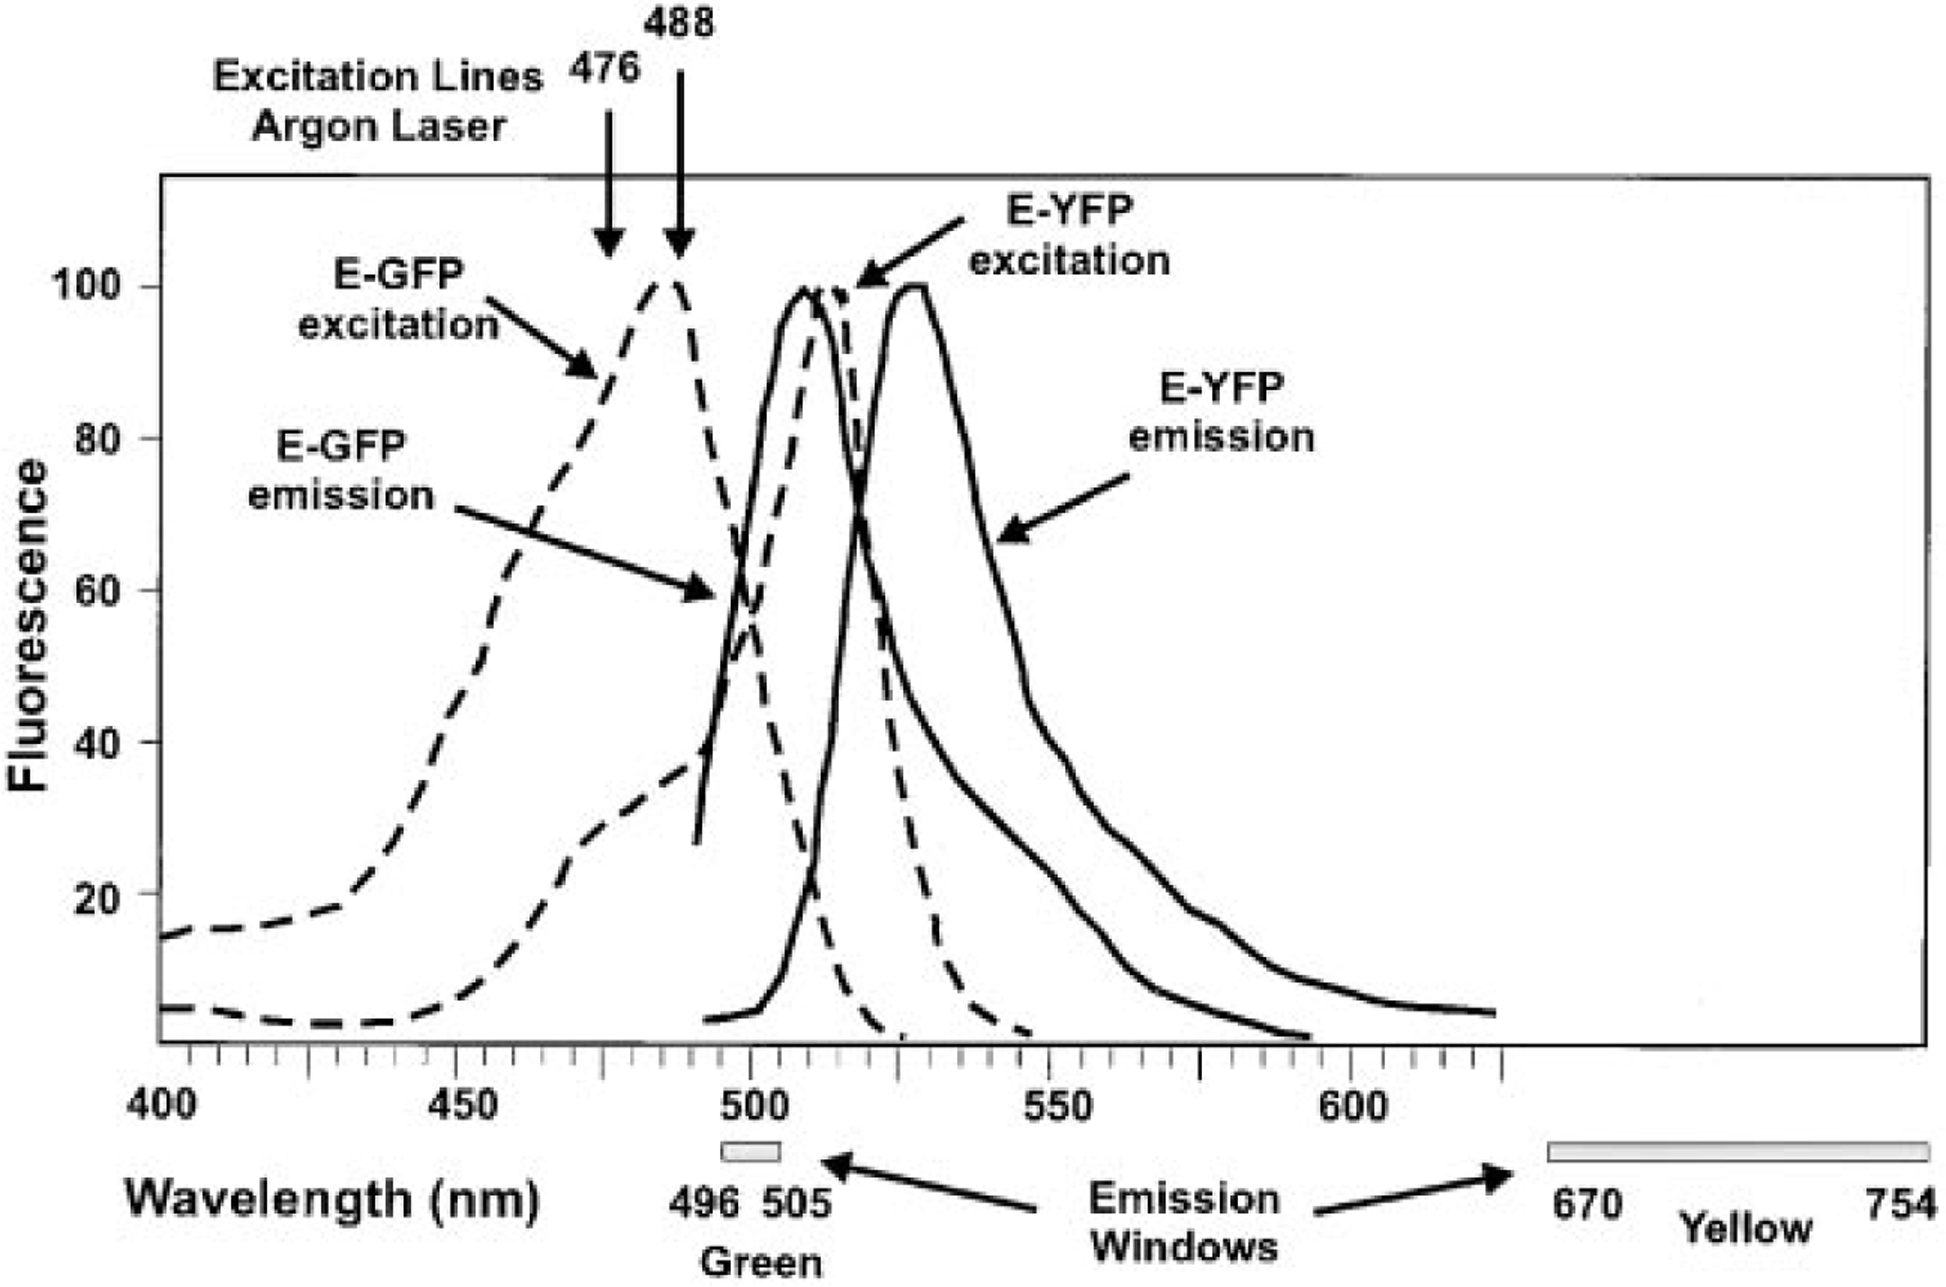
Excitation and emission spectra for EYFP and EGFP. Dashed lines indicate the excitation spectra for EYFP and EGFP, respectively (indicated on the diagram). The emission spectra are shown as solid lines. Detection windows used in this experiment are diagrammed at the bottom of the figure.
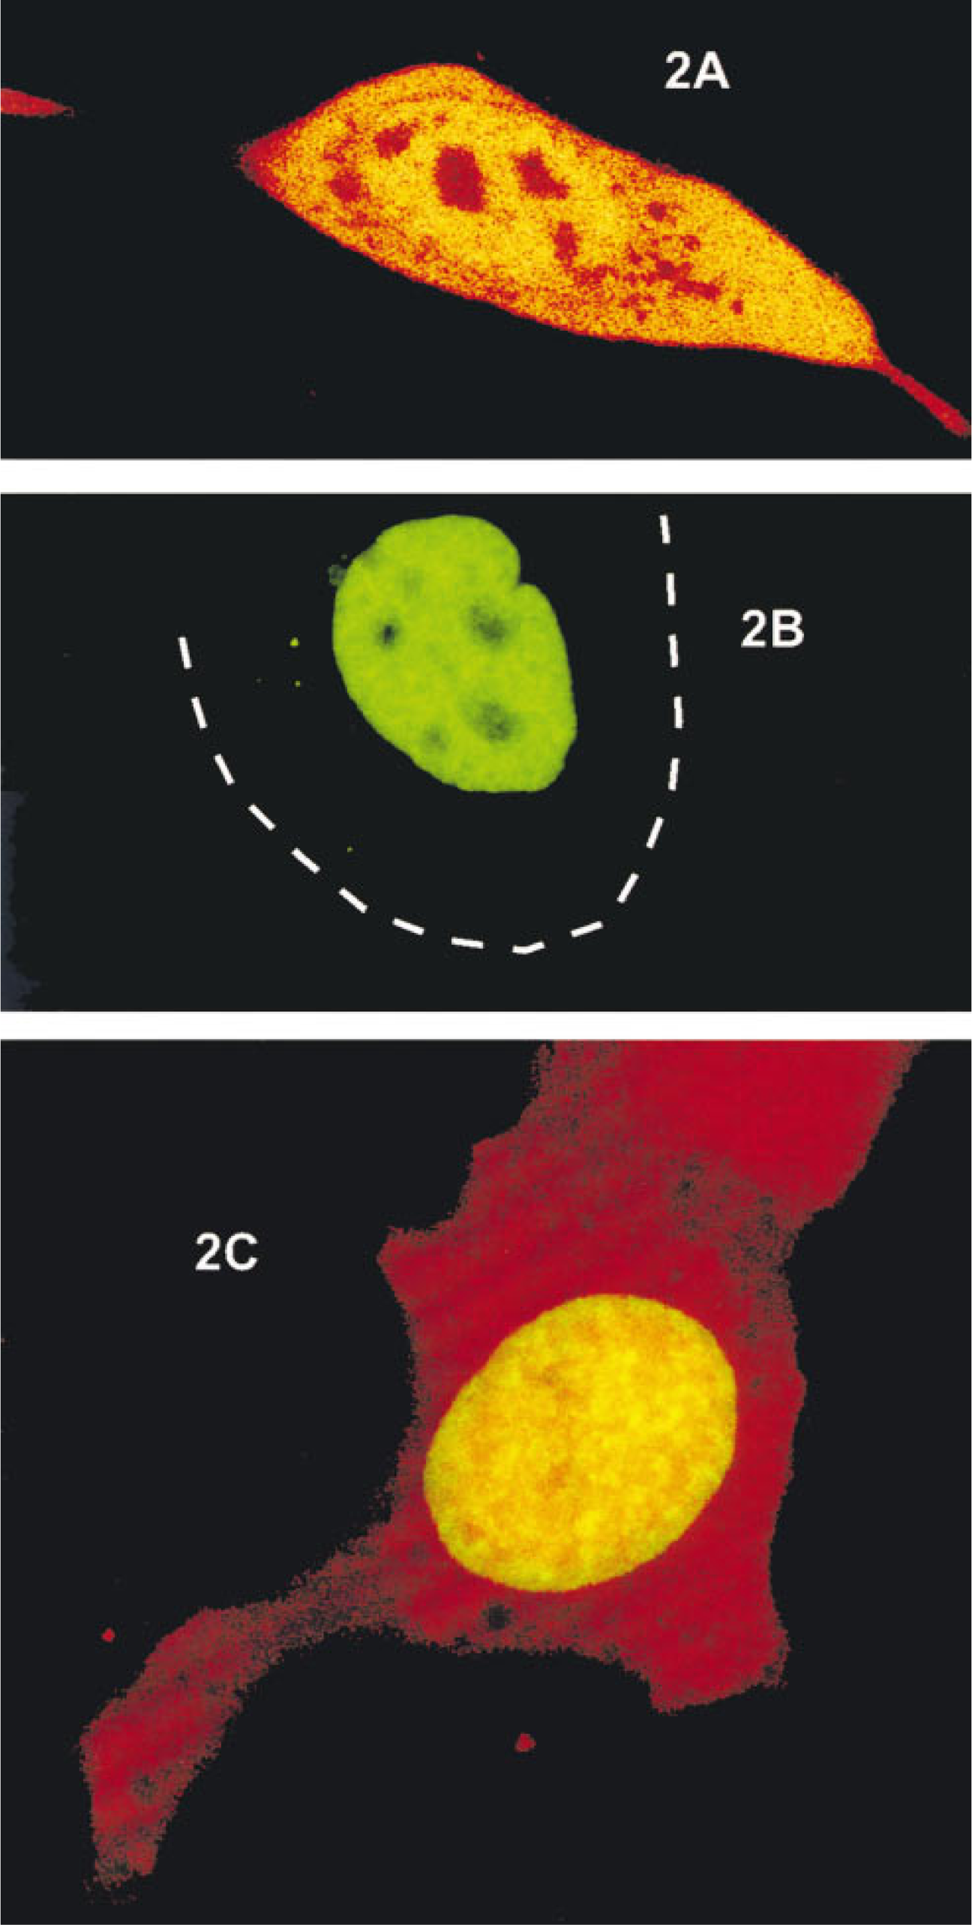
Expression of EYFP and EGFP-NF1. (
Materials and Methods
Plasmids
pEGFP-NF1 was constructed as follows. pCTF-1 (Jones et al. 1987) containing the complete hNF1 coding sequence was digested with SacII and EcoRV and ligated to SacII/ SmaI-digested pEGFP-C1 (Clontech). This construct fuses the NF1 coding sequence, in frame, with the C-terminus of EGFP (Figure 2A) and was confirmed by sequencing. pEYFP-C1 (Clontech) was used without modification (Figure 3). All plasmids used for transfection were propagated in DH5α E. coli and purified by double CsCl banding.
Cell Culture and Transfections
For this study, 1471.1 cells (C127-derived mouse mammary tumor line) (Archer et al. 1989) were used. The 1471.1 cells were grown in DMEM (Dulbecco's modified Eagle's medium; GIBCO BRL, Grand Island, NY) with 10% fetal bovine serum (Atlanta Biologicals; Norcross, GA) plus antibiotics (100 U/ml penicillin and streptomycin, 0.5 mg/ml gentamycin; GIBCO) and 2 mM
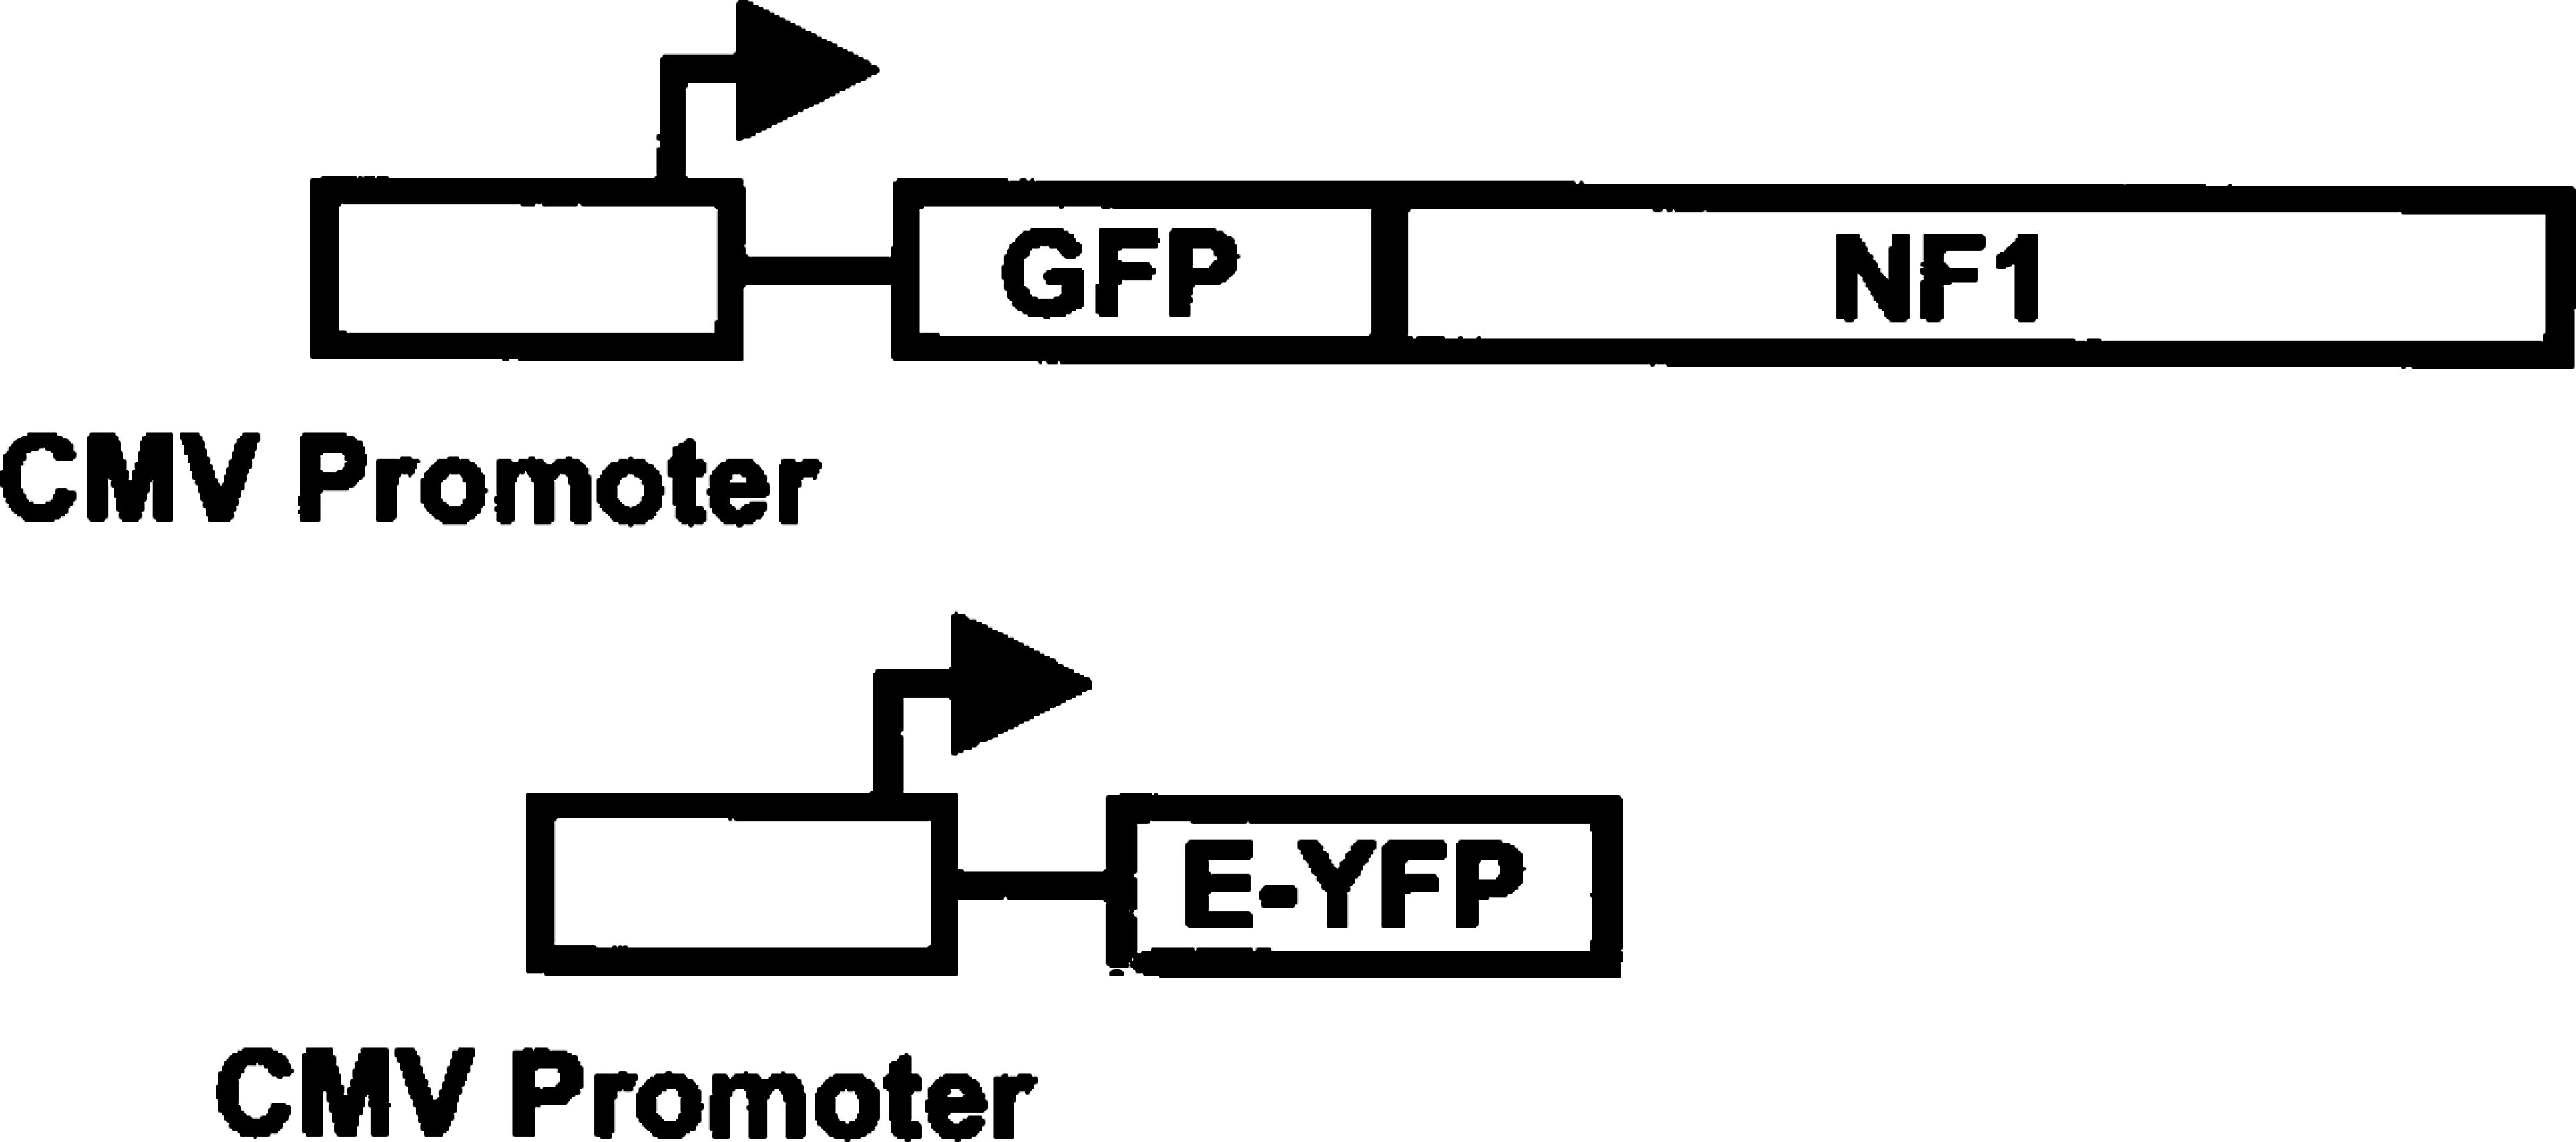
Schematic of the pEYFP and pEGFP-NF1 fusion constructs. Both molecules are expressed by the CMV promoter.
Microscopy
Images were collected on a Leica TCS SP laser scanning confocal microscope fitted with spectrophotometers for emission band wavelength selection. Both EYFP and EGFP were excited with the 476-nm and 488-nm laser lines from an argon laser, with laser intensity set at 9% of available power. For visualization of EGFP, the emission window was set at 496–505 nm (Figure 1). For visualization of EYFP, the emission window was set at 670–754 nm (Figure 1), taking advantage of the long tail of EYFP emission beyond that of EGFP. Confocal image stacks were combined as x-y projection images and printed on a Tektronix 480X dye-sublimation color printer.
Results
To determine whether EGFP and EYFP could be spectrally separated within the same cell, a vector containing a nuclear localizing EGFP fusion protein (Figure 3) and the unfused EYFP protein (Figure 3) were transfected into 1471.1 cells. The EGFP protein was fused to NF1, a transcription factor known to localize exclusively to the nucleus (Cordingley et al. 1987). First, each molecule was transfected separately into 1471.1 cells and excited with the 476-nm and 488-nm argon laser lines. As expected, EGFP-NF1 was found exclusively in the nucleus (Figure 2B), whereas EYFP was found throughout the cell (Figure 2A). Next, both molecules were co-transfected into the same cells and excited as above. EGFP-NF1-monitored fluorescence was monitored between 496 and 505 nm on the left shoulder of the EGFP emission peak (Figure 1). At these wavelengths there should be little or no EYFP fluorescence. Several monochromator window settings were evaluated for EYFP emission. Settings in the range between 550 and 600 nm resulted in considerable overlap between the EGFP and EYFP signal. The best discrimination was obtained by setting the EYFP window between 670 and 754 nm, utilizing the tail of EYFP emission that extends well beyond that for EGFP (Figure 1). Sufficient emission from the EYFP chromophore exists in the 670–754-nm range to easily collect an image. A representative image is shown in Figure 2C, with the EGFP-NF1 emission shown in green and the EYFP emission in red. When the emission was monitored between 496 and 505 nm (EGFP emission), only a nuclear signal was observed, indicating that little to no EYFP fluorescence was being detected in this emission range. Similarly, when the emission window was set between 670 and 754 nm (red), a signal was observed throughout the cell. In the nucleus, both the EYFP and EGFP-NF1 signals were detected, as expected.
Discussion
The use of the green fluorescent protein has rapidly become a valuable tool for the study of protein localization in living cells because it eliminates the need for fixation of cells, which can be plagued by artifacts. Localization of any cloned protein can potentially be observed without the need for antibodies to that protein simply by fusing the protein of interest to GFP. With the recent advent of other GFP variants, such as EYFP, direct localization of two different proteins in the same cell is now possible. In this study we have demonstrated that the fluorescence of EGFP and EYFP can be separated, by setting the emission window to exclude either EGFP or EYFP fluorescence. The emission windows used were based on the data in Figure 1 (supplied by Clontech) and were chosen to maximize emission of the chromophore under observation while minimizing the emission from the second chromophore. Although these experiments were done using a confocal microscope equipped with a monochrometer in the emission path, it should be possible to use a standard confocal microscope and appropriate filter sets.
It should also be noted that the excitation lines available in this experiment were far from optimal for selective excitation of EYFP and EGFP. In fact, a 513-nm line can be obtained from the argon laser with appropriate modification. This line corresponds precisely to the excitation maximum for EYFP (Figure 1). Under these conditions, simultaneous visualization of EYFP and EGFP should be even more effective.
Using this technique described here, it will now be possible to directly study the co-localization of two different proteins of interest within the same living cell. Finally, the recent report of a BFP variant that is 100-fold brighter than the original Y66H BFP (Stauber et al. 1998) suggests that direct visualization of three different proteins within living cells may be possible.
Footnotes
Acknowledgements
We thank Charles Hemphill (Leica; Exton, PA) for providing the laser scanning confocal instrument with emission spectrophotometer used in these experiments. We acknowledge Clonetech (Palo Alto, CA) for permission to reproduce the EGFP and EYFP excitation-emission spectra.