
Abstract
Although PKC plays a major role in regulating the morphology and function of the cytoskeleton, little is known about in situ associations of specific isoforms with the cytoskeleton. We demonstrate that seven PKC isoforms are expressed in B16F10 melanoma cells and show different levels of induction by serum. Using cell cytoskeleton preparations (CSKs), confocal microscopy, and immunocytochemistry, all isoforms show specific patterns of localization to focal contact-like structures (α, δ), very small cytoplasmic granules/vesicles (all isoforms), dense ordered arrays of small granules in the perinuclear region (α, δ), granules/vesicles associated with a homogeneous framework in the cytoplasm adjacent to the nucleus (γ), or irregular-shaped patches of granules at or near the nuclear perimeter (η, θ). In addition, several isoforms are present as cytoplasmic granules/ vesicles in linear or curvilinear arrays (α, δ, ∊, θ). When isoform localization is examined using 3.7% formaldehyde or methanol:acetone, the patterns of localization in CSKs are often difficult or impossible to detect, and many are described here for the first time. Double-labeling experiments with CSK demonstrate that PKC actin co-localizes with punctate α-rich particles above the nucleus, granules of ∊ throughout the cytoplasm, and with θ in irregular-shaped aggregates associated with the nucleus. Vimentin co-localizes with perinuclear granules of δ and β2, and α-tubulin co-localizes with θ in structures at or near the nuclear surface and in microtubules associated with the microtubule organizing center (MTOC). In summary, the present study demonstrates that seven PKC isoforms are endogenously expressed in B16F10 melanoma cells. These isoforms show various levels of induction by serum and specific patterns of association with various components of the detergent-resistant cell cytoskeleton.
P
Cell adhesion, motility, and invasion all involve rearrangements of the cytoskeleton and are parameters that play a crucial role in normal cell physiology and during metastasis. In B16 melanoma cells and endothelial cells, these properties are regulated by PKC, and many components of the cytoskeleton are phosphorylated by PKC (Chopra et al. 1991; Liu et al. 1991; Dumont and Bitonti 1994; Yamamura et al. 1996). Timar et al. (1992, 1993) have shown that PKC regulates the morphology and function of the B16 melanoma cell cytoskeleton, mediating reversible rearrangements of microtubules, microfilaments, and vimentin intermediate filaments, and hyperphosphorylation of vimentin, myosin light-chain kinase, and a cytoskeleton-associated 130-kD protein. The specific PKC isoforms involved were not identified in this work. Although the above studies suggest a close association of PKC-containing signaling pathways and multiple components of the cytoskeleton, little is known about the role played by different isoforms in these processes or about in situ isoform-specific associations with the cytoskeleton. In this study we examine isoform expression and describe varied and specific cytoskeletal associations of seven PKC isoforms in the highly metastatic B16F10 melanoma cell.
Materials and Methods
Maintenance of Tumor Line and Cell Culture
Tumor cells were derived from subcutaneous (SC) tumors as described previously (Harning and Szalay 1988). In brief, 2–3-week-old SC tumors were excised, the periphery cut into small pieces in cold sterile PBS, minced, and passed through a Nitex filter. The supernatant was placed on ice for 10 min, decanted, and centrifuged at 300 × g for 5 min. The pellet was resuspended and cells dispersed by gentle aspiration, washed two times, resuspended in complete medium [CM: RPMI containing 10% FBS (Sigma; St Louis, MO)], 1% Penn-Strep, 0.25 μg/ml fungizone, and 2 mM glutamine, and cultured at 37C in 5% CO2 for up to six passages. In most experiments, cells were cultured on collagen-coated (Sigma) coverslips and adherent cells washed with RPMI and cultured for 2 days in CM either lacking or containing 10% serum.
Immunocytochemical Reagents
PKC isotype-specific affinity-purified rabbit IgG primary antibodies [primary antibodies (Abs)] were obtained from Santa Cruz Biotechnology (Santa Cruz, CA): Abs for PKCα sc208, β1 sc209, γsc210, β sc211, δ sc213, ∊ sc214, η sc215, δ sc212, and ζ sc216. The secondary Ab was an FITC-conjugated goat anti-rabbit IgG (Sigma). Purified PKC isozymes α, β1, β2, γ, δ, ∊, and ζ were obtained from Pan Vera (Madison, CA). Goat polyclonal Abs against vimentin and caveolin-2 (Santa Cruz) were used with donkey antigoat Cy3-conjugated Ab (Jackson ImmunoResearch; West Chester, PA), phalloidin (Sigma) conjugated with rhodamine was used to localize polymerized actin, and an FITC conjugated MAb (Sigma) was used to identify α-tubulin.
Immunocytochemistry Protocol
Cells (5 × 10⁴/ml) in CM were plated out on collagen-coated coverslips and incubated at 37C with 5% CO2 for 1–2 days until they were approximately 20% confluent. Cultured cells were rinsed with PBS and fixed for 10 min in either cold 1:1 methanol:acetone (MA) at −20C or in 3.7% formaldehyde (Fo) at room temperature (RT) for 5 min. After fixation with Fo, cells were permeabilized with 0.5% Triton X-100 for 5 min. Cytoskeletal (CSK) preparations were prepared by simultaneous fixation and extraction using the CSK preparation protocol described by Spudich et al. (1992). Briefly, adherent cells were treated at RT for 5 min with Buffer A containing 135 mM NaCl, 5 mM KCl, 20 mM Hepes, 5 mM EGTA, 5 mM MgCl2, 0.5 mM PMSF, 0.5% Triton X-100, and 2% formaldehyde, followed by an additional 5-min fixation in the above medium in the absence of Triton X-100. After all fixation protocols, fixed cells were washed twice in PBS, blocked for 40 min in 10% goat serum dissolved in PBS-0.5% Tween (PBST), and incubated at 37C with the primary anti-PKC Ab in PBST. Coverslips were rinsed three times in PBST, incubated for 1 hr in goat-anti rabbit FITC-conjugated secondary Ab in PBST at 37C, rinsed five times in PBST, and mounted on slides with Gelmount (Biomedia; Carson City, CA). A nonspecific control (NS) was run with each experiment to test for nonspecific staining of the primary Ab. In this control, affinity-purified rabbit IgG or goat IgG from pre-immune serum (Sigma) was used instead of isozyme-specific primary Ab. Cells were then treated with secondary Ab and assayed as described above. Additional controls received primary Ab only or secondary Ab only. When PKC isoforms were examined, immunocytochemistry was performed for all isoforms with cells plated out at the same time and examined using the same parameters. Co-localization studies were performed as above with the following modifications. For actin co-localization, CSKs were blocked with 10% goat serum, incubated with PKC Ab and then with FITC-labeled secondary Ab, followed by rhodamine-phalloidin. To localize vimentin, CSKs were blocked by 10% donkey serum followed by serial incubations at 37C for 1 hr as follows: PKC Ab, donkey anti-rabbit FITC-secondary Ab (Jackson), goat anti-vimentin Ab, and then donkey anti-goat-Cy3 (Jackson). For tubulin localization, CSK preparations were incubated with PKC Ab and goat anti-rabbit rhodamine, followed by incubation with FITC–α-tubulin MAb (Sigma).
Western Blotting
Western blotting techniques were carried out using whole cell extracts and cytoskeletal extracts. To examine the isozyme specificity of PKC Abs, purified Bacculovirus-expressed PKC isoforms (PanVera) were boiled for 2 min in reducing Laemmli buffer, and equal volumes of samples containing 50 ng of isozyme were subjected to SDS-PAGE using continuous (4–20%) polyacrylamide gradient gels or 10% polyacrylamide gels, and transferred to a nitrocellulose membrane (BioBlot-NC; Costar, Cambridge MA). Membranes were blocked with 10% nonfat dry milk powder and were probed with affinity-purified rabbit anti-PKC Abs (Santa Cruz) and an HRP-conjugated goat anti-rabbit IgG secondary Ab (Santa Cruz). Immunoreactive species were visualized by enhanced chemiluminescence using the ECL or ECL Plus reagent (Amersham; Arlington Heights, IL). To prepare whole cell extracts, confluent monolayers were trypsinized, centrifuged at 500 × g, and resuspended in lysis buffer (20 mM Tris-HCl buffer, pH 7.4, 5 mM EGTA, 2 μM leupeptin, 1 mM AEBSF, 30 μl/ml apoprotinin, and 10 μl/ml 100 mM sodium orthovanadate), homogenized on ice, and boiled in 2 × Laemmli solution containing 2% β-mercaptoethanol. To prepare CSK extracts, cells were trypsinized, re-suspended in lysis buffer (140 mM NaCl, 25 mM KCl, 5 mM MgCl2, 2 mM EDTA, 2 mM EGTA, 0.5% Triton X-100, 1 mM AEBSF, apoprotinin 30 μl/ml, 10 μM leupeptin, and 10 μl/ml 100 mM sodium orthovanadate), vortexed briefly, and centrifuged for 30 min at 100,000 × g. The pellet was resuspended in 1 ml lysis buffer and homogenized on ice, and Laemmli solution and β-mercaptoethanol were added as noted above.
Microscopy
The Meridian Ultima Confocal microscope was equipped with an argon ion laser, a 530/30 bandpass filter for FITC fluorescence, and a 580/30 bandpass filter for rhodamine-phalloidin. Pinholes and lenses were chosen that afforded an axial resolution (ar; or z resolution) of 0.18–0.66 μm (“thin” optical slices) or an ar of 2–10 μm (“thick” optical slices). For thin optical slices the step size was 0.2–0.5 μm. Digitized images obtained using thin optical slices were used to obtain the best resolution in a restricted plane through the cell. Unless otherwise stated, thin optical slices are of the optical plane exhibiting maximal fluorescence. It is important to note that images of thin optical slices do not reflect the distribution or intensity of fluorescence throughout an entire cell. In contrast, thick optical slices were used to obtain an overview of the distribution of total cell fluorescence and to performing quantitative analysis of isoform expression. In adherent and flattened melanoma cells, thick optical slices typically capture fluorescence throughout the entire depth of a cell. All experiments were repeated at least two times.
Preparation and Analysis of Photographic Plates
For each experiment, the scan strength and sensitivity of the detector of the confocal microscope were set and maintained so that fluorescence of the NS control was barely detectable. Photographic prints of the digitized images were prepared in Adobe PhotoShop 4 using the same parameters for the experimental images as used for the corresponding NS controls.
Statistical Analysis
ANOVA and the t-test were used to analyze differences between means for the FBS+ and FBS–comparisons. Comparisons of average isoform-specific fluorescence with the fluorescence of NS controls was analyzed using the Bonferroni test of significance for multiple comparisons.
Results
In preliminary experiments, we examined the specificity of primary PKC Abs using Western blotting techniques and purified PKC isozymes. Figure 1A shows that the antibodies against β2, γ, δ, and ∊ were isozyme-specific, and only a modest PKC recognition of β1 was observed for the α Ab. Although purified η and θ isozymes could not be obtained, the η and θ Abs were tested against all other isozymes and showed no crossreactivity. In contrast, the Abs directed against β1 and ζ were not specific and were therefore not used in the present experiments.
Western blotting techniques were used to examine the specificity of the PKC Abs in whole cell extracts and in detergent-resistant cell extracts. For examination of whole cell extracts, the Abs for γ, δ, ∊, and θ recognized a single protein with the MW expected for PKC isoforms (Figure 1B, left), and the α Ab recognized two bands. The β2 Ab recognized a band with MW of approximately 43 kD, consistent with that of a proteolytic fragment of the holoenzyme, and the Ab for η recognized bands with MWs of 64 and 15 kD, suggesting additional proteolytic cleavage of η. Because analysis of CSK preparations was a major goal of this study, we used Western blotting analysis of cell extracts prepared under conditions most closely approximating those used to prepare CSKs. Analysis of these detergent-resistant cell extracts (Figure 1B, right) gave similar results to those shown in Figure 1B, left, except that the Ab for α now recognized only a single band with appropriate MW for the holoenzyme, band for β2 had the appropriate MW of the holoenzyme, and the Ab for η recognized two MW bands that may be proteolytic fragments of the holoenzyme. These data suggest decreased proteolytic cleavage of β2 and an altered degradation of η in CSK extracts. Collectively, the above data demonstrate the specificity of the PKC Abs in B16F10 cells.
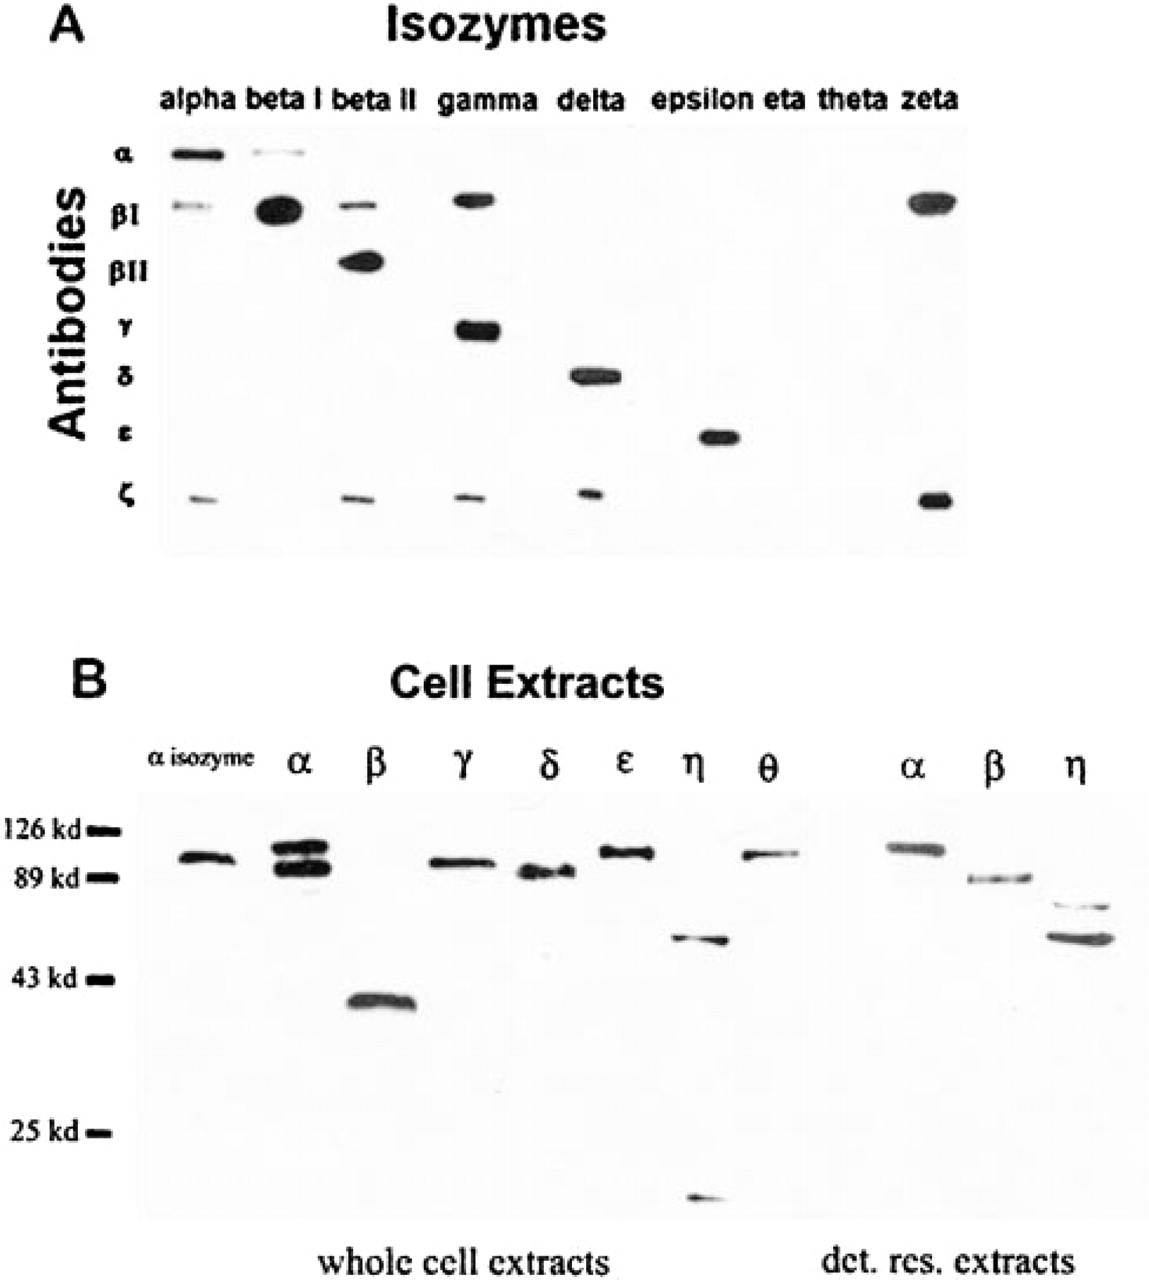
Western blotting analysis of PKC Ab specificity. (
Quantitative Evaluation of PKC Isoform Expression
Differential Induction of Isoform Expression by Serum. Serum can exert a chronic stimulatory effect on cultured cells and has a marked effect on motility and adhesion of the B16 cell line (unpublished data). During tumor growth and metastasis, tumor cells are subjected to a wide range of serum conditions and growth factors in vivo. To understand potential roles played by different PKC isoforms during metastasis, we evaluated the effects of serum on isoform expression. Cells were grown on collagen in the presence or absence of 10% serum, fixed in Fo, and PKC isoform expression evaluated using quantitative confocal microscopy. A significant increase in the expression of all PKC isoforms was observed (p < 0.05) when cells were grown in the presence of serum, with the exception of δ, for which serum-induced increases fell short of statistical significance (p < 0.057) (Table 1). Serum-induced increases in fluorescence intensity were 84% for α, 101% for γ, 100% for ∊, and 106% for η. β2 and δ expression was most markedly increased by serum and showed increases in fluorescence intensity of 281% and 233%, respectively. Expression of θ was the least dependent on serum, and showed an increase in fluorescence intensity of only 30%. These data demonstrate isoform-specific differences in the level of serum-induced expression of PKC isoforms.
Intact Cells Contain High Levels of a and Intermediate Levels of ∊, Whereas Cytoskeletal Preparations Contain High Levels of a, γ, and θ and Intermediate Levels of ∊ and η. We next used quantitative confocal microscopy to examine isoform expression using different fixation protocols. Expression was examined in intact cells fixed with MA or Fo because these fixatives have been used by others in immunocytochemical studies involving PKC. In addition, isoform expression was examined using a cytosk eleton (CSK) fixation protocol shown to stabilize the CSK while extracting detergent-soluble and small water-soluble components (Spudich et al. 1992).
The effect of FBS on PKC isoform expression
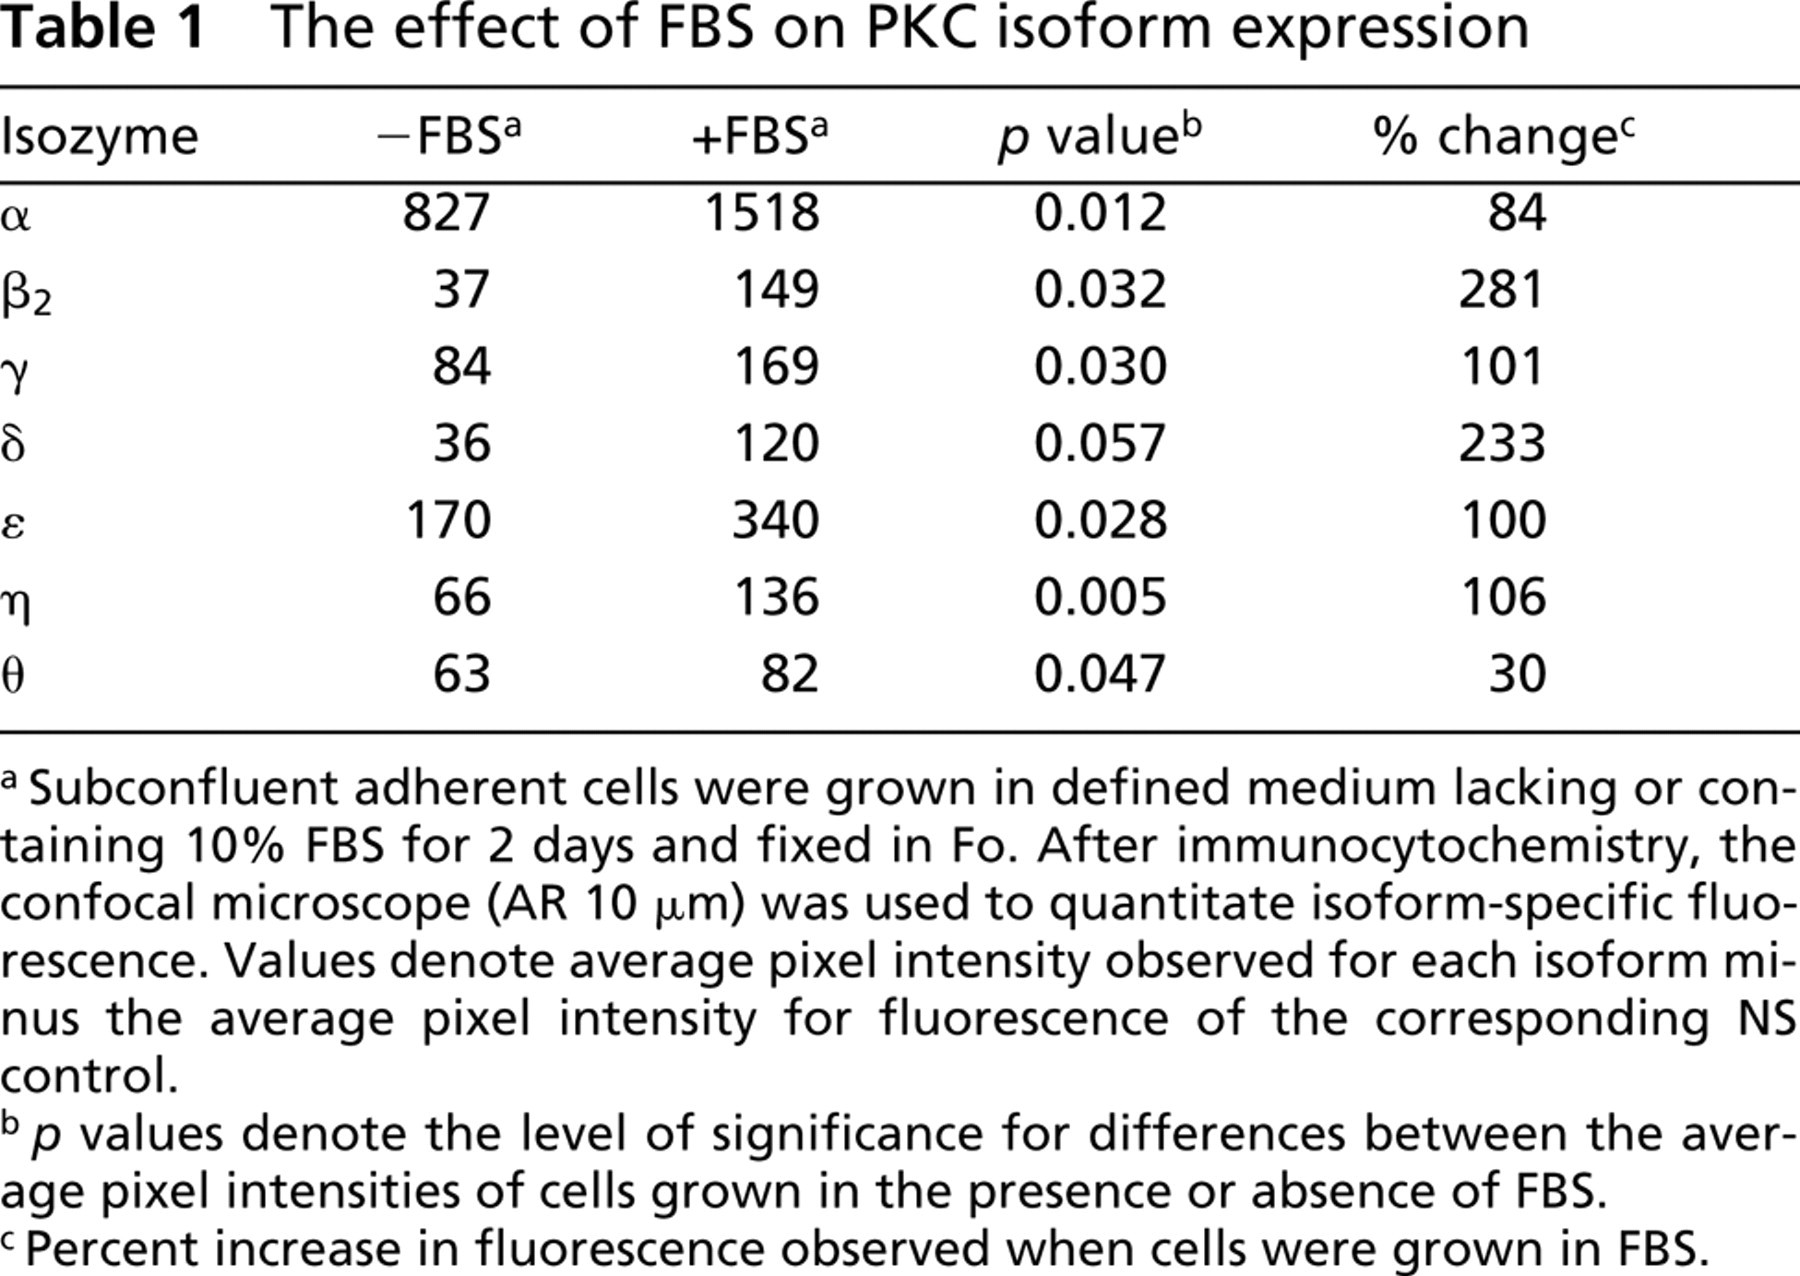
aSubconfluent adherent cells were grown in defined medium lacking or containing 10% FBS for 2 days and fixed in Fo. After immunocytochemistry, the confocal microscope (AR 10 μm) was used to quantitate isoform-specific fluorescence. Values denote average pixel intensity observed for each isoform minus the average pixel intensity for fluorescence of the corresponding NS control.
b p values denote the level of significance for differences between the average pixel intensities of cells grown in the presence or absence of FBS.
cPercent increase in fluorescence observed when cells were grown in FBS.
With all three fixation protocols, B16F10 melanoma cells showed significant expression of all seven isoforms compared with the respective NS controls (p < 0.05; Figure 2). After fixation with either Fo or MA, the greatest fluorescence intensity was observed for PKC α. Intermediate fluorescence intensity was seen for ∊, and low but significant levels of specific fluorescence were observed for the remaining isoforms (Figures 2A and 2B). When quantitative confocal microscopy was used to examine isoform expression in CSK preparations, the intensity of γ and θ isoform-specific fluorescence was very high and was comparable to levels seen for α, whereas the fluorescence intensity for η was comparable to that seen for ∊ (Figure 2C). These data demonstrate for the first time striking in situ detergent-resistant associations of seven PKC isoforms with the B16F10 cytoskeleton and suggest a stabilization and/or enhancement of CSK-associated reactive epitopes by the CSK fixation medium.
Qualitative Analysis of PKC Isoform Localization in Cells Fixed with Fo, MA, or CSK Medium
We next sought to compare patterns of localization of PKC isoforms in intact cells fixed with Fo or MA with the localization of isoforms in cytoskeletal preparations. Accordingly, cells were grown on collagen in serum, fixed with either MA, Fo, or CSK medium, and immunocytochemistry performed. Isoform distribution for cells fixed in MA are shown in frames “a” and “a1” of the figures and are of thick and thin optical slices, respectively. Frame “b” shows cells fixed in formaldehyde, and frame “c” shows cells fixed in CSK medium.
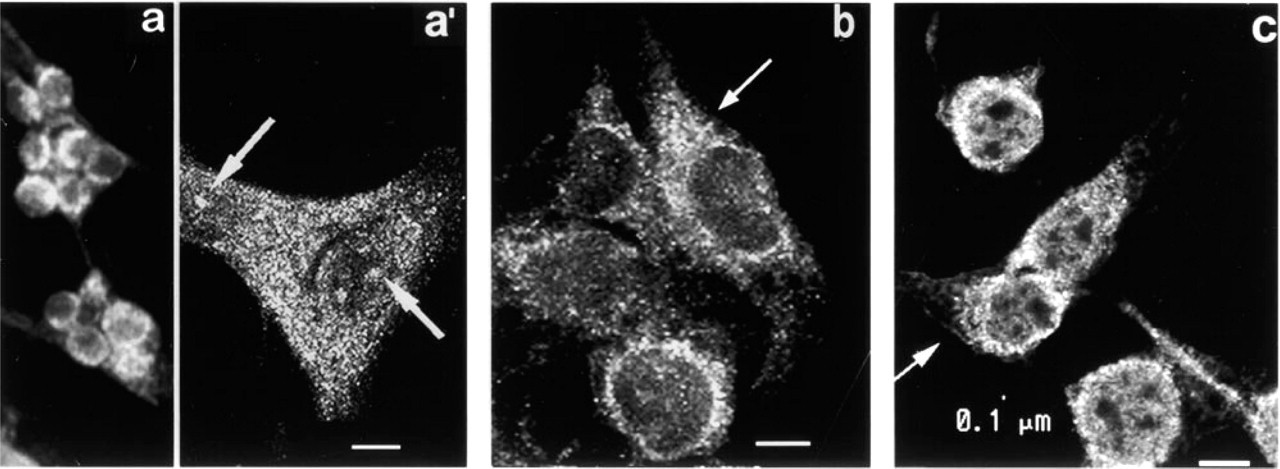
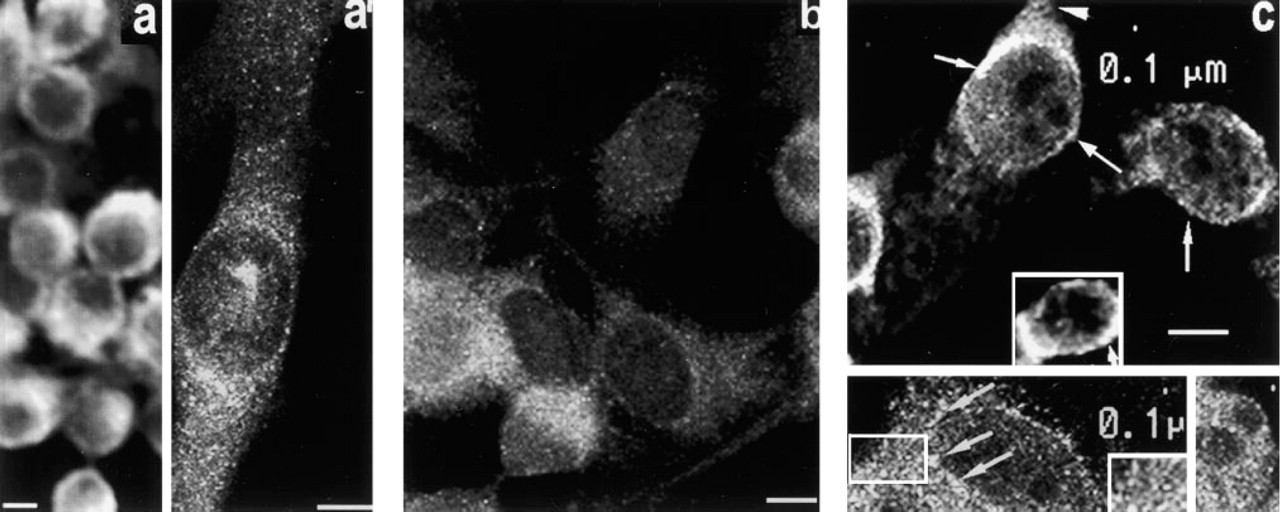
Localization of PKC α. In Figure 3a, diffuse amorphous fluorescence is seen throughout the cytoplasm, and increased fluorescence is seen at the cell periphery where adjacent cells contact one another. Figure 3a 1 offers superior resolution and shows a pattern of irregular granular fluorescence throughout the cytoplasm, along with a diffuse amorphous fluorescence. Little or no increase in intensity is seen at the cell periphery. In fact, fluorescence at the cell periphery is hard to detect in thin optical slices of MA-fixed cells.
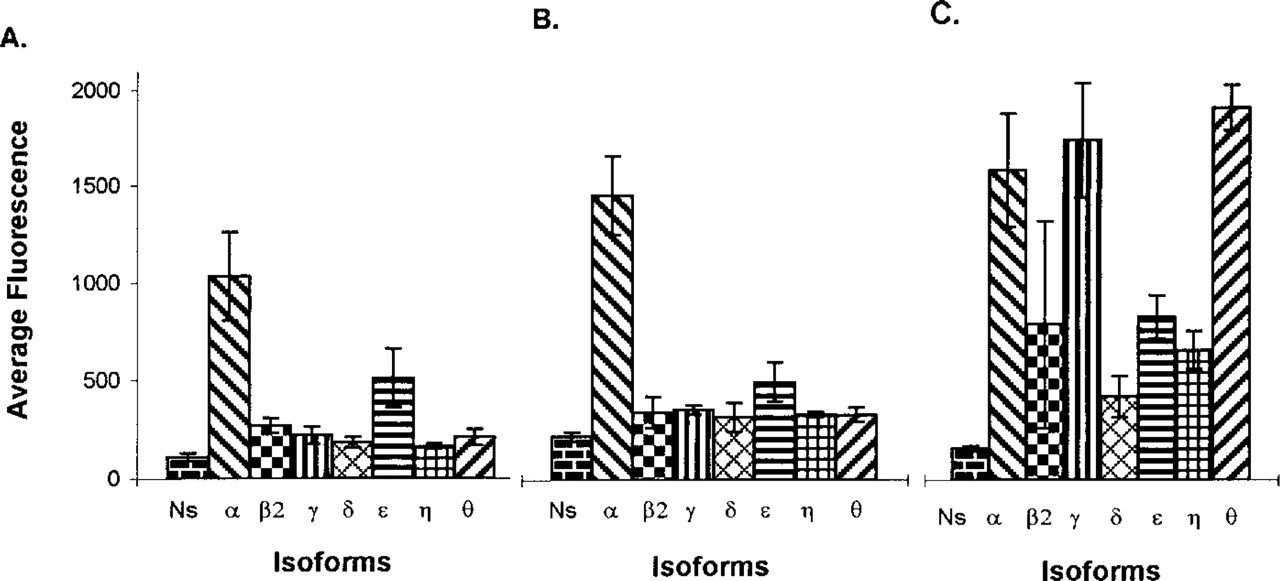
Histograms showing the average pixel intensity of fluorescence for PKC isoforms after use of different fixatives. Cells grown in CM containing 10% FBS were fixed in either (
When cells are fixed in Fo (Figure 3b), both an amorphous and a granular fluorescence are seen throughout the cytoplasm. The top frame, from the focal plane where the cell contacts the substrate, shows plaque-like regions of intense fluorescence at the ends of cell processes (arrowheads). A rim of fluorescence is typically present at the cell periphery (inset) and has a punctate appearance when viewed at high magnifications (arrows). Because the actin filaments at the periphery of many cells are often disrupted in cancer cells, we examined whether polymerized actin was present in the periphery of B16F10 cells and might therefore serve as docking sites for PKC binding proteins. When cells are grown in the presence of serum, fixed with Fo, and stained with rhodamine-phalloidin, intense staining is seen at the cell periphery. However, this fluorescence is continuous and not punctate (Figure 3b, bottom frame).
When cells are fixed with CSK medium, intensely fluorescent cytoplasmic granules/vesicles are present (Figure 3c). In a plane below the nucleus (lower frame), cytoplasmic fluorescence consists of intensely fluorescent granules/vesicles of various sizes that are sometimes clustered together, forming longitudinal arrays (arrows). This fluorescence appears to merge with fluorescence in the perinuclear region. Many granules/vesicles present in the cytoplasm are larger than 0.1 μm in diameter. In a plane above the nucleus (upper frame), aggregates of intensely fluorescent particles are present. At the nuclear perimeter, these aggregates appear to be adjacent to a dimly fluorescent sieve-like network of small particles with dim fluorescence (inset). Little or no fluorescence is observed at the cell periphery. To determine whether CSK treatment might have disrupted the peripheral rim of actin present in this location, cells were treated with CSK medium and stained with rhodamine-phalloidin. Results obtained (not shown) were indistinguishable from those seen in Figure 3b, demonstrating that the peripheral actin cytoskeletal framework is not perturbed by CSK treatment. Thus, detergent-resistant α is present in granules/vesicles arranged linearly in the basal portion of the cell, dispersed all throughout the cytoplasm as small granules/vesicles, and as aggregates of granules adjacent to a sieve-like α-rich structure at the apical nuclear surface.
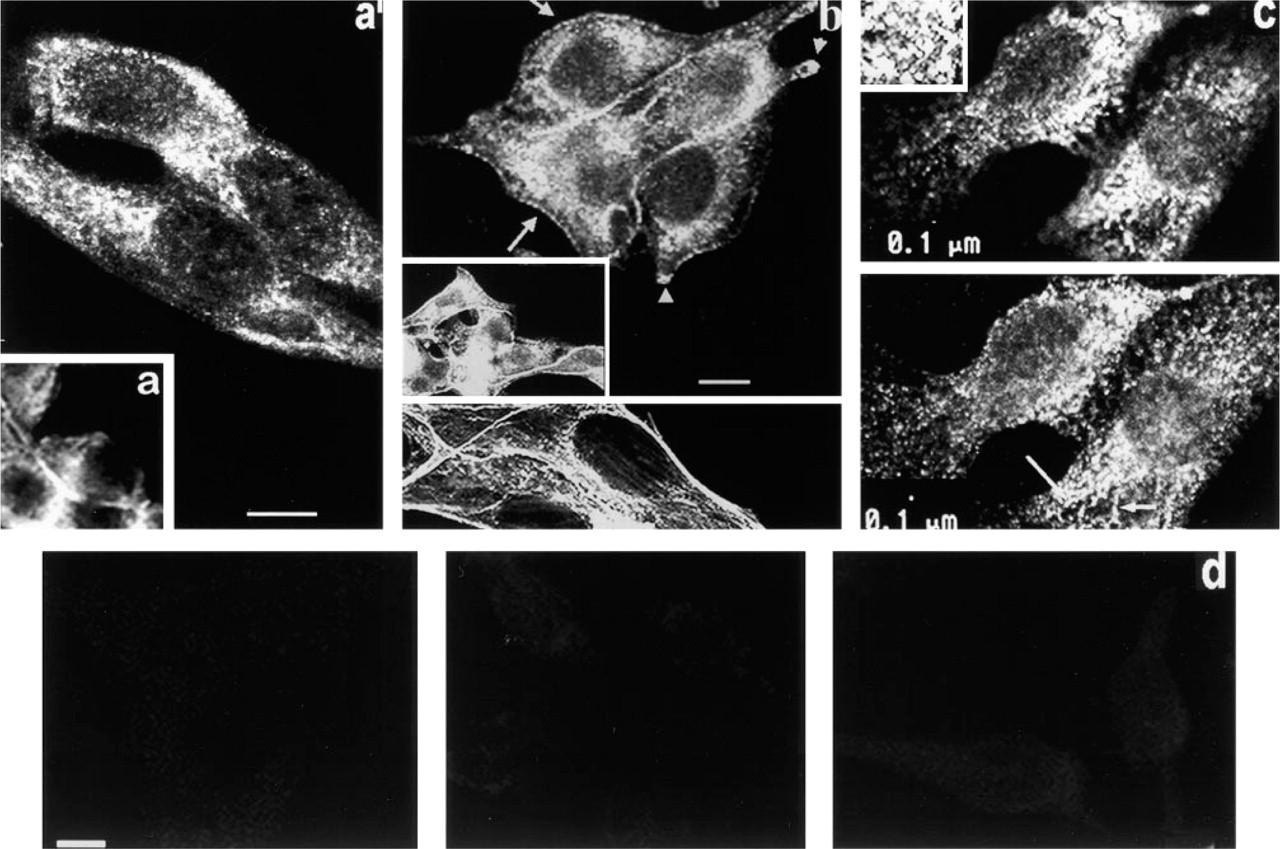
The fluorescence of representative NS controls utilizing different fixatives is shown in Figure 3d. From left to right, cells were fixed with MA (frame a), Fo (frame b), or CSK medium (frame c). Additional controls, including cells stained with primary Ab only or secondary Ab only, were indistinguishable from the NS controls shown above.
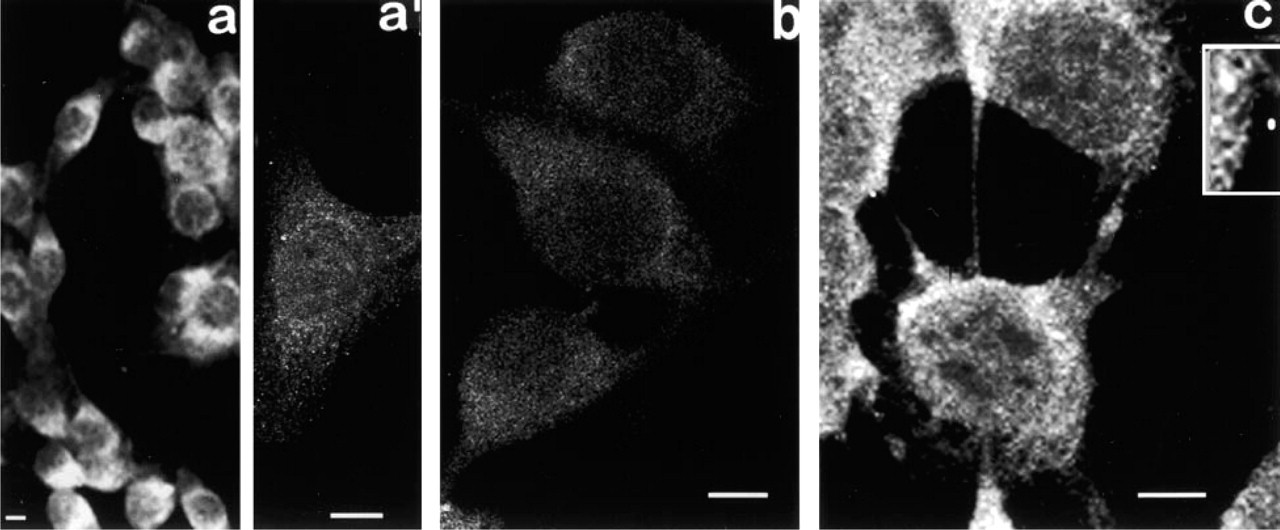
Localization of PKC β2 . Thick optical slices of cells fixed in MA show that PKC β2 fluorescence is most intense around the nucleus (Figure 4a). Thin optical slices show cytoplasmic fluorescence in the form of granules/vesicles (Figure 4a 1) and discrete patches of intense fluorescence are associated with the nucleus (arrow).
Thin optical slices of cells fixed in Fo (Figure 4b) show fluorescent granules/vesicles concentrated around the nucleus and aggregates of highly fluorescent particles in one or more regions of the cytoplasm (arrow). Little or no fluorescence is seen at the cell periphery. The patches of fluorescence associated with the nucleus seen after MA fixation are not observed.
Cells fixed with CSK medium show intense granular/vesicular fluorescence around the nuclear perimeter (Figure 4c). Cytoplasmic granules are small (approximately 0.1 μm in diameter) and uniform in size. In this focal plane, taken immediately above the substrate, highly fluorescent granules are present in long thin cell processes. A thin rim of dim fluorescence is occasionally seen at the cell periphery (arrow).
Fluorescence micrographs of PKCα. (
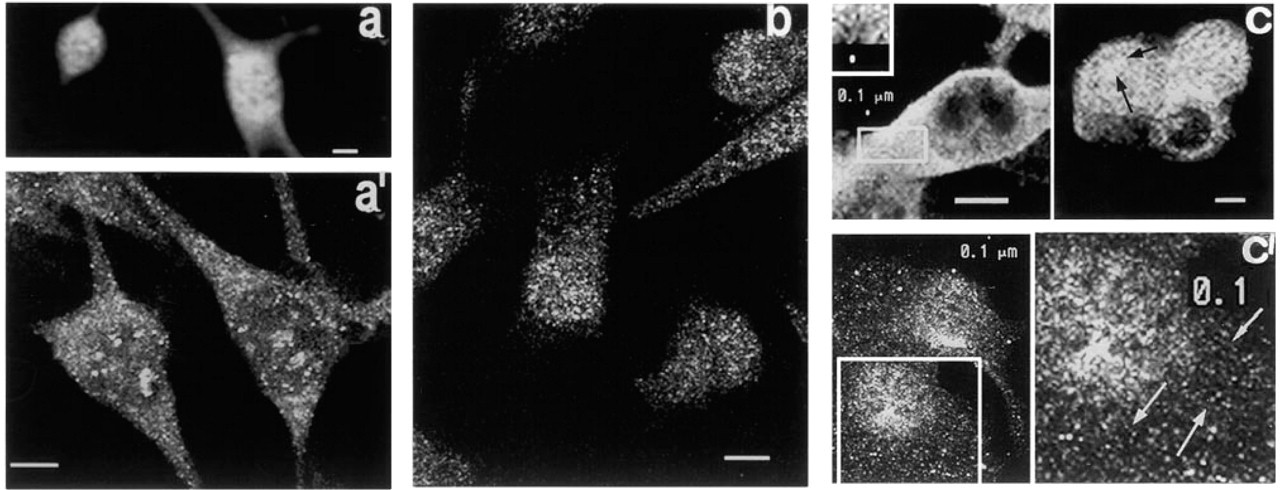
Localization of PKC γ. Examination of thick optical slices of cells fixed in MA shows that fluorescence is most intense in the cytoplasm adjacent to the nucleus (Figure 5a). In thin optical slices, a dim, barely detectable fluorescence is seen throughout the cytoplasm and sometimes appears to be concentrated in the perinuclear region (Figure 5a 1).
Thin optical slices of cells fixed in Fo show barely detectable fluorescence (Figure 5b).
After fixation in CSK medium, the detergent-resistant CSK shows very strong γ-fluorescence (Figure 5c), mostly in the form of abundant, densely packed cytoplasmic granules/vesicles in a broad region around the nucleus. Individual granules/vesicles are typically very small, and densely packed together. These granules appear to be associated with a homogeneous dimly fluorescent framework (Figure 5c, inset).
Localization of PKC δ. Thick optical slices of cells fixed in MA (Figure 6a) show intense fluorescence around the nucleus, and in thin elongated cellular processes. In thin optical slices (Figure 6a 1), granular fluorescence is seen in the cytoplasm and discrete areas of fluorescence are seen within the nucleus. Visualization of the same cells with phase-contrast microscopy reveals that the areas showing nuclear fluorescence are superimposable with nucleoli (not shown).
Fluorescence micrographs of PKC-β2 (
Thin optical slices of cells fixed with Fo are shown in Figure 6b. A dimly fluorescent rim of punctate fluorescence is sometimes present at the cell periphery (arrow), and many highly fluorescent particles of various sizes are seen throughout the cytoplasm. The nucleolus-associated fluorescence that was seen after MA fixation is not observed.
Figure 6c is a very thin optical slice from a CSK preparation, showing many granules/vesicles through out the cytoplasm, most of which appear to be greater than 0.1 μm in diameter. The inset at lower left is from the area above the nucleus shown within the rectangle, and shows that highly fluorescent particles concentrated around the nuclear perimeter are aggregates of granules/vesicles. These aggregates appear to be associated with an orderly or net-like array of very small, regularly arranged granules with dim fluorescence. Larger, highly fluorescent particles are seen within filopodia (arrow). Examination of a thin optical slice in a plane where the cell contacts the substrate (Figure 6c 1, left) shows intensely fluorescent patches (arrowheads) associated with cell processes, and dim punctate fluorescence in thin elongated cell processes (large arrow). Figure c1 (bottom right) is a serial section of the cell to the left and shows intense perinuclear fluorescence, large arrow. In rounded portions of flattened cells (Figure c1, top right), particles greater than 0.1 μm in diameter are sometimes arranged single file along gently curving arcs that appear to run parallel to the cell surface (arrows). Therefore, aggregates of detergent-resistant δ are present at the nuclear surface in apparent association with a net-like array of very small granules, as structures resembling adhesion plaques, as granules/vesicles in curvilinear arrays in the cytoplasm, and in filopodia.
Fluorescence micrographs of PKCγ. (
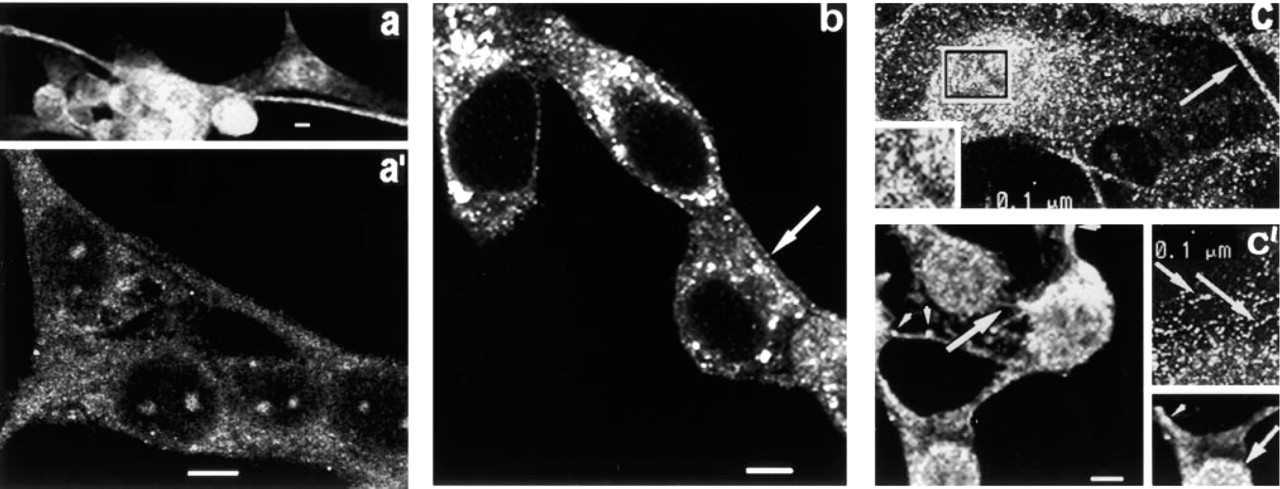
Fluorescence micrographs of PKCδ. (
Localization of PKC ∊. In thick optical slices of cells fixed in MA, dim fluorescence is present throughout the cell and becomes intense around the nucleus (Figure 7a). In thin optical slices (Figure 7a 1), highly fluorescent patches were observed in the nuclear region in two of four experiments, and were circumferentially arranged at the nuclear perimeter (inset). It is not clear why these ∊-rich structures were visualized only in half of the experiments, or why they are observed only after MA fixation and not after Fo fixation (see below). A very dim amorphous fluorescence is seen throughout the cytoplasm.
Figure 7b shows images obtained in thin optical slices of cells fixed in Fo. Cytoplasmic fluorescence is intense and consists of densely packed, highly fluorescent granules/vesicles arranged linearly and parallel to the long axis of flattened cells. A rim of punctate fluorescence is often seen at the cell periphery (arrow). The highly fluorescent nuclear regions seen after MA fixation are not observed, and little or no fluorescence is seen in the nucleus.
After treatment of cells with CSK medium, an optical slice taken above the substrate (Figure 7c) shows that particles at least several tenths of a micrometer in diameter are seen in the cytoplasm around the nucleus. Some of these large particles (thin double arrows) may be aggregates of smaller granules/vesicles. Elsewhere, granules/vesicles of various fluorescence intensities are seen in longitudinal arrays throughout the cytoplasm, especially in cell processes (arrows). A network of dimly fluorescent amorphous strands is also seen in the cytoplasm (arrowheads).
Localization of PKC η. Thick optical slices of cells fixed with MA show strong cytoplasmic fluorescence in the perinuclear region and throughout the adjacent cytoplasm (Figure 8a). In thin optical slices (Figure 8a 1) cytoplasmic staining is dim and particulate and is concentrated around the nucleus. One or more highly fluorescent regions are associated with the nucleus.
Fluorescent micrographs of PKC∊. (
In thin optical slices of cells fixed with Fo, amorphous fluorescence is seen throughout the cytoplasm, along with highly fluorescent granules. Considerable cell-to-cell variation exists in the intensity of the cytoplasmic fluorescence. The fluorescent granules appear to be concentrated in a broad zone around the nuclear region (Figure 8b). The discrete regions of intense fluorescence associated with the nucleus after MA fixation are not observed.
Fluorescence micrographs of PKCη. (
Images of detergent-resistant η obtained after treatment of cells with CSK medium are shown in Figure 8c. The upper frame is a thin optical slice showing fluorescent granules against a dimly fluorescent cytoplasmic framework (arrowhead). Regions of intense fluorescence are seen at the periphery of the nucleus (arrows). Some cells have highly fluorescent cylindrical or oblong structures adjacent to the nucleus (inset, arrow; 0.1 μm scale bar). However, in thinner optical slices (bottom frame) aggregates of intensely fluorescent particles are seen in this location (arrows). Their additive fluorescence when viewed in a thicker optical slice presumably contributes to the images of cylindrical structures seen in this location in the top frame (inset). The inset (bottom frame, left) is an enlargement of the area within the rectangle, and shows very small, densely packed granules with dim fluorescence. A sparse population of larger, highly fluorescent granules with an apparently random distribution is also present. The bottom frame (right) is an optical slice showing small dimly fluorescent and larger highly fluorescent granules in the cytoplasm immediately above the nucleus.
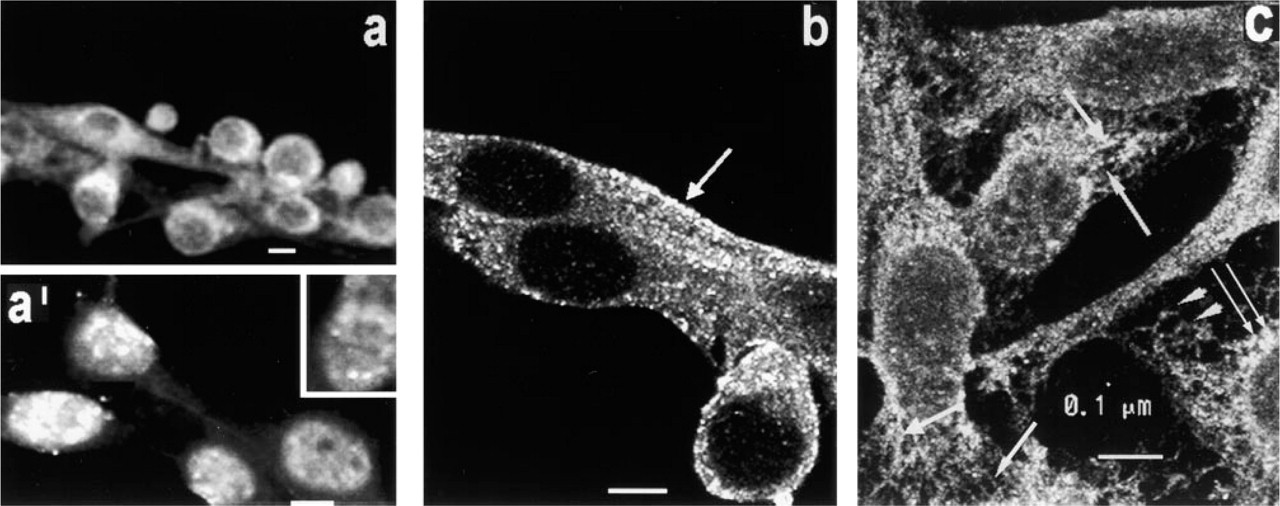
Localization of PKC θ. Figure 9a is a thick optical slice of cells fixed in MA, showing intense patchy fluorescence over the nuclear region and dim cytoplasmic fluorescence. In thin optical slices, densely packed small granules with dim fluorescence are seen throughout the cytoplasm (Figure 9a 1), and many highly fluorescent patches of varying sizes and shapes appear to be associated with the nucleus.
Figure 9b is a thin optical slice through cells fixed in Fo, showing dim granular fluorescence throughout the cytoplasm and more intense granular fluorescence around the nuclear region. The regions of intense patchy fluorescence seen after MA fixation are not observed.
After treatment with CSK medium, an optical slice in a plane through the nucleus shows intense particulate cytoplasmic fluorescence adjacent to the nucleus (Figure 9c, left). The inset, an enlargement of the area within the rectangle, shows that most granules are small, fairly uniform in size, and densely packed together. In an optical slice taken immediately above the nuclear perimeter of three cells (Figure 9c, right), dense, irregularly shaped clusters of highly fluorescent particles appear to be closely associated with the nucleus (arrows). In thinner optical slices (Figure c1, left), irregular patches of intense fluorescence are seen at the nuclear perimeter, forming arrays of various shapes, while a population of smaller granules with dim fluorescence is present throughout the cytoplasm. In Figure c1 (right), an enlargement of the area contained within the square to the left shows many arrays of small granules less than 0.1 μm in diameter arranged in longitudinal arrays (arrows).
Fluorescence micrographs of PKCθ. (
Co-localization of Actin with PKC α, ∊, and θ
The appearance of the actin cytoskeleton varied from cell to cell and with the optical plane through each cell. However, actin filaments (Figures 10b, 10e, 10h, and 10k) were typically present at the basal portion of the cell, around the cell periphery, as a dense lattice of short branching irregular filaments and as punctate deposits or very short filaments around the nucleus. In optical slices adjacent to the nucleus, actin is observed as granules (Figures 10e and 10k) in the apical cytoplasm adjacent to the nucleus, where it co-localizes with granules of α (Figure 10c). Co-localization of actin and ∊-granules is seen throughout the cell and in thin elongated cell processes (Figure 10f). Actin also co-localized with discrete, irregularly shaped patches of small θ-granules at the nuclear surface (Figure 10i). Although portions of thin cytoplasmic extensions occasionally appear to contain co-localized actin and δ (Figure 10l), examination of serial optical sections (not shown) suggests that this more likely reflects close proximity of these proteins rather than co-localization. Little or no co-localization of actin is seen for the other isoforms.
Co-localization of Vimentin with PKC δ and β2
Vimentin staining patterns (Figures 11b and 11e) are highly variable. In some cells an organized pattern of filaments with the appearance of dots connected by fine strands (Figure 11b) is observed, whereas in most cells an apparently disorganized pattern of vimentin “dots” is seen throughout the cytoplasm. Co-localization of vimentin is seen with δ in perinuclear cytoplasmic granules and as small punctate dots in cell processes (Figure 11c), whereas co-localization with β2 is seen in granules throughout the cytoplasm but concentrated around the nucleus (Figure 11f).
Co-localization of Tubulin with PKC θ
Microtubule staining with FITC-labeled Ab is seen throughout the cell but is most intense radiating out from the region of the MTOC. α-Tubulin staining is very intense in irregularly shaped and crescent-shaped regions at or near the surface of the nucleus (Figure 12a). Tubulin in the region of the MTOC, in intensely fluorescent patches at or near the nuclear surface and, to a lesser extent, in more distally located microtubules, co-localizes with θ (Figure 12c).
Discussion
Biochemical studies have shown that activation of PKC leads to translocation from the cytosol to the particulate fraction and is typically dependent on phospholipids and DAG. Although the particulate fraction sedimenting at 100,000 × g contains plasma membrane as well as many cytoskeletal components, it had often been assumed that the activated PKC in it originated from plasma membrane. However, recent immunocytochemical studies demonstrate localization of specific isoforms to various cell compartments, including the Golgi, ER, nucleus or phagosome, or to the cytoskeleton (Jaken et al. 1989; Gregorio et al. 1992; Spudich et al. 1992; Barry and Critchley 1994; Disatnik et al. 1994; Saxon et al. 1994; Goodnight et al. 1995). Although these studies have utilized a variety of different fixatives, only a few have been performed using cytoskeletal preparations. Although differences in PKC isoform localization reported in the literature have been largely attributed to differences in the cell type examined, it is unclear whether the use of different fixatives may have contributed to observed differences.
In this study we used quantitative and qualitative confocal microscopy to examine PKC isoform expression and localization in the B16F10 melanoma cell. Using quantitative confocal microscopy, we demonstrate that seven isoforms show significant expression, regardless of the method of fixation used. Quantitative confocal microscopy also showed that serum increases expression of all PKC isoforms. To our knowledge, this is the first study to demonstrate quantitative differences in the levels of induction of PKC isoforms by serum. Because tumor cells must perform diverse functions in vivo in environments that vary widely in serum content, a differential expression of specific isoforms in response to various concentrations of serum or growth factors could be important factors in modulating the ability of PKC to regulate metastatic potential.
Quantitative confocal microscopy shows significant specific fluorescence of all isoforms in CSK preparations (Figure 2). Interestingly, γ and θ showed a marked fluorescence in CSK preparations but only modest expression in intact cells fixed with Fo or MA. In fact, the data in Figure 2c suggest that γ, θ, α, ∊, and η may play major roles in regulating the function of the B1F10 cytoskeleton. Data also suggest that the CSK fixation medium may protect PKC isoform-cytoskeleton associations lost or masked by fixation with Fo or MA.
Qualitative confocal microscopy revealed that all seven isoforms associate with specific and varied regions of the detergent-resistant cytoskeleton. It is noteworthy that many of these associations were difficult or impossible to detect after fixation with Fo or MA. In part, this may be due to special properties of the CSK medium, including (a) cytoskeleton-stabilizing properties, (b) protease inhibitory properties, (c) a low concentration of calcium, and/or (d) increased exposure of isoform-specific epitopes during fixation. In addition, cytoskeletal associations sometimes appeared to be partly masked by a dim homogeneous fluorescence, presumably of soluble isozyme, in MA- or Fo-fixed preparations, while small proteins and soluble PKC would be extracted during fixation in CSK media (Spudich et al. 1992).
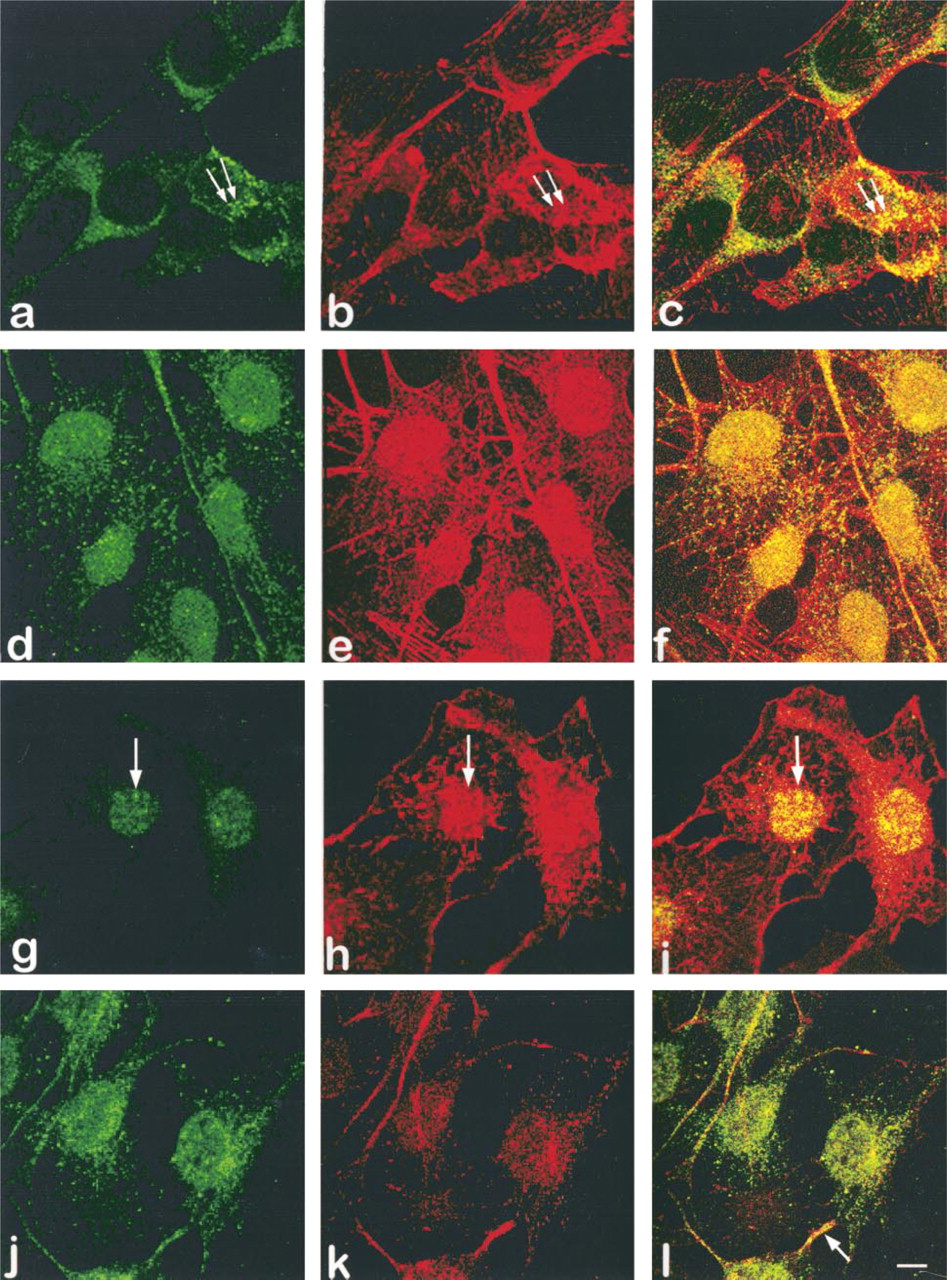
Co-localization of PKCα, ∊, and θ with actin. PKC isoform fluorescence is shown in green, actin fluorescence in red, and co-localization of isoform and actin in yellow. Fluorescence for α, ∊, θ, and δ is seen in
It is also interesting to note apparent differences in isoform localization resulting from the use of MA and Fo. Most notably, nucleus- and/or nucleolus-associated fluorescence of β2, δ, ∊, and η is seen in cells fixed with MA but not after fixation with Fo, whereas localization of detergent-soluble isoforms to the cell periphery is prominent in thin optical slices after Fo fixation (a) but is barely detectable or undetectable after fixation with MA.
Varied localization of different isoforms to the detergent-resistant cell framework is in accord with recent biochemical studies. Localization of PKC isoforms to specific sites at which they may interact with appropriate substrates is believed to be mediated by binding proteins that have been identified in preparations of the Triton-X-insoluble particulate fraction. Receptors for activated C kinase (RACKS) bind only activated PKC and are not substrates for this enzyme. However, STICKS (substrates that interact with C-kinase) may bind PKC as well as phosphatidylserine and, when phosphorylated, may demonstrate an altered ability to bind the kinase (Wolf and Sahyoun 1986; Mochly-Rosen et al. 1991; Chapline et al. 1993; Mochly-Rosen 1995; Mineo et al. 1998). In the present study, the patterns of fluorescence observed in CSK preparations may reflect localization of either activated or partially activated isoforms. However, activation would be consistent with the unusually high levels of DAG in B16 melanoma cells (Brooks et al. 1993), by our inclusion of serum in the media, and by our use of collagen (an extracellular matrix-generated stimulus) as a substrate. In the latter regard, it is interesting to note that activation of PKC by collagen can result in different localization from that observed after treatment with phorbol ester (Zhou et al. 1996).
The localization of seven different PKC isoforms to varied and specific locations in the detergent-resistant cytoskeleton is consistent with studies demonstrating regulation of the structure and morphology of the cytoskeleton by PKC, with reports of multiple effects of PKC stimulation on the B16 cytoskeleton, and with the large number of cytoskeletal substrates phosphorylated in vitro by PKC (Timar et al. 1993). To date, little is known about in situ associations of different isoforms with the cytoskeleton. The present study demonstrates varied cytoskeletal associations of seven isozymes in a single cell type and identifies the B16F10 cell line as a model for examining the localization and regulation of diverse cytoskeletal activities by these isoforms.
All cytoskeleton-associated PKC isoforms in the B16F10 cell have the appearance of cytoplasmic granules or vesicles. Depending on the isoform, these granules/vesicles may have an apparently random or irregular distribution, or they may be packed together in distinctive orderly arrays. Granules/vesicles rich in α, δ, ∊, and θ are arranged in linear arrays or in gently curved arcs that differ in particle size and/or the region of the cell at which they are localized (compare Figures 3c, 6c, 7c, and 9c). Orderly arrangements are also characteristic of the dimly fluorescent small perinuclear granules of α and δ (Figure 3c and 6c, top frame, insets) and the dimly fluorescent cytoplasmic granules of θ (Figure 9c, bottom frame, right). Furthermore, some α-, γ-, and δ-rich granules appear to be associated with a dimly fluorescent framework or network. Whereas γ is associated with an apparently homogeneous scaffold that projects from the periphery of the nucleus into the adjacent cytoplasm, the detergent-resistant perinuclear scaffolds for δ and α have a sieve or net-like appearance. There is an isoform-specific variation in detergent-resistant granule/vesicle size. Granules range in size from less than 0.1 μm in diameter to more than 0.5 μm in diameter. The highly fluorescent granules of α and δ vary greatly in size, and many appear to be several tenths of a micrometer in diameter. In contrast, most of the intensely fluorescent granules for PKC β2, γ, and η are smaller (less than 0.1 μm in diameter) and uniform in size, although larger granules are occasionally seen. For some isoforms, many granules tend to form large highly fluorescent aggregates or patches at or near the nuclear surface.
In view of the known involvement of PKC in regulating cell motility and the structure and function of the B16 cytoskelon, we investigated isoform co-localization with actin, vimentin, and tubulin in the B16F10 melanoma cell. Under the culture conditions used in this study, B16F10 cells are actively dividing, moving, and spreading, necessitating a constant remodeling of the cytoskeleton. Interestingly, actin appears to co-localize with three different isoforms (α, ∊, and θ) in different regions of the cell (Figure 10). It is important to note that light microscopic studies can not determine whether this “co-localization” reflects associations of these isoforms with actin or with one of the cytoskeletal proteins associated with actin. Co-localization with θ is observed in discrete patches associated with the nucleus or the nuclear perimeter. Co-localization with α occurs in cytoplasmic granules adjacent to the apical portion of the nucleus, and with ∊ in granules throughout the cytoplasm. Rhodamine identifies only actin polymers (regardless of length), and we often observe co-localization of α and ∊ with actin in granules when actin filaments could not be detected. Therefore, our results suggest that α and ∊ co-localize with short filaments or polymers of actin that, owing to resolution constraints imposed by light microscopy, have the appearance of granules. The association of θ and α with actin granules around the nucleus (Figure 10c) and of PKC ∊ with short actin filaments throughout the cytoplasm would be consistent with a possible role for these isoforms in the remodeling of actin filaments, and further suggests that different PKC isoforms may be involved in regulating different stages of remodeling and/or maintenance of the actin cytoskeleton (perhaps by phosphorylation of different actin-associated cytoskeletal proteins).
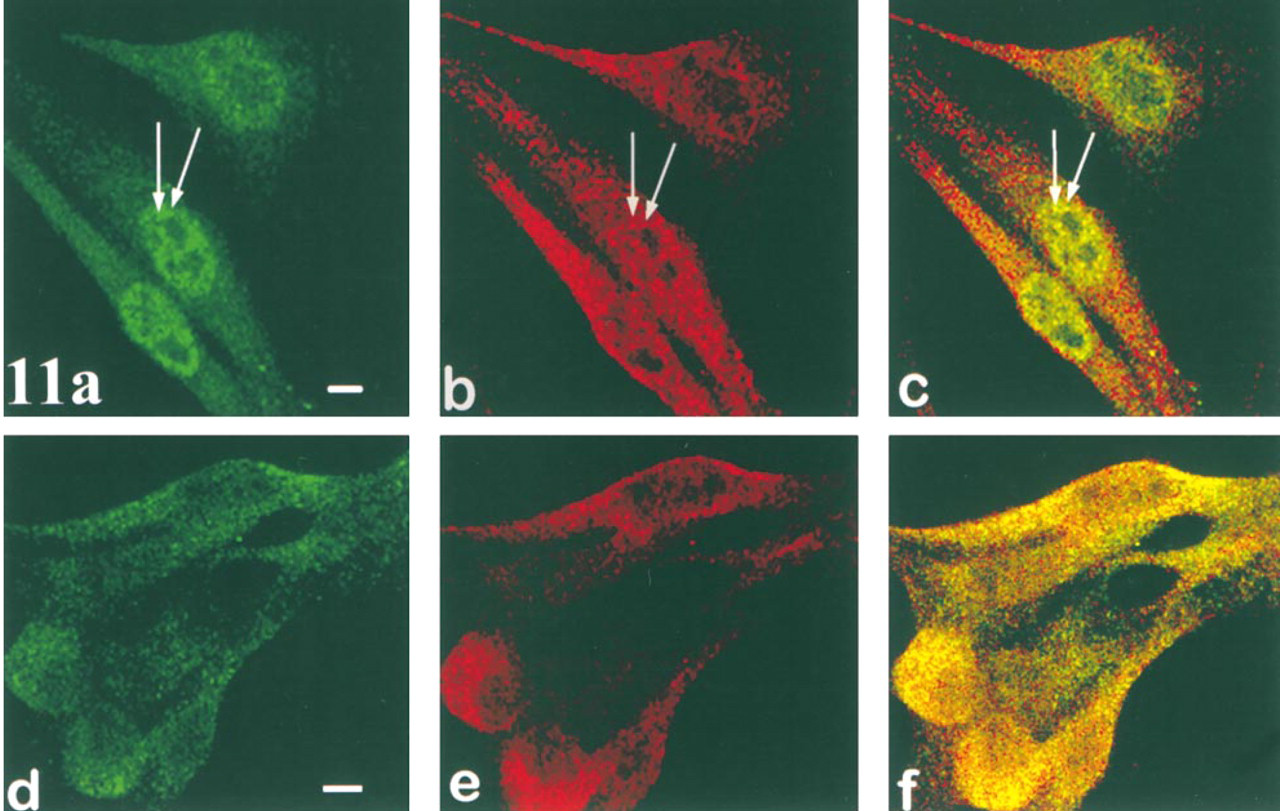
Co-localization of PKCδ and β2 with vimentin. Isoform fluorescence alone is shown in green for δ (
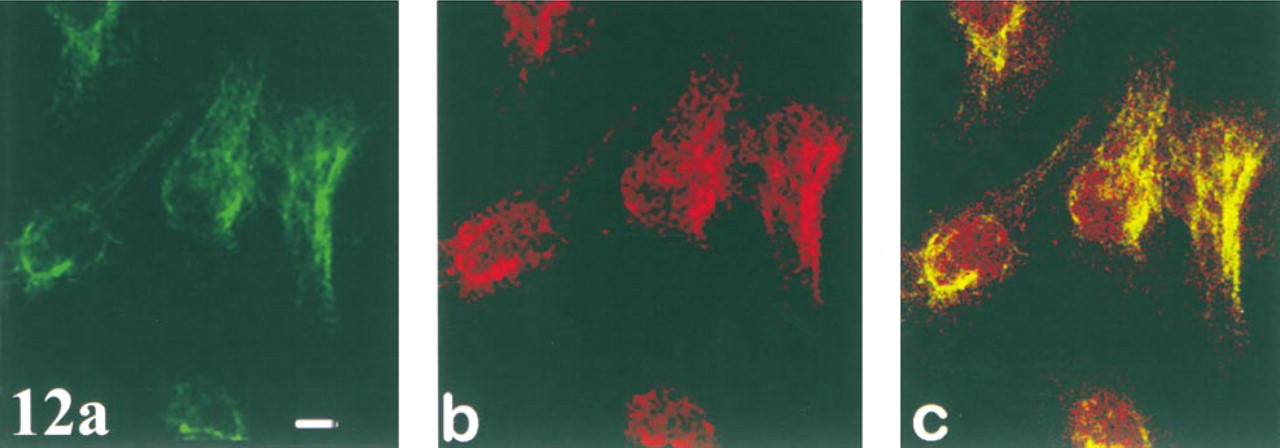
Co-localization of PKCδ with α-tubulin. In this panel, green denotes fluorescence of the α-tubulin Ab (
Functions for PKC isozymes in regulating the structure and/or function of the vimentin cytoskeleton are further suggested by the findings that vimentin co-localizes with perinuclear particles of δ, with longitudinal arrays of δ-granules in cytoplasmic processes, and with β2-granules throughout the cytoplasm. By conventional fluorescence microscopy, vimentin filaments in CSK have the appearance of dots connected by thin strands (unpublished data). However, with confocal microscopy the filaments appear as dots arranged linearly (Figures 11b and 11c), and are visualized only in a minority of B16F10 cells. In most cells, vimentin appears as dots or granules concentrated around the nucleus and more sparsely distributed in peripheral regions of the cytoplasm. Interestingly, Prahlad et al. (1998) examined vimentin filament remodeling and found that filaments disassembled in the cell periphery and were reconstituted from dot-like vimentin precursors localized in the juxtanuclear region. Growing filaments consisted of dot precursors, and growth was dependent on a rapid MT-dependent movement of precursors towards more peripheral regions of the cytoplasm, where they assembled into short fibrils. The dotlike vimentin precursors co-localized with conventional kinesin, suggesting that a kinesin MT-dependent motor is required to actively maintain the IF network in its normal extended configuration. Our observations are consistent with a hypothesis of active remodeling of vimentin filaments, and with Prahlad's observations of a concentrated dot-like arrangement of vimentin dot precursors in the perinuclear region and filament elongation in the peripheral cytoplasm (data not shown).
Finally, our data suggest that tubulin (or MAPs) co-localize(s) with θ at the nuclear perimeter and in the MTOC, and suggest one or more roles for this isozyme in regulating the remodeling, organization, and/or function of microtubules. Because θ also appears to co-localize with actin in the perinuclear region, our data also suggest that a single isoform may regulate the structure and/ or function of two major cytoskeletal networks.
In addition to the findings described above, there are several possible explanations for the association of PKC isoforms with detergent-resistant granules/vesicles. Caveolae, membrane microdomains containing caveolins, can cycle between a flattened form at the cell surface and invaginations that form vesicles. Caveolins serve as scaffolding proteins for organizing signaling complexes at the plasma membrane and appear to function as general kinase inhibitors (Smart et al. 1994; Okamoto et al. 1998). PKC α has been shown to be targeted to caveolae in unstimulated cells, and several PKCs are enriched in biochemical preparations of caveolae (Smart et al. 1994; Mineo et al. 1998; Rybin et al. 1999). Caveolae are detergent-resistant (Okamoto et al. 1998) and have been demonstrated in melanoma cells (Stahl and Mueller 1995). Caveolae were difficult to visualize in B16F10 cells and could be demonstrated only after incubation of cells in the absence of FBS, conditions that typically rendered isoform expression barely detectable. Despite an extensive effort, we were unable to co-localize caveolin 2 with PKC isozymes in CSKs (data not shown). These negative findings are in keeping with our hypothesis that the combination of FBS and cell growth on collagen activates PKC, and with findings by others that PKC co-localizes with caveolae only in unstimulated cells. Other possibilities for isoform co-localization with vesicles/granules would include detergent-resistant components of clathrin- or coatomer-coated vesicles, or mitochondria. A PKC association with coatomer proteins is supported by the characterization of the coatomer protein B-COP as an RACK specific for PKC ∊ (Csukai et al. 1997), and an association of ∊ with mitochondrial membranes and vesicles has been described (Saito et al. 1993).
It is instructive to compare our findings with immunocytochemical studies describing PKC isoform localization to the detergent-resistant cytoskeleton in other cell types. PKC α localizes to focal contacts in fibroblasts (Jaken et al. 1989) and to the brush border of unstimulated enterocytes (Saxon et al. 1994). Our study is the first to demonstrate co-localization of α with perinuclear actin.
The co-localization of β2 with vimentin in melanoma cells is consistent with the localization of this isoform to vimentin filaments in rat basophil leukemia cells (Spudich et al. 1992) and in HL60 cells (Owen et al. 1996). PKCβ has also been shown to localize to actin-rich filaments in transfected fibroblasts overexpressing β2 (Goodnight et al. 1995), to spectrin and ankyrin in mouse lymphocytes (Gregorio et al. 1992), to the brush border of unstimulated enterocytes (Saxon et al. 1994), and to proteins associated with tubulin in U937 cells. It should be noted that because vimentin precursors co-localize with conventional kinesin and appear to require transport by microtubules, a true co-localization of PKC with a protein such as kinesin could result in images suggestive of co-localization with either tubulin or vimentin.
PKCγ is found predominantly in neurons and, to our knowledge, has not previously been reported to associate with the cell cytoskeleton. Our finding of endogenous expression of γ in neuroectoderm-derived melanoma cells is important because it presents a unique model for studying the cytoskeletal localization and function of this isoform in non-neuronal cells.
PKCδ is present in newly formed focal adhesions in 3T3 fibroblasts (Barry and Critchley 1994), to a filamentous network in cardiac myocytes (Disatnik et al. 1994), and to microtubules (Volkov et al. 1998). Our study extends these findings by demonstrating co-localization of δ with perinuclear vimentin granules and with vimentin filaments.
PKC∊ localizes to the cytoskeleton in the apical junctional complex region of unstimulated enterocytes (Saxon et al. 1994), to actin in nerve endings (Prekeris et al. 1986), and to fibrillar components (cross-striations) of myofibrils in cardiac myocytes (Disatnik et al. 1994). Using recombinant truncated regions of PKC∊, multiple localization signals have been found for this isoform (Lehel et al. 1995). This work suggests that, in the holoenzyme, the dominance or binding of each signal may be affected by conformational changes of the enzyme, resulting in differential cellular localization. We describe a co-localization of ∊ to randomly dispersed granules of polymerized actin throughout the cytoplasm and to linear arrays of tiny actin filaments (dots). Because many detergent-resistant ∊-granules did not co-localize with actin, our data support a hypothesis for multiple regulatory roles for PKC∊ within a single cell.
We are not aware of any immunocytochemical studies examining cytoskeletal associations of PKCη. We observed a network of densely associated detergent-resistant η-rich granules in the perinuclear region and surrounding cytoplasm. Because our Western blotting analysis of detergent-resistant cell extracts is obtained using an Ab specific for the COOH-terminus of η and identifies a protein with the appropriate MW for a PKC proteolytic fragment, it is possible that the η observed in our studies may be a catalytic fragment of the holoenzyme.
PKCθ associates with spectrin after exposure of lymphocytes to whole-body hyperthermia (Wang et al. 1999), with the sarcolemma of skeletal muscle, and in the neuromuscular junction (Hilgenberg and Miles 1995). Protein kinase C-straight θ has been reported to localize to centrosomes and kinetochores in mitotic cells (Passalacqua et al. 1999). It is not known whether or to what degree the co-localization of tubulin and θ observed in our studies reflects associations with kinetochores and/or centrosomes. However, our studies do suggest a marked association of θ with microtubules, especially in the region of the MTOC.
In conclusion, we describe a variety of detergent-insoluble, PKC-rich associations of endogenously expressed PKC isoforms in B16F10 melanoma cells and demonstrate that seven isoforms localize to the detergent-resistant cytoskeleton, forming a diverse array of PKC-rich structures around the nucleus and throughout the cytoplasm. Many of the isoform-rich structures observed have not been described previously and are not detectable in preparations of cells fixed with Fo or MA. Several isoforms are shown to co-localize with varied and specific components of the actin, vimentin, and/or tubulin cytoskeleton. Further characterization of the PKC cytoskeletal associations described here should yield important information concerning the role of specific isoforms in regulating diverse cellular activities.
Footnotes
Acknowledgments
Supported by grant 666198 from PSC-CUNY and by the Elsa U. Pardee Foundation.
We are very grateful to Ms Jeannette Schaefer for help and advice, to Dr S. Rotenberg for antibody, and to Dr H. Magazine for critical review of the manuscript.