
Abstract
We studied by autoradiography the distribution of 45Ca in the enamel organ of frozen rats 4.3, 6.1, 7.8, 10.6 and 13.7 sec after an IV injection. The intercellular junctions of the proximal side of the smooth-ended ameloblast (SA) and the distal side of the ruffle-ended ameloblast (RA) were closed to calcium. The junctions of the distal side of SA, the proximal side of RA, and both sides of the secretory stage ameloblasts were not. The time required for calcium to pass through the ameloblast layer was less than 1.8 sec in the secretory stage and SA region. The time in the RA region was 3.5–6.3 sec. In the transitional region from RA to SA, a band of strong radioactivity appeared from the papillary layer of RA region towards the enamel of the SA region. The radioactivity in the secretory stage enamel increased almost linearly with time. The diffusion speed of calcium in the enamel was more than 50 μm for 1.8 sec in the maturation stage and less than 15 μm for 9.4 sec in the secretory stage. These results indicate that in the secretory and SA regions calcium moves to the enamel surface through the intercellular spaces of ameloblasts and in the RA region via RA cells.
C
In this study, we attempted to define the contribution of cells to calcium transport and the primary route of calcium movement from the blood to the forming enamel. To accomplish this, the distribution patterns of radiolabeled calcium in the enamel organ within 30 sec after tracer injection were examined by the autoradiographic method (Kawamoto 1990) that is used to study the distribution of water-soluble tracers in tissues.
Materials and Methods
Preparation of Sections
To examine the distribution of 45Ca in the enamel organ of a rat lower incisor within 30 sec after the IV injection of tracer, section preparation and autoradiography were carried out according to the method described by Kawamoto (1990).
Nine-day-old Wistar rats (weighing about 20 g) were anesthetized with sodium pentobarbital, and 0.1 ml of calcein (0.04%) in physiological saline (0.1 ml) was injected into the abdominal cavity to distinguish the developmental stages of the lower incisor enamel by its distribution. Thirty min after injection of calcein, 0.05 ml of saline containing 45CaCl2 (185 KBq/g body weight) (Dupont NEN; Boston, MA) was injected into the iliac vein with an automatic syringe driven by an electric motor. The animals were then rapidly frozen in liquid nitrogen. The time from the beginning of injection of the tracer until dipping the rats in the liquid nitrogen was electrically measured and recorded. The solution in the syringe was injected in approximately 0.1 sec. Thirty-six rats were used for this study, and they were exposed to radiolabeled calcium for 3–30 sec. Among them, five rats that were most successfully injected with the tracer over an optimal period of time and with a desirable time of exposure to the tracer (4.3, 6.1, 7.8, 10.6, and 13.7 sec) were selected and examined.
The frozen animals were embedded in a 5% carboxymethyl cellulose solution (CMC) and the CMC was frozen in cold hexane (-90C). The CMC block was attached to the sample stage of a microtome (LKB PMV 2258; Bromma, Sweden) in a cryostat kept at −20C and was then trimmed. The sectioning surface was covered with a sheet of Saran Wrap coated with a synthetic rubber adhesive (Azia Genshi; Gifuken, Japan) and frozen sections were cut at 4 and 7 μm thick. One serially adjacent section was used for light microscopic autoradiography and the other for contact autoradiogaphy.
Contact Autoradiography
After being freeze-dried for 24 hr in the cryostat, 7-μm-thick sections were removed from the cryostat. The boundary between the ameloblast layer and the enamel was carefully cut with a surgical blade under a microscope to separate the cell layer from the enamel so as to avoid backscatter of radiation to the enamel from the cell layer. Both the separated cell layer and the enamel samples were placed on a glass slide coated with adhesive glue. They were then covered with a plastic film 4 μm thick.
Before the autoradiographic procedures, the distribution of calcein fluorescence in the sections was recorded with a confocal laser scanning microscope (CLSM) (Olympus LSM-GB200; Tokyo, Japan). Then the sample was contacted with X-ray film (Fuji IX 50; Fuji Photo, Tokyo, Japan) and exposed for 3 weeks. The film was developed with Rendol (Fuji Photo) for 5 min and fixed with Fuji Super Fix (Fuji Photo) for 5 min. The labeled areas were identified by superimposing the image of the autoradiograph over the distribution patterns of the calcein image on CLSM.
Light Microscopic Autoradiography
After being freeze-dried in the cryostat, the 4-μm-thick sections were covered with an autoradiographic emulsion film approximately 1 μm thick according to the method described previously (Kawamoto 1990). In brief, 0.4 ml of 0.2% aqueous solution of sodium dioctylsulfosuccinate was mixed well with 5 g of autoradiographic emulsion (Konika NR-M2; Konica, Tokyo, Japan) melted at 40C. A small amount of the emulsion was collected by dipping the tip of a glass tube into the emulsion and a bubble was blown. The emulsion film of the bubble was applied to the section when the film was half dried. The emulsion film was applied twice. For exposure, the emulsion covered sections were stored for 5 weeks at −80C in a light-tight box containing silica gel. After exposure, the emulsion on the section was developed and fixed. The section was then stained with hematoxylin and eosin. The autoradiographs were examined by light microscopy and CLSM.
Grain Counting
To count all the silver grains in the examined areas, the emulsion layer of the light microscopic autoradiograph was optically sliced every 1.2 μm at different focal planes by means of CLSM. The images of the grain distribution in each focal plane were recorded in a computer attached to the CLSM. Then, one in-focus image for all of these focal planes was made on a monitor. The grain counting was carried out manually on the monitor while the contrast and the brightness were varied.
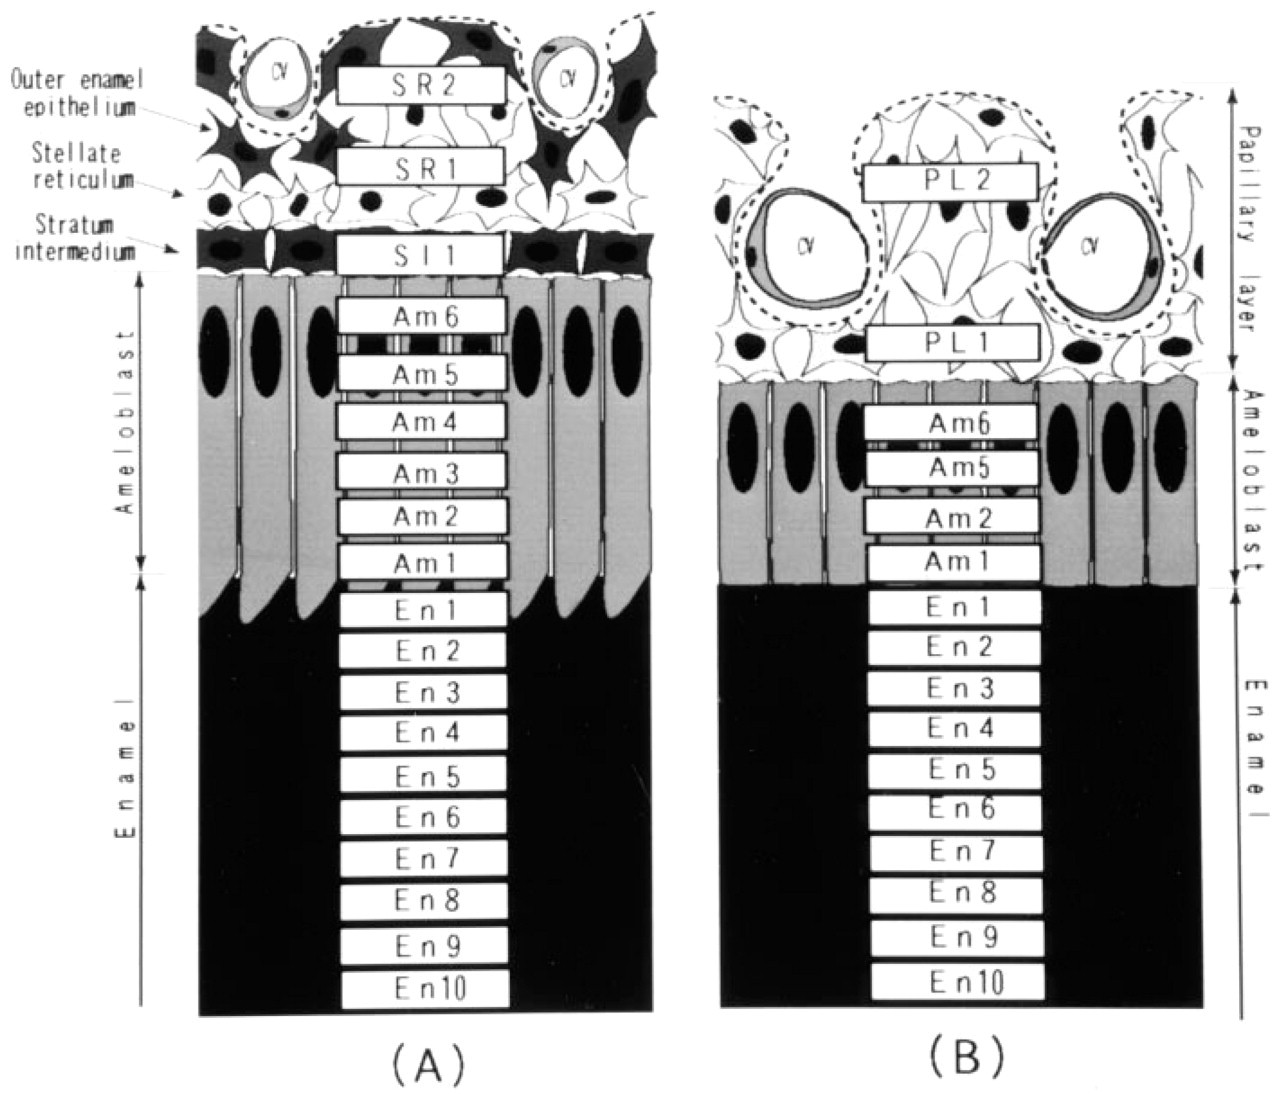
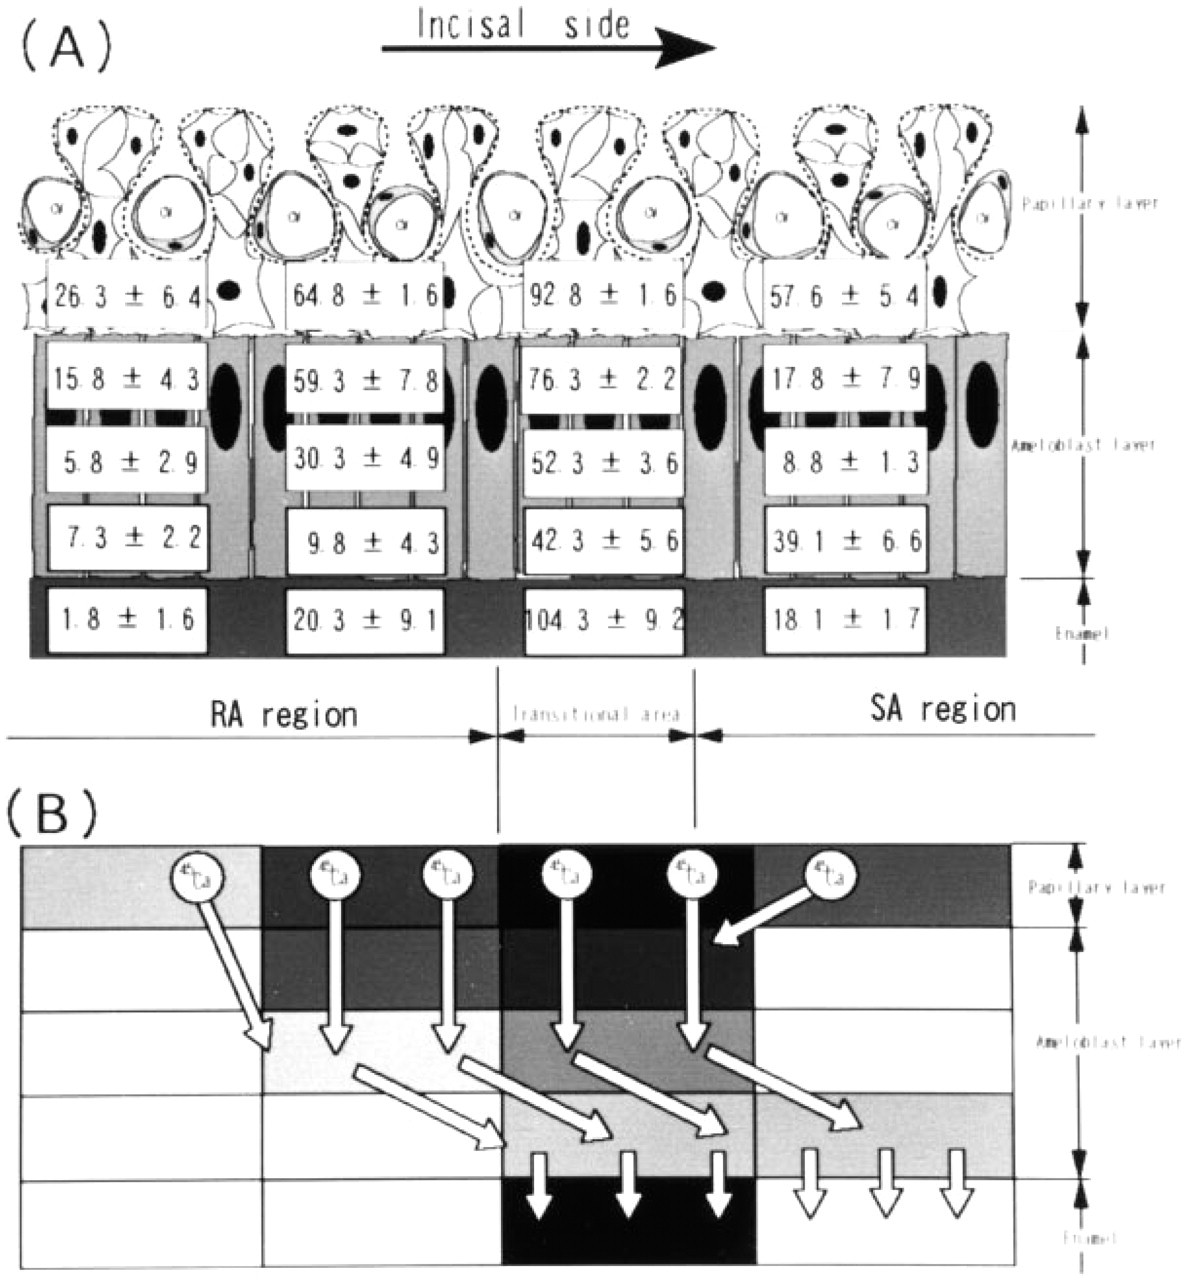
In the secretory stage, the location at which the enamel approximately 50 μm thick was formed was examined. In this location, 19 areas of 5 × 25 μm2 each [two areas (SR1, SR2) in the outer enamel epithelium and the stellate reticulum layer, one area (SI1) in the stratum intermedium, six areas (Am1-Am6) in the ameloblast layer, and 10 areas (En1-En10) in the enamel] were selected for a section, as shown in Figure 1A. In the maturation stage, the regions of smooth-ended ameloblasts (SAs) and the apical two thirds of the ruffle-ended ameloblasts (RAs) were examined. In those regions, 16 areas of the same size [two areas (PL1, PL2) in the papillary layer, four areas (Am1, Am2, Am5, Am6) in the ameloblast layer, and 10 areas (En1-En10) in enamel] were selected, as shown in Figure 1B. In the papillary layer region, an area was selected in a region that excluded blood vessels. Four areas at the same distance from the enamel surface were counted, and the mean values and SD of each area were calculated. In addition to those developing stages, the transitional area from RA to SA was examined by the same method, as shown in Figure 10A. The background counts were estimated by counting grains in several selected areas adjacent to the periphery of the sections.
Results
General Morphology and Autoradiography
Although the expanded intercellular spaces and some cracks caused by shrinkage of cells and tissues during the freeze-drying were observed in almost all sections, the papillary layer cells, stratum intermedium cells and ameloblasts were clearly identified (Figures 3, 6, and 8). In contact autoradiographs (CARGs), the localization of radioactivity in the papillary, ameloblast, and enamel layers could be clearly distinguished (Figures 2 and 5). In the light microscopic autoradiographs (LMARGs), chemographies were not detected in the control samples exposed in the same way.
Secretory Stage
CARG of the lower incisor section of rat frozen at 4.3 sec after IV injection of 45CaCl2 showed high radioactivity in a part of the facial artery but not in the veins (Figure 2A2). The LMARG, in addition to these tissues, showed faint radioactivity in the capillary vessels on the external side of the outer enamel epithelium, the stellate reticulum, stratum intermedium and in the proximal part of the ameloblast layer (Figures 3A and 4; Table 1). However, no radioactivity was located in the distal area of the ameloblast layer and in the enamel.
At 6.1 sec after injection, intense radioactivity was detected in most facial arteries and increased significantly. The radioactivity in the capillary vessels also increased but remained lower than that in the peripheral tissue of the capillary vessels (Figures 3B2 and 4). In the ameloblast layer, radioactivity was detected throughout the entire thickness. The radioactivity was considerably lower than that in the stellate reticulum, and it decreased from the proximal side of the ameloblast towards the distal side (Figure 4). In the enamel, grains showing 45Ca uptake were observed in the surface layer of the enamel (Figures 3B2 and 4; Table 1). The radioactivity was distributed in the surface layer 10 μm below the enamel surface.
At 7.8 sec, the radioactivity in the stellate reticulum increased by approximately twofold (Figure 4; Table 1). The radioactivity in the ameloblast layer was significantly lower than that in the stellate reticulum (Figure 3C2). The radioactivity decreased from the proximal side towards the distal side similar to the pattern seen by LMARG at 6.1 sec. The intensity in the distal portion was approximately 13% compared with that of the proximal portion. In the enamel, the labeled area extended to 15 μm below the enamel surface. However, intense radioactivity was only 10 μm deep in the surface layer (Figures 3C2 and 4; Table 1).
Diagrams showing the regions for grain counts in the secretory stage
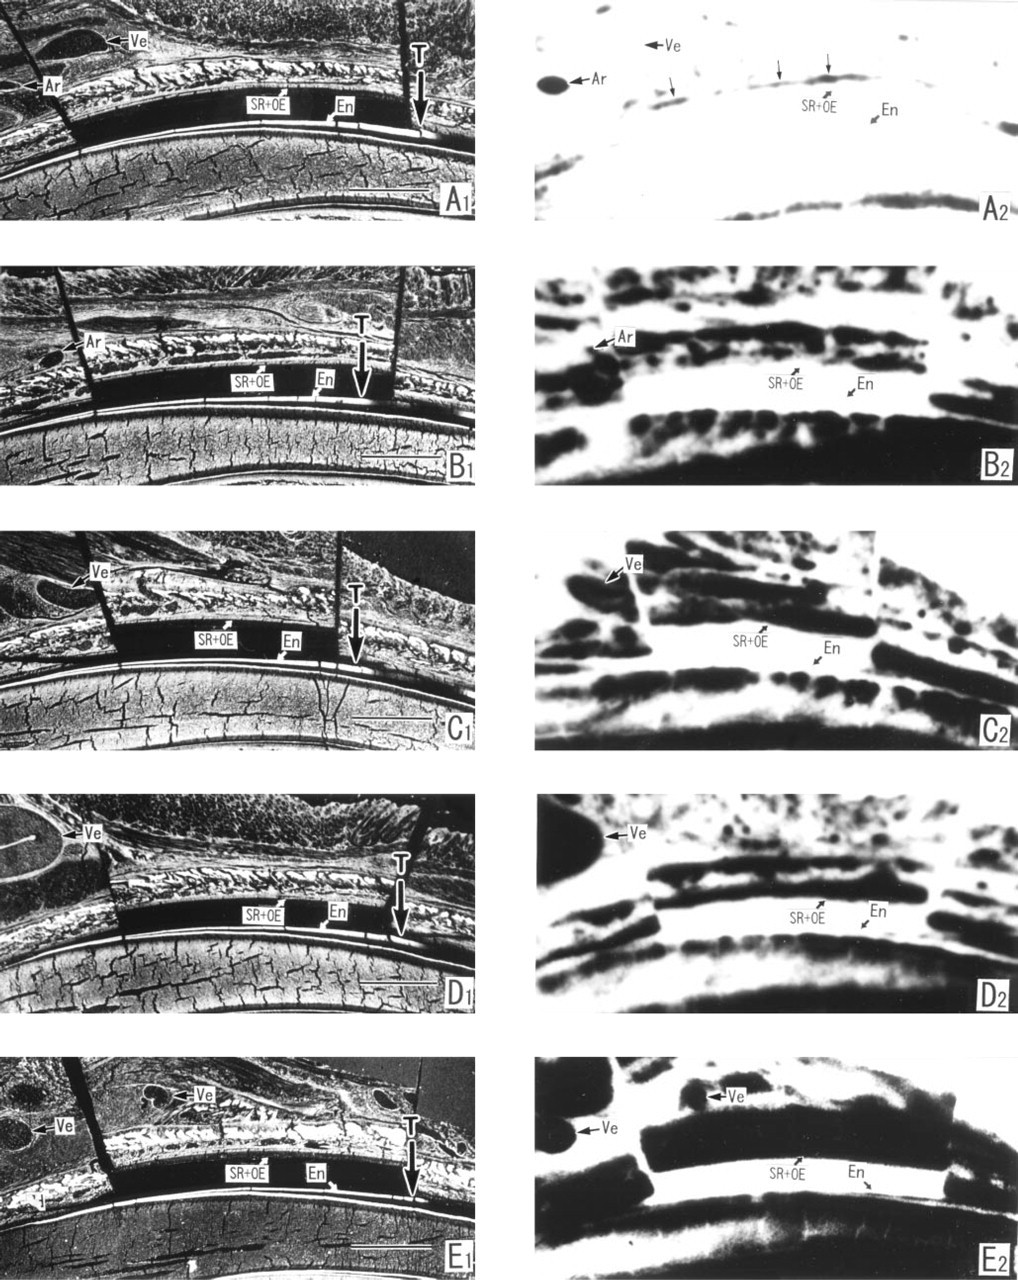
Contact autoradiographs (right) at the secretory stage of a lower incisor section of 9-day-old rats injected IV with 45CaCl2 and the calcein distribution (left) in the section used for autoradiography. The ameloblast layer was cut away from the enamel surface. High radioactivity corresponds to the blackened areas. At 4.3 sec, the radioactivity appears in the blood vessels (arrow in
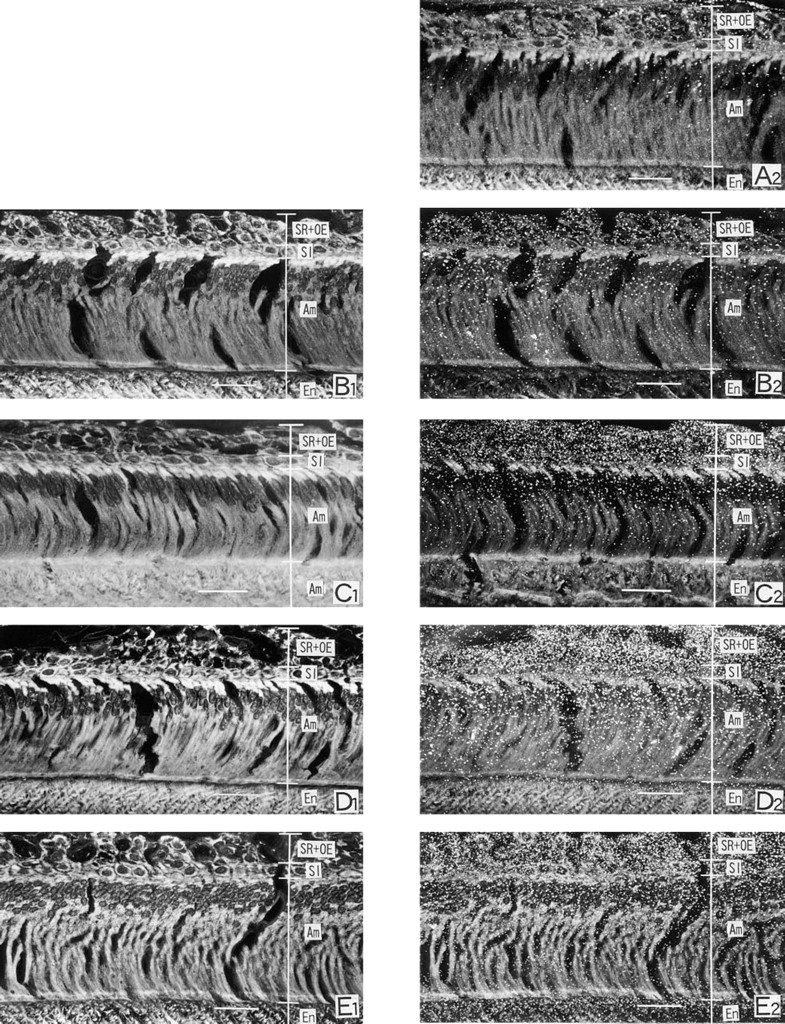
Light microscopic autoradiographs at the secretory stage. The left was focused on the tissues and the right was focused on the silver grains. Each autoradiograph was prepared with the section adjacent to that used for contact autoradiography. Small silver grains are seen in the stellate reticulum and the proximal part of the ameloblast layer at 4.3 sec after an IV injection of 45CaCl2
At 10.6 and 13.7 sec, the intensity of radioactivity in the stellate reticulum, stratum intermedium, and ameloblast layer remained almost constant (Figure 4), and the distribution patterns were almost the same as those seen in autoradiographs at 7.8 sec. The strongest radioactivity was located in the stellate reticulum, the next strongest radioactivity was in the stratum intermedium, and the weakest radioactivity was in the ameloblast layer. The radioactivity in the ameloblast layer gradually decreased from the proximal side towards the distal side. The radioactivity in the most distal portion was approximately 30% compared with the proximal side. In the enamel, the intensity of radioactivity increased with time, but the labeled area and labeling patterns were almost the same as those seen at 7.8 sec (Figure 2; Table 1).
The time-related changes in radioactivity accumulated within the enamel are shown in Figure 11. Uptake of the radiolabeled calcium was not observed until 4.3 sec after the injection. However, the uptake appeared at 6.1 and increased linearly with time thereafter.
Maturation Stage
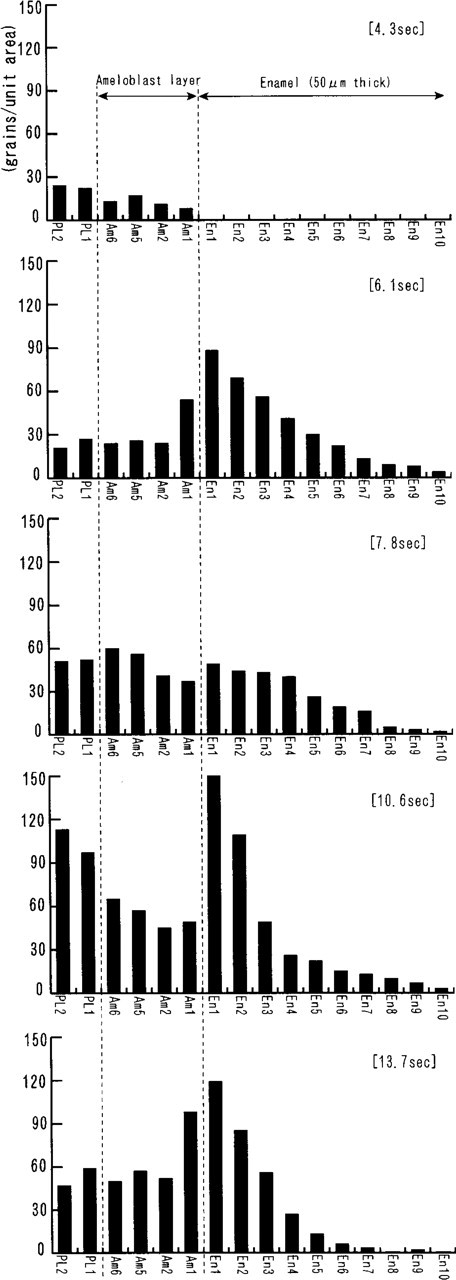
Smooth-ended Ameloblast Region. CARG at 4.3 sec after 45Ca injection revealed relatively high radioactivity in the blood vessels in the connective tissue overlying the enamel organ (Figure 5A2). LMARG, in addition to those tissues, showed weak radioactivity in the capillary vessels of the papillary layer and the entire thickness of the ameloblast layer (Figures 6A2 and 7). However, no radioactivity was observed in the enamel.
At 6.1 sec, the radioactivity in the capillary vessels of the papillary layer and in the ameloblast layer significantly increased (Figures 5B2 and 7; Table 2). In the enamel, a clearly labeled area was observed (Figures 5B2 and 6B2). The labeled area was more than 50 μm in depth, and the intensity of radioactivity gradually decreased from the enamel surface towards the dentin-enamel junction (Figure 7).
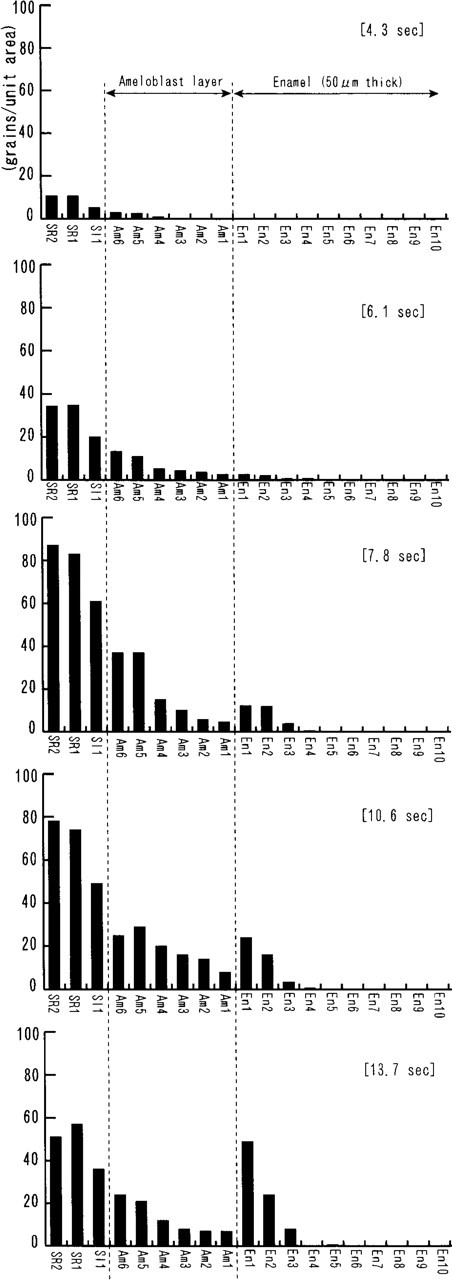
Graphic presentation of Table 1. Radioactivity is seen in the stellate reticulum and stratum intermedium layers at 4.3 sec and in the enamel at 6.1 sec. The radioactivity in the ameloblast layer is lower than that in the stratum intermedium layer and decreases from the proximal towards the distal side. In the enamel, almost all of the radioactivity is located in the surface layer. Abbreviations as in Figure 1.
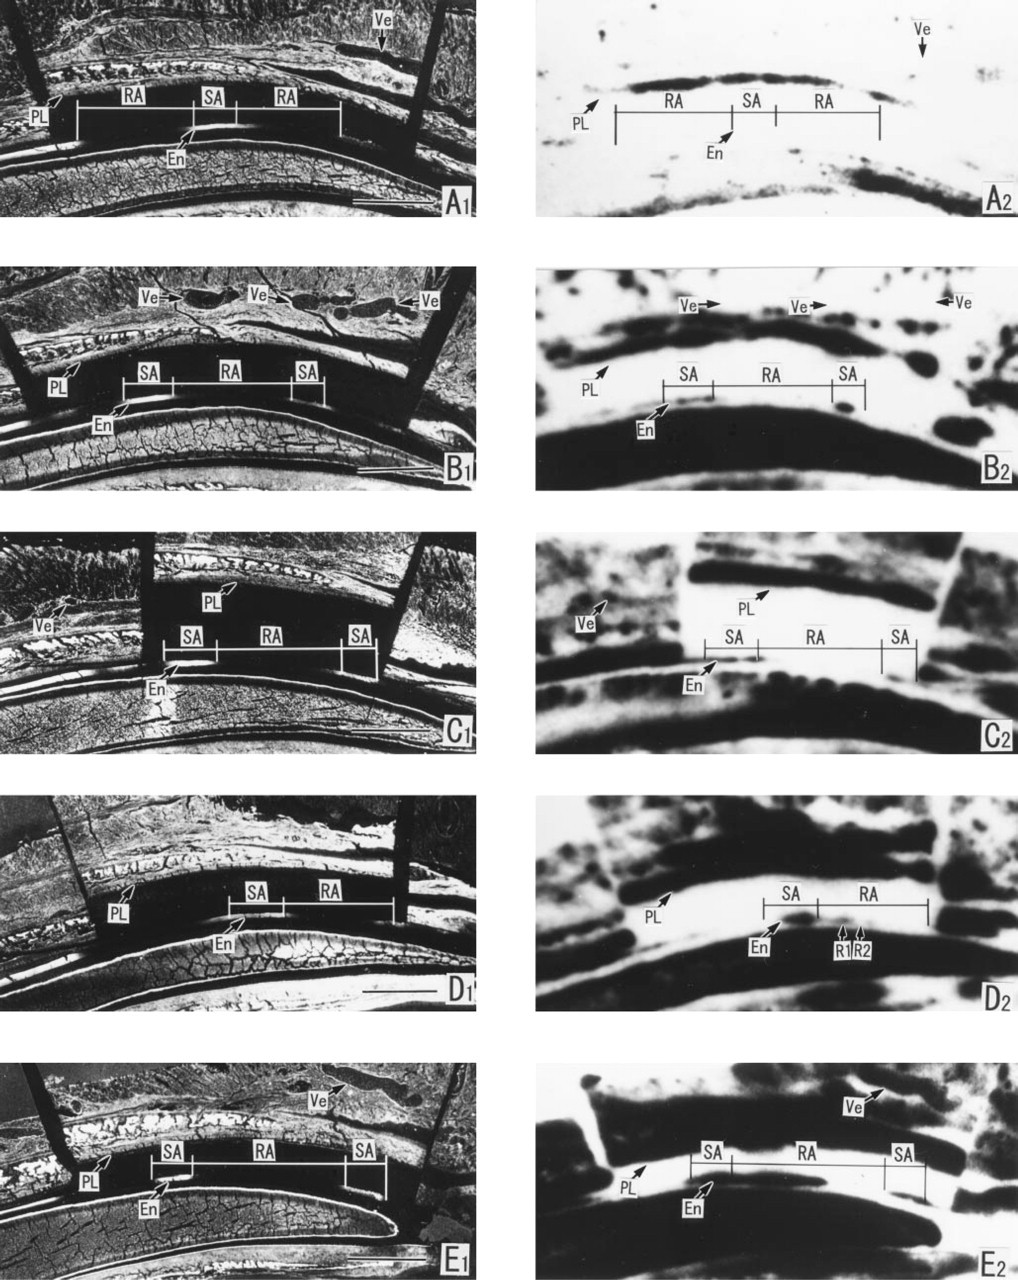
The 45Ca contact autoradiographs (right) at the maturation stage of the lower incisor section of 9-day-old rats injected IV with 45CaCl2, and the calcein distribution (left) of the section used for the autoradiography. The ameloblast layer was cut away from the enamel surface. High radioactivity corresponds to the blackened areas. Radioactivity appears in the blood vessels in the connective tissue overlying the enamel organ at 4.3 sec, but not in the enamel itself
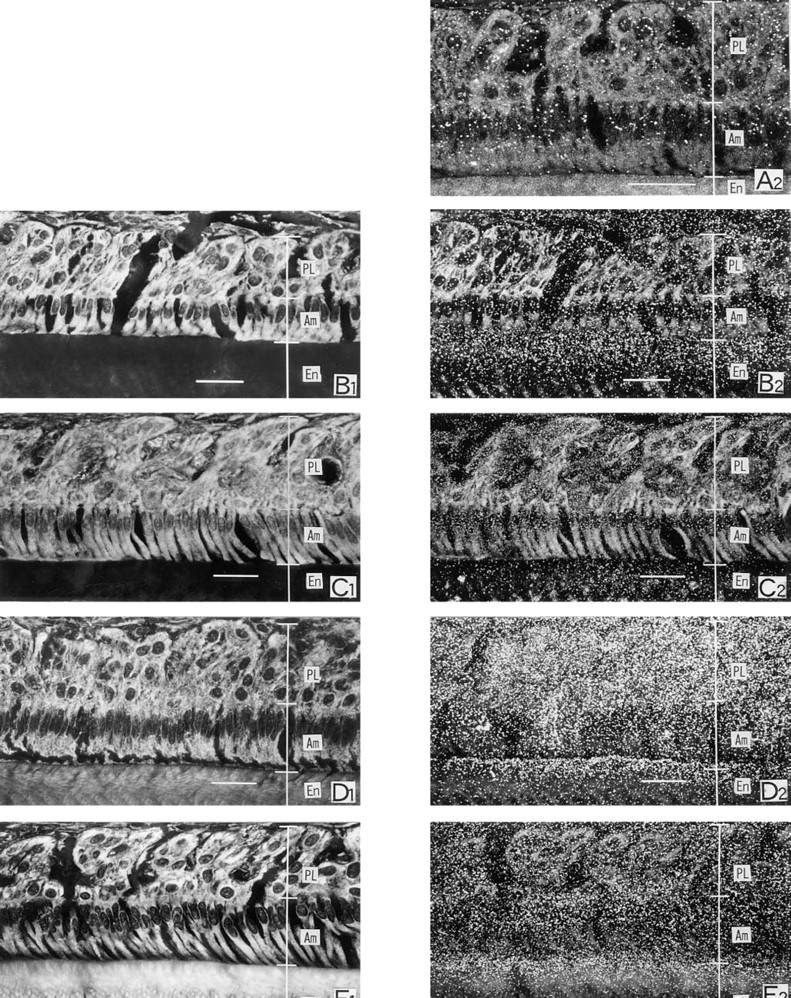
45Ca light microscopic autoradiographs at the SA region of the maturation stage. The counted regions are indicated in Figure 1B. Left was focused on the tissues and right was focused on the silver grains. Each autoradiograph is prepared with the section adjacent to that used for contact autoradiography. Small grains are distributed in the papillary and ameloblast layers at 4.3 sec after IV injection of 45CaCl2
Radioactivity in the cell layers and enamel (secretory stage) a
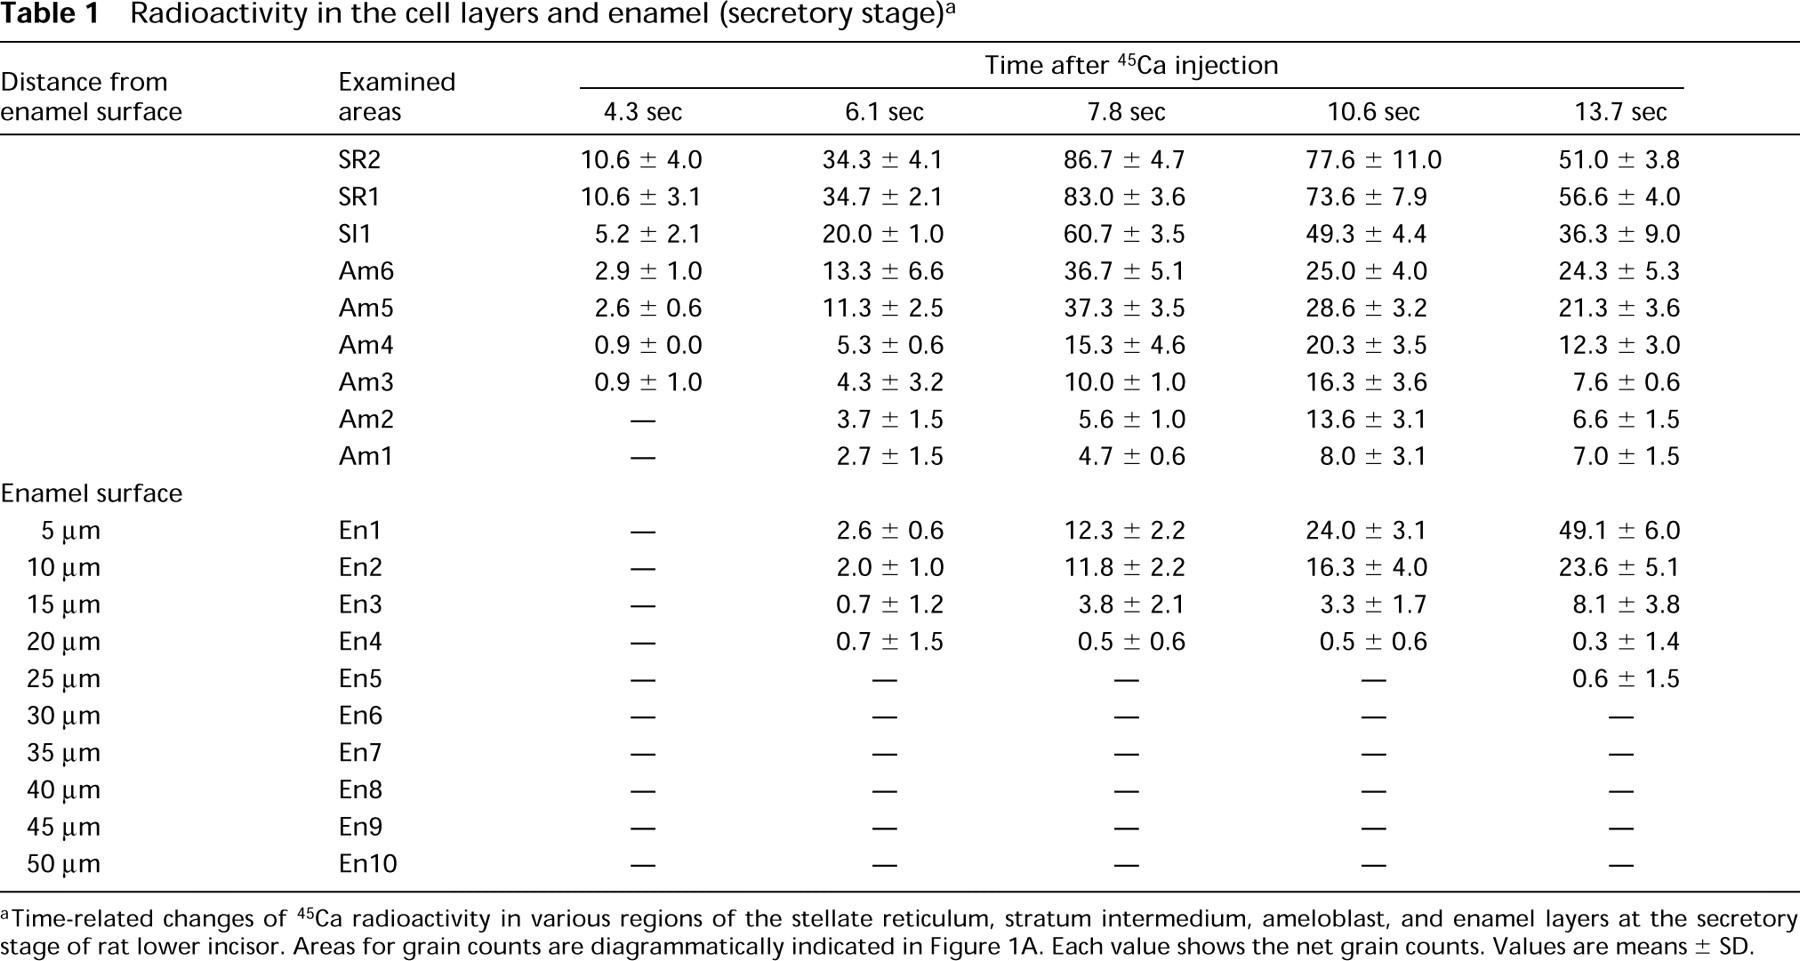
aTime-related changes of 45Ca radioactivity in various regions of the stellate reticulum, stratum intermedium, ameloblast, and enamel layers at the secretory stage of rat lower incisor. Areas for grain counts are diagrammatically indicated in Figure 1A. Each value shows the net grain counts. Values are means ± SD.
At 7.8 sec, the radioactivity in the papillary and ameloblast layers further increased (Figure 7). The radioactivity in the enamel was slightly lower than that seen at 6.1 sec, but the distribution pattern was almost the same (Table 2).
At 10.6 and 13.7 sec, the intensity and distribution patterns of the radioactivity in the ameloblast layer were almost the same as that seen at 7.8 sec (Figure 7). The distribution of radioactivity in the enamel was also the same as that at 6.1 sec. The highest radioactivity was located in the uppermost surface layer and the intensity gradually decreased toward the dentin-enamel junction.
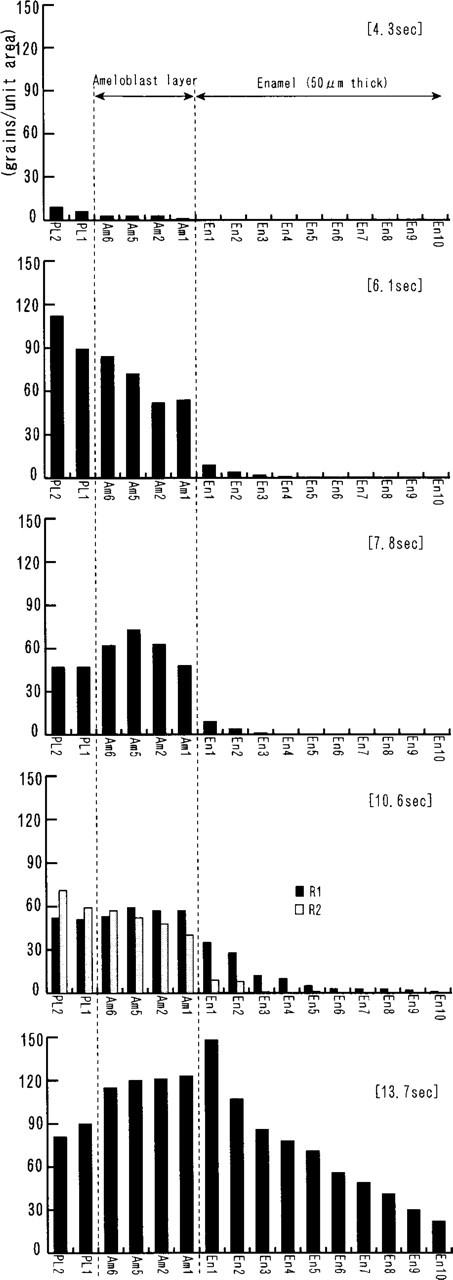
Ruffle-ended Ameloblast Region. CARG and LMARG at 4.3 sec after an IV injection of 45CaCl2 showed that the distribution of radioactivity in the connective tissues overlying the enamel organ, the papillary layer, and the ameloblast layer were similar to that seen in the SA region. Radioactivity was not detected in the enamel (Figures 5A2 and 8).
Radioactivity in the cell layers and enamel (SA region of maturation stage) a
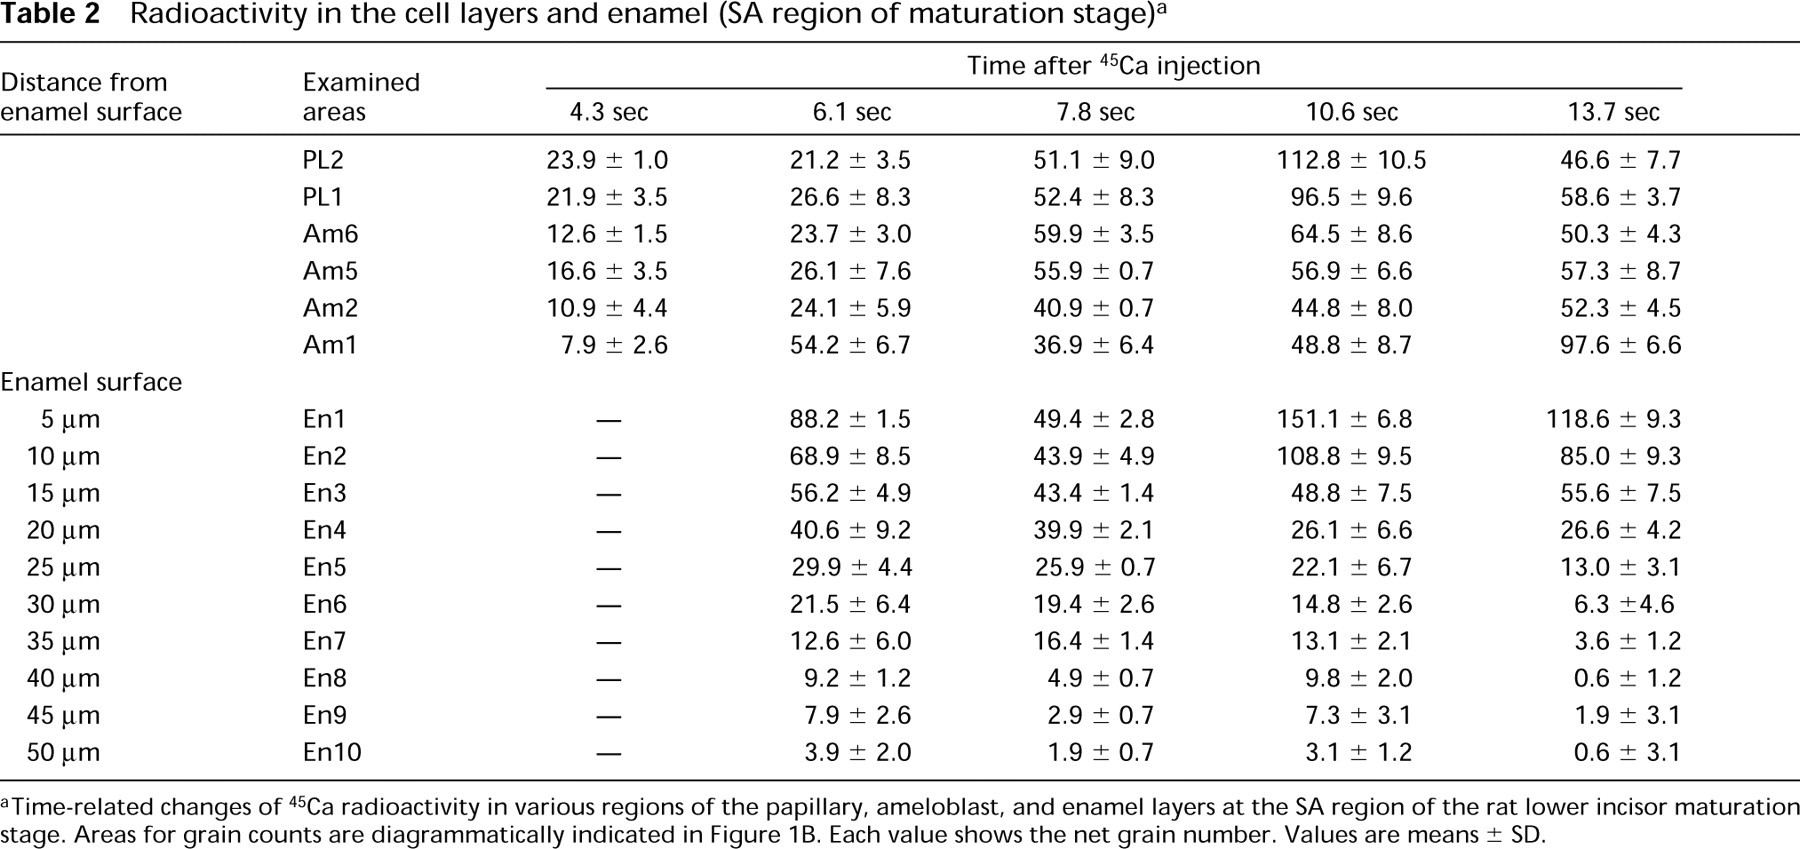
aTime-related changes of 45Ca radioactivity in various regions of the papillary, ameloblast, and enamel layers at the SA region of the rat lower incisor maturation stage. Areas for grain counts are diagrammatically indicated in Figure 1B. Each value shows the net grain number. Values are means ± SD.
At 6.1 sec after the injection, LMARG showed that the radioactivity in the papillary and ameloblast layers significantly increased, whereas it decreased from the papillary layer towards the distal side of the ameloblast layer (Figures 8B2 and 9). The radioactivity in the enamel was the same as the background, although some grains were dispersed.
At 7.8 sec, the distribution of radioactivity in the cell layer was similar to that seen at 6.1 sec, and the radioactivity in the enamel was almost the same as the background (Figures 8C2 and 9).
At 10.6 sec, significant changes in the distribution of radioactivity were not observed in the cell layer (Figure 8D2; Table 3). However, in the enamel, a faintly labeled area appeared in an area representing approximately the apical two thirds of the RA region (arrow R1 in Figure 5D2).
At 13.7 sec, significantly increased radioactivity appeared in the ameloblast layer in the apical two thirds of the RA region, but the intensity was not the same (Figures 5 and 9). The radioactivity was stronger than that in the papillary layer, and the strongest radioactivity was found in the distal portion (Figure 9; Table 3). In the enamel, the area representing approximately the apical two thirds of the RA region was heavily labeled (Figure 5). The intensity was not the same in this region, and the labeling in the enamel just beneath the heavily labeled RA cells was intense. The radioactivity was distributed to a depth of 50 μm. No radioactivity was found in the area of approximately the incisal one third of the RA region, and radioactivity of the ameloblast layer in the area was very weak.
Transitional Area from RA to SA. The distribution patterns of radioactivity in the transitional area from RA to SA in LMARG at 10.6 sec after a 45Ca injection are shown in Figure 10A. The contour map representation of the intensity is shown in Figure 10B. In the incisal one third of the RA region, the radioactivity in the ameloblast layer was weak, although relatively strong radioactivity was observed in the papillary layer. The radioactivity in the enamel was almost the same as that in the background. The radioactivity in the ameloblast layer increased close to the transitional area and became strongest at the transitional area. The intensity again decreased close to the middle portion of the SA region. The radioactivity of the ameloblast layer in this region was very weak, whereas strong radioactivity was distributed in the papillary layer. In the enamel, the strongest radioactivity was found in the transitional area, and the intensity decreased closer to the middle portion of the SA region.
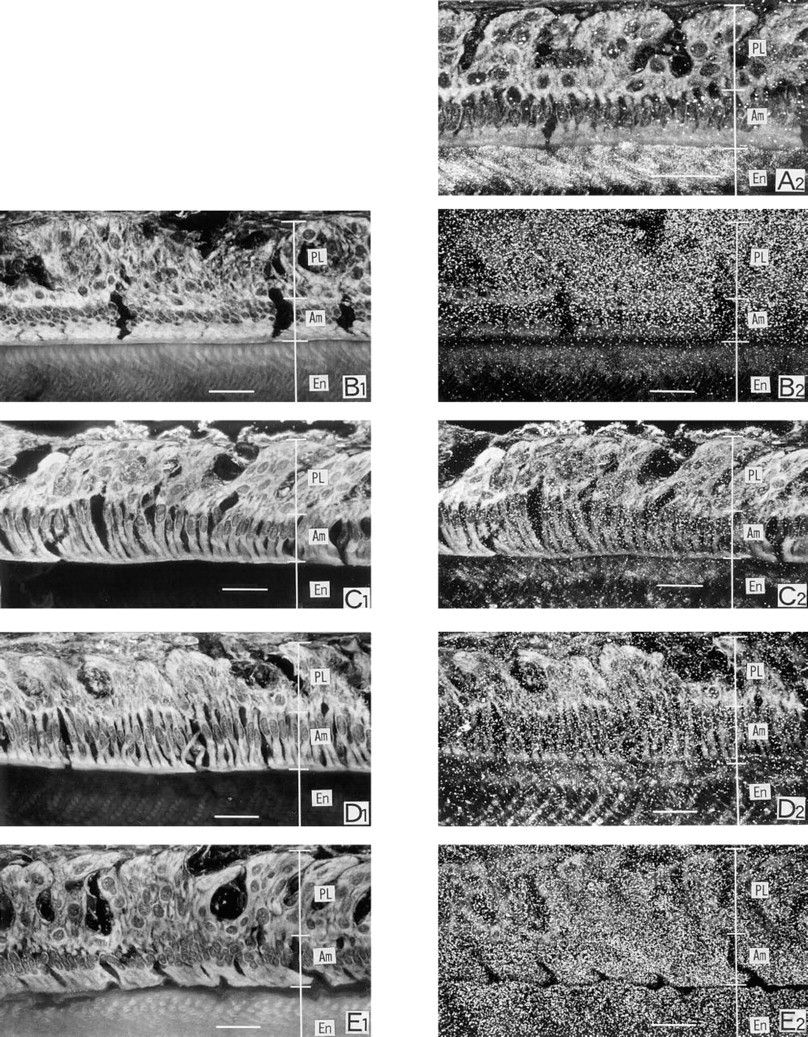
45Ca light microscopic autoradiographs at the RA region. The counted regions are indicated in Figure 1B. Left was focused on the tissues and right was focused on the silver grains. Each autoradiograph was prepared with the section adjacent to that used in contact autoradiography. Small grains are observed in the papillary and ameloblast layers at 4.3 sec after an IV injection of 45CaCl2
Discussion
When the pathway and the speed of calcium movement in the ameloblast layer are estimated from the distribution patterns of radiolabeled calcium, the time of exposure to the label is very important. In a preliminary experiment, radiolabeled calcium injected into iliac vein was not detected in the lower incisor until 3.5 sec after injection, and the well-known labeling patterns appeared in the enamel after 15 sec. Therefore, an exposure time of 3.5–15 sec was selected for this study, and only one animal was examined from each time because it was too difficult to expose the animal to the tracer for the same period.
In autoradiography over a very short period using a large sample, the results are greatly influenced by the time required to freeze the sample. The 9-day-old rats began to freeze immediately after being placed in the liquid nitrogen. Naturally, the enamel organ of the lower incisor situated approximately 1.2 mm under the skin would be frozen very soon after immersion. All the animals used were frozen under the same conditions. In addition, to measure accurately the exposure time to the radiolabeled calcium, injection of tracer and measurements were carried out automatically with an apparatus especially designed by us. Therefore, we believe that the influence of freezing time on the accuracy of the measurement is very slight.
Even if such technical difficulties are overcome, there is a risk of false results when radiolabeled calcium in a readily soluble form is used for autoradiography. False results can be caused by translocation of the tracer during tissue preparation, by the procedure of coating the autoradiographic emulsion on the section, by chemography induced by chemical substances in tissues, and by miscounting of grains. Translocation of the tracer was minimized by using freeze-sectioning and dry-emulsion film coating techniques as described by Kawamoto and Shimizu (1986). Chemography was also minimized by exposure at −80C. Miscounting of grains was solved by using CLSM, by which an in-focus focus image was made with images of different focal planes on the sample. From a careful performance of 45Ca autoradiography, four clear results were achieved: the time for calcium to diffuse across the ameloblast layer; the tightness of intercellular junctions of ameloblasts to calcium; the pathway of calcium movement in the ameloblast layer; and the diffusion speed of calcium within the enamel layer.
Graphic presentation of Table 3. Strong radioactivity is seen in the cell layers at 6.1 and 7.8 sec, but no radioactivity in the enamel. 45Ca uptake into the enamel is seen at 10.6 and 13.7 sec, and it diffuses rapidly towards the dentin-enamel junction. The examined areas of R1 and R2 at 10.6 sec are indicated by arrows R1 and R2 in Figure 5D2. Abbreviations as in Figure 1.
Radioactivity in the cell layers and enamel (RA region of maturation stage) a
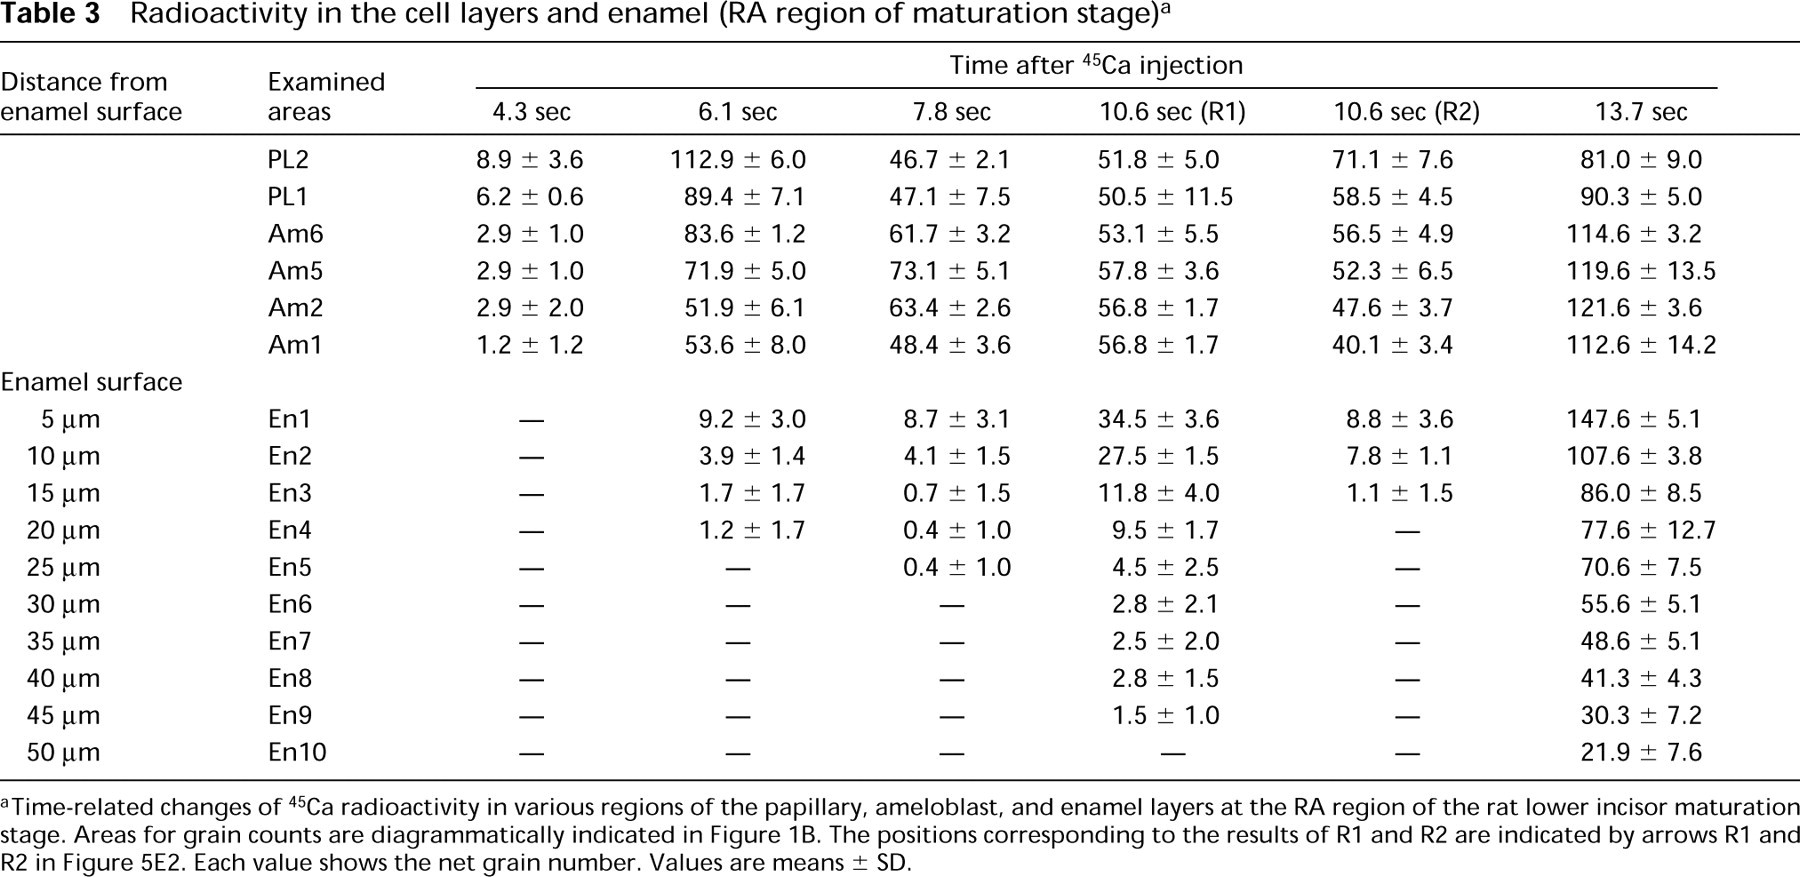
aTime-related changes of 45Ca radioactivity in various regions of the papillary, ameloblast, and enamel layers at the RA region of the rat lower incisor maturation stage. Areas for grain counts are diagrammatically indicated in Figure 1B. The positions corresponding to the results of R1 and R2 are indicated by arrows R1 and R2 in Figure 5E2. Each value shows the net grain number. Values are means ± SD.
In the maturation stage, there are two types of ameloblasts: ruffle-ended ameloblasts (RAs), with a ruffled border consisting of deep membrane invaginations and smooth-ended ameloblasts (SAs) with flattened distal cell surfaces (Reith and Boyde 1981; Josephsen and Fejerskov 1977; Warshawsky and Smith 1974; Suga 1959). Both cells are arranged on the enamel in a banded pattern, and their histological characteristics change periodically. The RA cells and the SA cells can be identified by the distribution of calcein fluorescence (Josephsen 1983). Smith et al. (1987) showed that these ameloblasts modulate extremely rapidly, on the order of 1 hr. In this study, although influenced by the lag between the injection of calcein and radiolabeled calcium, the influence was very little, and both regions were well identified by the calcein fluorescence.
The time required for calcium to pass through the ameloblast layer was estimated from the time at which the radiolabeled calcium appeared on the stratum intermedium in the secretory stage or on the papillary layer in the maturation stage, entering into the enamel. Each time is summarized in Figure 12. In the secretory stage and the SA region, the radiolabeled calcium injected into the iliac vein was recognized in the stratum intermedium cell layer and the papillary layer by autoradiography at 4.3 sec and in the enamel at 6.1 sec. In the RA region it was recognized in the papillary layer at 4.3 sec. The grains in the enamel at 6.1 and 7.8 sec appear to represent radiation from the label distributed in the ameloblast layer, because it was distributed only in the surface layer. Therefore, the relatively intense labeling seen at 10.6 sec indicates incorporation of radiolabeled calcium into the enamel. From those results, the time for calcium across the ameloblast layer was estimated to be less than 1.8 sec in the SA region and between 3.5 and 6.3 sec in the RA region. The time difference is affected mainly by the distance to which calcium moves and by the calcium transport systems. In the RA region, it takes much longer than in the SA region. This suggests that the transport system of calcium in the RA region is different from that in the secretory stage and the SA region, because the distance to which calcium moves from the blood to the enamel in the RA region is considerably shorter than in the secretory stage and the SA region, as described below.
In the SA region, Josephsen and Fejerskov (1977) showed that SA cells close the proximal junctions and open the intercelluar spaces to enamel. Tracer experiments (Kallenbach 1980a,b; Josephsen 1984; Kawamoto and Shimizu 1994) and histochemical studies (Nishikawa and Josephsen 1987) supported the morphological findings. In the autoradiograph of the middle portion of the SA region, the radioactivity in the proximal part of the SA cells was very low, although strong radioactivity was present in the papillary layer. This suggests that the intercellular junctions of the proximal side of the SA cells also act as a barrier to calcium movement.
Grain counts
Histochemical studies (Takano 1995; Salama et al. 1978) show no Ca-ATPase activity at the distal end of the SA cells. Kawamoto and Shimizu (1990, 1994) showed that radiocalcium and radiophosphate simultaneously injected IV are incorporated into the enamel of the SA region without cellular regulation, and that the ratio of both tracers is not very different from that in the blood. Accordingly, the calcium that enters the enamel of the SA region initially penetrates the intercellular spaces of the RA cells from the papillary layer. It subsequently diffuses to the intercellular spaces of the SA cells and finally enters the enamel of the SA region. The contour map image of radioactivity in the cell layer shown in Figure 10 demonstrates the route of calcium movement.
In the RA region, well-developed tight intercellular junctions are formed at the distal side but the intercellular spaces of ameloblasts give access to the intercellular spaces of the papillary layer (Sasaki and Garant 1986a,b; Sasaki et al. 1983; Josephsen and Fejerskov 1977). A light microscopic autoradiograph 6.1 sec after 45Ca injection showed clear uptake of radiolabeled calcium in the enamel of the SA region. However, radioactivity was not found in the enamel of the RA region, whereas strong radioactivity was present in the ameloblast layer. These findings indicate that the intercellular junctions of the distal side of the RA cells act as a barrier to calcium movement.
In this region, it has been demonstrated that Ca-ATPase localizes at the distal end of the ameloblast (Takano and Akai 1987; Salama et al. 1978) and that a large amount of calcium is transported into the enamel (Kawamoto and Shimizu 1990; Crenshaw and Takano 1982; Reith and Boyde 1981; Suga et al. 1970). Takano et al. (1987) showed that the calcium uptake in enamel is greatly inhibited by perfusion with vanadate, which is an inhibitor of Ca-ATPase. Kawamoto and Shimizu (1990, 1994) showed that the ratio of radiocalcium to radiophosphate incorporated into the enamel is clearly higher than that in the blood, and that the high ratio is achieved by active cellular calcium transport. As mentioned above, the time for calcium to diffuse across the ameloblast layer is much longer than that in the SA region, and this extended time is the result of movement via cells. The considerably high radioactivity in the RA cell layer supports the hypothesis that calcium enters the enamel via the RA cells.
Relatively high standard deviations appeared in the ameloblast layer and in the enamel at 13.7 sec. Kawamoto and Shimizu (1994) reported a variation in calcium transport function in the RA cells of this region. Autoradiography showed a variation in the radioactive intensity in those tissues. It is possible that a variation in the calcium transport function of each RA cell is reflected in both the radioactive intensity in those tissues and the deviation.
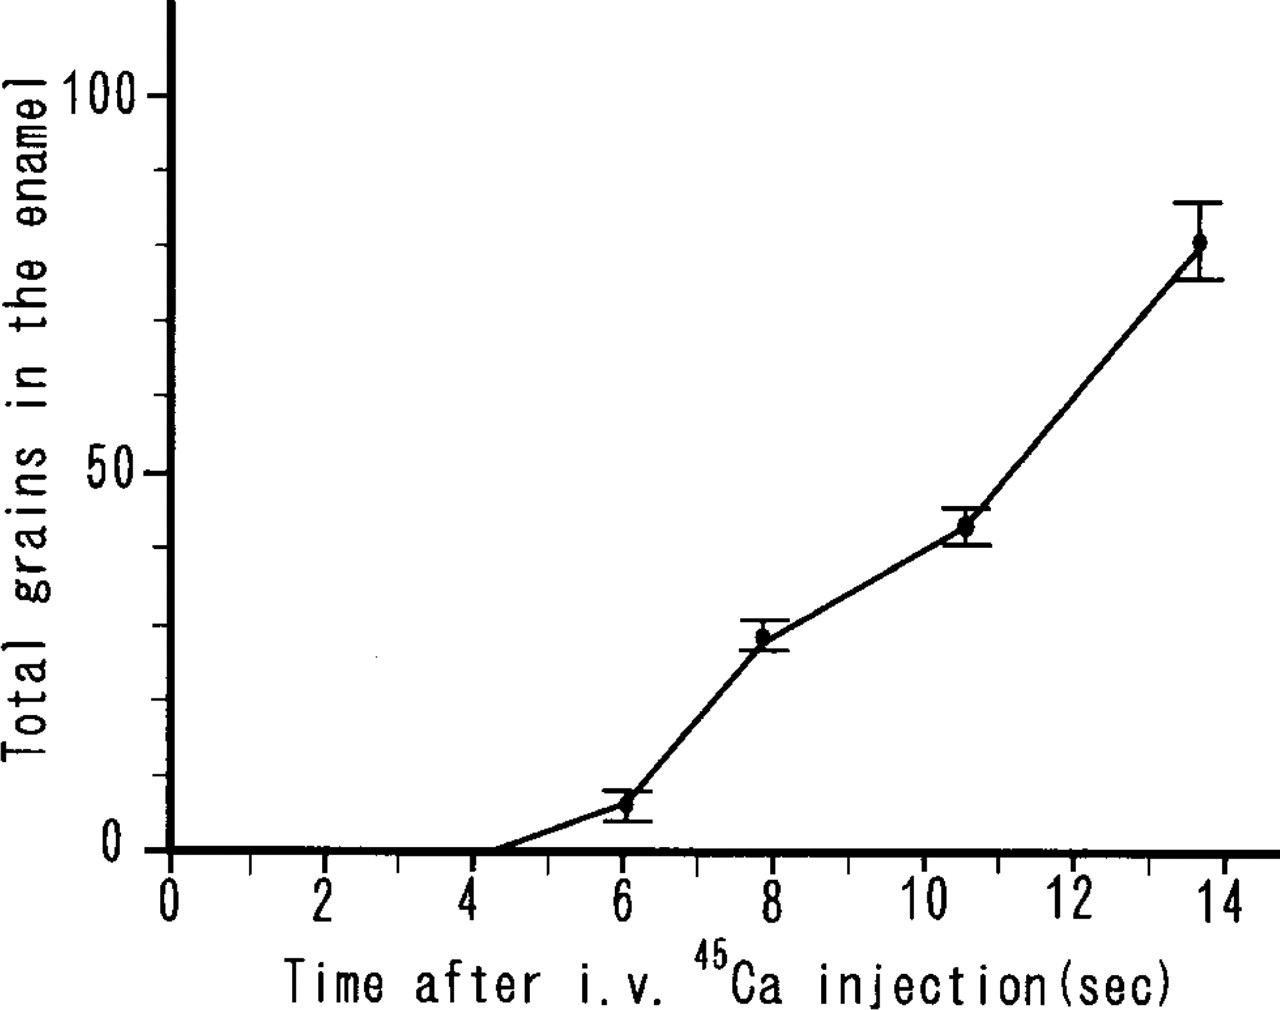
Time-related changes in total radioactivity distributed in all the examined areas (En1-En10 in Figure 1A) in the secretory stage enamel are shown. After 4.3 sec, the radioactivity increases almost linearly with time.
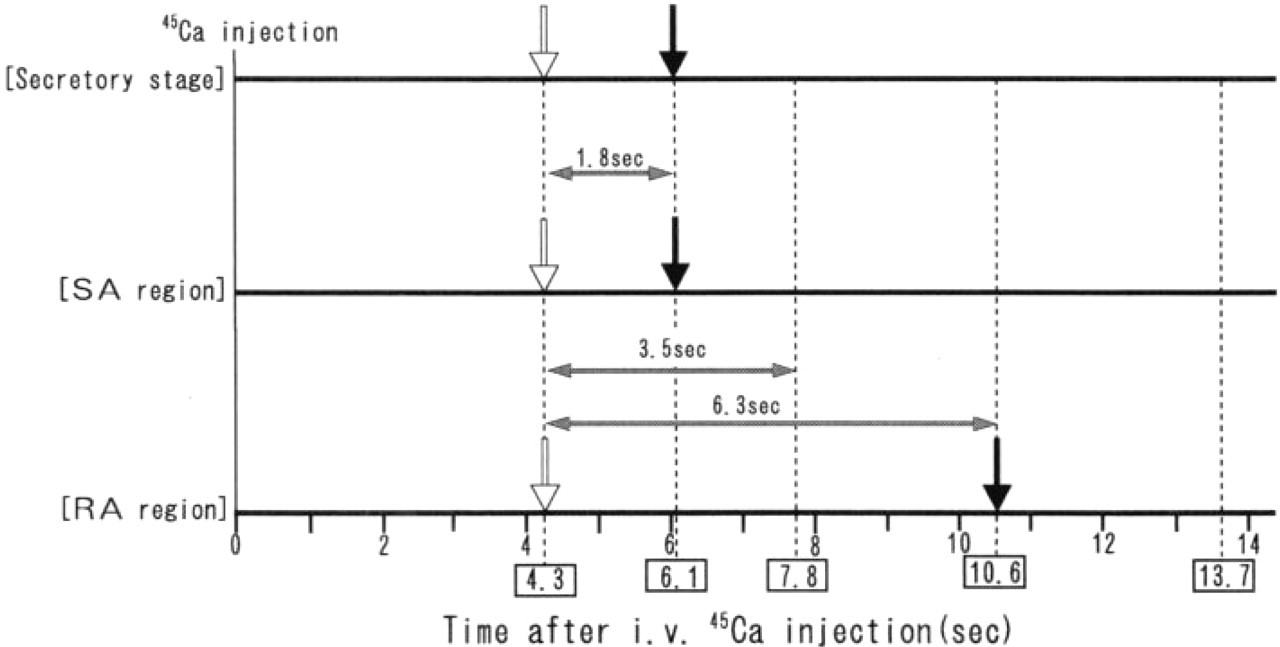
The time required for calcium to pass through the ameloblast layer is shown by both arrows. White and black arrows indicate the time when radiolabeled calcium appeared at the proximal side of ameloblasts and at the enamel, respectively. At 4.3 sec, radiolabeled calcium is seen at the proximal side in all the developing stages. In the enamel, radiolabeled calcium appeared at 6.1 sec in the secretory stage and the SA region. In the RA region, it is recognized after 10.6 sec.
Results related to the pathway and the mechanism of calcium transport in the secretory stage are confused compared to those in the maturation stage. Although at first Sasaki et al. (1982) showed complete zonular tight junctions at the distal end of secretory ameloblasts by freeze-fracture study, Sasaki (1984) later revealed the presence of various spaces among the tight junctional strands of the distal junctional complexes. He stated that the interstrand spaces may provide a diffusion pathway for small molecular weight materials. The extracellular pathway to the enamel has been well demonstrated by several tracer experiments (Kawamoto and Shimizu 1994; McKee et al. 1992; Sasaki 1984; Kallenbach 1980a).
It remains to be determined whether the radiolabeled calcium in the most outer layer (En1) of the enamel localizes inside the cell processes (Tome's process) or outside, because the En1 area includes the process in addition to the enamel. The methods employed in this study did not permit us to distinguish between the radiocalcium that was within the cells and that outside them. The time required for calcium to diffuse across the ameloblast layer is significantly less than that required in the RA region, although the secretory ameloblasts are much taller than the RA cells. In other words, the distance that calcium must move in the secretory stage is greater than that in the RA region. The time required, less than that in RA region, suggests that the calcium in the enamel of the outermost layer (En1) moves extracellularly to the enamel and localizes outside the processes. The calcium ion concentration in the extracellular fluid adjacent to the proximal cell membrane is 10−3 M, and the free calcium ion concentration in the fluid extracted from secretory stage enamel is 10−5 M (Aoba and Moreno 1987). Therefore, the flux of calcium to enamel would be generated by the gradient of calcium concentration.
Electron microscopic 45Ca autoradiography (Nagai and Frank 1975) showed two transfer pathways from the blood to the enamel surface, and also demonstrated that calcium passes through intercellular spaces and reaches the enamel, with the second pathway consisting of an intracellular transfer through the ameloblasts. In autoradiography, it is too difficult to distinguish the radiolabeled calcium that is transported from inside the cells to the enamel. In our preliminary autoradiography 3, 5, and 10 min after an ip 45Ca injection, the radioactivity of the ameloblast layer adjacent to the enamel in the incisal one third of the RA region, where calcium is not transported, increased with time. This experiment suggests that autoradiography for investigating the pathway of calcium movement must be performed within 3 min after 45Ca injection.
Based on the distribution patterns of Ca-ATPase activity (Sasaki and Garant 1987; Takano and Crenshaw 1981; Inage and Weinstock 1979; Salama et al. 1978) and the tightness of distal intercellular junctions (Garant et al. 1983; Takano and Ozawa 1980; Warshawsky 1978; Josephsen and Fejerskov 1977; Skobe and Garant 1974; Kallenbach 1966), Bawden (1989) described that calcium is transported to the enamel surface by an ATP-dependent pump, as calcium does not diffuse by the pericellular route from the extracellular fluid through the ameloblast layer to the enamel matrix fluid. If calcium is actively transported by secretory ameloblasts, the changes in radioactivity accumulated within the enamel must be expressed as a broken line, because the speeds of passive and active cellular transport of calcium are different in the cell layer. In addition, if the radiolabeled calcium enters the ameloblasts, the radioactivity of the layer must increase. However, the radioactivity within the enamel increased with the time almost linearly during the period examined, and the radioactivity of the ameloblast layer remained low and with little change, decreasing from the proximal side towards the distal side. These results indicate that calcium is not transported to the enamel surface by the secretory ameloblasts. Kawamoto and Shimizu (1994) showed that the amount of radiolabeled calcium incorporated into the enamel over a unit area is significantly low compared to that in the RA region, and that the ratio of radiolabeled calcium to radiolabeled phosphate incorporated by the enamel was the lowest value among the ratios in the mineralizing enamel, dentin, and bone. The ratio at the secretory stage enamel was only slightly lower than that in blood. On the basis of these results, they described that the net flux within the ameloblasts by the Ca-ATP pump is towards the intercellular spaces of the ameloblasts and the stratum intermedium cells.
It is known that radiolabeled calcium entering the maturation stage enamel rapidly diffuses to the entire thickness, although its diffusion in the secretory stage is restricted to the superficial layer of newly deposited matrix (Takano 1995; Kawamoto and Shimizu 1990; Kumamoto and Leblond 1956). We confirmed those findings and showed the diffusion patterns of calcium in enamel in more detail. In the maturation stage, calcium diffused more than 50 μm in depth for 1.8 sec, but only about 15 μm for 9.4 sec in the secretory stage.
Biochemical and histochemical studies (Uchida et al. 1991, 1995; Fukae et al. 1993; Robinson et al. 1979) have shown that much of the organic matrix localizes to the surface layer in the secretory stage and that the organic components suddenly decrease in the maturation stage. Fukae and Tanabe (1987) showed that a non-amelogenin and non-enamelin protein has a high affinity for calcium in forming porcine enamel. The diffusion of calcium to a deeper layer might be restricted by those organic components and/or for unknown physicochemical reasons.
Footnotes
Acknowledgements
This study was supported by research grant no. 08672145 from the Ministry of Education of Japan.