
Abstract
Furin is a dibasic endopeptidase responsible for the proteolytic maturation of many precursor proteins in the secretory and endocytic pathways of mammalian cells. The levels of furin expression in most cells are very low, and this has hampered attempts to identify the intracellular compartments in which endogenous furin is localized. We have used a specific antibody reagent to a sequence in the carboxy terminus of furin to perform immunofluorescent staining of mammalian cell lines. This antibody was sensitive enough to detect staining for furin in various cell lines. For the most part, furin staining was confined to a juxtanuclear structure characteristic of the Golgi complex. Analyses by video microscopy and confocal microscopy showed that the distribution of furin was distinct from that of mannosidase II, a marker of the Golgi stack, and most closely resembled that of TGN38, a marker of the trans-Golgi network. Therefore, our results suggest that endogenous furin is predominantly localized to the area of the Golgi complex, most likely within the trans-Golgi network.
F
Since the initial discovery of the existence of furin in mammalian cells, there has been considerable interest in determining its subcellular localization. However, attempts to immunolocalize endogenous furin have been hampered by the low abundance of the protein in most cells (van Duijnhoven et al. 1992). Evidently, a small amount of furin is sufficient to carry out the many proteolytic processes in which the enzyme is involved. Early studies of furin localization within cells involved overexpression of furin cDNA clones using vectors such as vaccinia virus in BSC-40 cells (Bresnahan et al. 1990) or replicating plasmids in COS-1 cells (van Duijnhoven et al. 1992; Misumi et al. 1991). The cells were analyzed by immunofluorescence microscopy using antibodies to furin. These studies demonstrated that the protein was concentrated within a juxtanuclear structure characteristic of the Golgi complex (van Duijnhoven et al. 1992; Misumi et al. 1991; Bresnahan et al. 1990).
The Golgi complex of mammalian cells is organized into three morphologically and functionally distinct regions: the cis-Golgi network (CGN), the Golgi stack, and the trans-Golgi network (TGN) (reviewed by Mellman and Simons 1992; Rothman and Orci 1992). The three regions of the Golgi complex can be readily resolved by immunoelectron microscopy but are difficult to distinguish by immunofluorescence microscopy. To identify the Golgi subcompartment in which furin accumulates, it was therefore necessary to develop expression systems and reagents suitable for immunoelectron microscopy analyses. Molloy et al. (1994) made a furin construct tagged with the FLAG epitope (Hopp et al. 1988) in the luminal domain of the protein. This construct was expressed in BSC-40 cells using a Vaccinia virus vector and the protein was visualized with antibodies to the FLAG epitope. Immunoelectron microscopy of these cells showed that furin was concentrated within the TGN, as demonstrated by colocalization with the endogenous TGN marker TGN38 (Molloy et al. 1994). In another study, Bosshart et al. (1994) placed either a FLAG or an HA epitope (Wilson et al. 1984) at the cytoplasmic carboxy terminus of furin and expressed the construct by stable transfection into rat basophilic leukemia (RBL) cells. The protein was detected by immunoelectron microscopy using antibodies to either epitope. This study also revealed that the protein was predominantly concentrated within the TGN (>80%), although a significant amount of the protein was found in vesicular structures with the characteristics of endosomes or lysosomes (Bosshart et al. 1994). The presence of furin within the TGN is consistent with its role in biosynthetic protein processing, and its presence in endosomal/lysosomal vesicles might account for the processing of endocytosed bacterial toxins.
It remains to be established the extent to which the localization of furin constructs that are overexpressed, modified with epitope tags, or both reflects the actual distribution of endogenous furin within cells. The only published report on the localization of endogenous furin has produced results that differ from those obtained using recombinant furin constructs (Sariola et al. 1995). Immunofluorescent labeling of untransfected BHK-21 cells with an antibody to a furin luminal peptide revealed staining of many vesicles that were scattered throughout the cytoplasm. No juxtanuclear Golgi-like staining was evident in these cells (Sariola et al. 1995). These observations raise questions about the actual site of furin localization within cells and about the validity of experiments done with recombinant furin constructs.
To address this apparent discrepancy, we decided to reevaluate the localization of endogenous furin using several antibody reagents that bind to different furin epitopes (Bosshart et al. 1994). One of these antibodies (Cfur), directed to the carboxy terminal cytoplasmic tail of furin, enabled us to visualize endogenous furin by conventional immunofluorescence microscopy. Using this antibody, we observed staining of a juxtanuclear Golgi-like structure in a number of cell lines. Examination of the stained cells by video microscopy and image analysis partially resolved the structure containing furin from that containing mannosidase II (i.e., the Golgi stack). In addition, analyses by confocal microscopy showed a high degree of overlap with the TGN marker TGN38. These observations are consistent with the idea that furin is predominantly localized to the TGN or to a compartment that is closely apposed to the TGN.
Material and Methods
Cells
The cell lines used in this study are listed in Table 1. B6 and RD4 cells were the kind gift of Dr. Joe Harford (NIH). AtT20 cells were kindly provided by Dr. Yoke Peng Loh (NIH). All of the other cells lines were obtained from the American Type Culture Collection (Rockville, MD). Cells were cultured in Dulbecco's modified Eagle's medium (DMEM) (Biofluids; Rockville, MD) supplemented with 10% (v/v) fetal bovine serum (FBS), 100 U/ml penicillin, and 100 (μg/ml streptomycin, except for CHO-K1 cells, which were grown in RPMI 1640 medium with the same supplements. RBL cells stably transfected with a furin-HA construct were described previously (Bosshart et al. 1994). Normal rat kidney (NRK) cells were transiently transfected with an HA-tagged TGN38 construct cloned into pCDM8, as described (Humphrey et al. 1993).
Antibodies
The antibody to furin, Cfur, was obtained by immunizing a rabbit with a peptide corresponding to the carboxy terminus of furin (SDSEEDEGRGERTAFIKDQSAL, residues 772–793). Other antibodies used were as follows: the rabbit antiserum JH4 to rat TGN38 (Humphrey et al. 1993); the mouse monoclonal antibody 53FC3 to mannosidase II (Burke et al. 1982); and the mouse monoclonal antibody HA11 to the HA epitope (Berkeley Antibody; Berkeley, CA). Secondary antibodies conjugated to fluorescein, rhodamine, or indocarbocyanine (Cy3) and suitable for multiple labeling experiments were obtained from Jackson ImmunoResearch (West Grove, PA).
Screening of cell lines for endogenous furin a
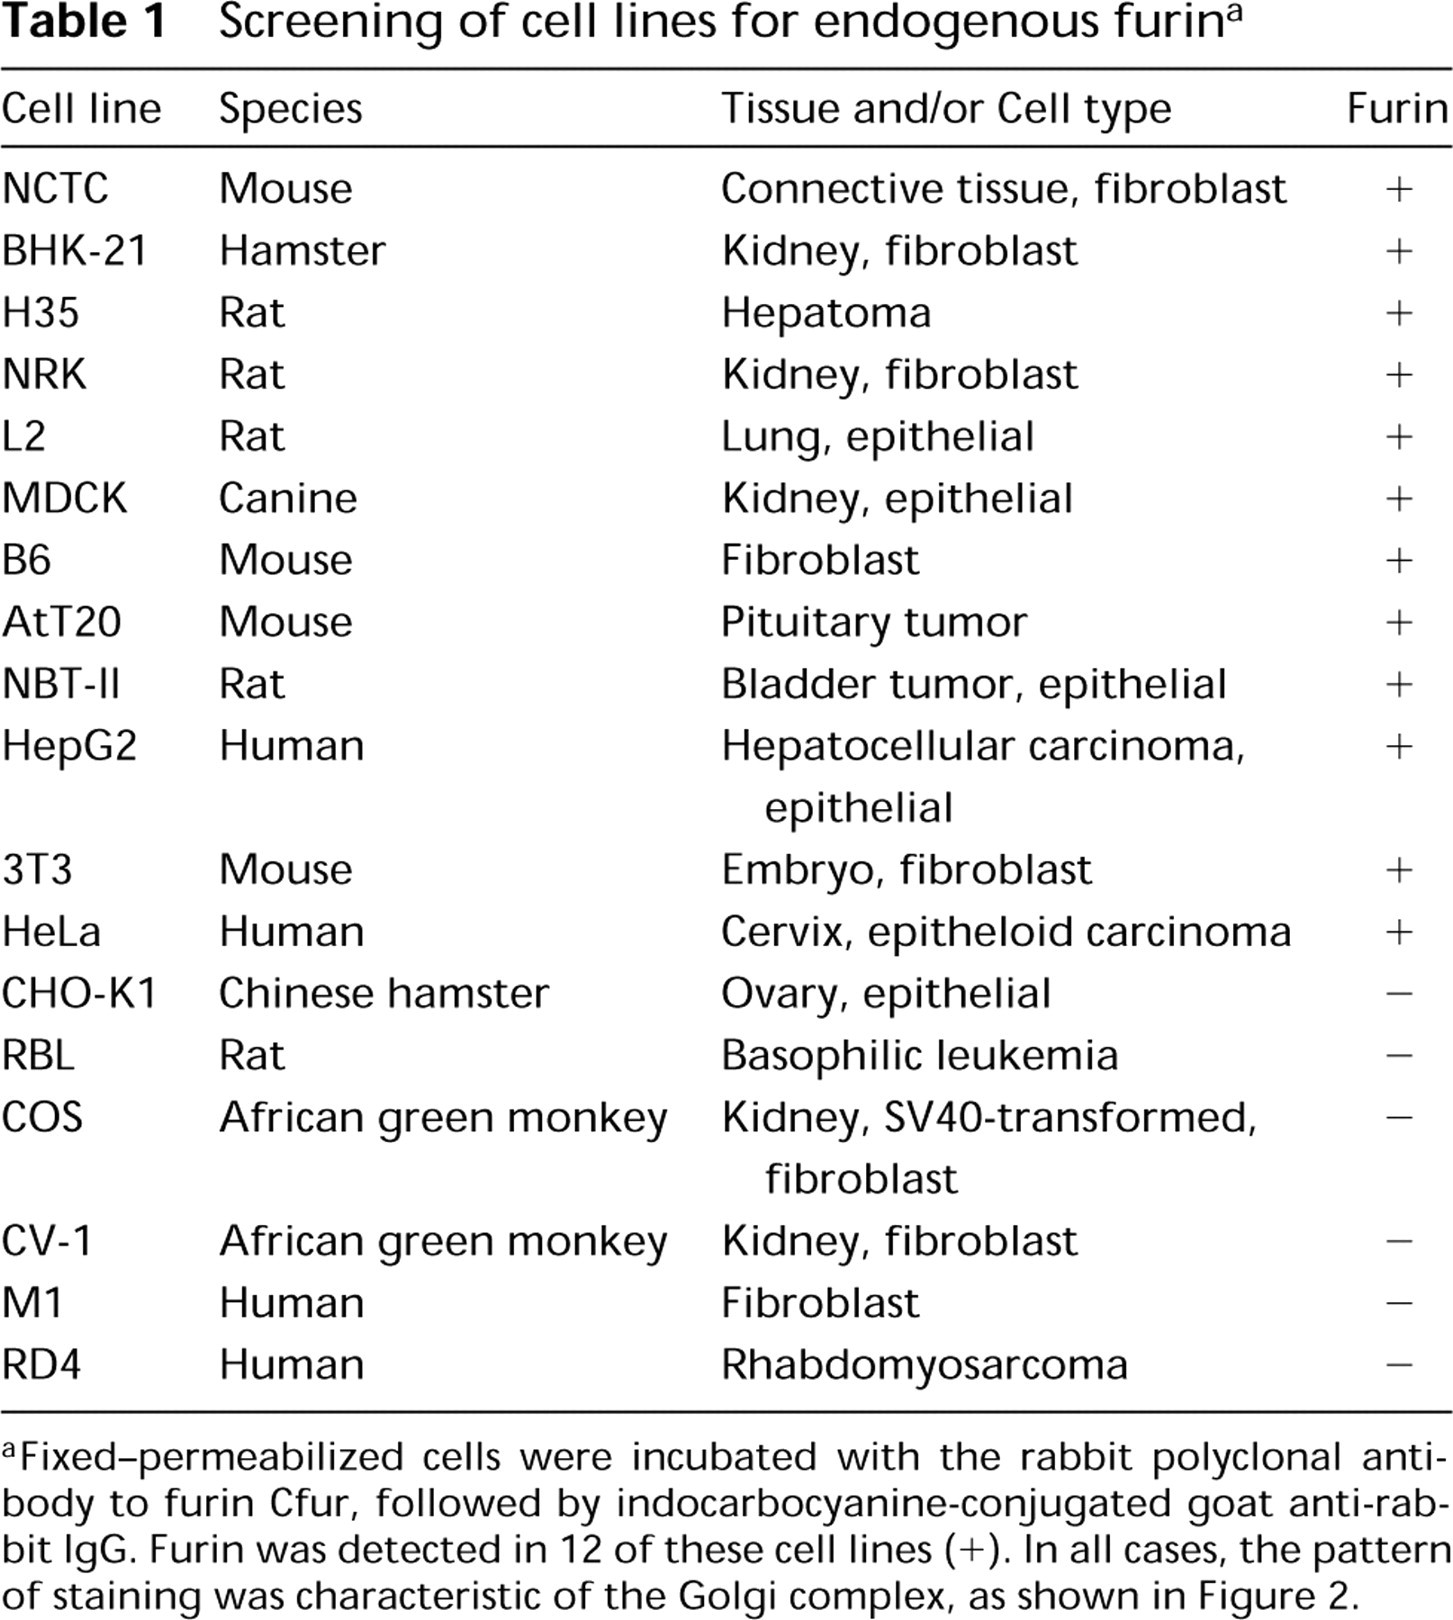
aFixed-permeabilized cells were incubated with the rabbit polyclonal antibody to furin Cfur, followed by indocarbocyanine-conjugated goat anti-rabbit IgG. Furin was detected in 12 of these cell lines (+). In all cases, the pattern of staining was characteristic of the Golgi complex, as shown in Figure 2.
Metabolic Labeling
Untransfected RBL cells or RBL cells stably transfected with a furin-HA construct (Bosshart et al. 1994) were grown to confluence on 100-mm culture plates. Cells were washed twice with PBS and incubated in methionine-free DMEM with 2% (v/v) dialyzed FBS, 100 U/ml penicillin, and 100 (μg/ml streptomycin (labeling medium) for 30 min at 37C. Cells were then labeled for 30 min at 37C with 0.5 mCi/ml [35S]-methionine (Tran 35S-label; ICN Radiochemicals, Irvine, CA) in labeling medium. The labeled cells were scraped off the culture plates in ice-cold PBS, collected by centrifugation at 1500 X g for 5 min, and frozen at −20C.
Immunoprecipitation
The labeled cells were thawed at 4C and lysed by incubation for 15 min at 4C in 1% (w/v) Triton X-100 0.5% (w/v) sodium deoxycholate, 0.3 M NaCl, and 50 mM Tris-HCl, pH 7.4 (lysis buffer). The lysates were cleared by centrifugation at 15,000 X g for 15 min at 4C, filtered through 0.45-(μm Millex-HA filters (Millipore; Bedford, MA), and incubated for 2 hr at 4C with the Cfur antibody (5 μ1 per sample) bound to protein A-Sepharose beads. The beads were washed three times with 0.1% (w/v) Triton X-100, 0.3 M NaCl, and 50 mM Tris-HCl, pH 7.4, and then three times with PBS. The washed beads were boiled in sample buffer as described by Laemmli (1970). The immunoprecipitated proteins were then separated by SDS-PAGE on 8% (w/v) acrylamide gels, which were processed for fluorography with 1 M sodium salicylate.
Glutathione-S-transferase (GST) Fusion Proteins
The sequence encoding the cytoplasmic tail of mouse furin (Hatsuzawa et al. 1990) was amplified by PCR and cloned into the pGEX 5X-1 vector (Pharmacia Biotech; Piscataway, NJ) using the 5’ EcoR1 and the 3’ SalI restriction sites. GST and the GST furin tail fusion protein were produced according to the manufacturer's instructions. The purity and integrity of the purified GST proteins were confirmed by SDS-PAGE.
Immunofluorescent Staining and Conventional Microscopy
Cells were grown on glass coverslips to 30–70% confluency and fixed for 15 min at room temperature (RT) in 2% (w/v) formaldehyde in PBS. After washing in PBS, the cells were incubated for 45 min at RT with primary antibodies diluted in PBS containing 0.1% saponin, washed in PBS to remove excess antibodies, and then incubated for 30 min at RT with fluorescently labeled secondary antibodies. After a final wash with PBS, the coverslips were mounted on microscope slides with Fluoromount G (Southern Biotechnology Associates; Birmingham, AL). Samples were examined with a Zeiss Photomicroscope equipped with a X63 Planapo lens (Carl Zeiss; Oberkochen, Germany) and photographed with Kodak Tri-X-pan ASA 400 film.
Video Microscopy/Image Analysis
Cells stained with two different fluorochromes were examined with a modular light microscope (custom made by Yona Microscopes; Columbia, MD) fitted with an infinity-corrected lens (X100, 1.3 numerical aperture; Zeiss). A 100-W mercury lamp connected to fiberoptic cables was used as the light source. Neutral density, excitation, emission, and dichroic filters (Omega Optical; Brattleboro, VT) selected the appropriate spectra for fluorescein, rhodamine, and indocarbocyanine optics.
Biological Detection Systems imaging software (v 1.6, now Oncor Imaging; Oncor Instruments, San Diego, CA) was used to acquire images via an interface with an electronic control box (MAC 2000; Ludl Electronic Products; Hawthorne, NY) which regulated a filter wheel containing the optical filters and the shutter. The microscope has two image detection systems. The first was used to locate and focus on the cells of choice. It included a CCD (charge-coupled device)-containing video camera (CCD-72; Dage-MTL, Michigan City, IN) and a quick capture card (Data Translation; Marlboro, MA). The second system was used to shunt images to the computer. A temperature-regulated cooled-CCD (model NU-200; Photometrics, Tucson, AZ) was used to capture digital images with a KAF-1400 chip (Eastman-Kodak; Rochester, NY).
All digital image processing was accomplished by use of IPLab Spectrum software (Signal Analytics; Vienna, VA). An appropriate background image (illuminated with fluorescein, rhodamine, or indocarbocyanine) was first subtracted from the images, which were then converted into 8 bits (256 gray levels) and combined into 24-bit color images. Image enhancement approaches for data presentation included contrast stretching, smoothing, and sharpening filtering.
Confocal Microscopy
In the experiment shown in Figures 5D-5F, double-stained specimens were examined with a Zeiss Laser Scan Microscope LSM 410 fitted with a X63 Plan-Apochromat lens.
Results
The Cfur rabbit polyclonal antibody was raised to a carboxy-terminal sequence of furin which is highly conserved among mammals (Misumi et al. 1991; Hatsuzawa et al. 1990; van den Ouweland et al. 1990). The specificity of the antibody was tested for its ability to recognize a furin-HA construct expressed in stably transfected rat basophilic leukemia (RBL) cells. Untransfected RBL cells or RBL cells transfected with a furin-HA construct were pulse-labeled for 30 min with [35S]-methionine and cell lysates were subjected to immunoprecipitation with serum from an unimmunized rabbit (NIS) or with the Cfur antibody (Figure 1). No labeled furin could be detected in immunoprecipitates from untransfected RBL cells (Figure 1, Lane 2), suggesting either that furin is not expressed in these cells or that it is expressed at very low levels. In contrast, Cfur immunoprecipitates from RBL cells expressing furin-HA displayed two prominent bands (Figure 1, lane 4), which corresponded to furin species with or without the amino terminal pro-region, as previously described (Leduc et al. 1992). The immunoprecipitation of these two species by Cfur was specific, as it was not observed with the use of normal rabbit serum (Figure 1, lane 3).
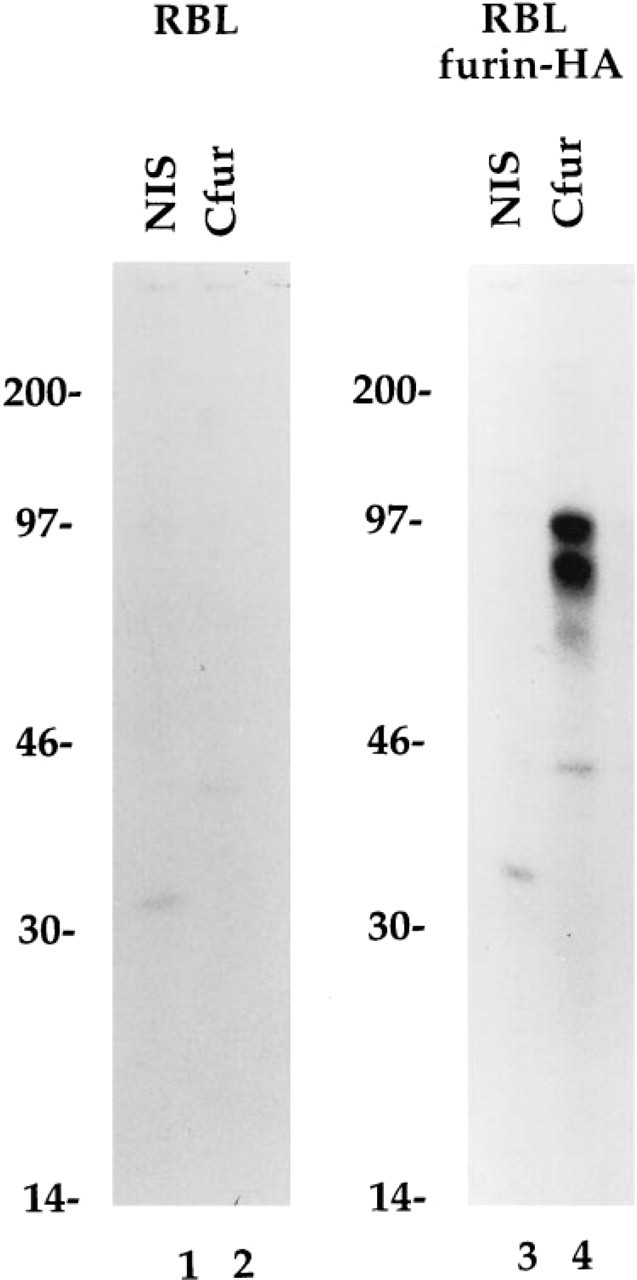
Specific immunoprecipitation of furin with the antibody Cfur. RBL cells (Lanes 1 and 2) or RBL cells expressing furin-HA (Lanes 3 and 4) were metabolically labeled with 0.5 mCi/ml [35S]-methionine as described in Materials and Methods. Cell lysates were incubated with either nonimmune serum (NIS) (Lanes 1 and 3) or Cfur (Lanes 2 and 4) bound to protein A-Sepharose. Immunoprecipitates were resolved by SDS-PAGE on 8% acrylamide gels. The positions of molecular weight markers (expressed as 10-3 X Mr) are shown at left.
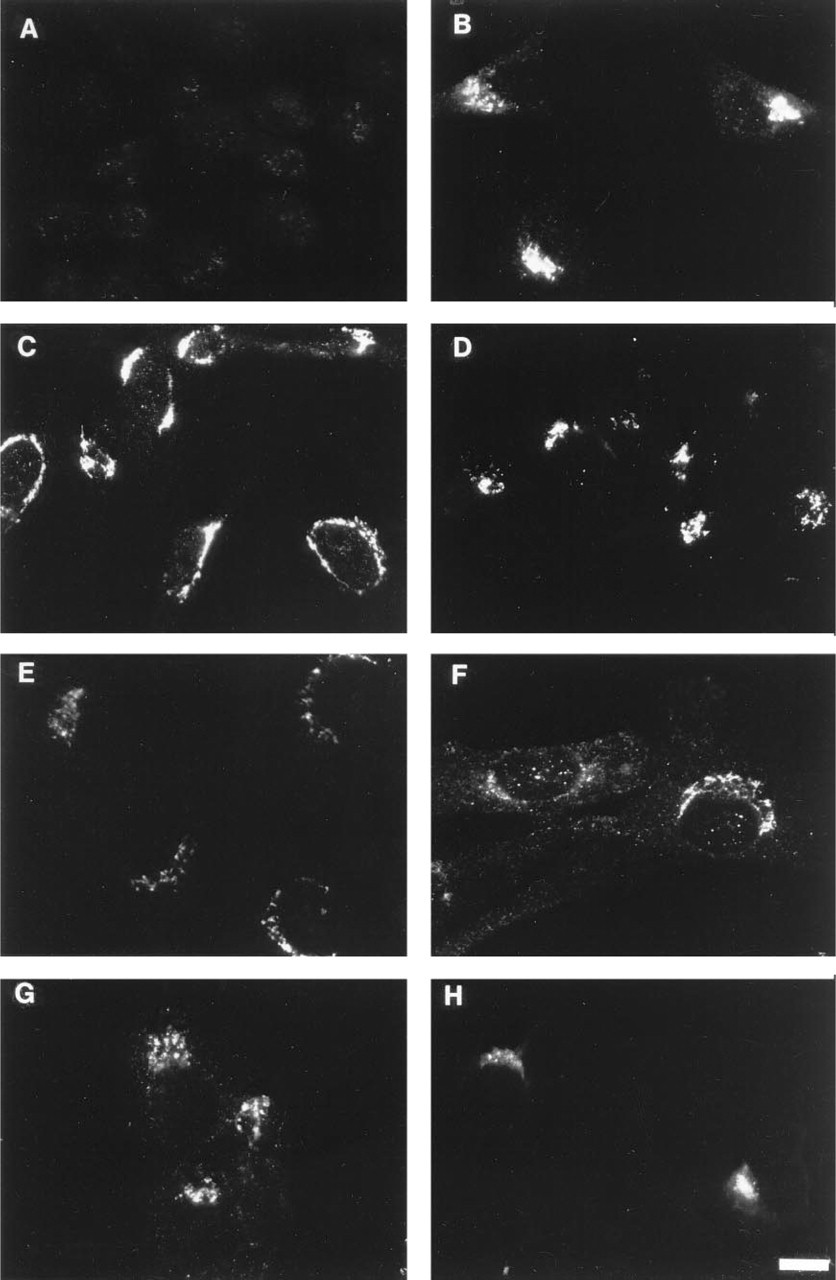
Immunofluorescence microscopy localization of furin in various cell lines. Cells were stained with Cfur, a rabbit antibody to furin, followed by indocarbocyanine-conjugated goat anti-rabbit lgG. The cell lines shown in the figure are: (
Having established that the Cfur antibody was capable of recognizing furin specifically, we screened a total of 18 cultured cell lines for expression of endogenous furin by immunofluorescence microscopy utilizing the Cfur antibody. In agreement with the metabolic labeling-immunoprecipitation experiment described above, no staining for furin could be detected in untransfected RBL cells (Figure 2A). In contrast, staining for endogenous furin could easily be detected in 12 other cell lines derived from different animal species and tissues (Figures 2B-2H; Table 1). In all of these cells, furin staining was mainly localized to a juxtanuclear structure characteristic of the Golgi complex, although a few stained vesicular structures were also seen in some cells. In addition to these structures, we also observed faint punctate staining throughout the cell. Staining of the Golgi-like structure was particularly bright NRK cells. Therefore, all of the subsequent experiments were performed using this cell line.
To establish whether the pattern of staining with the Cfur antibody was specific, glutathione-S-transferase (GST) or a GST-furin tail fusion protein were used as competitors in the immunofluorescence microscopy experiments (Figure 3). Binding of Cfur to the GST-furin tail fusion protein was expected to prevent specific staining for endogenous furin. Addition of normal GST produced a staining pattern indistinguishable from that of cells incubated with Cfur alone (Figure 3; compare 3A and 3B). In contrast, incubation in the presence of the GST-furin tail construct completely abrogated staining of the Golgi-like structure without affecting the background punctate staining (Figure 3C). This observation demonstrated that staining of the Golgi-like structure was specific, whereas the punctate staining was not. Therefore, the results of these immunofluorescence microscopy experiments were consistent with the localization of endogenous furin to a region of the Golgi complex, as reported earlier for recombinant furin constructs (Bosshart et al. 1994; Molloy et al. 1994; van Duijnhoven et al. 1992; Misumi et al. 1991; Bresnahan et al. 1990).
We next attempted to further define the localization of furin by immunoelectron microscopy. Unfortunately, we failed to observe specific staining using Cfur, probably due to the low abundance of furin and to the low sensitivity of the immunoelectron microscopy techniques we used. It was therefore not possible to establish whether endogenous furin, like the transfected furin constructs, was localized to the TGN. However, we thought that it would be possible to obtain more information from immunofluorescent staining experiments by comparing the localization of furin with other markers of the Golgi complex, as previously done for other Golgi proteins (Berger et al. 1995; Nilsson et al. 1993; Antony et al. 1992). The procedure consisted of incubating fixed-permeabilized cells with antibodies to furin and to other Golgi markers, followed by incubation with secondary antibodies conjugated to two different fluorochromes (fluorescein and rhodamine or indocarbocyanine). Specimens were examined with a combination of video microscopy and image analysis (see Materials and Methods). The lack of co-localization was seen as either green or red staining, whereas regions of co-localization produced a yellow color.
Several controls were performed to verify the validity of this approach. First, it was important to determine that there was no register shifting in the images obtained using the two different fluorochromes. This was controlled by coating Staphylococcus aureus particles with rabbit IgG and then with a mixture of fluorescein- and rhodamine-conjugated anti-rabbit antibodies. The double-stained particles were added to each coverslip before mounting them on slides. In most cases, no shifts were observed for the double-stained particles. In the few instances when a shift did occur (by two or three pixels), the images were aligned using image analysis software.
The second control consisted of staining NRK cells with 53FC3, a mouse monoclonal antibody to mannosidase II, a marker of cis-medial cisternae of the Golgi stack (Novikoff et al. 1983; Burke et al. 1982). This was followed by staining with both fluorescein-and rhodamine-conjugated secondary antibodies to mouse IgG. The fluorescein and rhodamine images were indistinguishable from each other (Figures 4A and 4B) and produced a completely yellow image when superimposed (Figure 4C). This experiment demonstrated that when both fluorescence signals emanate from the same cellular compartment, the overlap detected using this method is complete.
To test whether this image analysis technique was capable of distinguishing between different regions of the Golgi complex, cells were double stained for man-nosidase II and TGN38, a TGN marker (Luzio et al. 1990). Analysis of these cells showed that the Golgi stack (green) and the TGN (red) were in close proximity to each other but could be largely separated using this method (Figures 4D-4F). The fact that there were some yellow areas in the merged images could mean that there is some physical overlap between mannosidase II and TGN38, or otherwise could be an indication of the limitations of the method.
Next, we compared the localization of mannosidase II and furin (Figure 5). We observed that although the compartments containing mannosidase II (green) and furin (red) were in the same area of the cell, their structures were clearly distinguishable, even when cells were examined in a single channel (Figures 5A and 5B). Superimposition of the two images revealed some regions of overlap (yellow), although for the most part the proteins were separated (green or red) (Figure 5C). The fact that some structures were either bright red or bright green suggests that the separation is not due to different intensities of the two fluorescent signals but reflects a spatial segregation of the two proteins.
Specificity of furin staining. NRK cells were fixed-permeabilized and stained with Cfur alone (
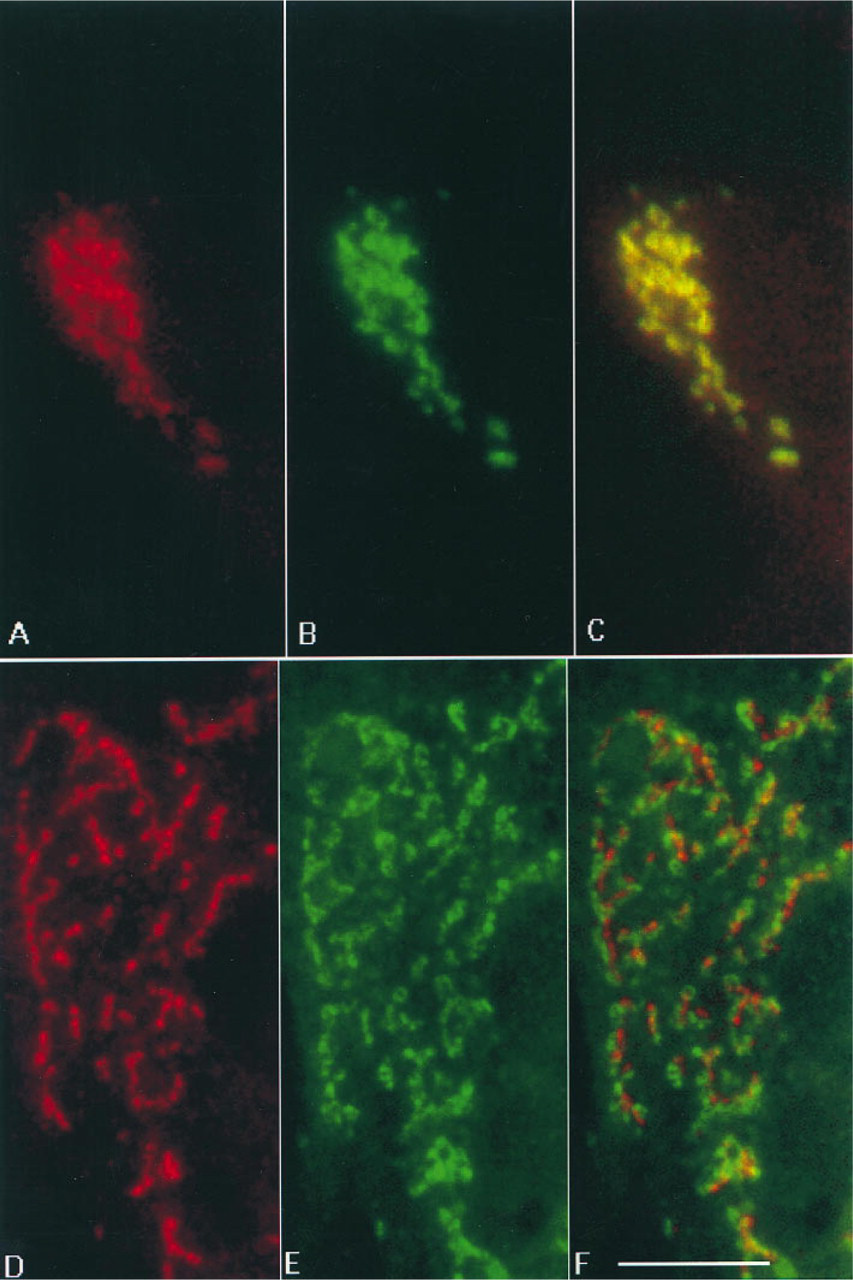
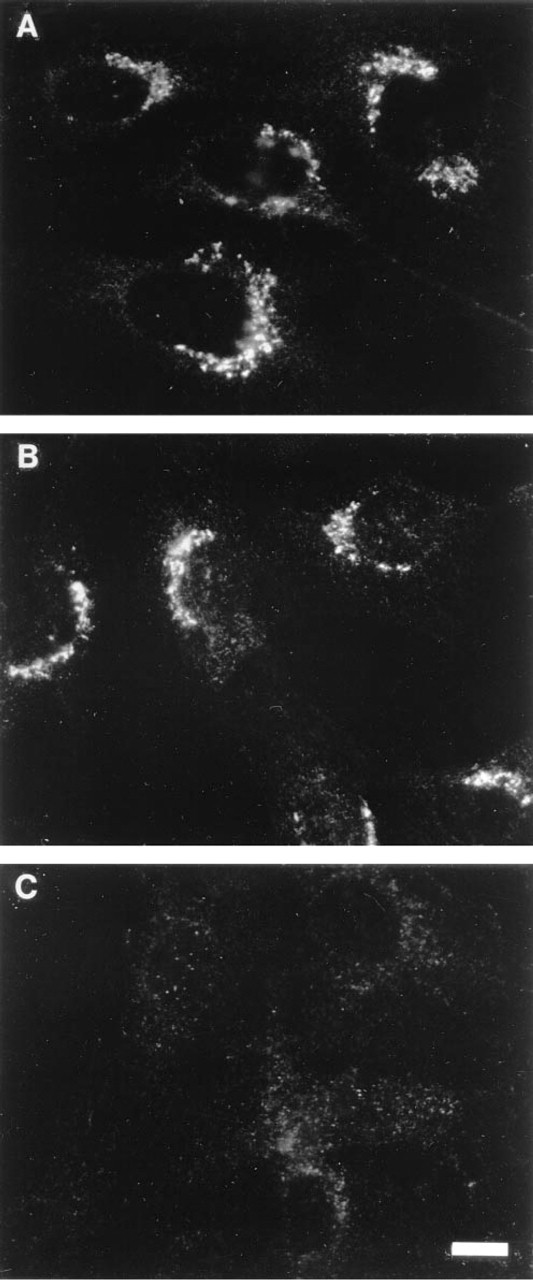
Video microscopic analysis of the localization of proteins of the Golgi complex. (A-C) Double labeling of mannosidase II. Fixed-permeabi-lized NRK cells were stained with a mouse antibody to mannosidase II (53FC3), followed by both fluores-cein- and rhodamine-conjugated anti-mouse IgG antibodies. This produced identical images of mannosidase II in both the rhodamine (A) and the fluo-rescein (B) channel. The complete co-localization shown in the yellow composite image (C) indicates that the two initial images were not shifted relative to each other when the composite image was created. (D-F) Double staining of mannosidase II and TGN38. Fixed-permeabilized NRK cells were simultaneously stained with a mouse antibody to mannosidase II (53FC3) and a rabbit antibody to TGN38 (JH4), followed by fluorescein-conjugated antibodies to mouse IgG and indocarbocyanine-conjugated goat anti-rabbit IgG. The composite image (F) produced by merging the images of TGN38 (D) and mannosidase II (E) shows little overlap of the two proteins (in yellow), consistent with their localization to different compartments of the Golgi complex. Bar = 10 μ.m.
Finally, we compared the localization of furin with the localization of TGN38, a TGN marker (Luzio et al. 1990). Although the two images were not identical, we observed a high degree of overlap of these two proteins, as shown by the predominance of yellow in Figure 5C. Taken together, these immunofluorescence microscopic observations suggest that furin has a distribution that is more similar to the TGN than to the Golgi stack.
Discussion
The results of our study demonstrate that endogenous furin is predominantly localized to a juxtanuclear structure characteristic of the Golgi complex. This conclusion is consistent with previous morphological studies on the localization of recombinant furin (Bosshart et al. 1994; Molloy et al. 1994; van Duijnhoven et al. 1992; Misumi et al. 1991; Bresnahan et al. 1990), as well as with functional analyses of endogenous furin activity in permeabilized cells (Xu and Shields, 1993). Our results differ from those of Sariola et al. (1995), who detected endogenous furin exclusively within scattered vesicles reminiscent of peripheral endosomes. On the basis of previous studies (Jones et al. 1995; Voorhees et al. 1995; Bosshart et al. 1994; Chapman and Munro 1994), it is clear that a certain amount of endogenous furin exists within compartments of the endosomal-lysosomal system. This furin could be part either of a pool of molecules that cycle between the plasma membrane and the TGN or of those that are en route to a lysosomal compartment. It is also possible that furin undergoes cycling between the TGN and an endosomal compartment, as previously discussed (Bosshart et al., 1994). The amount of furin in the endosomal-lysosomal system at steady state is probably below the level of detection of our immunofluorescence microscopy methods. As discussed by Sariola et al. (1995), the different staining patterns observed for endogenous furin might be due to the specificity of the antibodies used. It is likely that some antibodies to the luminal domain recognize conformations of the protein that are predominantly found within endosomal-lysosomal structures. The availability of such conformation-sensitive antibodies should allow analyses of structural changes in the furin molecule as it traffics through different compartments of the secretory and endocytic pathways.
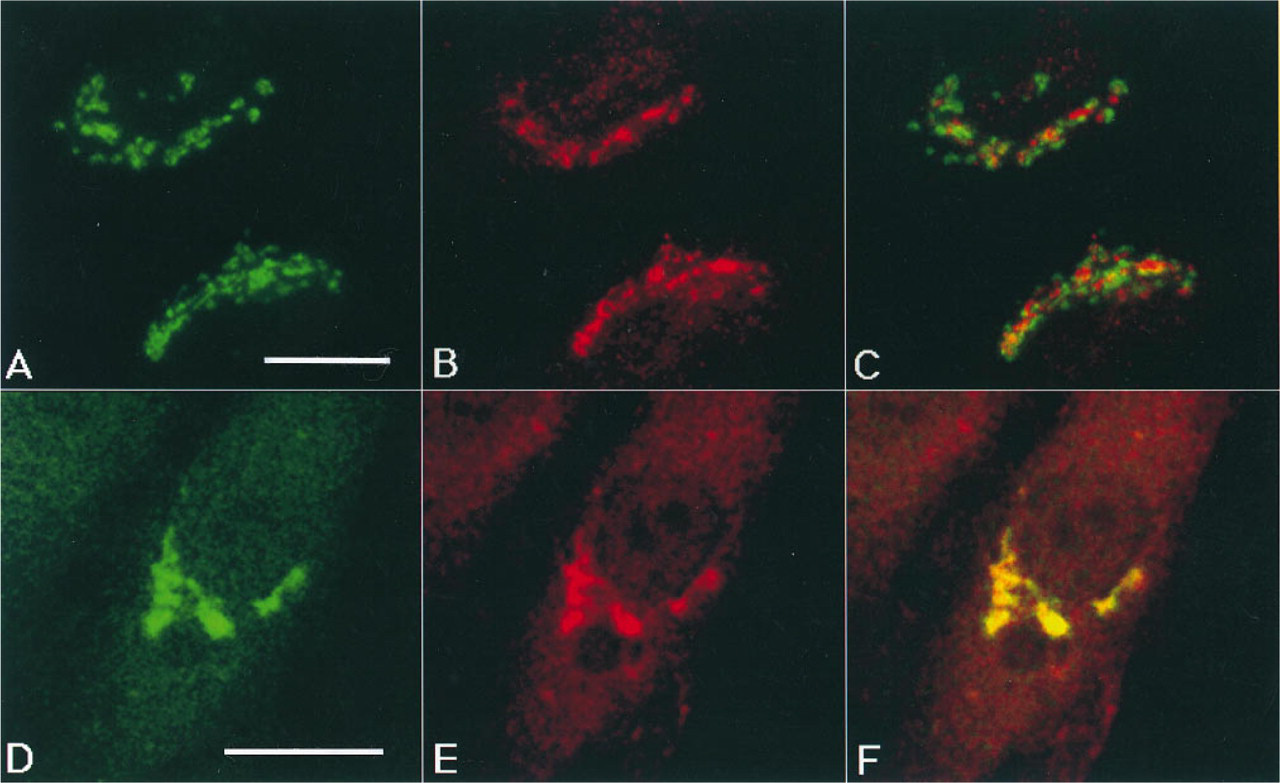
Comparison of the distribution of furin in relation to mannosidase II and TGN38. (A-C) NRK cells were stained simultaneously with a rabbit antibody to furin (Cfur) and a mouse antibody to mannosidase II (53FC3), followed by both rhodamine-conjugated goat anti-rabbit IgG and fluorescein-conjugated antibodies to mouse IgG. The double-stained cells were examined by video microscopy. The composite image (C) produced by merging the images of furin (A) and mannosidase II (B) shows some regions of overlap (yellow) and regions in which the two proteins do not overlap (red or green). (D-F) Confocal microscopic analysis of the distribution of furin and TGN38. NRK cells transiently expressing an HA-tagged form of TGN38 were stained simultaneously with a rabbit antibody to furin (Cfur) and a mouse antibody to the HAepitope (HA11), followed by a mixture of indocarbocyanine-conjugated goat anti-rabbit IgG and fluorescein-conjugated antibodies to mouse IgG. The composite image (C) produced by merging the images of furin (A) and TGN38 (B) shows a high degree of overlap of the two proteins (yellow). Bars = 10 μ.m.
The results of immunofluorescence double-staining experiments show that the distribution of furin overlaps to a large extent with that of TGN38 and less with that of mannosidase II. These observations suggest that endogenous furin is predominantly localized to the TGN or to a compartment that is closely ap-posed to it. The potential localization of endogenous furin to the TGN has important implications for the physiology of precursor protein cleavage. The observations presented here suggest that most secreted and cellular proteins undergo cleavage at the TGN while in transit to the plasma membrane. Therefore, pro-teolytic processing by endogenous furin does not require diversion of the precursor proteins away from the secretory pathway, as would be the case if furin were exclusively localized to endosomal-lysosomal vesicles. The detection of endogenous furin protein in cells derived from different animal species and tissues agrees with previous studies of furin mRNA expression (Hatsuzawa et al. 1990; Schalken et al. 1987) and confirms that furin has a widespread distribution. In addition, our study suggests that the localization of furin to the area of the Golgi complex is similar in all cells that express the protein.
The double-staining method used in our study is similar to others that have been used before to examine the localization of various Golgi proteins (Berger et al. 1995; Nilsson et al. 1993; Antony et al. 1992). Although these methods have limited resolution, we believe that, with appropriate controls, they can provide an approximate localization of a protein for cases in which immunoelectron microscopy is not feasible. An important control in our study was to show that the merged images were in register, as determined using the fluorescent S. aureus particles. This was further confirmed by showing that when the same protein is simultaneously stained with two different fluorochromes, the merged images are completely yellow (Figure AC). The lack of extensive overlap observed for some of the proteins (e.g., mannosidase II-TGN38, mannosidase II-furin) was most likely not due to differences in intensity of the two fluorochromes, as we could observe both bright red and bright green structures in the same cells. It is therefore apparent that this approach has the potential to distinguish the localization of proteins that reside in different parts of the Golgi complex. This type of analysis does not necessarily require the use of sophisticated equipment, as we could observe whether two proteins overlapped even in a conventional fluorescence microscope fitted with a filter that allowed simultaneous visualization of red and green fluorescence (data not shown). Therefore, although a definitive identification of the subcompart-ment of the Golgi complex in which endogenous furin accumulates will only be achieved by immunoelectron microscopy, the present results are most consistent with the bulk of furin being localized to the TGN or to a closely related pericentriolar structure.
Footnotes
Acknowledgements
We thank Carolyn Smith, John Presley, and Carl Baker for their help in printing Figures 4 and ![]() . We are also grateful to Jennifer Fippincott-Schwartz and Michael Marks for critical review of the manuscript.
. We are also grateful to Jennifer Fippincott-Schwartz and Michael Marks for critical review of the manuscript.