
Abstract
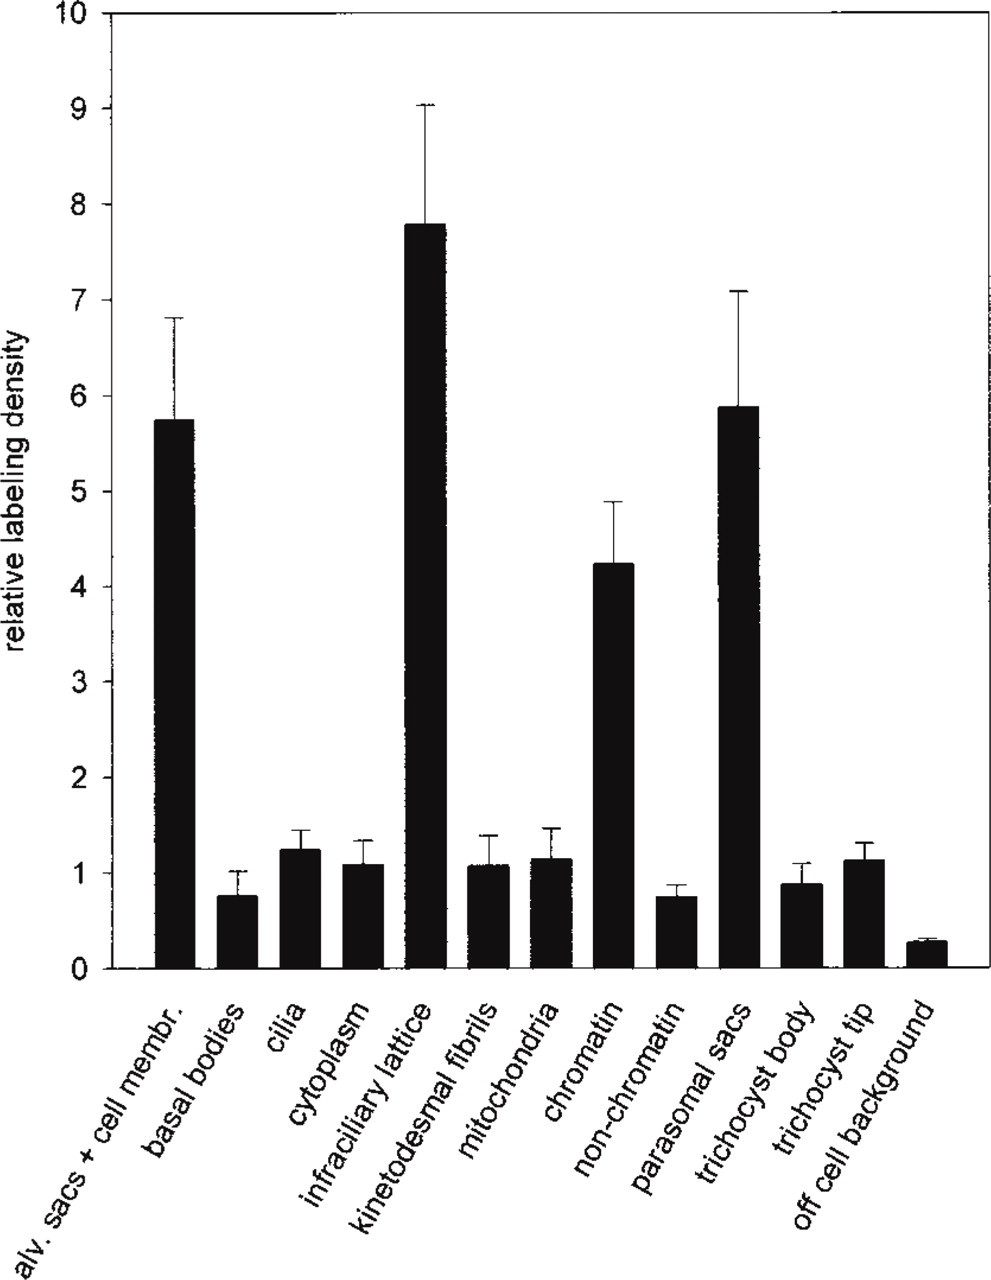
For immunogold EM labeling analysis, we fixed Paramecium cells in 4% formaldehyde and 0.125% glutaraldehyde, followed by low-temperature embedding in unicryl and UV polymerization. We first quantified some obvious but thus far neglected side effects of section staining on immunogold labeling, using mono- or polyclonal antibodies (Abs) against defined secretory and cell surface components, followed by F(ab)2– or protein A–gold conjugates. Use of alkaline lead staining resulted in considerable rearrangement and loss of label unless sections were postfixed by glutaraldehyde after gold labeling. This artifact is specific for section staining with lead. It can be avoided by staining sections with aqueous uranyl acetate only to achieve high-resolution immunogold localization of a protein phosphatase on unicryl sections. In general, phosphatases are assumed to be closely, although loosely, associated with their targets. Because the occurrence of protein phosphatase 2B (calcineurin) in Paramecium has been previously established by biochemical and immunological work, as well as by molecular biology, we have used Abs against mammalian CaN or its subunits, CaN-A and CaN-B, for antigen mapping in these cells by quantitative immunogold labeling analysis. Using ABs against whole CaN, four structures are selectively labeled (with slightly decreasing intensity), i.e., infraciliary lattice (centrin-containing contractile cortical filament network), parasomal sacs (coated pits), and outlines of alveolar sacs (subplasmalemmal calcium stores, tightly attached to the cell membrane), as well as rims of chromatin-containing nuclear domains. In other subcellular regions, gold granules reached densities three to four times above background outside the cell but there was no selective enrichment, e.g., in cilia, ciliary basal bodies, cytosol, mitochondria, trichocysts (dense-core secretory organelles), and non-chromatin nuclear domains. Their labeling density was 4- to 8.5-fold (average 6.5-fold) less than that on selectively labeled structures. Labeling tendency was about the same with Abs against either subunit. Our findings may facilitate the examination of molecular targets contained in the selectively labeled structures.
A
In the ciliated protozoan Paramecium tetraurelia, immunological evidence first suggested the occurrence of CaN and a role in exocytosis regulation (Momayezi et al. 1987), but the cloning of the gene (Hinrichsen et al. 1995) and enzymatic as well as pharmacological characterization (Kissmehl et al. 1997) occurred much later. In these studies we recognized a 63- and a 17-kD subunit on Western blots using antibodies (Abs) that we prepared against complete CaN from bovine brain. These Abs have now been used for postembedding immunogold EM localization. We used non-permeabilized cells embedded in unicryl-type methacrylate resin in conjunction with low-temperature UV polymerization.
We applied low-temperature embedding to account for the fact that, in general, ~50% of CaN may be cytosolic, the other 50% being membrane bound (Yakel 1997). Sites of considerable enrichment of antigen can be identified most easily by the quantitative analysis we perform. To achieve this, it is essential to avoid any serious redistribution. Therefore, we add, as a technical note, our observation on section staining by alkaline lead citrate which, although frequently used, may blur originally clear-cut immunogold labeling. Sufficiently long staining with aqueous uranyl acetate is an easy alternative because this maintains high resolution and sensitivity by avoiding displacement and loss of gold granules.
This is the first ultrastructural immuno-EM (electron microscopic) localization of CaN. Among the intensely labeled structures in Paramecium, there are some targets to be expected from biochemical analyses but also some additional unexpected ones, thus providing important suggestions for future work. In detail, we find intensely labeled “infraciliary lattice” (cortical centrin-containing contractile filament system), outlines of “alveolar sacs” [suplasmalemmal calcium stores (Stelly et al. 1991; Länge et al. 1995)], docking sites of “trichocysts” (dense-core secretory organelles), “parasomal sacs” (coated pits), and chromatin-enriched nuclear domains. We also tried, although only qualitatively, to elaborate differential labeling with Abs against subunits A and B, all with the same pattern. Remarkably, the same methodology applied to localize some other protein phosphatases in Paramecium, PP1 (Momayezi et al. 1996) and PP2C (Grothe et al. 1998), gave quite different labeling patterns.
Materials and Methods
Cell Cultures
Paramecium tetraurelia wild-type cells (strain 7S) were cultivated as described (Plattner et al. 1997b).
Fixation and Embedding
Cells were fixed for 30 min at 4C in 4% formaldehyde plus 0.125% glutaraldehyde in PBS, pH 7.2, washed three times for 10 min each in PBS containing 50 mM glycine, and dehydrated in increasing ethanol concentrations (30, 50, 70, 90, and 2 times 100%, 5 min each). This was followed by impregnation with unicryl resin (British BioCell; London, UK) at 0C, with two changes at 2-hr intervals and then overnight, followed by UV polymerization at −25C for 24 hr.
Antibody Labeling
Ultrathin sections collected on formvar-coated nickel grids were pretreated twice for 10 min with 20 μl of PBS + glycine (50 mM) and then immersed in PBS supplemented with 0.5% bovine serum albumin (BSA) and 0.5% goat serum for 10 min at room temperature (RT), to eliminate nonspecific gold adsorption. Then the grids were incubated with primary Abs diluted in PBS supplemented with 0.2% BSA-c (BioTrend; Köln, Germany) pH 7.4, for 1 hr at RT (or for 24 hr at 4C). Ab dilutions were 1:30. Note that BSA-c is an acetylated form which, due to increased net charge, reduces nonspecific adsorption of gold conjugates.
The primary Abs used were anti-CaN (subunit A+B) Abs (designated R299) as specified previously (Kissmehl et al. 1997; Hens et al. 1998) and Abs against subunit A (Stressgen; Victoria, BC, Canada) or B (Affinity Bioreagents; Golden, CO). All these Abs were polyclonal Abs from rabbit directed against antigens isolated from bovine brain.
Samples were washed in PBS/BSA-c, three times for 10 min each, and treated for 1 hr with gold conjugates. We used either goat anti-rabbit (GαR) IgGs, F(ab)2 fragments derived from these GαR IgGs, or protein A (pA), coupled to 5- or 10-nm gold (Au5, Au10) as indicated. Gold conjugates of IgGs and of pA were from BioTrend and from the University of Utrecht (Department of Cell Biology, School of Medicine, Utrecht, The Netherlands), respectively. Dilution was 1:20 for Ab–gold conjugates and 1:40 for pA–gold conjugates.
The specificity of immunogold labeling was verified by a significant reduction in the number of gold particles on sections incubated with Abs preadsorbed with the original antigen, i.e., Abs against CaN from bovine brain (50 μg/ml of diluted Ab solution).
After labeling, sections were rinsed with distilled water, fixed for 5 min with 2% glutaraldehyde, and routinely stained for 5 min with 2% aqueous uranyl acetate only (unbuffered, pH 4.5). In experiments on the effects of section staining, these parameters were varied as follows.
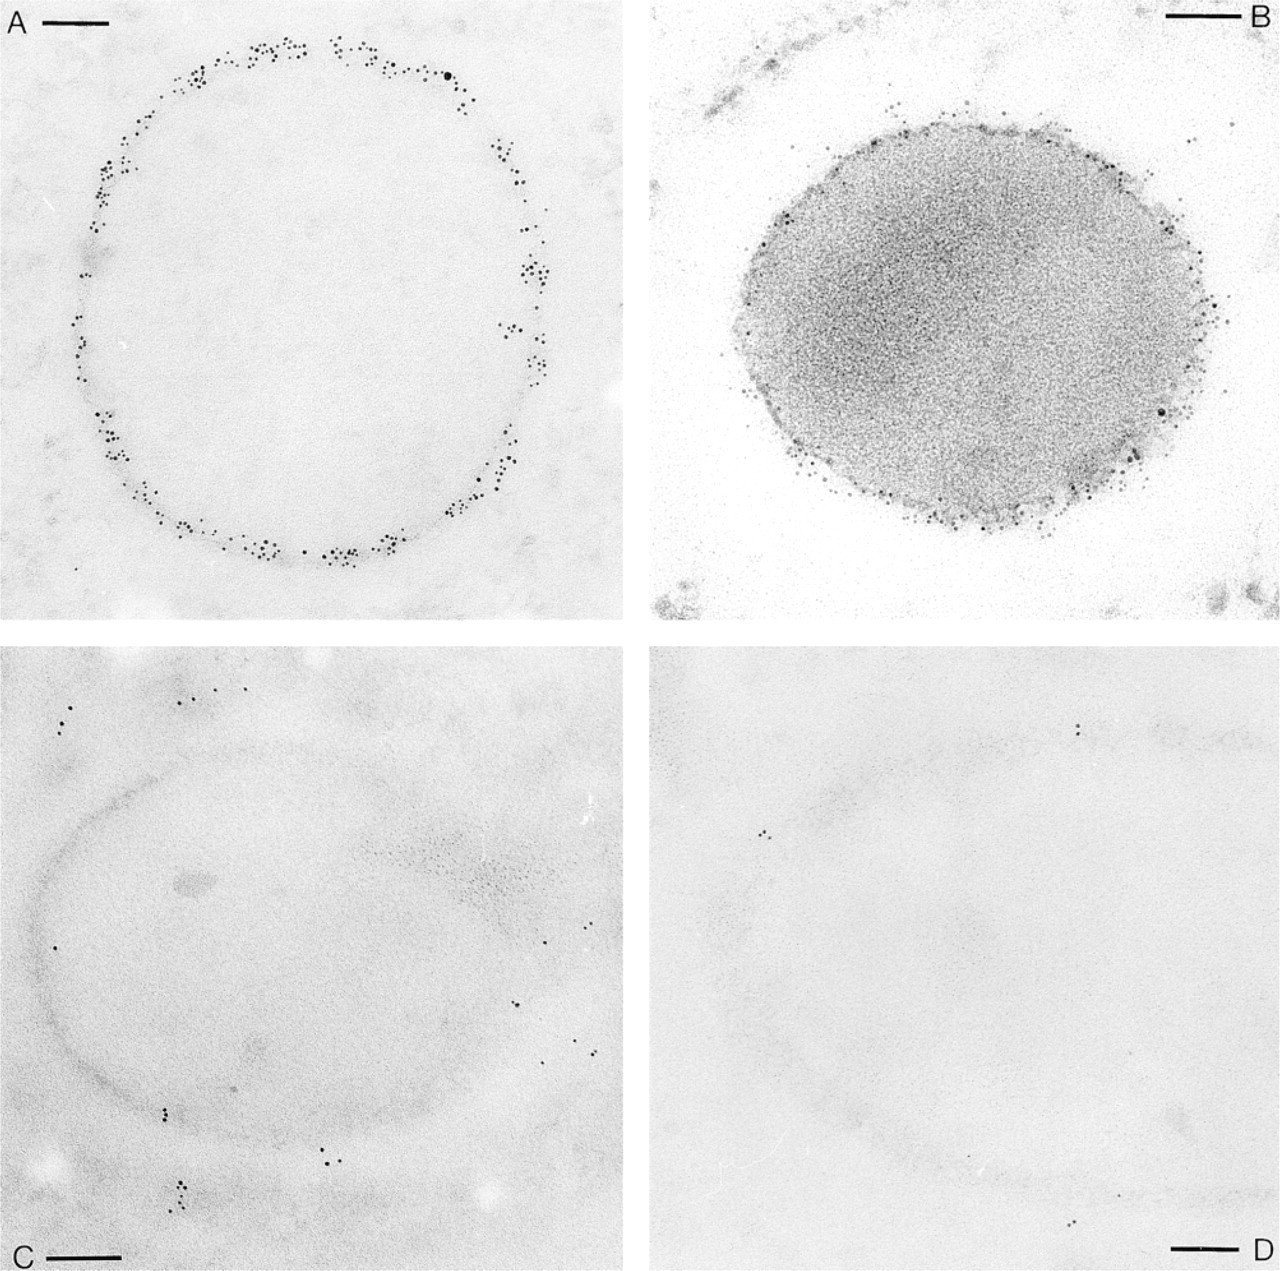
Effect of section staining on labeling density, as exemplified with Abs against the “mesh-like sheath” component, localized between the dense core of secretory materials and the trichocyst membrane, using monoclonal primary Abs followed by GαM–Au5. (
Effect of Section Staining on Ab Labeling
We analyzed the effect of alkaline lead citrate, frequently used as a standard stain, on immunogold labeling (Figure 1). We used monoclonal Abs (MAbs) against a well-defined secretory component, the “mesh-like sheath” (which in Paramecium links the contents of a trichocyst with its membrane) as previously specified (Momayezi et al. 1993). We also tested polyclonal Abs from rabbit directed against Paramecium cell surface (glycocalyx) components as specified by Flötenmeyer et al. (1999). We then applied the same immunogold conjugates as indicated above.
Then the gold-labeled sections were processed either with or without 5-min fixation with 2% glutaraldehyde. Sections were stained in different ways, either with 2% aqueous (acidic) uranyl acetate as above or with standard alkaline lead citrate (Reynolds 1963; Venable and Coggeshall 1965), each for 5 min, or with both stains in sequence. In addition, we explored the effects of pH of either stain, i.e., 4.5 and 12.0, respectively, using appropriate buffers of low ionic strength. [Ionic strength per se had no effect, as we found by application of Tris-buffered saline (TBS), 200 mM.] Quantitative evaluation was done on randomly taken photographs as follows.
Evaluation of Labeling Density
Gold grains were counted on distinct structures of randomly taken samples and referred to area size of the respective structure analyzed (Kissmehl et al. 1998). Area size was determined by the “hit point method” as previously described (Plattner and Zingsheim 1983).
Results
Effects of Section Staining with Lead
We show some extreme situations occurring after gold labeling followed by application of different section staining procedures. Two different labelings were analyzed: (a) with MAbs against a defined secretory component contained in trichocysts, followed by F(ab)2 goat anti-mouse IgG–Au5 conjugates (Figures 1 and 2A), and (b) with rabbit Abs against glycocalyx components, followed by pA–Au10 (Figure 2B). Briefly, lead stain at pH 12.0, or just application of pH 12.0, caused dramatic redistribution and loss of gold label. This can be impeded by fixation of sections after immunogold labeling. This step is not required when uranyl only is applied. In this case, labeling density is approximately the same with or without section fixation.
Quantitative evaluation (Figure 2) revealed approximately the same effects with both labeling procedures analyzed, using either F(ab)2– or pA–gold conjugates. Therefore, our findings may be of general interest. Essentially, we established the following details high-lighted in Figure 1 and summarized in Figure 2. (a) Aqueous uranyl acetate (pH 4.5), a standard electron “stain” used to enhance structural contrast, does not impair immunogold labeling. This includes two aspects, sensitivity and structure–label correlation, i.e., the number of gold grains per area is large and grains are strictly asscociated with the respective structures (“mesh-like sheath” and glycocalyx components, respectively). Quantification substantiates that the situation does not improve when sections are fixed with glutaraldehyde before uranyl staining. The other extreme is staining with alkaline (pH 12.0) lead solution (Figure 1C) which, although frequently used to further enhance structural contrast even in immunocytochemical work, causes severe dislocation and even loss of gold grains (Figures 2A and 2B). This artifact cannot be eliminated by uranyl application before lead staining (Figures 1D and 2A, B). Mimicing the high pH, essential for the lead stain to work (Reynolds 1963), causes the same artifact (Figure 2). Increasing ionic strength at neutral pH does not cause any significant loss of label.
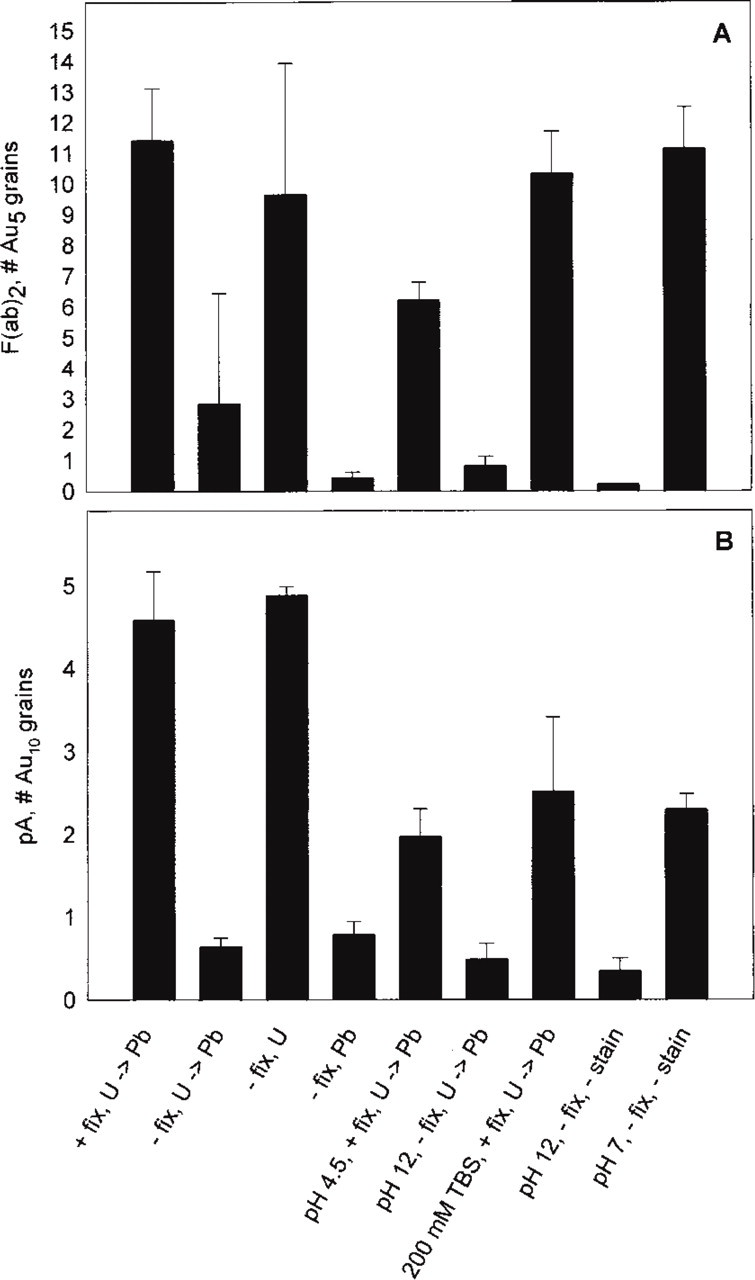
Quantitative evaluation of the different section staining protocols, as exemplified in Figure 1. Abs used in
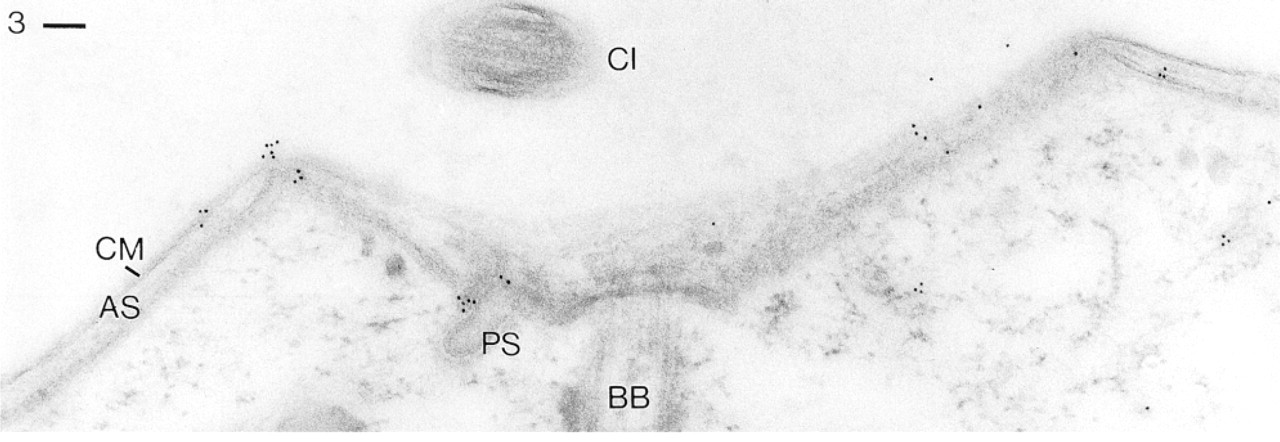
Anti-CaN Ab (R299), followed by GαR Ab-Au10, labels the complex formed by cell membrane (CM) and alveolar sacs (AS), of which only the inner alveolar sac membranes can be recognized separately. Although a “parasomal sac” (PS) is labeled, a cilium (CI) and a ciliary basal body (BB), as well as internal structures, are not specifically labeled. Bar = 0.1 μm.
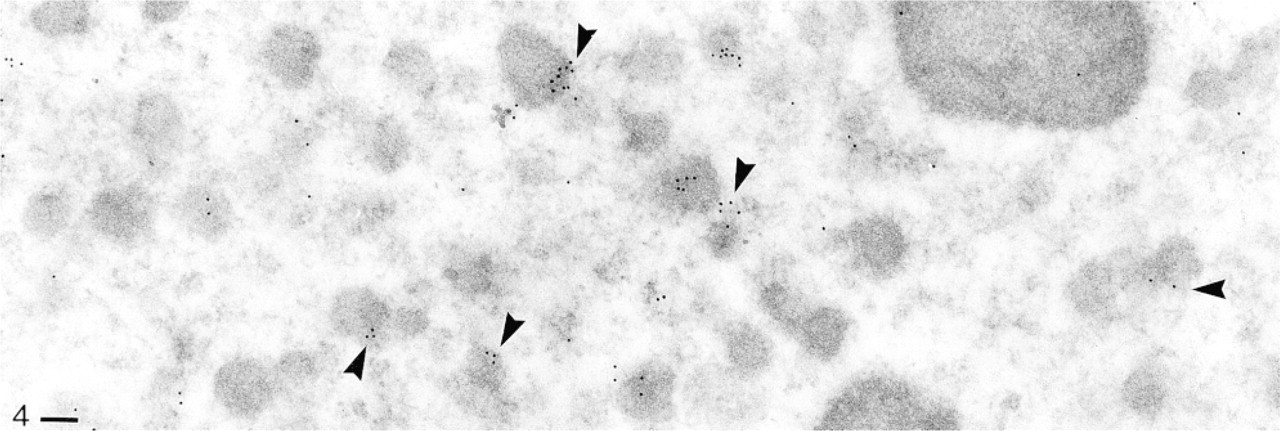
Same procedure as in Figure 3, producing labeling of nuclear components, notably of the rims of heterochromatic areas (e.g., at arrowheads). Bar = 0.1 μm.
In consequence, we recommend section staining with aqueous uranyl acetate only, section fixation after gold labeling not being mandatory. However, post-fixation must be applied if structural contrast should be further increased by successive staining with uranyl and lead. In the analyses shown below, we applied only uranyl staining followed by fixation.
Localization of CaN Using Anti-CaN Abs (R299)
These Abs (designated R299) were prepared against whole bovine brain CaN and have been characterized on Western blots, not only with CaN subfractions obtained from Paramecium (Kissmehl et al. 1997) but also with some substrates from mammalian cells (Hens et al. 1998). To account for the notorious fluctuations in immunogold labeling intensity, these were evaluated quantitatively. Examples for immunolocalization are shown in Figures 3 to 6. Only much later (when our quantitative evaluations presented in Figure 9 were already finished) did Abs directed against sub-units A and B from mammalian CaN become available. Results obtained with these new Abs are documented in Figures 10–15.
Figure 3 demonstrates the occurrence of label on the cell surface membrane complex. Because this is formed by the cell membrane and the closely apposed flat alveolar sacs, specific assignment of label to the cell membrane and to inner and outer regions of alveolar sacs, is not always possible. Some situations in Figure 3 and in some subsequent images suggest that not only the inner side of alveolar sacs (or closely apposed materials) but also the much tighter complex formed by the outer part of alveolar sacs and the cell membrane is labeled. Figure 3 also shows significant labeling of a parasomal sac, with a few gold granules scattered in the cytosol.
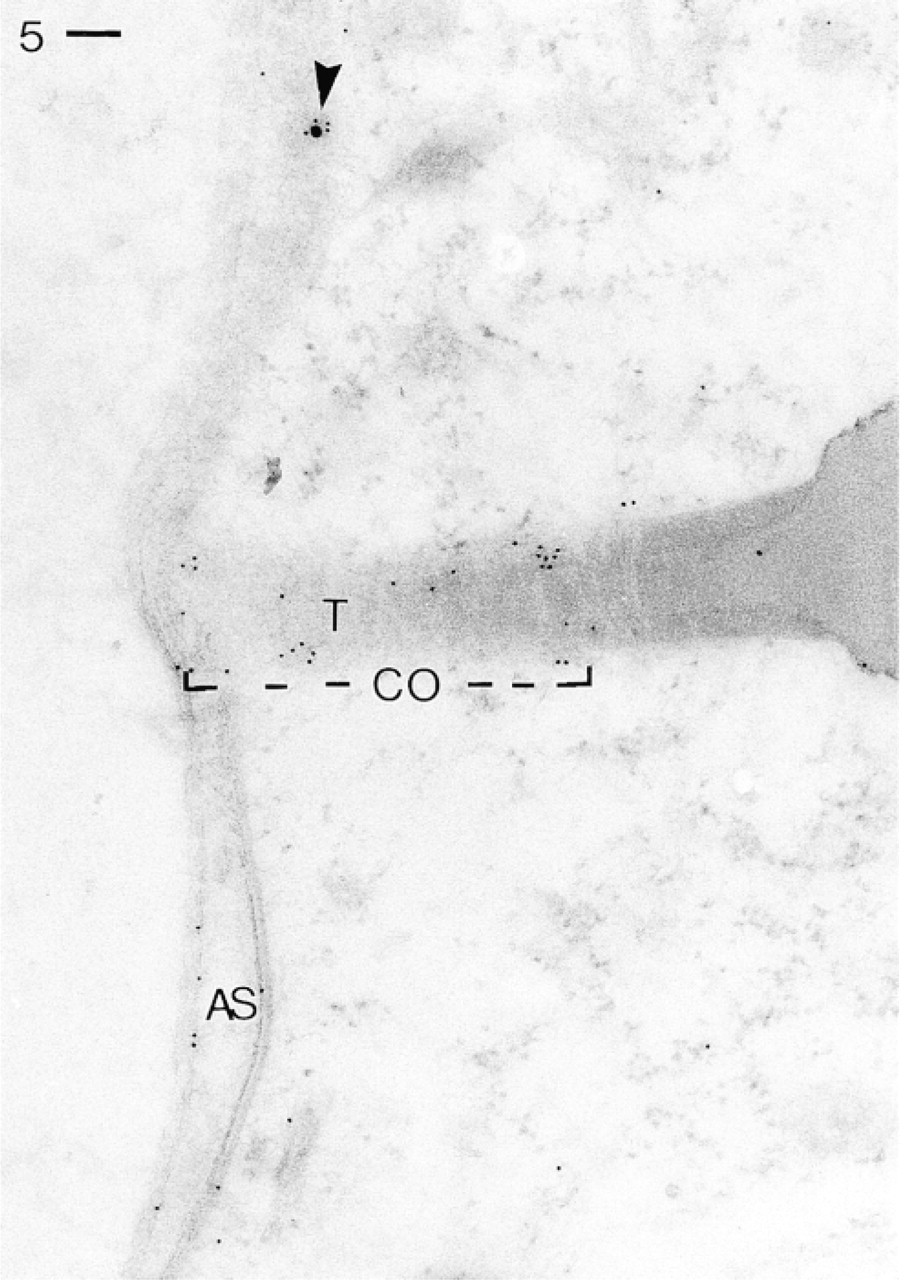
Trichocyst (T) docking site cut in an oblique angle. Ab application as in Figure 3 labels the uppermost region of a trichocyst surface (“collar” region, CO), where it emerges into the section surface, as well as the docking site proper. Some gold grains are also scattered over the surface complex as in Figure 3, including the inner membrane region of an alveolar sac (AS, arrowheads). Bar = 0.1 μm.
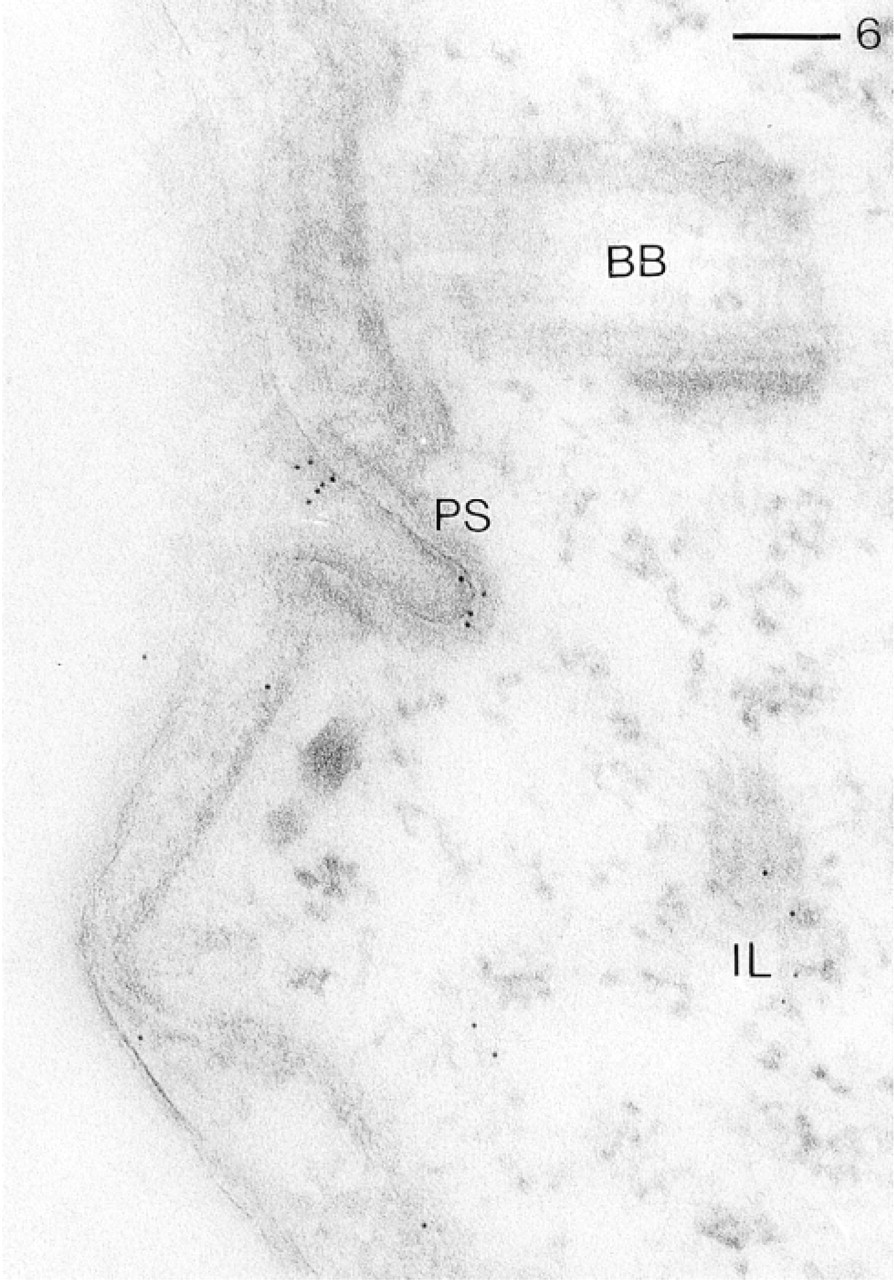
Same procedure as in Figure 3, but applying GαR–Au5. Note intense labeling of a coated pit (“parasomal sac,” PS) closely associated with a ciliary basal body (BB), moderate labeling of an “infraciliary lattice” (IL) component, and occurrence of only a few gold grains elsewhere in the cell cortex. Bar = 0.1 μm.
Figure 4 is an example of significant labeling in the (macro-)nucleus. Label may be concentrated on regions with electron dense (hetero-)chromatin, or with their rims.
Because trichocyst docking sites are not frequently encountered, they are documented separately. In Figure 5, a docking site is cut tangentially. Therefore, much of its membrane-associated materials surrounding the upper two thirds of the narrow trichocyst tip are exposed. It is precisely this “collar” region (cf. Pouphile et al. 1986) that is intensely labeled, as is the uppermost region where a trichocyst is tied to alveolar sacs and the plasma membrane (docking site proper).
Figure 6 documents in more detail labeling of a parasomal sac or of its apical and basal regions. In this figure the sac can be easily identified by its association with a ciliary basal body, which is not labeled. Another structure not so commonly encountered is the infraciliary lattice, formed of filament bundles enriched in centrin. This is also regularly labeled.
Figures 7 and 8, showing again a cortical cell region, demonstrate the specificity of the type R299 Ab. The inner part of alveolar sacs (their “inner membrane”) and the contractile “infraciliary lattice” are clearly labeled in Figure 7, in contrast to Figure 8. This difference is due to the use of Abs before (Figure 7) and after (Figure 8) preadsorption with the original antigen, before section labeling with GαR–Au5.
In summary, after statistical evaluation of a great number of samples to take into account the wide variability of labeling densities, the four regularly labeled structures in Paramecium are the cell surface complex (alveolar sacs + cell membrane), the infraciliary lattice, parasomal sacs, and chromatin borders (Figure 9).
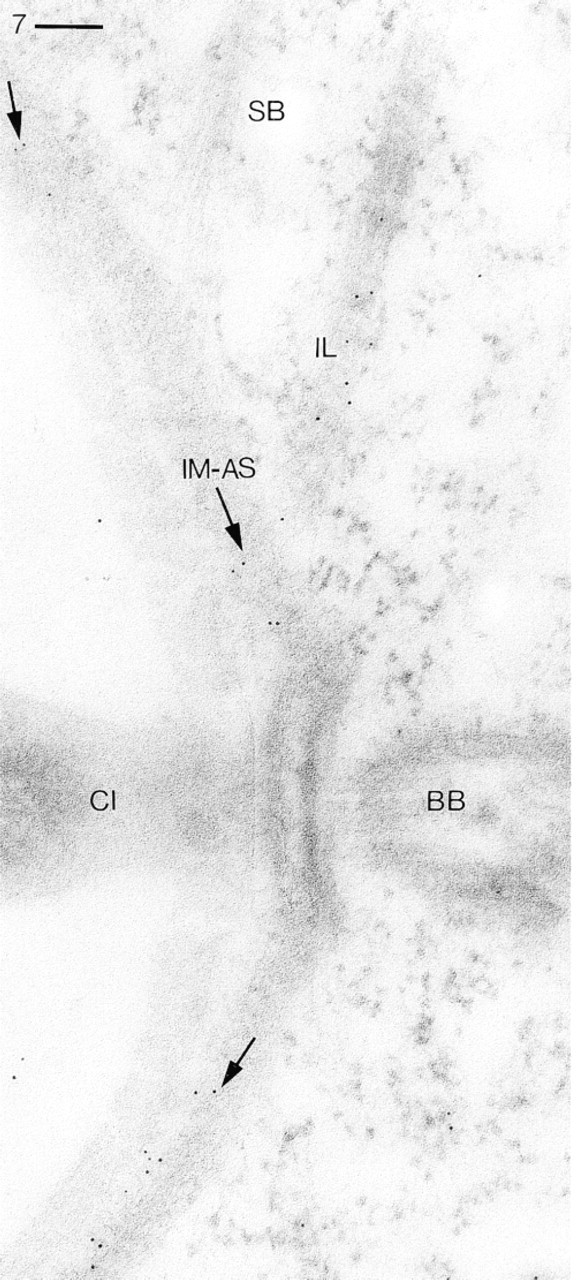
Same procedure as in Figure 3. Application of Ab type R299 followed by GαR–Au5 labels the inner membrane region of alveolar sacs (IM-AS) in regions below arrows and that part of the “infraciliary lattice” (IL) where it evidently emerges onto the section plane (lower part). Note absence of any significant label from cytosol, from a “striated band” (SB, noncontractile cortical filament bundle), and from a cilium (CI) and its basal body (BB). Bar = 0.1 μm.
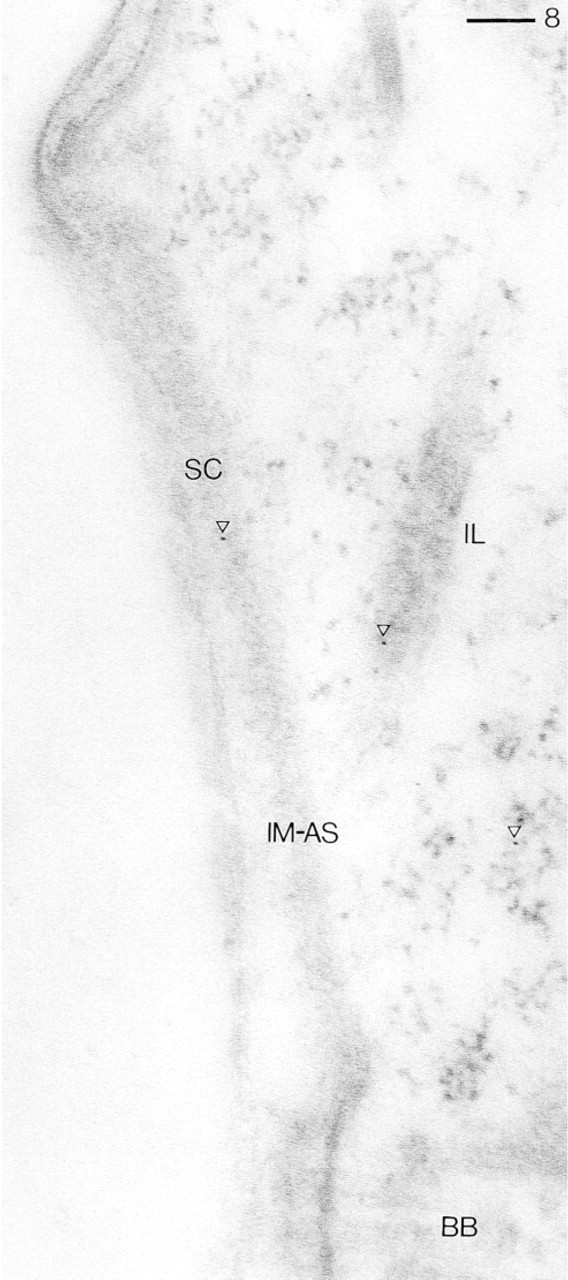
Same procedure as in Figure 3 (detail to be compared to Figure 7), but using R299 Abs after preadsorption with bovine brain CaN. This causes disappearance of most of the GαR–Au5 label, except for a very few granules (arrowheads) on the inner membrane of alveolar sacs (IM-AS), on the “infraciliary lattice” (IL), and in the cytosol. BB, basal body; SC, surface membrane comples. Bar = 0.1 μm.
Labeling with Abs Against Subunits of CaN
Examples of labeling with ABs against CaN-A are shown in Figures 10 and 11. On Western blots, Abs against the A- and the B-subunit strongly and selectively react with the respective subunits (data not shown). Although the labeling intensity achieved on ultrathin sections may be somewhat less than with Abs against both subunits (R299), the tendencies are all the same, as shown below.
In Figure 10, the surface membrane complex is cut tangentially and therefore displays rather intense labeling. Figure 10 also contains two parasomal sacs in oblique (bottom left) or cross-section (middle right). In both situations they are clearly labeled, as is some basal body-associated material. Figure 11 shows labeling of an emerging trichocyst docking site, although in this particular case much less cytosolic labeling and labeling of the surface membrane complex is present.
Similar situations are shown in Figures 12 and 13 for Abs against the B-subunit. Again, in Figure 12, the surface complex of cell membrane and alveolar sacs is labeled, as is a cross-cut parasomal sac. Figure 13 is a detail containing an emerging trichocyst whose docking site is again intensely labeled.
Figures 14 and 15 document for Abs against the A- and B-subunit, respectively, that in the macronucleus heterochromatic areas are preferentially stained, notably at their periphery. These data correspond to those with Ab type R299.
Discussion
Technical Note
CaN may only partially be present in a doublet, particularly when not associated with a membrane. Therefore, we tried to avoid loss or displacement of antigen, as occurs with too weak fixation (Bittermann et al. 1992), because we fixed cells with formaldehyde supplemented by a tolerable although low concentration of glutaraldehyde. However, we now observed another artifact that was without precedent.
We found that gold label is displaced and even removed from antigenic sites when a section is stained with alkaline lead citrate and that this is due to its obligatory pH of 12.0. We found this with gold conjugates of Abs and of pA applied to unicryl sections. Because unicryl is one of the methacrylate resins most widely used in immunogold labeling studies, the deleterious effect of section staining with alkaline lead solution that we detected may be of more general importance, although embedding media other than unicryl have not yet been analyzed in this regard. This deleterious effect was unexpected because the use of this stain, in addition to aqueous uranyl acetate, is quite common, as one can recognize in monographs on immunocytochemistry. If increased contrast is desired, uranyl staining may be prolonged or the EM set-up must to be selected accordingly. We do not know whether the Ab–Au complex, or the antigen, or the antigen–Ab complex is actually removed. Because after any application of pH 12.0 gold grains still may be present, but at a greater distance from the original localization of the antigen, the latter possibility also appears feasible.
Molecular Identity of CaN Substrates
Only a few substrates of CaN are well characterized, so that immunolocalization may yield new hints. Well-defined targets are the PP1 inhibitors DARPP-32 (Desdouits et al. 1995) and NFAT (Shenolikar 1994), which are phosphorylated at Thr and Ser sites, respectively, some microtubule-associated proteins (Quinlan and Halpain 1996), transcription factor ELK-1 (Sugimoto et al. 1997), the monomeric GTP-binding protein dynamin (Nichols et al. 1994), and only a few others. In Paramecium, there are only indirect hints as to the identity of CaN substrates (see below).
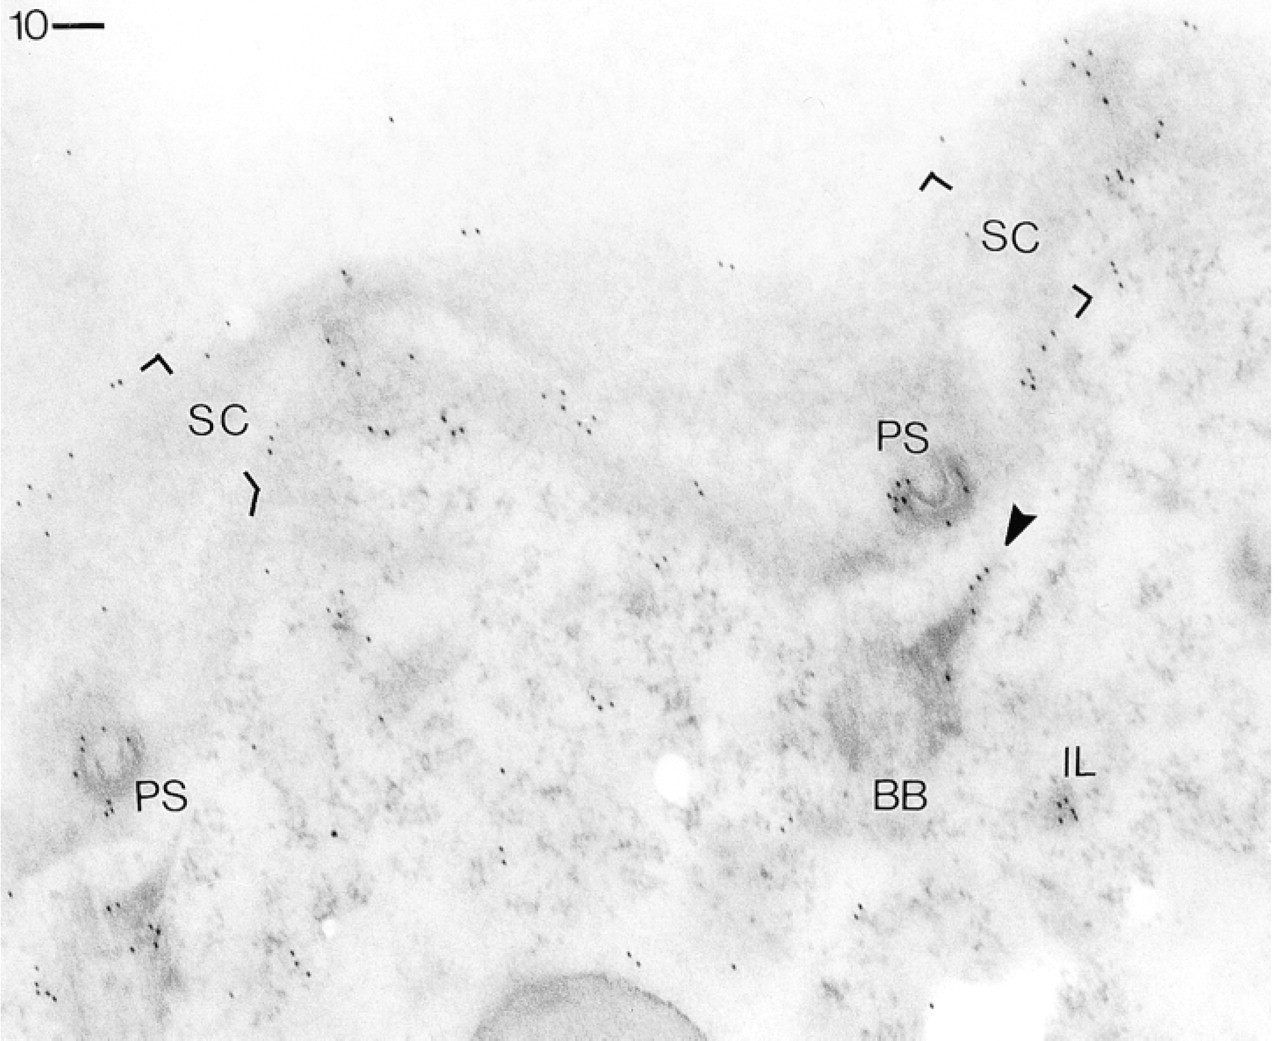
Labeling by Abs against CaN-A and GαM-Au10. Labeled components encompass a tangentially cut cell surface complex (SC), a cross-cut “infraciliary lattice” (IL) bundle, a “kinodesmal fiber” (arrowhead) attached to a ciliary basal body (BB), and two parasomal sacs (PS). Bar = 0.1 μm.
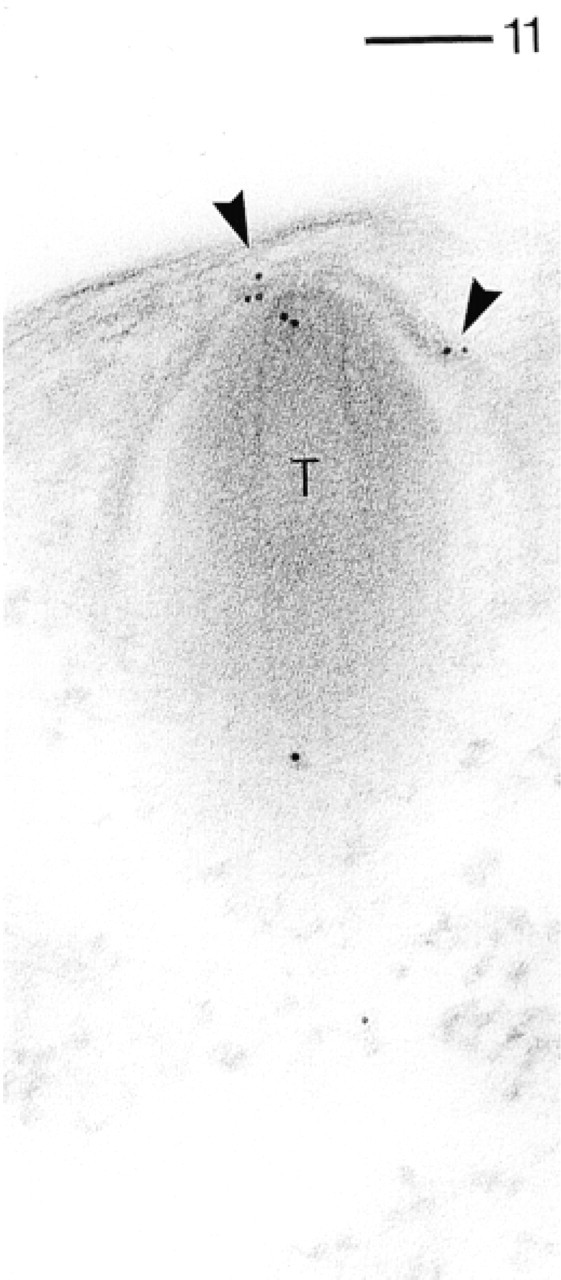
Abs against CaN-A detected by pA–Au5 (arrowheads), mainly at the docking site of a trichocyst (T). Bar = 0.1 μm.
The Abs recognizing the entire CaN molecule (type R299), i.e., subunits A and B, may be useful to recognize CaN on sections, because they have been extensively probed on Western blots (Kissmehl et al. 1997; Hens et al. 1998). From the published sequences retrieved from the EMBL data bank for Paramecium and bovine CaN-A, we derive an overall identity of 40% for CaN-A and of 78% for its subunit B-binding domain (data not shown).
Although not yet established for CaN-B of Paramecium, association with membranes may be facilitated by myristoylation (Boutin 1997). Occurrence of a binding site for the B-subunit in the A-subunit (Klee et al. 1998) may explain why both subunits show about the same distribution in our cells, although co-localization studies appear to us to be less reliable because of the lower antigenicity of Abs against the B-subunit.
CaN at the Infraciliary Lattice
One of the main components of the dominant cortical filament system in Paramecium, the infraciliary lattice, is centrin (Garreau De Loubresse et al. 1991). Although the gene of this 23–24-kD large contractile protein has been cloned in Paramecium (Madeddu et al. 1996; Klotz et al. 1997), detailed information on its potential phosphorylation is still required. In the Paramecium cortex, Abs against Ser/Thr phosphorylation sites recognize a variety of proteins of ≥ 20 kD (Keryer et al. 1987), and cortical morphogenesis depends on the phosphorylation state of some basal body-associated proteins (Sperling et al. 1991), as shown, e.g., in Figure 10. Attached materials may also contain centrin (Levy et al. 1996). CaN can therefore be considered a candidate for regulating centrin-based processes and morphogenesis. In fact, in the flagellate green alga Tetraselmis, centrin is dephosphorylated in response to increased cytosolic Ca2+ concentrations (Martindale and Salisbury 1990).
CaN at Outlines of Alveolar Sacs and at Trichocyst Docking Sites
Paramecium was the first system for which involvement of CaN in exocytosis regulation could be demonstrated. Microinjection of anti-CaN Abs inhibited trichocyst exocytosis (Momayezi et al. 1987). Since then, a stimulatory effect of CaN has been reported for mast cells (Hultsch et al. 1998), T-lymphocytes (Trenn et al. 1989), pancreatic acinar cells (Groblewski et al. 1994), gastric chief cells (Raufman et al. 1997), glutaminergic nerve terminals (Nichols et al. 1994), and for catecholamine- and neuropeptide-releasing cells (Hens et al. 1998). However, inhibitory effects of CaN stimulation have also been occasionally observed, such as for lactotrophic pituitary cells (Fomina and Levitan 1997). This is not surprising, considering the multiple molecular activities that may contribute to such complex activities as exocytosis, e.g., in neurons (Yakel 1997), and the effect may also vary depending on the mode of stimulation. Multiple effects can be envisaged even in a single cell.
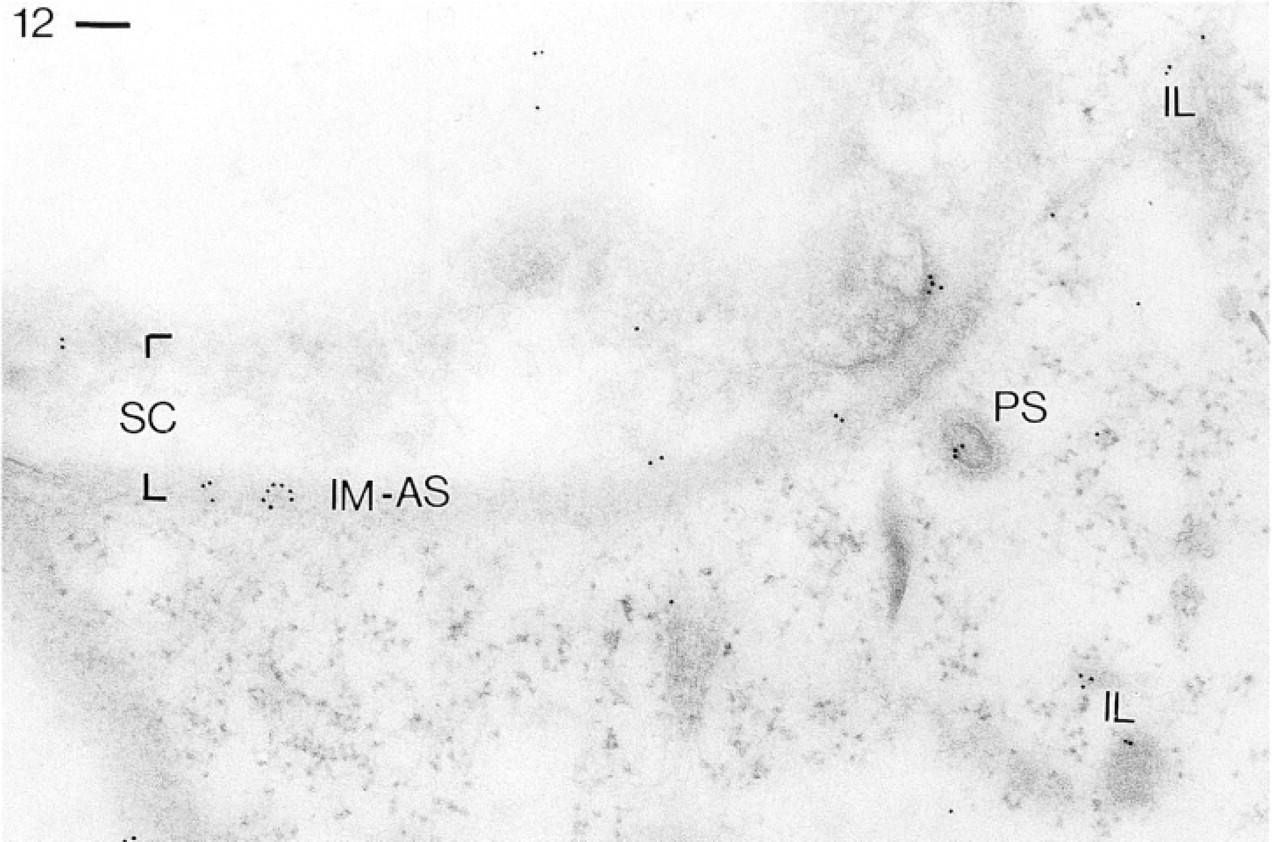
Labeling by Abs against CaN-B followed by GαR–Au10. Gold grains occur on the cell surface complex (SC), particularly along the inner membrane of alveolar sacs (IM-AS) cut at an oblique angle, as well as on a parasomal sac (PS) and portions of “infraciliary lattice” (L) filament bundles. Bar = 0.1 μm.
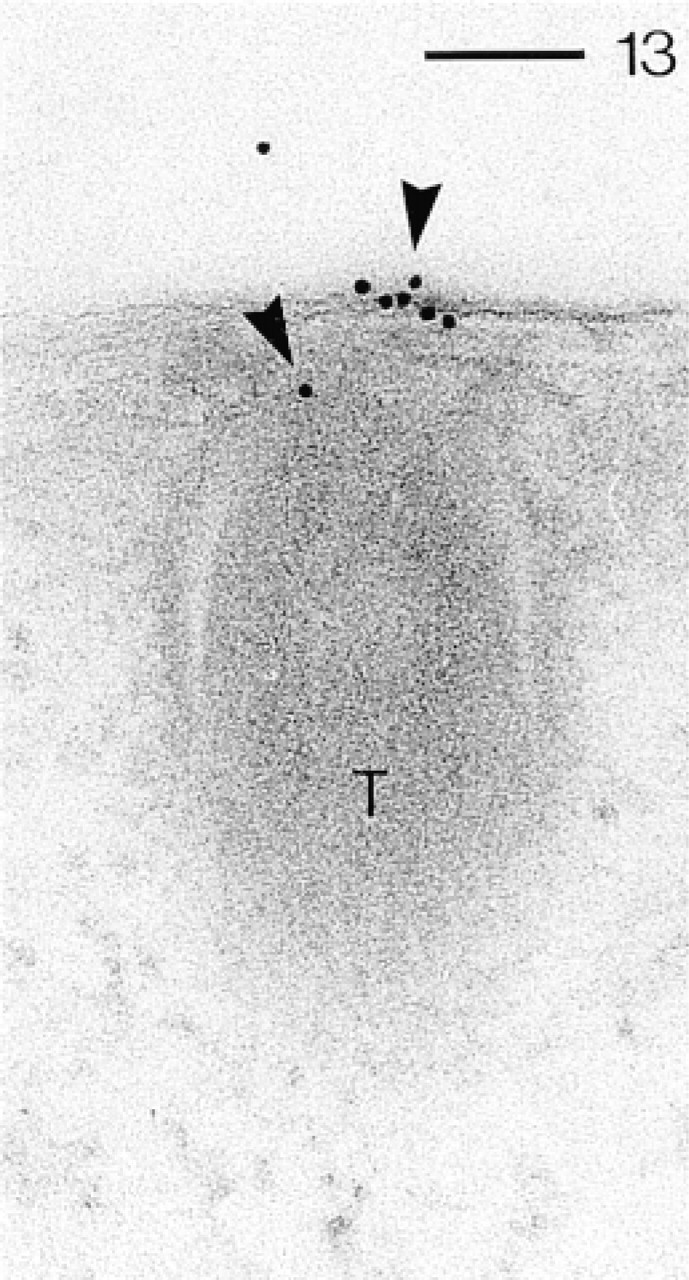
Abs against CaN-B detected by pA–Au10 (arrowheads), mainly at a trichocyst (T) docking site. Bar = 0.1 μm.
In the Paramecium cell cortex, distribution of CaN coincides in part with that of the exocytosis-sensitive PP63/parafusin (Kissmehl et al. 1998), because they both are enriched around alveolar sacs and at trichocyst docking sites. With PP63/parafusin, as with calmodulin (Momayezi et al. 1986; Kerboeuf et al. 1993) and CaN (this study), this includes the site of contact between a trichocyst membrane and the cell membrane, the contact site between a trichocyst membrane and alveolar sacs, and the subsequent region called “collar” (dense material surrounding the uppermost portion of a trichocyst). In agreement with this, CaN can dephosphorylate PP63/parafusin (Kissmehl et al. 1996), which in vivo is multiply phosphorylated at Ser and Thr sites (Kussmann et al. 1999) and dephosphorylated strictly in parallel with exocytosis performance (Zieseniss and Plattner 1985). During trichocyst exocytosis, Ca2+ concentrations rise to ~5 μM (Klauke and Plattner 1997), i.e., a value appropriate to activate PP2B activity in the cortex of different cells (Yakel 1997). Because in Paramecium this involves Ca2+ release from alveolar sacs (Länge et al. 1995; Plattner et al. 1997a), it is interesting to note that Ca2+ release channels are known to be sensitive to CaN (or CaN-directed drugs) in some other systems (Brillantes et al. 1994; Schuhmann et al. 1997; Wagenknecht and Radermacher 1997; Xiao et al. 1997).
In summary, it remains to be analyzed in more detail whether in Paramecium CaN can act precisely at the exocytosis site and/or at the cortical calcium stores.
CaN at Parasomal Sacs
Detachment of clathrin-coated pits from the cell membrane during endocytotic vesicle formation depends on CaN-mediated dephosphorylation of the large monomeric GTP-binding protein dynamin (Liu et al. 1994; Robinson et al. 1994; Marks and McMahon 1998). Although this has been documented thus far mainly with neurons, it may apply to different systems. In Paramecium such coated pits, designated “parasomal sacs,” accompany ciliary bases. Regulation of their formation by CaN is suggested by the heavy labeling we observe, although dynamin in our system still remains to be identified at the molecular level.
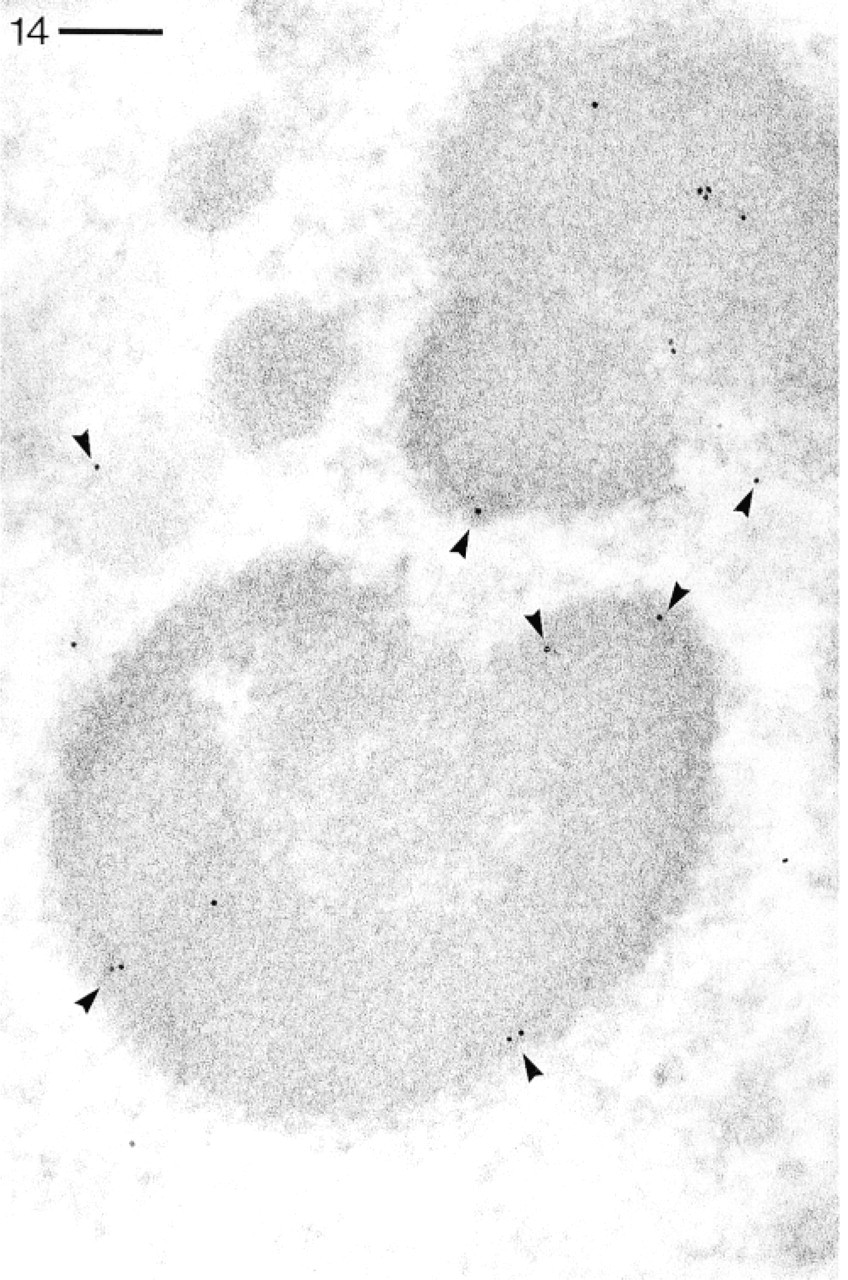
Abs against the CaN-A subunit detected by pA–Au5 in a macronucleus. Note occurrence of label almost exclusively over heterochromatic areas, frequently along their borders (arrowheads). Bar = 0.1 μm.
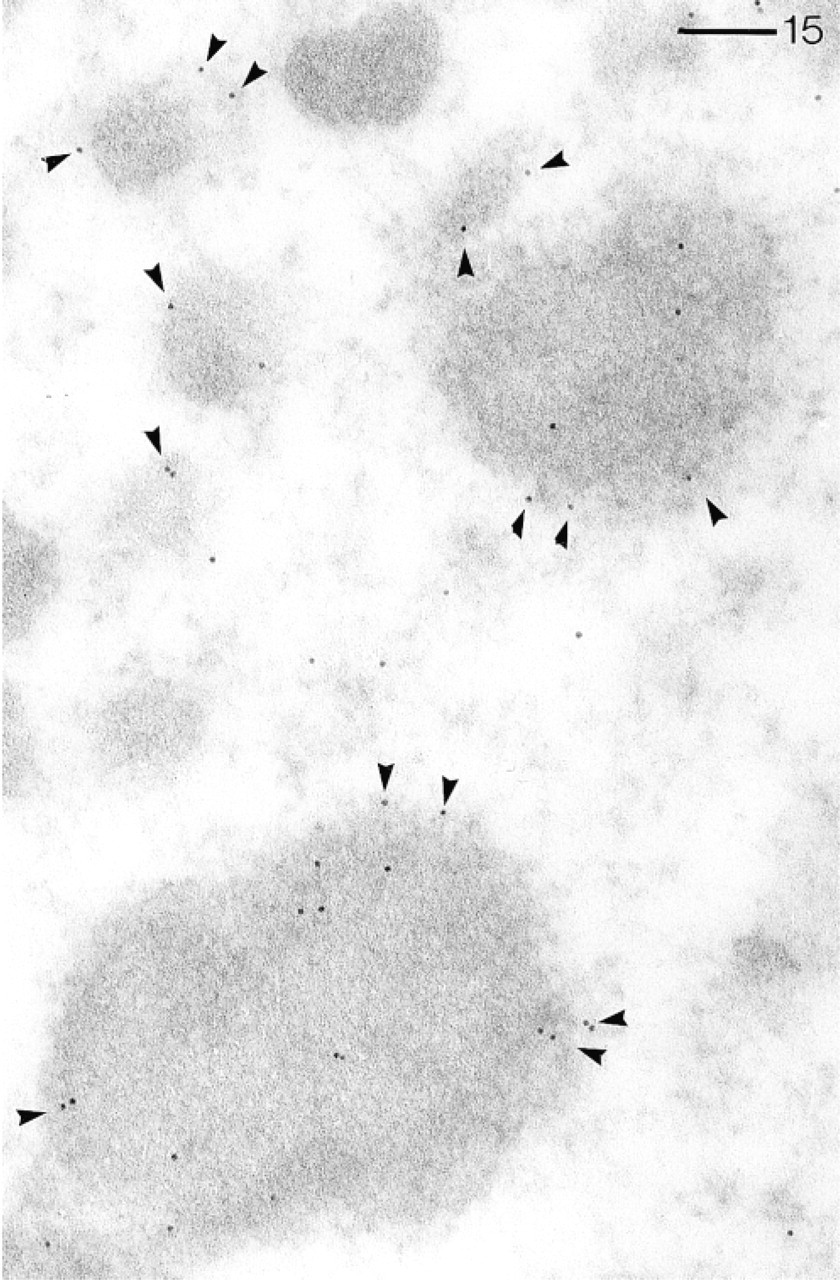
Abs against the CaN-B subunit visualized by pA–Au5 in a macronucleus preferentially labels the rims of heterochromatic zones (arrowheads). Bar = 0.1 μm.
CaN in the Nucleus
Thus far, CaN has been localized, at the light microscopic level only, in the nuclei of mouse spermatids (Moriya et al. 1995). The involvement of CaN in gene transcription is well established. CaN may facilitate the import of transcription factors (Shibasaki et al. 1996) or may be involved in intranuclear regulation processes. Among them is one of the mechanisms participating in T-lymphocyte activation (Trenn et al. 1989; McKeon 1991; Guerini 1997). Because CaN activates transcription in widely different cell types, such as yeast (Hirata et al. 1995), muscle (Chin et al. 1998), pituitary cells (Lee et al. 1999), and neurons (Yakel 1997), we can now expect similar CaN activities in Paramecium.
Footnotes
Acknowledgements
Supported by a grant from the Deutsche Forschungsgemeinschaft, Schwerpunkt “Struktur und Funktionssteuerung an Zelloberflächen.”
We are grateful to Dr Karin Hauser for calculating sequence identities, to Sylvia Kolassa for skillful technical assistance, and to Anne Keller for revising the English text.