
Abstract
Keywords
It is now well established that the study of the expression of immediate early genes (IEGs) in the brain has become a powerful tool for the identification of neuronal activity in brain regions of different species after sensory stimulation (Sagar and Sharp 1993; Kaczmarek and Chaudhuri 1997). The c-fos proto-oncogene is probably one of the best studied IEGs, known to be rapidly and transiently induced in discrete neuronal populations by a wide variety of external stimuli (for review see Sheng and Greenberg 1990; Morgan and Curran 1991; Herdegen and Leah 1998). In addition, the induction of the c-fos gene and subsequent Fos protein synthesis is part of the cell response that leads to long-term changes in gene expression. Fos, considered to be a transcription factor, acts as a tertiary messenger linking extracellular signals and transcriptional regulation, and its expression has consequently been used in many studies as a marker for neuronal activation (Sagar et al. 1988; Dragunow and Faull 1989; Curran et al. 1990; Hoffman et al. 1993; Scheich and Zuschratter 1995; Chaudhuri 1997; Saint Marie et al. 1999). Depending on the physiological conditions, both the c-fos gene and protein can be affected by visual input in cortical neurons (Rosen et al. 1992; Beaver et al. 1993; Kaminska et al. 1996). Fos expression in most neurons of mammalian visual cortex is either very low or undetectable at basal level (Zhang et al. 1994; Herdegen et al. 1995). However, on exposure to light after a certain period of darkness, Fos levels increase significantly (Mower 1994; Kaplan et al. 1996). Moreover, as shown in cat and monkey visual cortex, Fos expression revealed the ocular dominance columns after monocular deprivation (Arckens et al. 1994; Kaczmarek et al. 1999). The analogy between observations concerning c-fos expression and 2-deoxyglucose uptake experiments indicates that immunological detection of the IEG c-fos can indeed be used to delineate cortical regions of high neuronal activity (Löwel and Singer 1993a,b). The use of immunocytochemistry for the localization of Fos is an exquisite technique because of its single-cell resolution. However, not all of the variety of commercially available antibodies always result in good Fos detection. In a recent report, Caston-Balderrama et al. (1998) describe studies of Fos expression carried out on brain tissue using several antisera from species other than rat, yielding variable Fos detection. This might be explained in terms of differences in Fos protein sequences among species. A comparison of the Fos amino acid sequence of human, rodents, and chicken reveals a high degree of conservation, but differences of 3-21% in protein structure may be sufficient to account for the substantial variability in Fos staining in nonhomologous species (Van Beveren et al. 1983; van Straaten et al. 1983; Curran et al. 1987; Fujiwara et al. 1987; Cohen and Curran 1989).
Previous immunocytochemical studies of cat visual cortex in our laboratory have been hampered by the lack of reliable antisera. Curran et al. (1985) produced a polyclonal antibody against the M-peptide region of rat c-fos. This antiserum actually recognizes both Fos and Fos-related antigens (Fras) in neurons and had already been used successfully in a number of immunocytochemical studies analyzing Fos expression in rat cerebral cortex (Earnest et al. 1990; Sagar and Sharp 1990; Aronin et al. 1991; Alcantara and Greenough 1993; Bing et al. 1996). Recently, we cloned a fragment (357-bp) of the cat c-fos gene and determined the nucleotide and amino acid sequence. This fragment includes the sequence of the M-peptide, which contains the DNA binding domain of the molecule. Therefore, the first aim of the present study was to produce a cat-specific Fos polyclonal antibody raised in rabbits against a synthetic 26-amino-acid peptide corresponding to the M-peptide region of cat Fos. This new antibody was then characterized by Western blotting and validated for specific Fos staining in cat visual cortex under a variety of experimental visual conditions. These experimental manipulations specifically induce Fos in well-defined neuronal populations and therefore enable us to test the reliability and specificity of the newly synthesized cat Fos antibodies in immunocytochemistry. The second aim was to assess the applicability of this new antibody on monkey and rat visual cortex for future use in obtaining adequate Fos protein immunostaining in mammalian brain. Part of these results have already been published in abstract form (Van der Gucht et al. 1998).
Materials and Methods
Animals
All animal experiments were carried out in accordance with the European Communities Council Directive of 24 November, 1986 (86/609/EEC). All efforts were made to minimize animals' discomfort and to reduce the number of animals used. Ten adult cats (Felis catus), four adult rats (PFD:Wist), and one adult rhesus monkey (Macaca mulatta) were used in this study. All animals were housed in the animal house (Animal Facilities; Katholieke Universiteit Leuven, Leuven, Belgium). Five cats, two rats, and one monkey were placed overnight in a dark room. The next day they received a binocular light stimulation for 1 hr and were sacrificed immediately thereafter. A light exposure for 1 hr after a period of darkness results in an increase in Fos expression in the mammalian visual system (Arckens et al. 1994; Mower 1994; Kaplan et al. 1996; Kaczmarek et al. 1999).
As a control, one cat and two rats were sacrificed after a long-term exposure to light for more than 8 hr to reveal the basal expression level of Fos (Herdegen et al. 1995). This control is referred to as a nonstimulation condition. Two other cats received a black, opaque lens cap on their right eye under anesthesia with ketamine (Ketalar, 10 mg/kg IM) before they were placed overnight in a dark room. The next day, these lens-fitted cats received a monocular exposure to light for 1 hr and were immediately sacrificed thereafter. In two cats, visual input was confined to one hemisphere by sectioning the left optic tract and the visual part of the corpus callosum. This cat model can serve as its own control by comparing the intact with the visually deafferented hemisphere. Both operations were carried out under sterile conditions using a Zeiss operating microscope and following general anesthesia with pentobarbital (Nembutal, 20 mg/kg IV). Completeness of the optic tract section was verified behaviorally using a visual field perimetry test as described previously (Vanduffel et al. 1995). These perimetry tests indicated that the lesion was complete, as was also confirmed by histological examination. After a 14-day survival time, this cat was sacrificed after a binocular light stimulation (1 hr) following an overnight dark adaptation.
Tissue Preparation
All animals were sacrificed at the same moment of the day (1100 hr) with an overdose of Nembutal (20 mg/kg IV). All animals but two were perfused transcardially with 0.9% NaCl, followed by 4% paraformaldehyde (Sigma; St Louis, MO) in PBS (0.15 M; pH 7.4). The brains were postfixed in the same fixative for 24 hr, then rinsed in water for another 24 hr. Frontal sections (50-±) were cut on a vibratome, collected in 12-well plates, and processed for immunocytochemistry.
The brains of two cats (a 1-hr and a long-term light-stimulated cat) were rapidly removed and immediately frozen by immersion in liquid nitrogen-cooled isopentane (Merck; Leuven, Belgium) and stored at -70C. Brain tissue of these cats was used to prepare the nuclear extraction for the Western blotting.
Preparation of the Conjugate and Immunization
A 26-amino-acid peptide of cat Fos (NH2-Gry-Lys-Val-Glu-Gln-Leu-Ser-Pro-Glu-Glu-Glu-Glu-Lys-Arg-Arg-Ile-Arg- Gly-Glu-Arg-Asn-Lys-Met-Ala-Ala-Ala-COOH) was produced in our laboratory by continuous-flow peptide synthesis (Fields and Noble 1990) and was conjugated with bovine thyroglobulin (Sigma) using glutaraldehyde (Serva-Polylab; Merksem, Belgium) as linking agent (Sachs and Winn 1970). The peptide:carrier weight ratio was 5:12. The mixture was incubated overnight at 4C. The reaction was then blocked by the addition of 1 M glycine (pH 7.4) (Merck) for 3 hr at RT.
For immunization, 1 ml conjugate containing 1 mg conjugated peptide was thoroughly mixed with 1 ml complete Freund's adjuvant (Difco; Detroit, MI) and used to immunize two rabbits. The emulsion was injected SC at four separate sites. This procedure was repeated twice at 3-week intervals. For the following injections, similar emulsions were prepared using incomplete Freund's adjuvant (Difco). From the fourth injection on, blood samples were collected 6 days after injection. The samples were centrifuged the day after and the immune response was monitored immunocytochemically on brain sections of a lens-fitted cat and a visually stimulated cat. This revealed that the blood samples from the tenth injection of one rabbit provided the best staining. All results and photographs presented here were therefore obtained with this antiserum. A fraction of this antiserum was then affinity-purified on a CNBr-activated Sepharose 4B gel column (Amersham Pharmacia Biotech; Roosendaal, The Netherlands) coupled with the synthetic Fos peptide. The coupling ratio was 5 mg peptide/ml gel. The unabsorbed fraction of the serum was collected, and the absorbed antibodies were eluted separately from the column with 0.1 M glycine buffer (pH 2.8). Both fractions were tested in Western blotting experiments.
Western Blotting
A Western blotting experiment was carried out on visual cortex from two cats to determine whether the new cat Fos antibody recognized a protein band of the predicted size for cat Fos. One cat was stimulated with light for 1 hr after a period of darkness and the second cat was sacrificed under non-stimulation conditions (see above). Nuclear fractions from cortical gray matter of both experimental conditions were prepared according to Hennighausen and Lubon (1987). The nuclear protein extract was fractionated in 50-μl samples and stored at -70C. Various amounts of the extract samples (2, 5, 10, or 20 μl) were applied to a 4-12% SDS polyacrylamide gradient gel for 35 min at 120 mA and transferred to polyvinyl difluoride (PVDF) membranes (Bio-Rad Laboratories; Nazareth, Belgium) on the × cell II Mini-Cell apparatus (Novex; Zandhoven, Belgium). The membranes were treated with 0.5% bovine serum albumin (BSA) (Merck) and 0.5% milk powder in TBS for 1 hr at 37C and subsequently immersed in one of the following primary anti-sera: polyclonal cat Fos antibody (1:4000) and Oncogene Science (1:4000; Ab-2, Cambridge, MA) and Santa Cruz Biotechnology (1:4000; (K-25)-G, Santa Cruz, CA). After an overnight incubation, the membranes were treated as follows: (a) three 5-min rinses in TBS; (b) biotinylated goat anti-rabbit IgGs 1:200 for 30 min (DAKO; Glostrup, Denmark); (c) three 5-min rinses in TBS; (d) alkaline phosphatase-conjugated streptavidin 1:200 for 30 min (DAKO); (e) alkaline phosphate buffer (12.1 g Tris, 5.8 g NaCl, 50 mM MgCl2; pH 9.5) for equilibration to the staining solution; and (f) finally immersed in a freshly prepared substrate solution, NBT-BCIP (Sigma). The staining was stopped by immersion in distilled water. A rainbow marker, MultiMark Multi-Colored Standard (Novex), was used as molecular weight size standard.
Immunocytochemistry
Single Staining. Free-floating vibratome sections of four rats, one monkey, four cats, two lens-fitted, and two isolated-hemisphere cats were incubated overnight with the primary antibody (Fos 1:20,000 for cat brain tissue; Fos 1:5000 for rat and monkey brain tissue). In addition, free-floating vibratome sections of two light-stimulated cats and one monkey were incubated overnight with both commercial Fos antisera: Oncogene Science (1:1000) and Santa Cruz Biotechnology (1:1000). For the detection of Fos antibodies biotinylated goat anti-rabbit IgGs (DAKO; 1:500, 30 min) and peroxidase-conjugated streptavidin (DAKO; 1:600, 30 min) were used. All the dilutions were made in Tris-saline (0.01 M, pH 7.4) and all incubations were performed at RT under gentle agitation. The reaction product was visualized as a black precipitate using the glucose oxidase-diaminobenzidine-nickel method (Shu et al. 1988). Sections were mounted on gelatin-coated slides, air-dried, dehydrated, coverslipped, and viewed through a Leitz DM RBE microscope (Leica; Leitz Instruments, Heidelberg, Germany). Omission of one of the various incubation steps abolished the immunocytochemical staining completely, indicating method specificity.
Double Staining. Vibratome sections of two visually stimulated cats were treated the same way as the single-stained sections but detected with the Envision+ System Peroxidase (DAB) (DAKO), resulting in an intensified brown color (Werther et al. 1999). These sections were then rinsed three times in Tris-saline and incubated with normal goat serum (1:5, 30 min). For detection of the second antigen, we used the rabbit polyclonal antibody against cow glial fibrillary acidic protein (GFAP; DAKO) at a dilution of 1:10,000. This second antigen was detected with biotinylated goat anti-rabbit IgGs (DAKO; 1:500, 30 min) as bridge antibodies in combination with alkaline phosphatase-conjugated streptavidin (DAKO; 1:150, 30 min). All dilutions were made in Tris-saline (0.01 M, pH 7.4) and all incubations were performed at RT under gentle agitation. Histochemical detection of the alkaline phosphatase was performed using naphthol As-Mx phosphate (Serva-Polylab) as enzyme substrate and Fast Blue BB (Serva-Polylab) as chromogen, resulting in a blue color. Addition of levamisole (2 M) (Sigma) to the staining solution blocked all endogenous alkaline phosphatase activity. Sections were mounted on gelatin-coated slides, air-dried, coverslipped in aqueous solution, and viewed through a Leitz DM RBE microscope (Leica; Leitz Instruments).
Cresyl Violet Counterstaining
Some immunostained sections for Fos from each animal were counterstained with Cresyl violet (1%) (Fluka Chemical; Buchs, Switzerland) to determine which layers of the visual cortex contained Fos-immunoreactive nuclei and whether only neurons or also glial cells are involved in the immunoreaction (O'Leary 1941; Henry et al. 1979; Lund 1973, 1988; Montero 1981; Peters and Kara 1985a,b). The sections were dehydrated, coverslipped, and viewed through a Leitz DM RBE microscope (Leica).
Quantitative Analysis
Fos-immunoreactive nuclei were counted semiautomatically using a Leitz DM RBE microscope equipped with a color video camera (Optronics Engineering; Goleta, CA) attached to a computer-aided image analyzing system (Bioquant; R&M Biometrics, Nashville, TN). Each section was viewed at a magnification of X20. The quantitative analyses were performed within the medial bank of the lateral gyrus (Area 17). Quantitative data were obtained from DAB-nickel-intensified sections at three different Horsley-Clarke levels from two visually stimulated animals. Adjacent sections counterstained with Cresyl violet (1%) (Fluka) were used to distinguish the supragranular layers in Area 17 to which the measurements have been restricted. We were compelled to quantify only in Layers II/III because the immunostaining pattern with the Fos antisera is most pronounced in these layers. A sampling frame, subdivided into 10 equally sized boxes, was positioned over cortical Layers II/III along Area 17. Three frames in each section stained with either our cat Fos antibody or the Fos antibody from Santa Cruz were screened. No quantitative analysis could be done for Fos stained with the Oncogene Science antibody. Because of a very low signal:noise ratio, the computer-aided image analyzing system could detect only background staining and no Fos-positive nuclei. We quantified the number of neuronal profiles, corresponding to complete or partially cut cells in the sections. Immunoreactive neuronal profiles were selected using a semiautomatic threshold procedure, based on the optical density of the neuronal profiles. The optical density corresponded to the intensity of the transmitted light and was measured on a scale from 0 (100% transmitted light) to 255 (0% transmitted light) for each pixel. Because there is a difference in intensity with which the nuclei were immunostained, we used the lowest optical density found over clearly stained nuclei as threshold. Criteria of object inclusion were the shape and the size of the neuronal nuclei and a strong immunoreactive status (Leuba et al. 1998). Numbers of profiles are given as means ± SEM per mm2 cortex within cortical Layers II/III. Student's t-test was used for statistical analysis. The quantitative data are not meant to represent an absolute measure of laminar Fos-immunoreactive neuron density and are applied only as indices of relative numbers of Fos-positive nuclei.
Results
Immunocytochemical Screening
Two rabbits were immunized with the cat-specific Fos synthetic peptide. In one rabbit, Fos antibody was clearly detectable in blood samples after the tenth injection, using immunocytochemical screening of vibratome sections of cat visual cortex. The nuclear Fos staining observed in the cell was the result of the antigen-antibody binding capacity. Identification of the cell type containing the Fos-positive nuclei was established in two ways. First, immunoreactive cells appeared to be neurons on the basis of observations of sections labeled for Fos and counterstained with Cresyl violet (Figure 1A). Fos immunoreactivity was found exclusively in nuclei of neurons and was not present in cytoplasm, nucleolus, axons, or dendrites. Second, double staining for Fos and glial fibrillary acidic protein (GFAP), a constitutive intermediate filament found in astrocytes, showed a negative correlation (Figure 1B). No double-labeled cells were observed, indicating that Fos immunoreactivity is restricted to neurons.
Western Blotting
The specificity of the immunoreactivity of this new anti-cat Fos antiserum was confirmed by Western blotting analysis of different nuclear fractions of cat visual cortex (Figure 2). Immunodetection with the affinity-purified fraction revealed an intense and specific band at 62 kD, corresponding to the expected molecular weight of Fos protein (Figure 2, Lane 2), but this band was not detectable when the collected unabsorbed fraction of the serum was applied to the immunoblot (Figure 2, Lane 1). The 62-kD band was much more intense in the nuclear fraction of a visually stimulated cat than the faint band in the nuclear extract from a nonstimulated cat (Figure 2, Lane 3). As a verification of our results, we applied two commercially available antisera on a 5μl nuclear fraction of cat visual cortex. The antisera from Santa Cruz Biotechnology (Figure 2, Lane 4) and from Oncogene Science (Figure 2, Lane 5) recognize the same intense band at 62 kD. Both our cat Fos antibody and the commercially applied antisera also identified additional bands at 46 kD, 35 kD, and 30 kD (Figure 2, Lanes 2-5).
These bands correspond to the well-known Fos-related antigens (Fras) that represent a family of DNA binding proteins related to Fos. It is not unexpected that both Fos and Fras are recognized by this novel antibody, because the amino acid sequence of our synthetic peptide deduced from cat Fos shows a high homology to the three other Fos-related proteins (Figure 3).
The anti-cat Fos antiserum therefore recognizes proteins with apparent molecular masses of 62, 46, 35, and 30 kD. Although we mention “immunoreactive Fos” in this article, the anti-Fos antibody against the 26-amino-acid sequence of cat Fos in fact recognizes both Fos (62 kD) and Fos-related antigens (46, 35, and 30 kD).
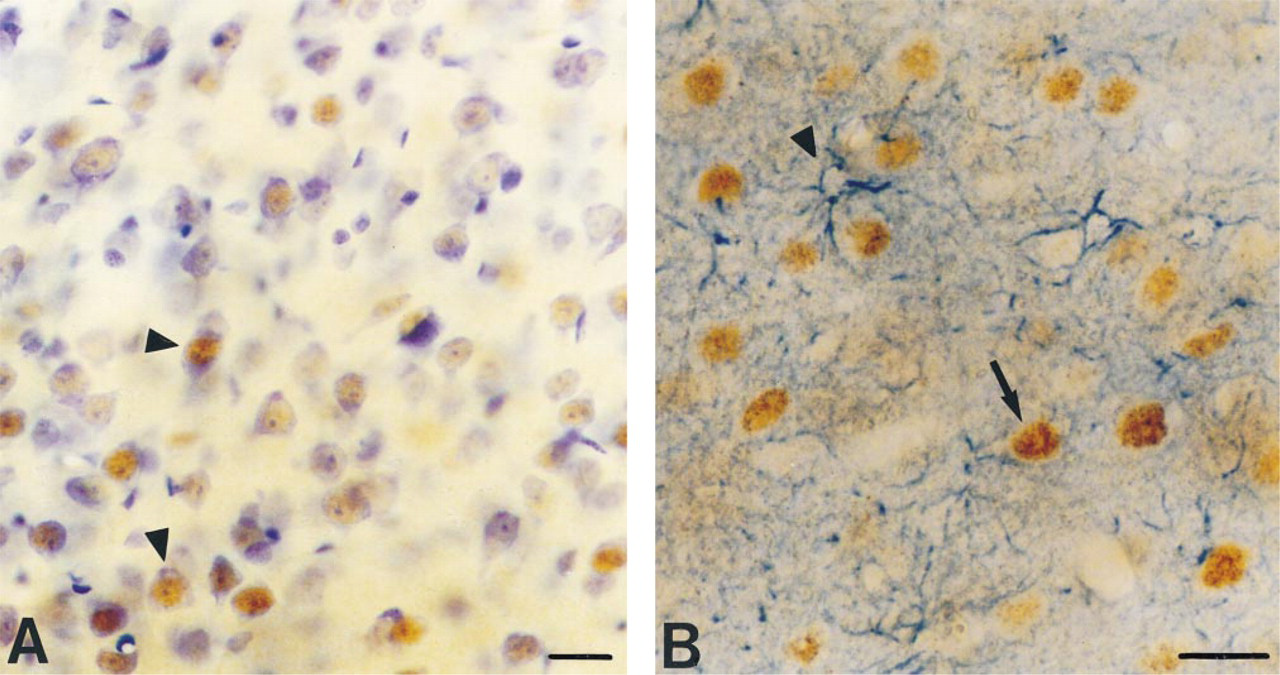
Cresyl violet counterstaining of immunocytochemically stained Fos-positive sections illustrates that Fos-immunoreactive nuclei (brown) are confined to neurons (purple cytoplasm) (
Immunocytochemical Detection of Fos in Cat Visual Cortex
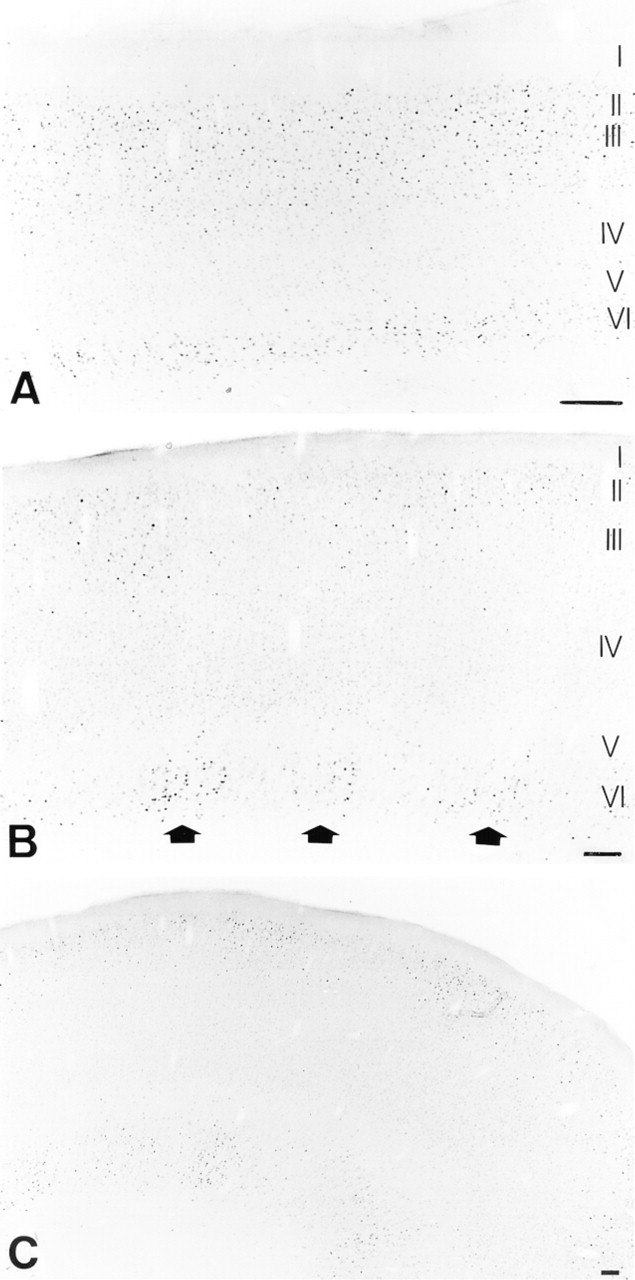
Qualitative Analysis. The IEG c-fos is expressed at very low basal levels under nonstimulatory conditions, whereas visual stimulation upregulates c-fos in cortical neurons. Therefore, we first examined the expression profile of Fos induction after 1-hr visual experience following an overnight dark adaptation in adult cat visual cortex. Figure 4A shows that the labeled nuclei were located almost solely above and below Layer IV, respectively, in Layers II/III and V/VI. In Layer I, Fos-immunoreactivity was rarely observed, reflecting the sparse cell density in this layer. Immunocytochemistry for Fos in the visual cortex of a lens-fitted cat resulted in a completely different pattern for the Fos expression profile. Whereas binocular visual stimulation led to a homogeneous distribution of Fos-positive nuclei in infra- and supragranular layers along the cortical surface (Figure 4A), monocular deprivation resulted in a columnar pattern for Fos in the primary visual cortex (Figures 4B and 4C). Highly stained columns perpendicular to the pial surface alternate with columns that show lower Fos immunoreactivity throughout Layers II/III, V, and VI.
As a control, we analyzed Fos immunoreactivity in a cat in which visual input was confined to one hemisphere by sectioning of the left optic tract and the corpus callosum (Figure 5). An overnight dark adaptation in combination with a binocular light exposure (1 hr) resulted in detection of Fos-immunostained neurons in the infra- and supragranular layers of the right hemisphere, which is driven by normal visual input (Figure 5A). In contrast, sectioning of the left optic tract and the corpus callosum resulted in very low to undetectable Fos levels in the same layers of the left visually deprived hemisphere (Figure 5B). These results show that visual stimulation induces alterations in Fos protein expression levels.
Figures 6A to 6F compare the immunocytochemical staining pattern for Fos as detected with our novel cat Fos antibody and the two commercial Fos antisera on cat primary visual cortex. Marked differences in the labeling pattern were observed among sections stained for each Fos antiserum. The cat-specific Fos antibody used at a very low concentration (1:20,000) resulted in strong labeling of neurons in Layers II/III and V/VI and very low background staining (Figures 6A and 6B). However, Fos staining with the Santa Cruz antibody was markedly lower in supra- and infragranular layers, resulting in a lower signal-to-noise ratio (Figures 6C and 6D), despite the higher antibody concentration (1:1000) and much longer chromogen color reaction times (30 min). In addition, the Santa Cruz antibody induced more intense background staining at the tissue edges. The third Fos antibody from Oncogene Science (1:1000) showed little or no detection of Fos, with moderate to high nonspecific binding in Layers II/III and V/VI along the visual cortex in Area 17 (Figures 6E and 6F).
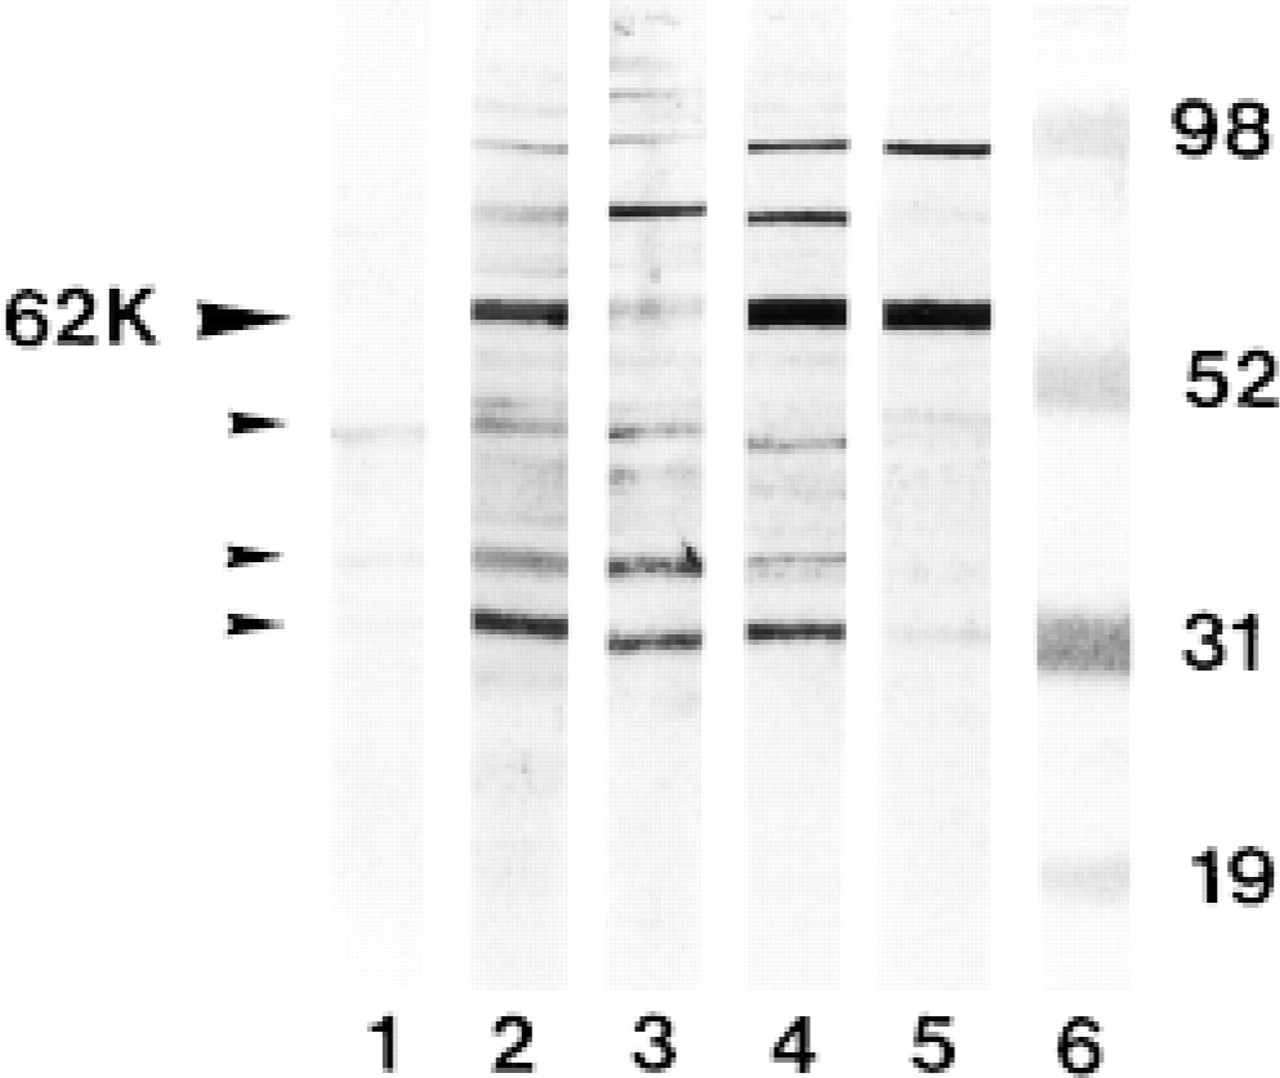
Western blot of a 5-μl sample of nuclear protein extract from a homogenate of cat visual cortex separated by SDS-PAGE to detect cat Fos. Nuclear proteins were isolated from a visually stimulated cat, except in Lane 3, which contains a visual cortex of a cat that had been sacrificed under nonstimulation conditions. Lane 1, immunodetection with the unabsorbed fraction; Lane 2, with the eluted absorbed antibodies of the affinity-purified antiserum; Lane 3, immunodetection with the unpurified polyclonal cat Fos antibody. Immunodetection with commercially available Fos antiserum from Santa Cruz Biotechnology (Lane 4) and Oncogene Science (Lane 5). Lane 6, molecular weights (kD): myoglobulin (19 kD), carbonic anhydrase (31 kD), glutamic dehydrogenase (52 kD), phosphorylase B (98 kD). Black arrowhead at left indicates cat Fos with a molecular size of approximately 62 kD. The additional bands (46, 35, and 30 kD) (small arrowheads) represent the Fos-related antigens detected with both our and the commercially available Fos antibodies.
Quantitative Analysis. Because differences in the signal-to-noise ratio for the three Fos antibodies were consistently observed, we conducted semiquantitative analyses to determine the relative extent of the Fos labeling with the different antisera. This quantitative analysis revealed statistically significant (p<0.001) differences between the numbers of Fos-positive nuclei stained with the cat Fos antibody and the Santa Cruz Biotechnology antibody (Figure 7). In both cats, the mean number of Fos-immunoreactive neuronal profiles per mm2 detected with the cat Fos antibody was almost three times that of the Santa Cruz Fos antibody. No quantitative analysis was performed for Fos stained with the Oncogene Science antibody, because the computer-aided image analyzing system detected only background staining and no Fos-positive nuclei.
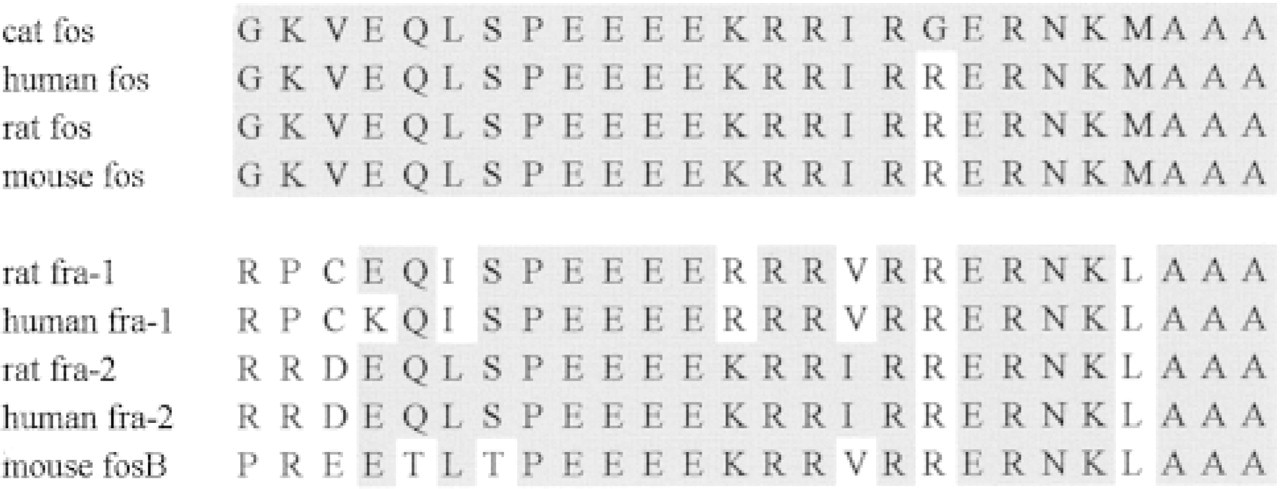
A 26-amino-acid sequence of the synthetic peptide obtained from cat Fos is compared to the amino acid sequence of rodent and human Fos and aligned with the corresponding amino acid sequences of rodent and human Fos-related antigens (Fras), i.e., Fra-1, Fra-2, and FosB. Shaded boxes indicate high sequence homology and high conservation among Fos proteins of vertebrates.
Immunocytochemical Detection of Fos in Monkey and Rat Visual Cortex
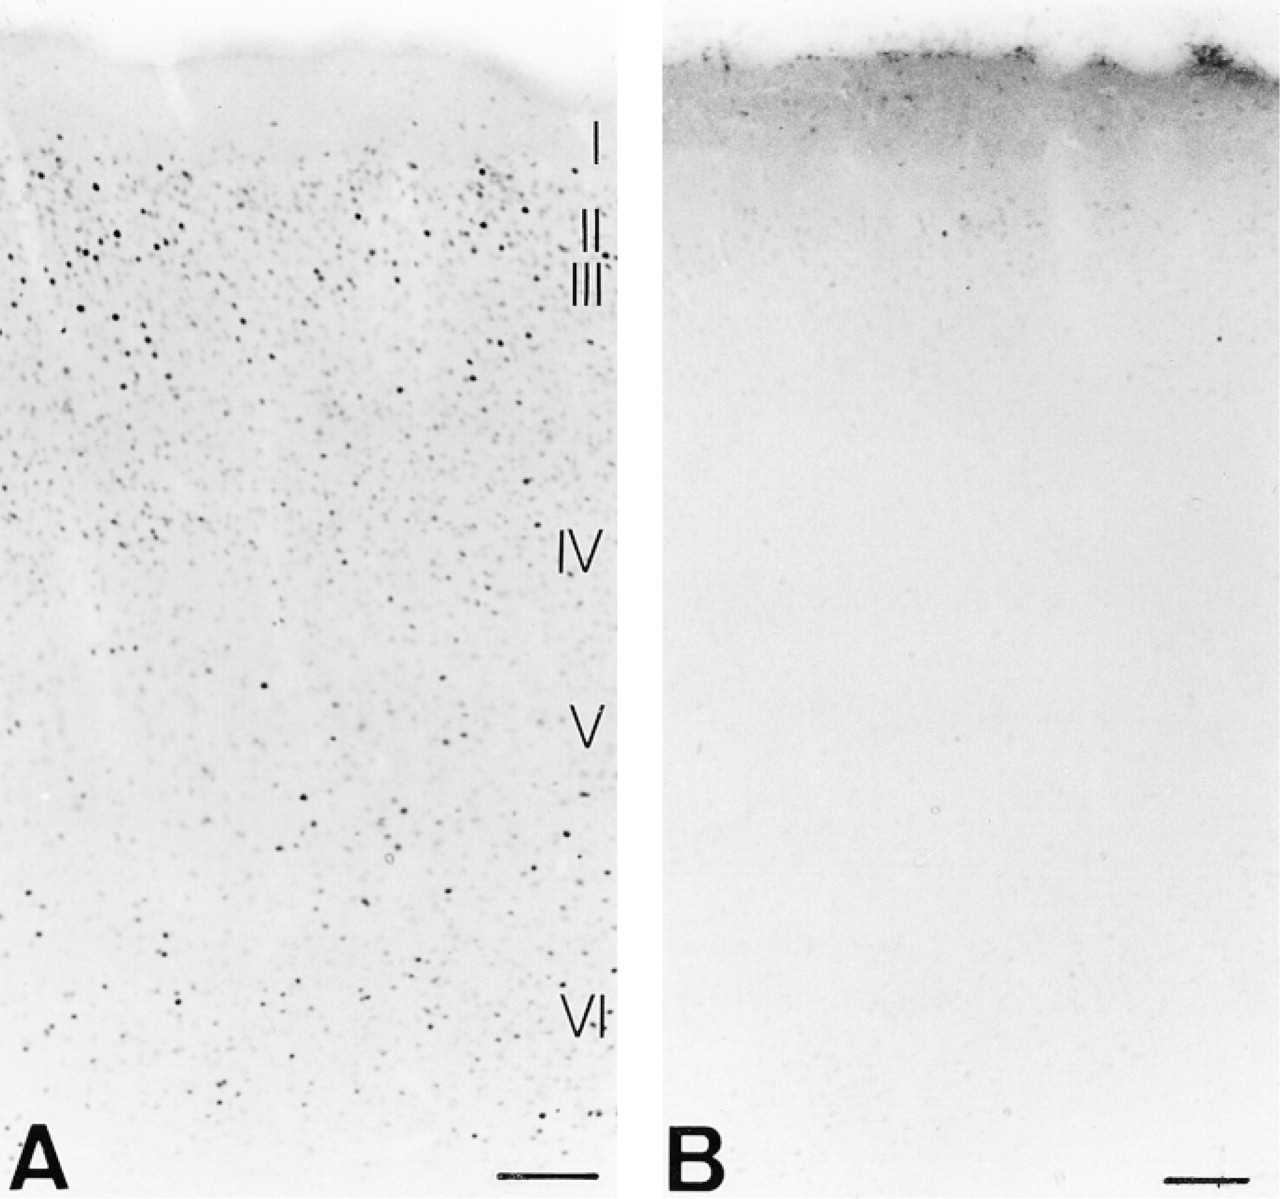
To test the applicability of this cat Fos antibody to other mammalian species, we performed immunocytochemistry on monkey (Macaca mulatta) and rat primary visual cortex. Immunodetection for Fos showed significant staining in Layers II/III, IV, and VI of monkey V1 after a binocular light input subsequent to a period of darkness (Figure 8A). Layers II/III (Figure 8B) and VI contained the most Fos-immunostained nuclei. Layer IV of macaque monkey V1 is subdivided into four laminae. Fos immunoreactivity was prominent in Layers IVA and IVB. In addition, a band of intensely labeled cells in the lowest part of Layer IV, especially Layer IVCβ, was also discernible. Layer I was devoid of Fos staining, whereas Layer V contained a small number of scattered Fos-immunopositive neurons (Figure 8C). Sections of monkey V1 were also processed for IEG immunocytochemistry with two commercially available antisera from Oncogene Science and Santa Cruz Biotechnology. Using the Santa Cruz antibody, no Fos staining was detected in monkey Layer V1 (Figure 8D); only intense nonspecific binding (cytoplasmic staining) and widespread background staining could be observed. Fair Fos staining in upper Layer II and moderate to high nonspecific binding in the other layers was detected with the Oncogene Science antibody (Figure 8E), as was the case with cat brain tissue.
Figure 9 shows photomicrographs of the primary visual cortex of rats exposed to light either for 1 hr after darkness or for a prolonged period (8 hr). Fos was expressed at higher levels in the nuclei in cortical Layers II/ III, IV, and VI, but minimally in Layer V after a 1-hr light stimulation (Figure 9A). Visual cortical Area 17 of control rats sacrificed under nonstimulatory conditions (Figure 9B) revealed a low signal related to the basal expression of Fos in the same layers. Laminar distribution of Fos expression in rat and monkey visual cortex was determined from adjacent Cresyl violet-stained sections.
A binocular light stimulation leads to the detection of many intensely stained Fos nuclei uniformly distributed throughout Layers II/III and V/VI of cat primary visual cortex (
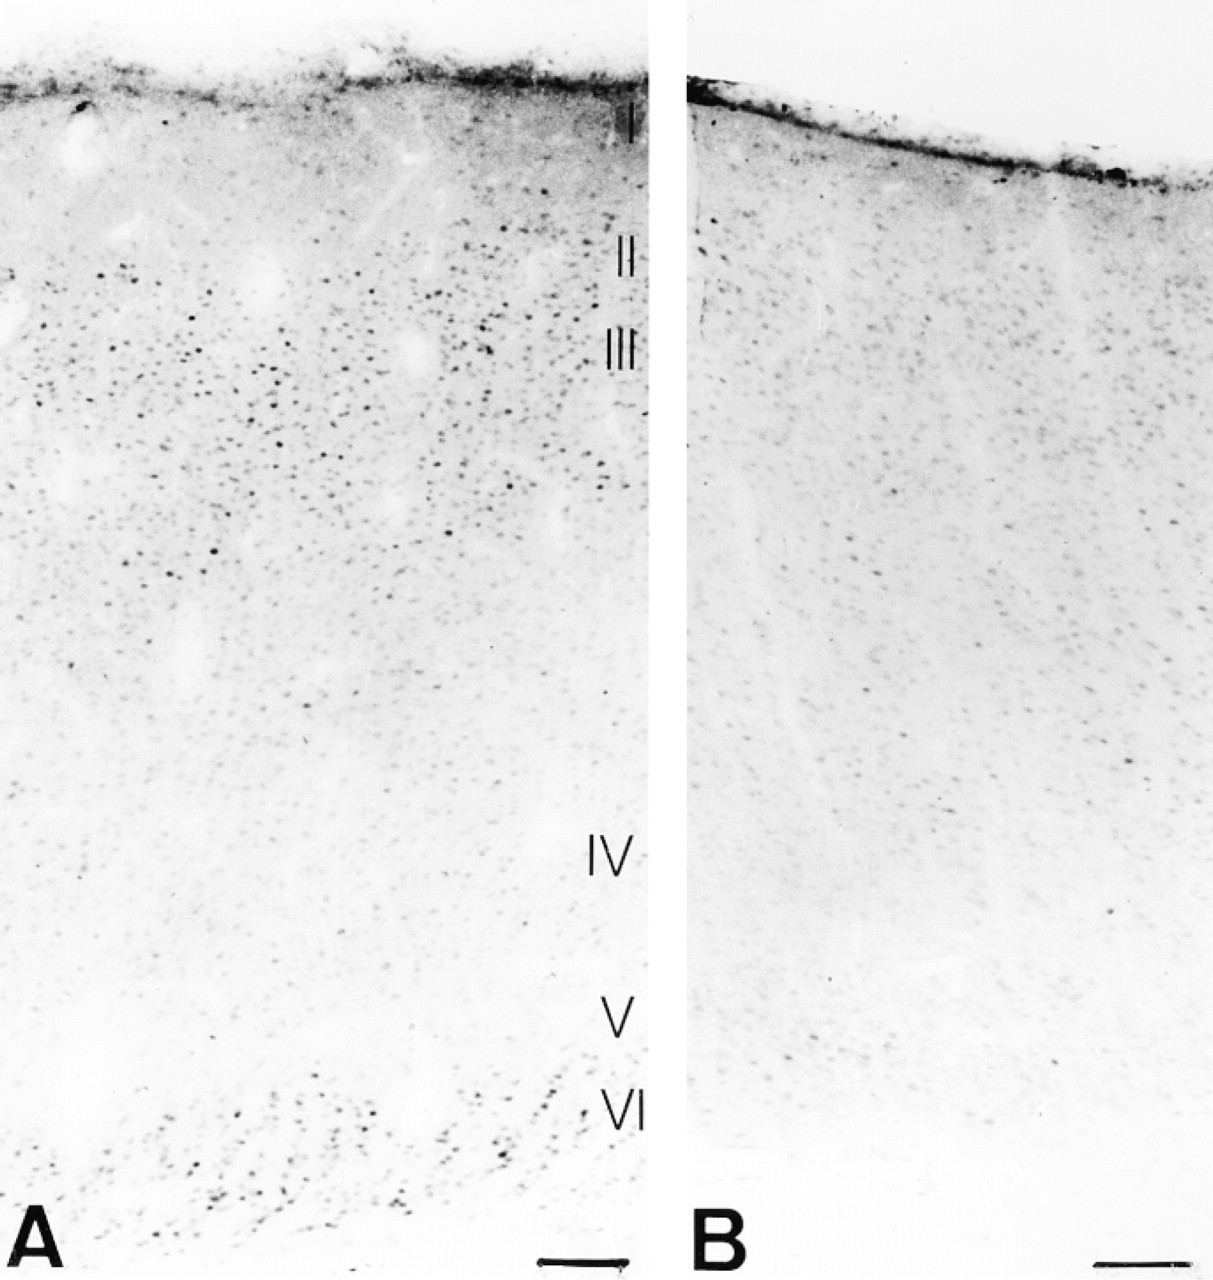
Fos immunoreactivity in visual cortex of a control cat in which visual input was confined to the right hemisphere by sectioning of the left optic tract and the corpus callosum. In the right visually stimulated hemisphere (
The neuronal nature of these Fos nuclei in both rat and monkey was assessed by combining Fos immunostaining with Cresyl violet counterstaining (not shown).
Discussion
In this article we report the synthesis and characterization of a novel polyclonal antibody recognizing the protein product of the IEG c-fos in mammalian brain tissue. This Fos antibody was directed against amino acids 127-152 of cat Fos in analogy to the polyclonal antibody against the M-peptide region of rat c-fos (Curran et al. 1985). Therefore, we have cloned a fragment (357-bp) of the cat c-fos gene and determined its nucleotide and amino acid sequence (unpublished results). This fragment included the cat sequence of the M-peptide and the DNA binding domain of the molecule (Sambucetti and Curran 1986). Using the amino acid sequence of our synthetic peptide of cat Fos, a Blast Search was performed on the EMBL Swiss-protein Database to find sequences with a high degree of similarity in other species. As a result, we confirmed that this peptide is highly conserved among cat, human, rat, mouse, and chicken (96%) (Fujiwara et al. 1987) but also showed high homology to Fos-related genes such as FosB (70%) (Zerial et al. 1989) and Fra-1 (69%) and Fra-2 (80%) (Cohen and Curran 1988; Matsui et al. 1990; Nishina et al. 1990). Western blots performed on cat brain tissue revealed a strong protein band of the predicted molecular weight of Fos (62-kD) and some additional bands of 46, 35, and 30 kD, identified as Fras. This finding corresponds to previously published Western blot analyses of the anti-M-peptide antibodies from Curran et al. (1985) performed on rat and mouse brain tissue (Franza et al. 1987; Sonnenberg et al. 1989a,b). Immunodetection on cat brain nuclear fraction with two commercial Fos antisera revealed essentially the same banding pattern. On validation, we used this new cat-specific Fos polyclonal antibody to test its efficacy and specificity in immunocytochemistry on cat visual cortex. Our results demonstrate the induction of changes at the protein level of Fos in primary visual cortex of different experimental cats as an effect of manipulating visual input. Under normal visual conditions, Fos is expressed at very low basal levels in adult cat visual cortex (Zhang et al. 1994; Kaplan et al. 1996). An overnight dark adaptation in combination with a binocular light stimulation for 1 hr produced a significant increase in Fos immunoreactivity throughout supra-and infragranular layers of Areas 17 and 18 compared to the basal Fos expression. These results are in agreement with similar studies in cat (Beaver et al. 1993; Mower 1994; Kaplan et al. 1996) that describe induced Fos expression after visual exposure after darkness in the same layers of adult cat visual cortex. The laminar pattern of Fos protein coincides with the distribution pattern of c-fos mRNA as previously reported (Rosen et al. 1992; Zhang et al. 1994). Alternatively, the visual manipulation in the lens-fitted cats influenced the Fos expression profile. Alternating patches of higher and low Fos immunoreactivity became distinguishable, related to ocular dominance columns (Chaudhuri and Cynader 1993; Chaudhuri et al. 1995). Arckens et al. (1994) have already verified in a previous report that these columns indeed represent ocular dominance columns by revealing a complete overlap between cytochrome oxidase-positive columns corresponding to the stimulated eye and the columns immunopositive for Fos. We further examined the effect of visual deprivation on the expression of Fos by sectioning the left optic tract and the visual portion of the corpus callosum. In this cat model, we compared the normal hemisphere receiving visual input with the visually deafferented hemisphere (Vanduffel et al. 1995). In the deafferented hemisphere, a clear decrease in Fos protein level was found in contrast to the non-deafferented hemisphere. These observations are consistent with the results from our group demonstrating a decrease in c-fos mRNA expression in the visually deafferented hemisphere compared to the other hemisphere (Zhang et al. 1995). The conformity between these results is instrumental in validating our immunocytochemical results using this specific anti-cat Fos antibody which produced a conspicuous staining for Fos. The quality of the new Fos antibody is superior to that of the commercially available antisera, because our antibody enabled us to detect almost three times more Fos-positive nuclei in cat visual cortex. This difference might be due in part to differences in the epitope of the antigens used. The antigen for the anti-Fos antibody from Oncogene Science is the N-terminal portion of human Fos, whereas the antibody from Santa Cruz Biotechnology was raised against amino acids 139-211 of human Fos and is described as being reactive with Fos, FosB, Fra-1, and Fra-2. Staining with our antibody directed against the M-peptide region of cat c-fos detects both Fos and Fras, and it may be that this crossreactivity, together with the species-specific antigen sequence, accounts for the high quality of Fos detection in cat brain tissue. This new antibody provides a better specificity and intensity labeling, and an additional advantage of this cat Fos antiserum is its sensitivity. The dilution range at which the antibody can be used (1:20,000) is 20 times more in comparison to the concentration 1:1000 of the commercially available antisera.
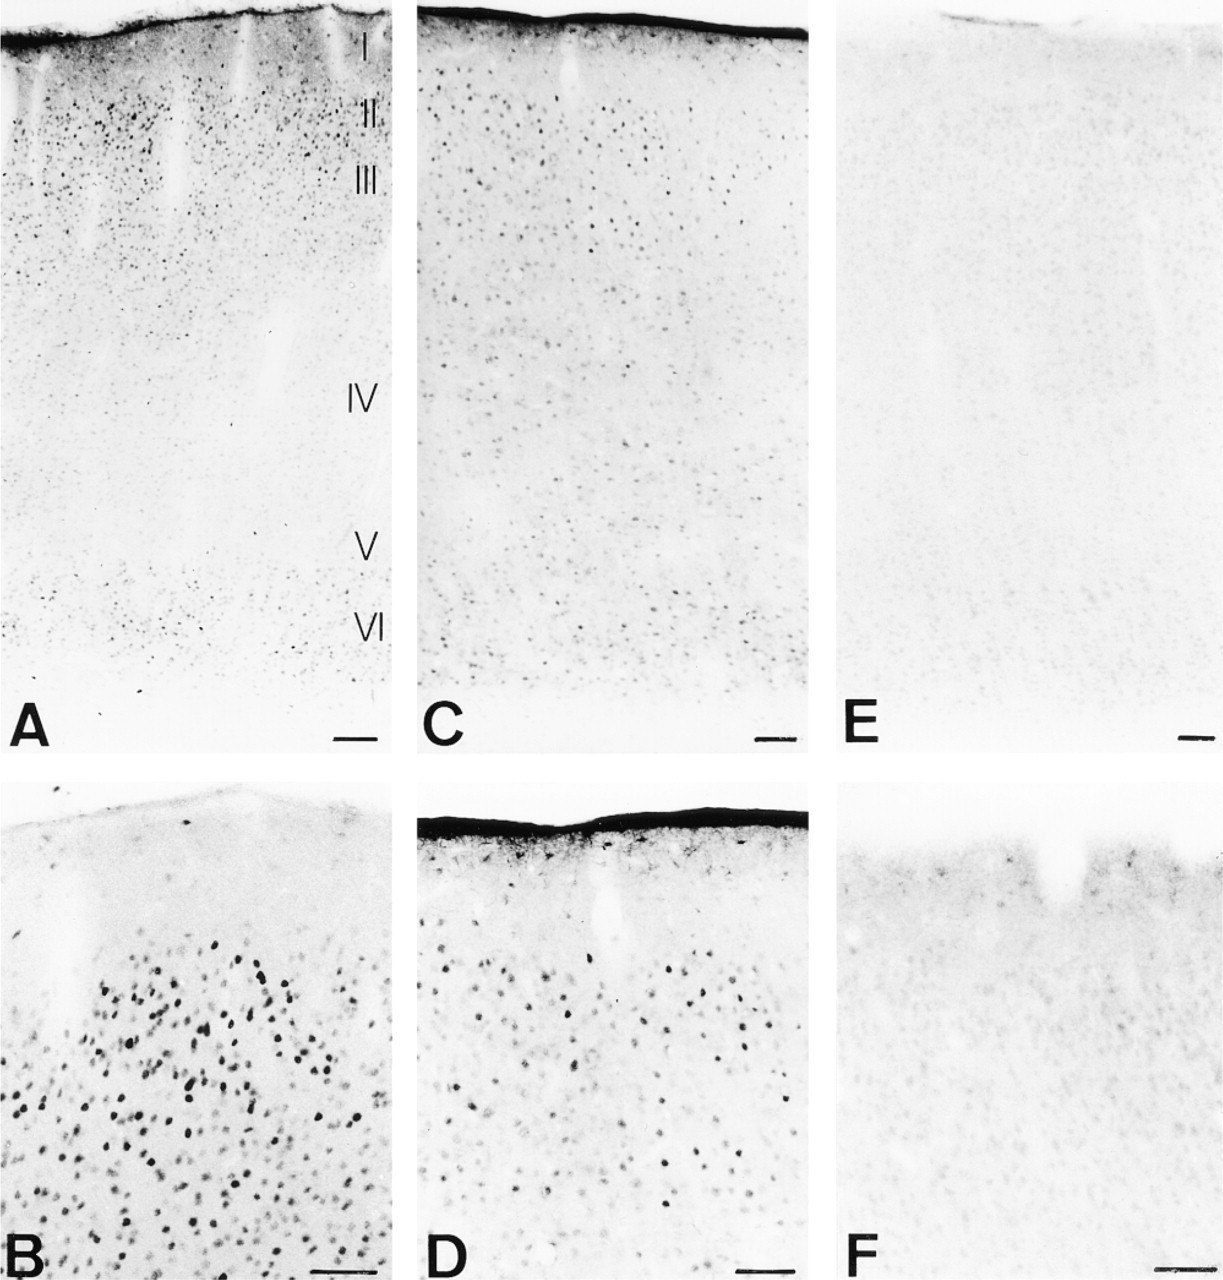
Comparison of Fos immunostaining in cat visual cortex with our and commercially available Fos antisera. (
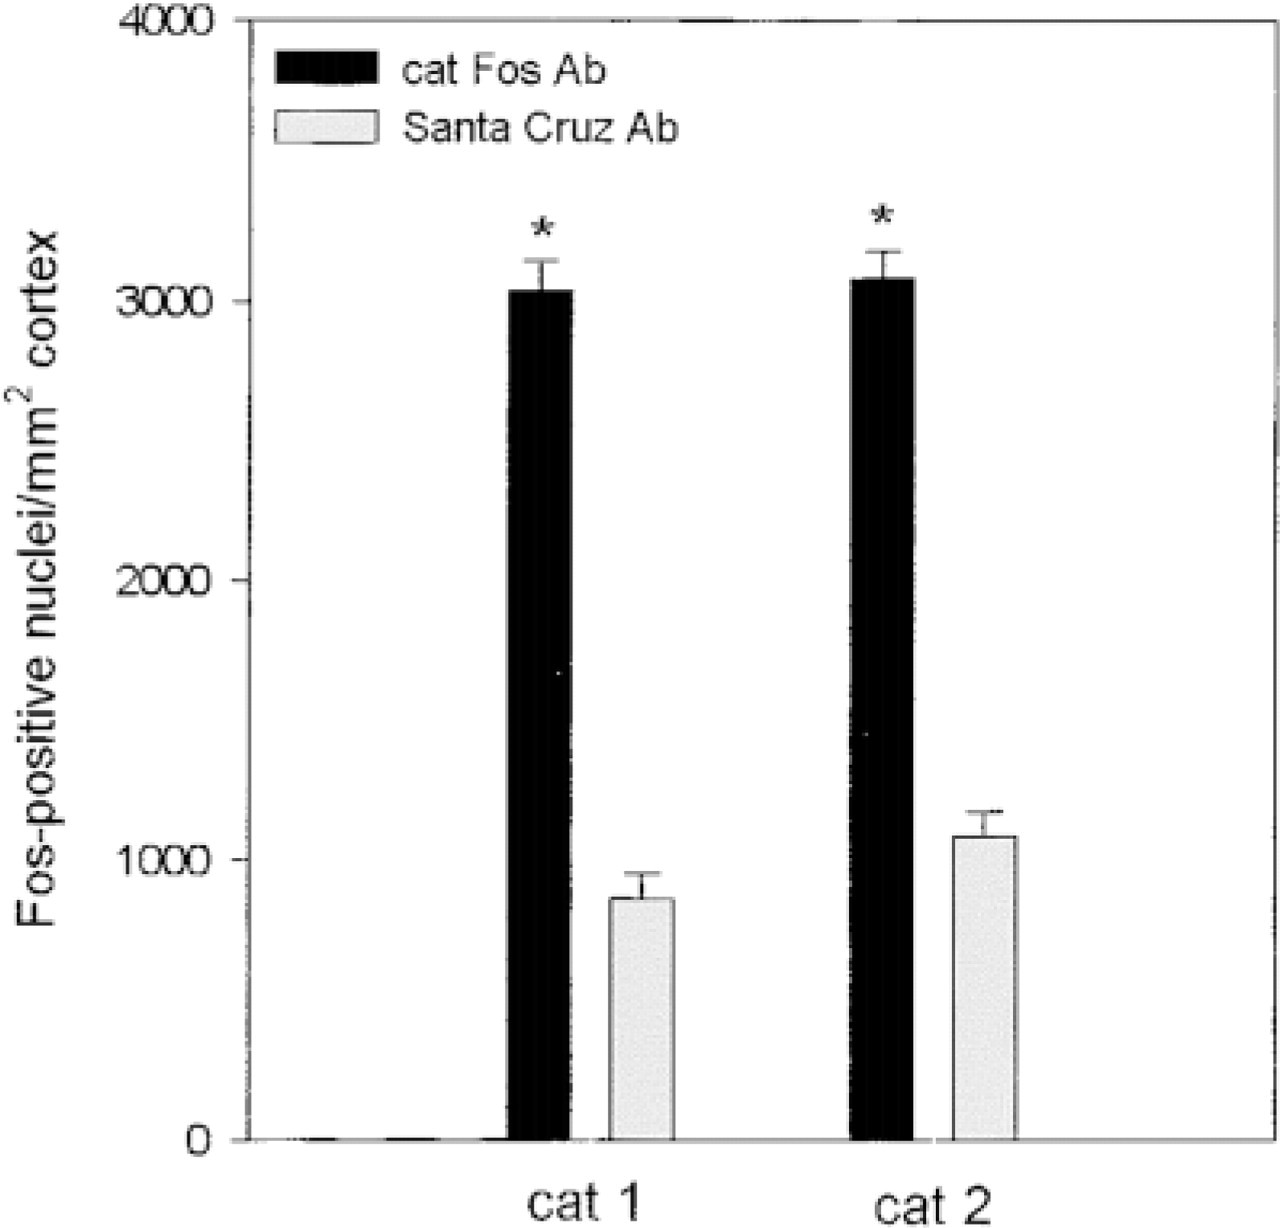
Histogram comparing the number of Fos-positive neurons detected with two different Fos antisera in the visual cortex of two visually stimulated cats. Differences in the number of Fos-positive nuclei in both cats detected with our cat Fos antibody (black) compared to the Fos antiserum from Santa Cruz Biotechnology (gray) are statistically significant (asterisks; p<0.001). Values are mean ± SEM.
We next wanted to assess the applicability of this new antibody on brain tissue from other species, i.e., monkey and rat. Before the recent paper from Kaczmarek et al. (1999), there had been no reports of Fos protein expression in monkey visual cortex because all the available Fos antisera produced weak staining. As in other reports, we tested several commercially available Fos antisera on monkey brain tissue, resulting in weak or variable Fos staining, difficult to discriminate from background staining (Okuno et al. 1995; Caston-Balderrama et al. 1998). It is not evident why various antisera yield variable Fos detection. As suggested by Caston-Balderrama et al. (1998), the reason for inconsistent Fos staining may be related to the presence of unbound structural proteins that interfere with specific binding of the antisera, or to differences in Fos protein sequences among species that underlie the inefficacy of the applied Fos antisera in nonhomologous species. Fos immunodetection with our anti-cat Fos antibody in macaque monkey V1 resulted in successful nuclear Fos labeling throughout Layers II/III, IVA/B, IVCβ, and VI, with minimal background level. These findings clearly indicate that this new polyclonal Fos antibody can be used to label activated neuronal populations, and our results are in complete accordance with previous experiments performed in cat and monkey using Fos as an anatomic marker for mapping neuronal activity in several brain regions after sensory stimulation (Arckens et al. 1994; Kaczmarek et al. 1999). Until now, no study has approached the pronounced Fos immunoreactivity in monkey visual cortex that we have detected with the cat Fos antibody.
In addition, the detection of intense vs low Fos expression in primary visual cortex of a visually stimulated and a nonstimulated rat respectively (Montero and Jian 1995; Amir and Robinson 1996), confirm and extend the suitability of this Fos antiserum to different mammalian species. In contrast to the results on cat and monkey brain tissue, this cat Fos antibody labels Fos-immunoreactive neurons in rat comparable to stainings obtained with commercially available Fos antibodies (Montero 1997, 1999).
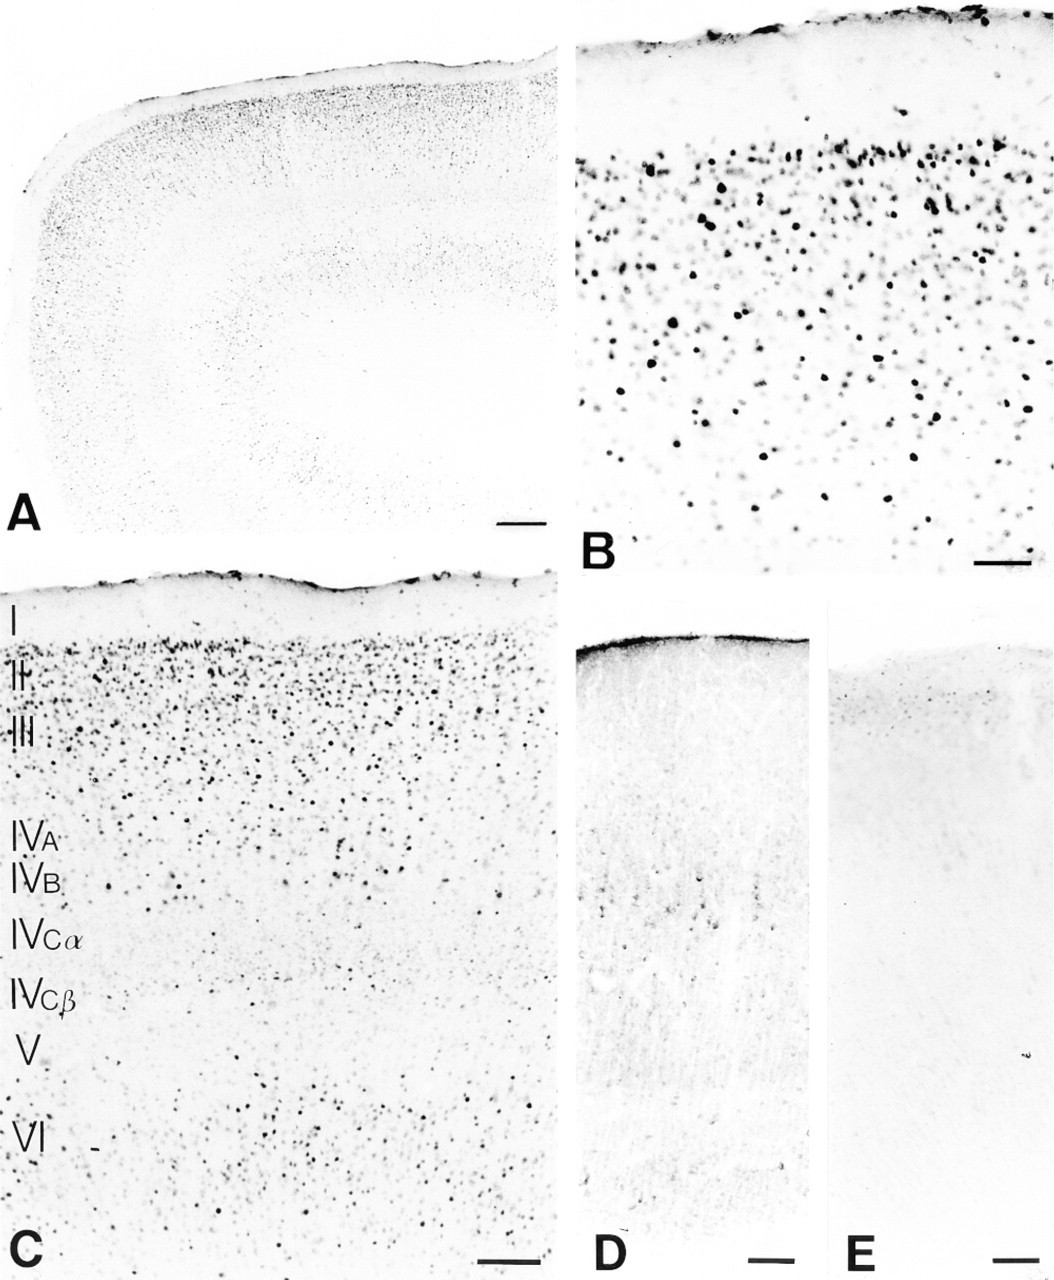
Fos immunoreactivity in Layers II/III, IV, and VI in monkey V1 (
In conclusion, the supporting evidence provided in the present study from Western blotting and immunodetection of Fos with this antibody give certainty of the successful development of a novel Fos antibody that is specific to cat Fos. This antibody clearly allows the investigator to identify the cellular localization of Fos in neurons activated under different physiological conditions in cat and monkey visual cortex.
Spatial distribution of Fos in Layers II/III, IV, and VI in rat Area 17 (
Footnotes
Acknowledgements
Acknowledgments
Supported by grants from the Belgian Queen Elisabeth Medical Foundation, the Belgian program of Inter-University Poles of Attraction P4/22, and the Fund for Scientific Research (Flanders, Belgium). Lutgarde Arckens was supported as a postdoctoral fellow of the Fund for Scientific Research, Flanders (Belgium, F.W.O.).
We thank Luc Grauwels for synthesis of the peptide, Kathy Cromphout for excellent technical assistance, and Dr Steve Raiguel for comments on the manuscript.