
Abstract
We studied the expression of glutamine synthetase in liver macrophages (Kupffer cells, KCs) in situ and in culture. Glutamine synthetase was detectable at the mRNA and protein level in freshly isolated and short-term-cultured rat liver macrophages. Enzyme activity and protein content were about 9% of that in liver parenchymal cells. In contrast, glutamine synthetase mRNA levels in liver macrophages apparently exceeded those in parenchymal liver cells (PCs). By use of confocal laser scanning microscopy and specific macrophage markers, immunoreactive glutamine synthetase was localized to macrophages in normal rat liver and normal human liver in situ. All liver macrophages stained positive for glutamine synthetase. In addition, macrophages in rat pancreas contained immunoreactive glutamine synthetase, whereas glutamine synthetase was not detectable at the mRNA and protein level in blood monocytes and RAW 264.7 mouse macrophages. No significant amounts of glutamine synthetase were found in isolated rat liver sinusoidal endothelial cells (SECs). The data suggest a constitutive expression of glutamine synthetase not only, as previously believed, in perivenous liver parenchymal cells but also in resident liver macrophages.
T
Recent studies suggested that glutamine is utilized at a high rate by peritoneal macrophages and that the activity of glutaminase is high in these cells (Wu and Flynn 1995; Costa Rosa et al. 1996; Newsholme and Calder 1997). Apparently, glutamine is required in cells of the immune system to maintain high intracellular concentrations of intermediates required for optimal cell proliferation, phagocytosis, and synthesis and release of cytokines (Ardawi and Newsholme 1983; Souba et al. 1990; Abcouwer et al. 1996; Newsholme and Calder 1997). However, nothing is known about glutamine synthetase expression in macrophages. Here we studied the expression of glutamine synthetase in liver and pancreas macrophages, RAW 264.7 mouse macrophages, and blood monocytes.
Materials and Methods
Animals
Male Wistar rats were used in all experiments. All rats were raised in the local institute for laboratory animals and held, fed ad libitum on stock diet, according to the local ethical guidelines.
GS immunohistochemistry was performed on cryosections from normal liver and pancreas of four different animals.
Materials
RPMI 1640 and DMEM medium, glutamine, and fetal calf serum were from Biochrom (Berlin, Germany). Nycodenz was from Nycomed (Oslo, Norway). Pronase was from Merck (Darmstadt, Germany). DNase I and collagenase were from Boehringer Mannheim (Mannheim, Germany). FITC-conjugated anti-mouse IgG, chicken serum albumin, and L-γ-glutamyl-hydroxamate were obtained from Sigma (Deisenhofen, Germany). Anti-glutamine synthetase antibody from mouse was from Chemicon International (Harrow, UK). Anti-glutamine synthetase antibody from goat was from Santa Cruz Biotechnology (Heidelberg, Germany). Cy3-conjugated anti-goat IgG (Fab fragment) was obtained from Dianova (Hamburg, Germany). Anti-ED2 antibody and anti-human mature macrophage antibody (MCA1122) from mouse were from Serotec (Raleigh, NC). Horseradish peroxidase-conjugated anti-mouse IgG antibody was from BioRad (Hercules, CA). RNeasy total RNA kit was obtained from Qiagen (Hilden, Germany). The glutamine synthetase cDNA fragment used for detection of glutamine synthetase mRNA was kindly provided by Dr. W.H. Lamers (University of Amsterdam, Netherlands). The 1.0-kb cDNA fragment for glyceraldehyde-3-phosphate dehydrogenase (GAPDH), which was used for standardization, was from Clontech (Heidelberg, Germany). Nitrocellulose membranes were purchased from Schleicher & Schuell (Dassel, Germany). α-[32P]-dCTP was from Amersham (Braunschweig, Germany). Polybead fluorescent microspheres (2.5% solid latex, 1.1 μm diameter) were obtained from Polysciences (St. Goar, Germany). All other chemicals were from Merck.
Isolation and Cultivation of Kupffer Cells and Sinusoidal Endothelial Cells
Cells were isolated from 1-year-old male Wistar rats by collagenase-pronase perfusion and separated by a single Nycodenz gradient and centrifugal elutriation (Eyhorn et al. 1988). Kupffer cells (KCs) were cultured in RPMI 1640 medium supplemented with 10% heat-inactivated fetal calf serum (FCS) and 1% gentamycin for up to 48 hr.
Sinusoidal endothelial cells (SECs) were plated on collagen 1-coated culture dishes and maintained in RPMI 1640 medium supplemented with 10% heat-inactivated FCS and 1% gentamycin for 24 hr.
Culture medium was changed after 24 hr. Culture was performed in a humidified atmosphere of 5% CO2 and 95% air at 37C. Purity of KCs was ≥98% as assessed 1-48 hr after seeding by their typical light microscopic appearance, by immunological staining for ED2 (specific macrophages marker protein) (Shi et al. 1996), and by their ability to phagocytose fluorescent 1.1-μm latex particles. Purity of SECs was ≥80% as assessed 24 hr after seeding by their typical light microscopic appearance and by their inability to phagocytose fluorescent 1.1-μm latex particles.
Isolation of Blood Monocytes
Monocytes were isolated from the blood of 1-year-old male Wistar rats. The peripheral blood mononuclear cells (PB-MCs) were isolated from blood by centrifugation on Ficoll-Hypaque as described (Böyum 1968). Cells were washed twice in PBS without Ca2+ and Mg2+. Cells were resuspended in medium, layered on top of a continuous Percoll gradient, and centrifuged for 5 min at 400 × g. Afterwards, the supernatant with contaminating platelets was removed. Monocytes were isolated by adherence on polystyrol for 60 min, followed by three washes with PBS to remove nonadherent cells (Wahl and Smith 1995). Purity was controlled by unspecific esterase staining as described (Li et al. 1973).
Isolation and Cultivation of Parenchymal Cells from Rat Liver
Isolated parenchymal cells (PCs) were prepared from livers of 5-8-week-old male Wistar rats by a collagenase perfusion technique as described (Meijer et al. 1975). Cells were plated on collagen-coated culture dishes and maintained in Krebs-Henseleit medium supplemented with 6 mmol/liter glucose in a humidified atmosphere of 5% CO2 and 95% air at 37C. After 2 hr, medium was removed and the culture was continued for 24 hr in Dulbecco's modified Eagle's medium containing 5% FCS, penicillin/streptomycin, 0.1 mg/ ml, insulin 100 nmol/liter, dexamethasone 100 nmol/liter, Na-selenite 30 nmol/liter, and aprotinin 1 μg/ml.
Culture of RAW 264.7 Cells
The murine peritoneal macrophage cell line RAW 264.7 was maintained in DME medium at 37C in 5% CO2, supplemented with 10% FCS, and 1% gentamycin, and were grown to near confluency before experiments were performed.
Determination of Glutamine Synthetase Expression
Cells were harvested in a buffer containing 63 mmol/liter Tris-HCl (pH 6.8) and 1% SDS. Protein content of the lysate was determined according to Bradford (1976), using a commercially available reagent from BioRad. The cell lysate was mixed 2:1 with gel loading buffer containing 300 mmol/liter dithiothreitol (DTT, pH 6.8). After boiling for 5 min, the proteins were subjected to SDS gel electrophoresis (30 μg of protein per lane, 7.5% gel). After electrophoresis, gels were equilibrated with transfer buffer [39 mmol/liter glycine, 48 mmol/liter Tris base, 0.03% SDS, 20% methanol (v/v)]. Proteins were transferred to nitrocellulose membranes using a semidry transfer apparatus (Pharmacia; Freiburg, Germany) according to the manufacturer's instructions. Blots were blocked in 5% BSA containing 20 mmol/liter Tris, pH 7.5, 150 mmol/liter NaCI, 0.1% Tween-20 (TBST) and then incubated at 4C overnight with mouse anti-glutamine synthetase antibody (1:1000). After washing with TBST and incubation with horseradish peroxidase-coupled anti-mouse IgG antibody (dilution 1:10,000) at room temperature (RT) for 2 hr, the blot was washed extensively and developed using enhanced chemiluminescent detection (Amersham). Blots were exposed to Kodak X-OMAT AR-5 film (Eastman Kodak; Rochester, NY) for 1-10 min.
Determination of Glutamine Synthetase Activity
Cells were cultured for the time period indicated, harvested by scraping in distilled water, and homogenized by sonication for 4 sec at 4C. Glutamine synthetase activity was measured according to the method described in Ward and Bradford (1979) but without Triton. Aliquots of 60 μl of homogenate were incubated with 50 μl of reaction mixture at 37C. The final concentrations used were as follows: 100 mmol/liter imidazole buffer (pH 7.2), 12.5 mmol/liter MgCl2, 10 mmol/liter sodium ATP, 50 mmol/liter potassium glutamate, 20 mmol/liter β-mercaptoethanol, 1 mmol/liter ouabain, 13 mmol/liter phosphoenolpyruvate, 100 mmol/ liter hydroxylamine (freshly neutralized to pH 7.2 with KOH), and 5 U/ml pyruvate kinase. Reaction was stopped after the time period indicated by adding 250 μl of a fresh mixture containing 500 mmol/liter FeCl3, 400 mmol/liter perchloric acid, and 400 mmol/liter HCl. After 20-30-min incubation on ice, the protein precipitate was sedimented by centrifugation at 20,000 × g and 4C for 10 min. The optical density of the supernatant was measured at 492 nm. Standard curves were established using L-γ-glutamyl-hydroxamate. Values are expressed as μmol L-γ-glutamyl-hydroxamate formed per hour per mg of protein at 37C. The reaction was tested for linearity and dependence on the protein concentration employed.
Fluorescence Staining of Glutamine Synthetase
For immunocytochemistry, KCs and ECs were cultured on glass coverslips with a diameter of 10 mm at a density of 0.25 × 10⁶ cells/coverslip. At the end of culture time (0-48 hr), cells were fixed with methanol for 10 min at 4C. Cryosectioning and staining of cryosections for immunofluorescence were performed as previously described by Kubitz et al. (1997). Cryosections of normal human liver were obtained from explants after surgery on benign or malignant liver tumors. This procedure is in accordance with German ethical regulations. Cryosections of rat liver, rat pancreas, or human liver were fixed with methanol for 10 min at 4C.
After rinsing twice with PBS, the methanol-fixed samples were incubated in PBS containing 0.1% Triton for 10 min at RT. The cells were washed again and incubated for at least 3 hr at RT with goat anti-glutamine synthetase antibody (1:25) plus mouse anti-ED2 (for rat) antibody (1:50) or mouse antibody against human mature macrophages (1:250) in a wet chamber. Then the cells were washed with PBS and incubation was continued for 2 hr with Cy3-conjugated anti-goat immunoglobulin (1:300) plus FITC-conjugated anti-mouse immunoglobulin (1:100). To rule out false positivity, negative controls were done by incubation of samples with either the combination of secondary antibodies alone or with each single first antibody together with both secondary antibodies. Microscopy was performed using a confocal laser scanning system (argon-krypton laser; Leica, Bensheim, Germany).
Northern Blot Analysis
Total RNA from cultured cells was isolated by using the RNeasy total RNA Kit (Qiagen). RNA samples (2 μg per lane) were electrophoresed in 0.8% agarose containing 3% formaldehyde and then blotted onto Hybond-N nylon membranes (Amersham) with 20 × SSC (3 mol/liter NaCl/0.3 mol/liter Na-citrate). After brief rinsing with water and UV crosslinking (Hoefer UV-crosslinker 500), the membranes were observed under UV illumination to determine RNA integrity and location of the 28 S and 18 S rRNA bands. The blots were then subjected to prehybridization for 3 hr at 43C in 50% deionized formamide in sodium phosphate buffer (0.25 mol/liter; pH 7.2) containing 0.25 mol/liter NaCl, 1 mmol/liter EDTA, 100 mg/ml salmon sperm DNA, and 7% SDS. Hybridization was carried out in the same solution with approximately 106 cpm/ml [α-32P]-dCTP-labeled random-primed glutamine synthetase and GAPDH cDNA probes. Membranes were washed three times in 2 × SSC/ 0.1% SDS for 10 min, twice in sodium phosphate buffer (25 mmol/liter; pH 7.2)/EDTA (1 mmol/liter)/0.1% SDS, and twice in sodium phosphate buffer (25 mmol/liter; pH 7.2)/ EDTA (1 mmol/liter)/1% SDS. Blots were then exposed to Kodak X-OMAT AR-5 film at −70C with intensifying screens.
Suitably exposed autoradiographs were then analyzed by densitometry scanning (PDI; New York, NY). Relative glutamine synthetase mRNA levels were determined by standardization to the absorption of GAPDH mRNA.
Analysis of Results
Values are expressed as means ± SEM (n=3-6). Results of at least three independent experiments are given. For statistical analysis the one-way analysis of variance was performed using the one-way ANOVA test. p<0.05 was considered statistically significant.
Results
Glutamine Synthetase in Liver Macrophages
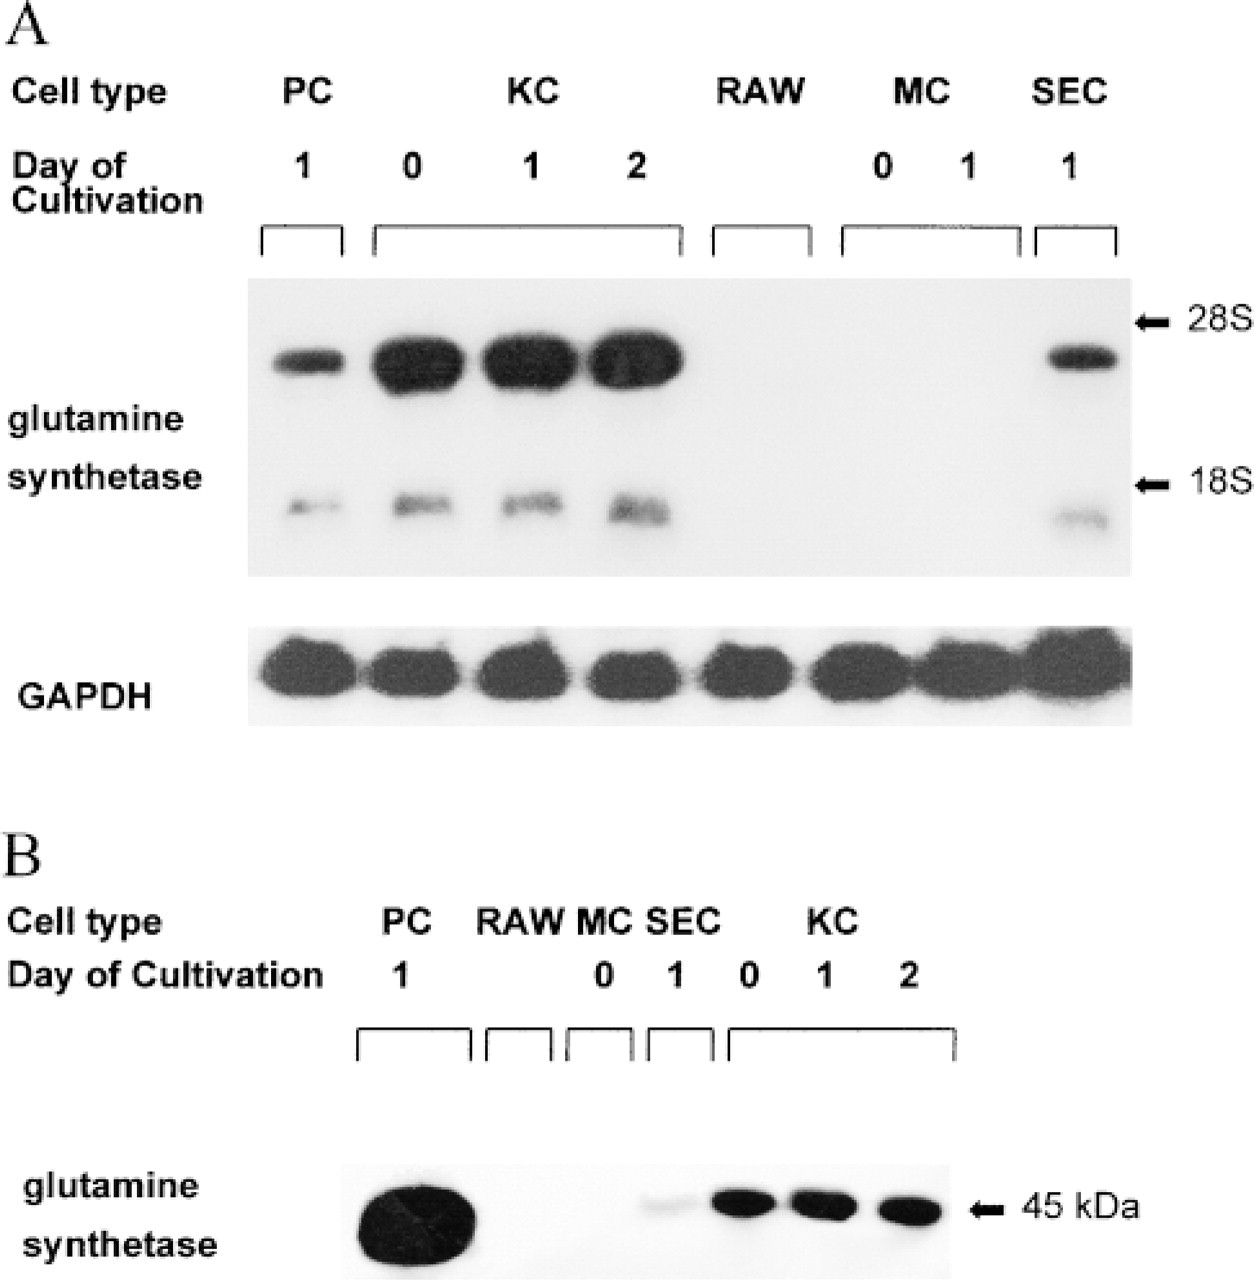
As shown in Figures 1A and 1B, glutamine synthetase mRNA and protein were detectable in isolated rat liver parenchymal cells and liver macrophages. The amount of GS protein in KCs was only about 9% of the amount found in isolated PCs. In line with this, specific GS activity in isolated PCs and KCs was 0.56 ± 0.03 (n=4) and 0.06 ± 0.01 μmol/hr/mg protein (n=4), respectively. In contrast, GS mRNA levels in KCs apparently exceeded those in PCs. Culture of KCs for 2 days had no effect on GS protein and mRNA levels. However, the PC preparation used includes GS-positive (pericentral) as well as GS-negative (periportal) cells. Because the GS mRNA content in pericentral PCs is about 20-fold higher than in periportal PCs (Gebhardt et al. 1996), the GS mRNA levels in KCs and in GS-positive pericentral PCs may be similar.
Immunocytochemical studies on freshly isolated KCs or on KCs kept for 2 days in culture revealed co-localization of GS and ED2, a specific macrophage marker protein (Figures 2A and 2B). GS was present in all KCs and not only in subpopulations thereof. GS was also detectable in KCs in situ. In sections from rat liver tissue, intense staining for GS was found in the perivenous hepatocytes surrounding the terminal hepatic venules, but punctate staining was also found throughout the parenchyma, with some enrichment in the periportal areas. Counterstaining with the macrophage-specific antibody against ED2 revealed that the punctate GS-positive staining co-localized with ED2 (Figure 2D), suggestive of a localization of GS in macrophages. In line with previous results (Grinko et al. 1995), KCs (ED2 positivity) were enriched in the periportal area (Figure 2E). In sections from normal human liver (Figure 2F), glutamine synthetase was also detectable in liver macrophages.
Glutamine synthetase mRNA (
GS in Other Macrophages and Sinusoidal Endothelial Cells
In mouse RAW 264.7 macrophages and blood monocytes, neither GS protein nor GS mRNA was detectable (Figure 1). However, immunohistochemistry of rat pancreas revealed the presence of GS in pancreas macrophages (Figure 2G).
Only small amounts of GS protein and mRNA were found in isolated SECs (Figure 1), and no GS activity was detectable. At the immunocytochemical level, which allowed the differentiation of SECs from contamination of KCs by simultaneous use of the ED2 antibody, no staining for GS was detectable in SECs (Figure 2C). The amounts of GS protein and mRNA found in SEC preparations were only about 17% of the amounts found in isolated KCs. Because our SEC preparation contained 15-20% KCs, our findings suggest that SECs do not contain GS protein or mRNA and that the signals found in Figure 1 are due to contaminating KCs.
Discussion
This study demonstrates a constitutive expression of glutamine synthetase in liver macrophages. This was shown at the level of mRNA and of protein and enzyme activity as well as by immunohistochemistry and confocal laser scanning microscopy. Kupffer cell-associated GS showed some enrichment in the periportal area of the liver lobule due to the known higher amount of KCs in periportal compared to perivenous areas (Grinko et al. 1995). Although KCs from different sublobular origins appeared to exhibit a slightly different morphology, no qualitative zonal difference with respect to GS was found in periportal and perivenous KCs. The physiological role of GS in KCs remains to be established. However, quantitative estimates suggest that KC-associated GS may not play a major role in overall hepatic ammonia disposal. This conclusion is based on the findings that, on an mg/ protein basis, specific GS activity in KCs is only 9% of that in PCs and that KCs comprise less than 5% of total cell volume in liver. Therefore, the fraction of GS in normal liver that can be attributed to KCs will be less than 1%. After liver injury or cirrhosis, however, when the hepatic GS activity drops to values below 20% of control (Häussinger et al. 1992), KCs and, as shown previously, transformed hepatic stellate cells (Bode et al. 1998) may contribute significantly to total hepatic glutamine synthesis.
Our data further indicate that there are differences in the ratio of GS mRNA to protein and specific activity between KCs and PCs (Figure 1). This might be explained by differences in the regulatory mechanisms for expression or degradation of GS and GS mRNA in these cell types. With respect to the enhanced oxidative metabolism resulting from the activation of macrophages (Murray and Cohn 1980), it might be important to mention that the oxidative modification of the GS protein caused a dramatic increase in its susceptibility to proteolytic degradation by cytosolic proteases (Rivett 1985). Therefore, the relatively low concentration of GS protein in cultured liver macrophages might be due to enhanced degradation, leading to increased transcription in order to maintain constant levels of GS activity.
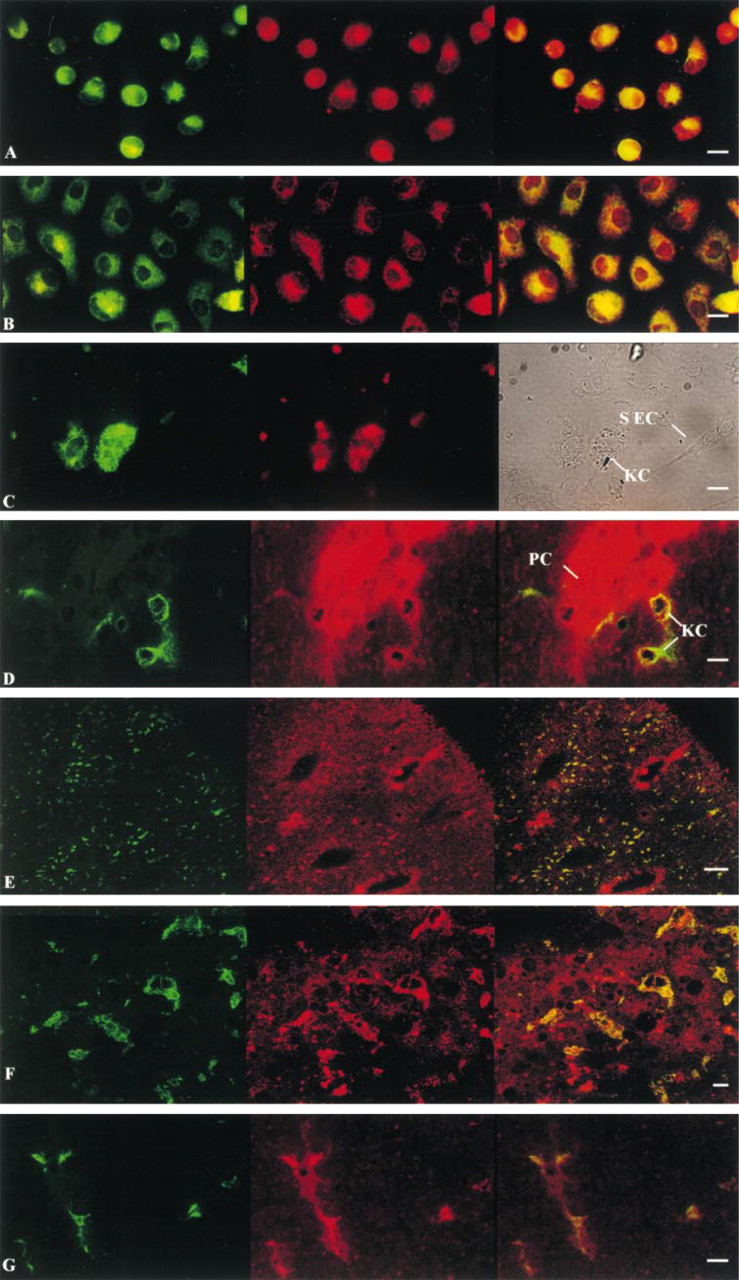
Glutamine synthetase expression in vivo. Cryosections from rat or human livers and rat pancreas, and immunocytochemical staining of Kupffer cells (KCs) and sinusoidal endothelial cells (SECs), were performed and double-stained as described in Materials and Methods section. Specific markers: macrophages (green); glutamine synthetase (red); co-localization, glutamine synthetase (GS) and specific marker for macrophages (yellow). In
Expression of GS does not appear to be a feature of macrophages in general, as blood monocytes and RAW 264.7 peritoneal mouse macrophages contain neither GS protein nor GS mRNA. Because not only liver macrophages but also pancreas macrophages contain glutamine synthetase, it is attractive to speculate that GS expression is a feature of sessile tissue macrophages only. However, GS is inducible by corticosteroids (Gaasbeek-Jansen et al. 1987; Chandrasekhar et al. 1999), growth hormone (Gebhardt and Mecke 1979; Nolan et al. 1990), and specific cell-to-cell interactions (Kuo and Darnell 1991). Therefore, the differences in the expression of GS between resident macrophages of liver and pancreas on the one hand and monocytes on the other may be due to the environment or to the differentiation status of the respective cell type.
GS expression in KCs may relate to the involvement of glutamine in proliferation, phagocytosis and cytokine release by the cells of the immune system (Ardawi and Newsholme 1983; Souba et al. 1990; Abcouwer et al. 1996; Newsholme et al 1996; Walsh et al. 1998). In this respect, it is noteworthy that a requirement for glutamine for IL-1, IL-6, IL-8, TNF-α, or NO synthesis and the macrophage-mediated lysis of a β-cell line has been reported for macrophages stimulated either by lipopolysaccharide (Wallace and Keast 1992; Yassad et al. 1997) or by bacillus Calmette-Guérin (Murphy and Newsholme 1998, 1999). Therefore, one may consider that KCs and other resident macrophages acquired the ability to synthesize glutamine, enabling undisturbed macrophage function under conditions of low blood levels of glutamine. However, further studies are needed to establish the role and the pathophysiological implications of GS for the function of sessile macrophages.
Footnotes
Acknowledgments
Supported by the Deutsche Forschungsgemeinschaft and the Gottfried-Wilhelm-Leibniz-Prize.
The GS cDNA fragment used for detection of GS mRNA was kindly provided by Dr W. H. Lamers (University of Amsterdam, The Netherlands).