
Abstract
High sensitivity is often considered a characteristic of giftedness, but scientific evidence for this is limited. Therefore, this study aimed to investigate whether gifted children rate themselves higher in sensory processing sensitivity (SPS) than their peers. A total of 882 children from Grades 4, 5, and 6 of primary school participated. They all completed a cognitive ability test (COVAT-3) and two self-report questionnaires to assess SPS (HSC scale and ChiSSEQ). The results revealed that the 10% best-performing children on the cognitive ability test did not differ significantly from their peers in SPS. There was one exception: Only on the HSC scale did children with high cognitive abilities score higher than those with low abilities (not higher than those with average and above-average abilities). However, this difference disappeared when applying stricter cut-offs to define high cognitive abilities.
Keywords
Because of their exceptional intellectual abilities and creative talent, gifted children have the potential to achieve outstanding performances in one or more domains relative to their peers (National Association for Gifted Children [NAGC], 2009; Stephens & Karnes, 2000). Identifying gifted children is complex because there is no consensus on the definition of giftedness (Pfeiffer et al., 2018). Different theories and models of giftedness often employ different definitions and sets of characteristics that would accompany giftedness (Sternberg & Kaufman, 2018; Worrell et al., 2019). One characteristic of giftedness often mentioned, especially in daily educational and counseling practice, is “high sensitivity” (e.g., Dakhlallah & Ahmad, 2022; Heylighen, 2012; Lo, 2018). There are also specific services and websites focused on highly sensitive gifted individuals (e.g., Douglas, n.d.; Koolhof, 2020). Although some scientific publications are supporting this statement about giftedness and sensitivity (Edmunds & Edmunds, 2005; Mendaglio, 2003), scientific evidence for this is still rather limited to the best of our knowledge. One reason is that there is variability in how the construct of sensitivity is defined. Sensory Processing Sensitivity (SPS) is the scientific term for “high sensitivity” (Aron & Aron, 1997). SPS is a proposed personality trait characterized by deeper cognitive processing of stimuli, ease of overstimulation, higher emotional reactivity and empathy, and stronger awareness of environmental subtleties (Aron et al., 2012; Greven, 2022; Greven et al., 2019; Homberg et al., 2016). Understanding the relationship between giftedness and SPS may help to improve support for gifted children. Therefore, the present study aimed to investigate whether gifted children are higher in SPS than children in diverse cognitive ability groups.
Giftedness
Evolution of Giftedness Definitions
Giftedness was originally considered a unidimensional construct. Terman (1922, 1954) considered a gifted individual to be someone with a high intelligence quotient (IQ), as measured by an intelligence test. More recent scientific literature, however, describes giftedness as a broader multidimensional and dynamic construct beyond intelligence (e.g., Renzulli & Reis, 2018; Sternberg & Kaufman, 2018; Worrell et al., 2019). Inclusive definitions of giftedness focus on (a) multiple facets of intelligence, e.g., analytical, creative, and practical intelligence (Gardner, 1983; Sternberg, 2001), (b) other non-intellectual characteristics of giftedness, such as creativity and task commitment (Renzulli, 1978; Renzulli & Reis, 2018), and/or (c) talent development across the lifespan, e.g., in music or arts (Gagné, 2010; Heller, 2013; Subotnik et al., 2011). These definitions also emphasize that the development of the gifted is influenced by the environment, such as parents, school, peers, and culture (Heller, 2013; Mönks & Katzko, 2005; Ziegler et al., 2018). However, the gifted are not a homogeneous group (Pfeiffer et al., 2018), and the debate about the precise definition of giftedness is still ongoing (Worrell et al., 2019).
Challenges in Identifying Giftedness
As there is no consensus about the definition of giftedness, it becomes evident that identifying and appropriately guiding gifted children is a complex challenge for teachers (Ackerman, 1997). This challenge is further compounded when identifying twice-exceptional children, as their learning and/or behavioral disabilities can mask their giftedness, and vice versa (Foley-Nicpon & Kim, 2018). In educational contexts, high academic achievement is often used as a primary criterion for identifying gifted children and enrolling them in enrichment programs (Sękowski & Łubianka, 2015). Teacher nominations are considered good estimators of giftedness (Sękowski & Łubianka, 2015). However, teachers may misidentify gifted children because they pay attention to children’s everyday school performance rather than their cognitive abilities (Lavrijsen & Verschueren, 2020). In particular, underachieving children, children of lower socioeconomic status, Black children, and girls were found to be less likely to be identified as gifted by their teacher (Endepohls-Ulpe & Ruf, 2006; Golle et al., 2023; Grissom & Redding, 2016; Hamilton et al., 2018; Lavrijsen & Verschueren, 2020). In addition, teachers also have misconceptions about gifted children’s personality. They tend to regard gifted children as less agreeable, less emotionally stable, and more introverted than their peers (Baudson & Preckel, 2013; Golle et al., 2023; Weyns et al., 2021). In addition, Rothenbusch and colleagues (2016) showed that teacher nominations were influenced by class-average levels of intelligence: Children who were in a class with higher intelligence levels were less likely to be nominated for an enrichment program. These studies underpin the bias of teacher nominations.
Defining Giftedness in the Present Study
Given the challenges associated with identifying gifted children, the present study focuses on children’s cognitive ability rather than teacher nomination. High intellectual capacity is indeed an important criterion for giftedness in most models and definitions (Renzulli & Reis, 2018; Sternberg & Kaufman, 2018; Worrell et al., 2019). There is a discussion about the prevalence of gifted children and children with high cognitive abilities. Some researchers argued that 10% of the population is gifted (Gagné, 2005), while others argued for a 5% or 3% criterion (Marland, 1972; Renzulli, 1982) or even a 1% criterion (Terman, 1916). We used the definition of Gagné (2005), which stated that a gifted individual is in the top 10% in one or more ability domains compared to their peers. The widely used Cattell-Horn-Carroll model (CHC-model; Flanagan et al., 2000; Schneider & McGrew, 2018) defines and describes diverse cognitive ability domains. According to this model, intelligence consists of a general intelligence factor (defined as g-factor) that represents broad cognitive abilities: fluid intelligence (Gf), quantitative reasoning (Gq), crystallized intelligence (Gc), reading and writing (Grw), short-term memory (Gsm), visual processing (Gv), auditory processing (Ga), long-term storage and retrieval (Glr), processing speed (Gs), and reaction time (Gt). Many intelligence tests, such as the Wechsler Intelligence Scale for Children, fifth version (WISC-V; Wechsler, 2014) and the Cognitieve Vaardigheidstest (Cognitive Ability Test [COVAT-3]; Magez et al., in preparation), are based on the CHC-model (McGrew & Wendling, 2010). In the present study, it was investigated whether gifted children, defined as children with high cognitive abilities, share another characteristic in addition to their high cognitive abilities: the degree of SPS.
SPS
The Features of SPS
The assumed personality trait SPS can be used to describe patterns of individual differences in sensitivity to positive and negative environments (Greven et al., 2019). The SPS theory emerged from an in-depth literature review and qualitative interviews with adults whom Aron and Aron (1997) described as “highly sensitive persons” (p. 358). Most studies argued that SPS manifests itself in four features: (a) deeper cognitive processing of stimuli, (b) ease of overstimulation, (c) higher emotional reactivity and empathy, and (d) awareness of environmental subtleties (Aron et al., 2012; Greven, 2022; Greven et al., 2019; Homberg et al., 2016). Depth of processing can be described as a thorough processing of stimuli, evident through actions such as pause to check, planned behavior, and reflection (Aron et al., 2012; Bas et al., 2021). Empathy can be divided into two main components: cognitive empathy and affective empathy (Bas et al., 2021; Overgaauw et al., 2017; Vossen et al., 2015). Cognitive empathy involves understanding the emotions of others, while affective empathy entails experiencing the emotions of others.
SPS Under Discussion
In recent years, attention to SPS in science and practice has increased exponentially, even though the scientific debate about SPS and its multidimensional conceptualization and assessments is still ongoing (Greven et al., 2019; Hellwig & Roth, 2021). Hellwig and Roth (2021) state that SPS is unclearly defined, question why and how the purported features of SPS are related, and argue that SPS strongly overlaps with Big Five personality traits, especially with Neuroticism and Openness to Experience. Another concern is whether SPS should be seen as a categorical or continuous personality trait. Aron and Aron (1997) suggested that SPS is a categorical personality trait, separated into a cluster of highly sensitive persons (a smaller group) and non-highly sensitive persons (a larger group). Later studies used a three-group categorization of low, medium, and high-sensitive groups (Lionetti et al., 2018; Pluess et al., 2018). Pluess et al. (2018) found that approximately 25% to 35% of children were low sensitive, 41% to 47% were medium sensitive, and 20% to 35% were highly sensitive. However, because SPS was relatively normally distributed in these studies, SPS may be better considered as a continuous trait (Greven et al., 2019).
Measuring SPS
Despite conceptual difficulties, the Highly Sensitive Person scale (HSP scale; Aron & Aron, 1997), Highly Sensitive Child scale (HSC scale; Pluess et al., 2018), HSC parent-report (Slagt et al., 2018), and HSC-Rating System (Lionetti et al., 2019) are considered to be valid measures for assessing SPS. Several studies employing these tools showed that some individuals exhibited heightened sensitivity to supportive environments (e.g., Nocentini et al., 2018; Pluess & Boniwell, 2015), to adverse environments (e.g., Booth et al., 2015; Lionetti et al., 2022), or both (e.g., Li et al., 2022; Lionetti et al., 2019; Slagt et al., 2018).
SPS as a Characteristic of Giftedness?
Giftedness is commonly associated with heightened sensitivity. Rinn and Majority (2018), for example, noted that “gifted individuals may be more sensitive to and more easily affected by environmental stimuli than others” (p. 53). Both children high in SPS and gifted children may interpret their environment differently than other children (Greven et al., 2019; Rinn et al., 2018). Both groups are supposed to process environmental stimuli deeper: in children high in SPS this can be explained by a more sensitive central nervous system (Aron et al., 2012; Homberg et al., 2016) and in gifted children by their exceptional cognitive abilities (NAGC, 2009; Solé-Casals et al., 2019; Stephens & Karnes, 2000). In addition, Schwenck and colleagues (2014) showed that empathy, also a feature of SPS (Greven et al., 2019; Homberg et al., 2016), was positively related to intelligence. However, this relationship appeared only for cognitive empathy and not for affective empathy. This cognitive processing of stimuli and empathy could explain the often-assumed positive correlation between giftedness and SPS. For example, Van Thiel et al. (2019) developed a model to define giftedness and this model stated that “high sensitivity” (p. 6) is a marker of giftedness. This model was developed in several sessions with 20 gifted individuals and experts in the field of giftedness who were asked what they considered the most important characteristics of giftedness. There are two potential issues concerning the way this model was developed. First, these experts could be biased because they primarily worked with gifted individuals who experienced problems, although these experts (and many of their friends) are successful gifted individuals, according to Van Thiel and colleagues. In addition, this relatively small group of 20 participants might not fully represent the larger group of gifted individuals. There might have been a selection bias of participants with specific characteristics who were willing to participate in the study and think about the definition of giftedness.
Previous Research Into SPS and Giftedness
Large-scale empirical studies of SPS in gifted individuals are scarce. Rinn et al. (2018) validated the HSP scale in a sample of gifted young adults, but did not investigate the degree of sensitivity, nor did they use a comparison group with typically developing adults. To the best of our knowledge, only three studies in adults investigated whether SPS is a characteristic of giftedness. In the study by Valpied (2018), no significant relationship was found between SPS measured by the HSP scale, and giftedness (IQ ≥130), measured by a standardized intelligence test. However, the small sample size (N = 69) reduced the statistical power of the analyses. Moreover, the IQ scores of the control group were unknown, but according to the authors, this group probably had a high (or higher than average) intelligence too, because they were highly educated. There may even have been gifted individuals in the control group.
In addition, Van de Ven et al. (2016) found that in a sample of self-identified gifted adults, 87.3% were also highly sensitive, as measured by the HSP scale, compared with only 78.8% of typically developing adults. The difference was significant, but the percentages were very high in both groups, possibly because the respondents were, among others, recruited through an HSP network. This might have led to a self-selection bias of participants, not fully representing the larger group of the gifted. The self-identification of giftedness may also have caused a high potential bias. In addition, the cut-off score used for SPS was not validated and may have been too low (≥ 14 agree on a 2-point scale). Furthermore, the use of cut-off scores and a two-point scale contradicts the finding that SPS is best described as a continuous trait (Greven et al., 2019; Hellwig & Roth, 2021).
Finally, De Gucht et al. (2023) investigated whether gifted adults (IQ ≥130) scored differently on SPS than other adults. They used the SPS Questionnaire (SPSQ) to measure SPS. The SPSQ consists of two higher-order dimensions: a negative dimension (subscales: Emotional and Physiological Reactivity and Sensory Discomfort) and a positive dimension (subscales: Subtle Internal and External Stimuli, Sensory Comfort, Social-Affective Sensitivity, and Aesthetic Sensitivity). De Gucht and colleagues found that gifted adults, in comparison to the control group, had lower scores on the negative dimension of SPS, partly because of their lower scores on Neuroticism, and higher scores on the positive dimension of SPS, partly because of their higher scores on Openness.
Previous Research Into Sensitivity and Giftedness
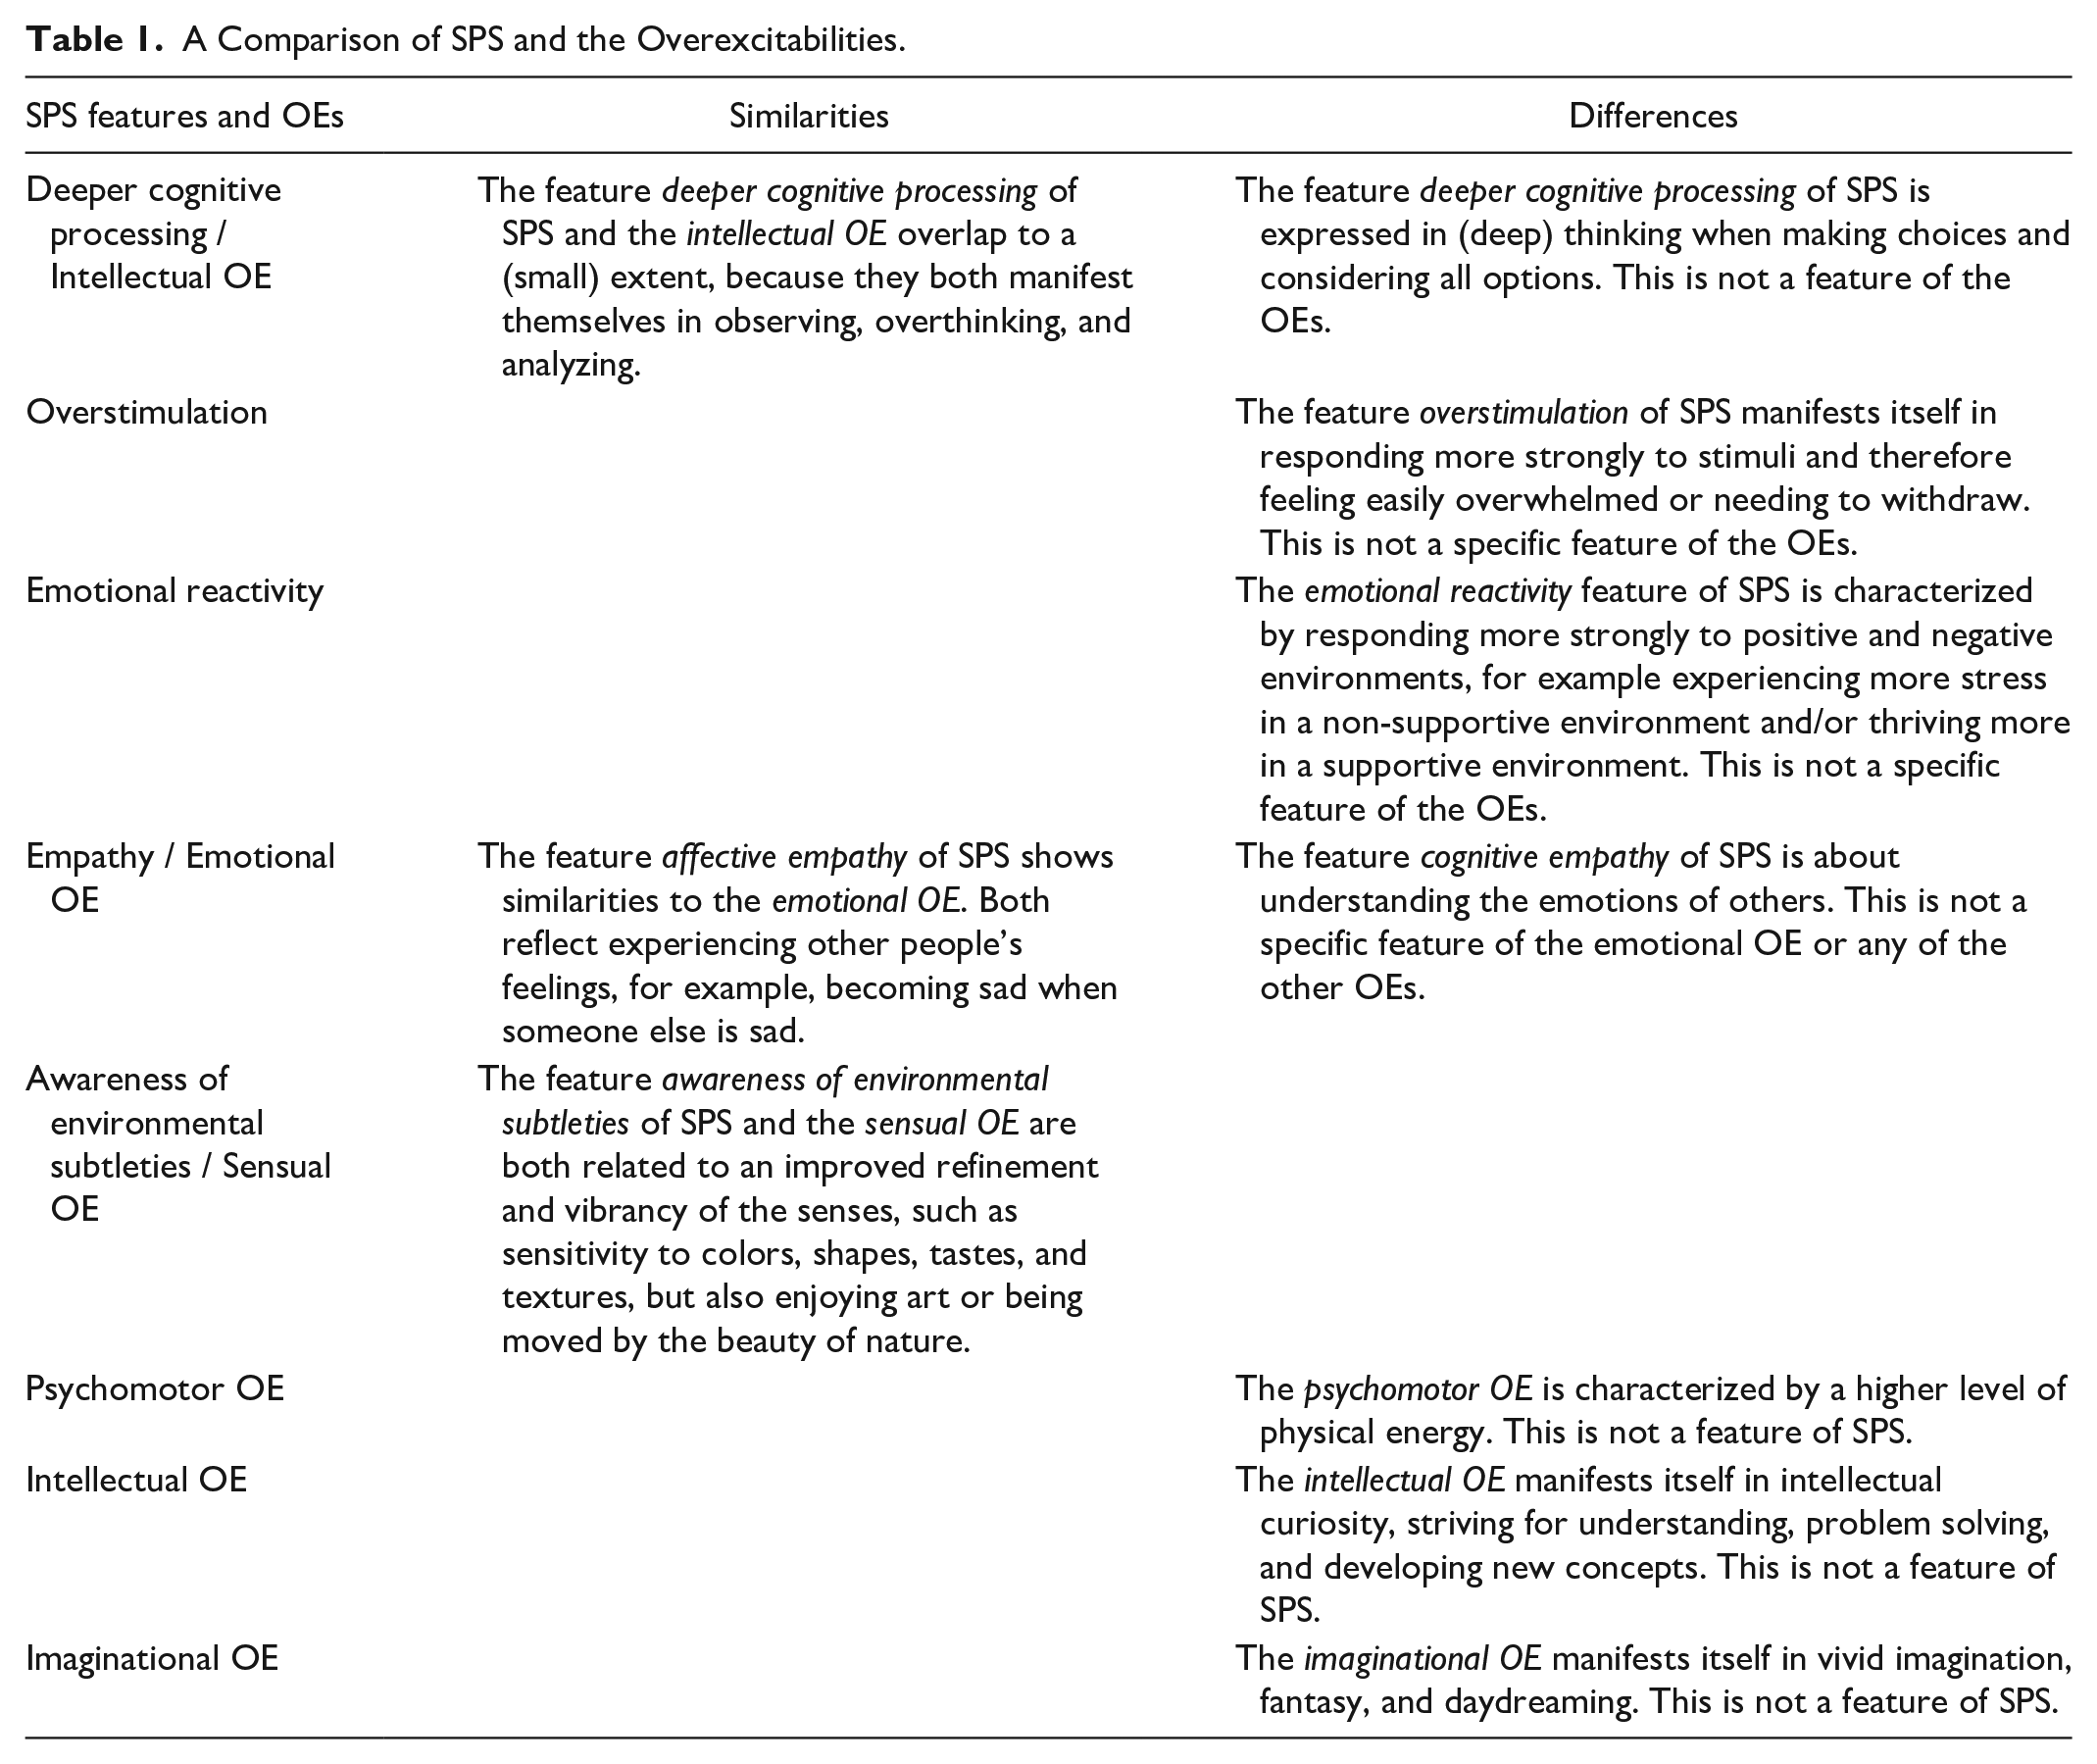
There are also studies of sensitivity in gifted individuals outside the research field of SPS. These studies defined sensitivity differently than the definition of SPS in the present study or included specific components but showed considerable overlap with SPS. Best known are Dabrowski’s (1964) overexcitabilities (OEs), which are often related to giftedness (e.g., Alias et al., 2013; Mendaglio, 2022; Sousa & Fleith, 2022). SPS shares some characteristics with OEs, but these constructs are not identical, as illustrated in Table 1. According to Dabrowski’s positive disintegration theory, there are five OEs: the psychomotor, sensual, intellectual, imaginational, and emotional overexcitability (OE; Mendaglio, 2022). A meta-study revealed that gifted, compared to typically-developing individuals, scored significantly higher on intellectual and imaginational OE (medium effect), and emotional and sensual OE (small effect; Winkler & Voight, 2016). In a literature review, researchers found that the characteristics of gifted individuals were associated with higher levels of the OEs (Wood & Laycraft, 2020). Gallagher (2022) found that 40% of gifted students had three or more OEs, and 28% had two OEs. However, according to the review study by Tourreix et al. (2023), the OEs are not a uniform criterion for identifying giftedness due to a heterogeneity of OE profiles among gifted individuals. Moreover, the debate about the OEs and their validity remains ongoing. While some researchers and many practitioners in gifted education recognize and use the OEs, others question its scientific validity and the practical implications derived from the concept, due to a lack of empirical evidence (Rost et al., 2014; Vuyk et al., 2016).
A Comparison of SPS and the Overexcitabilities.
In another study, Gere and colleagues (2009) found that gifted children were significantly more sensitive to incoming stimuli (e.g., auditory or tactile processing) and had stronger emotional behavioral responses to their environment than children of average intelligence. However, this finding was based on a parent-report questionnaire. Moreover, sensitivity focused on the features ease of overstimulation, awareness of environmental subtleties, and emotional reactivity, but did not include the other features of SPS. A problem in the study by Gere et al. (2009), and many other studies, is that the gifted group was not entirely representative because the gifted children had all been administered an intelligence test in the past. Often an IQ test is only administered when a child has behavioral or emotional problems (e.g., Lavrijsen & Verschueren, 2019). This raises the question of whether the gifted in general are more sensitive or only the gifted who had problems and who have been identified by an intelligence test.
SPS in Twice-Exceptional Children
In line with this, the group of twice-exceptional children must not be disregarded. Twice-exceptional children are those who exhibit gifted potential in one or more domains alongside one or more learning and/or behavioral disabilities (Foley-Nicpon & Kim, 2018). In particular, Autism Spectrum Disorder (ASD) and Attention-Deficit Hyperactivity Disorder (ADHD) may be associated with SPS given that both neurodevelopmental disorders are characterized by deviations in processing and responding to stimuli (Dellapiazza et al., 2021; for a review, see Kern et al., 2015). For example, children with ASD often have more attention to details and heightened sensitivity to sensory input, while children with ADHD frequently find themselves easily distracted by environmental stimuli (American Psychiatric Association, 2013). Studies showed a positive association between SPS and (symptoms of) ASD and ADHD (Liss et al., 2008; Panagiotidi et al., 2020). ASD and ADHD may be associated with Dabrowski’s OEs (Piechowski & Wells, 2021). Karpinski and colleagues (2018) suggested a potential connection between high intelligence, OEs, and disorders like ASD and ADHD. However, other researchers argued that disorders like ASD and ADHD are often misdiagnosed in (gifted) children with certain OEs (Amend, 2009; Rinn & Reynolds, 2012; Wells & Falk, 2021). Nerenberg (2021) posited in her book that differences in sensory processing in women often go unrecognized, masked, or conflated with neurodiversity conditions, such as ASD and ADHD. SPS may be more prevalent in twice-exceptional children, but it is also possible that gifted children with higher SPS are more susceptible to being misdiagnosed with ASD or ADHD. The main focus of this study is the relationship between SPS and giftedness. If this relationship is solely observable within the subgroup of twice-exceptional individuals, it implies that SPS might be associated with neurodevelopmental disorders such as ADHD and ASD, rather than giftedness.
Research Gap in the Context of Giftedness and SPS
In conclusion, large-scale empirical studies on the relationship between giftedness and SPS are rather scarce, and findings are mixed or not comparable because of different definitions or operationalizations. Most studies on sensitivity in gifted individuals focused specifically on the characteristics of overstimulation and sensitivity to subtleties, but these features do not reflect all aspects of SPS. Specifically, studies lacked the features of depth of cognitive processing of stimuli, emotional reactivity (both positively and negatively), and cognitive and affective empathy. Therefore, the present study specifically investigated the relationship between giftedness and, in particular, the cognitive and affective aspects of SPS.
The Present Study
In the present study, the relationship between giftedness and SPS and its features was studied. Insights into this relationship may contribute to a better understanding of gifted children and their needs. In our study, gifted children were defined as those with high scores on an intelligence test and therefore from here on they will be described as children with high cognitive abilities. The research question in this study was: “To what extent do children with high cognitive abilities differ from children with low, average, and above-average abilities with regard to the degree of SPS?” The present study focuses on the cognitive and affective aspects of SPS in children.
First, we hypothesized that children with high cognitive abilities would rate themselves as higher on depth of cognitive processing than the comparison groups without high cognitive abilities. We expected children with high cognitive abilities to think deeply about new problems because of their intellectual abilities (NAGC, 2009; Stephens & Karnes, 2000). Second, we hypothesized that children with high cognitive abilities would rate themselves higher on cognitive empathy (see also Schwenck et al., 2014) than the comparison groups without high cognitive abilities. Because of their intellectual abilities, they may be better able to store the meaning of previously encountered emotions and apply this information in new situations. Finally, we hypothesized that children with high cognitive abilities would not be higher in emotional reactivity and affective empathy than the comparison groups without high cognitive abilities because these features are less strongly related to children’s intelligence (Schwenck et al., 2014).
Method
The present study used partly the same data as the study in which the Children’s Sensitivity to the School Environment Questionnaire (ChiSSEQ) was introduced and evaluated (Samsen-Bronsveld et al., 2024). All children of the present study also participated in that study.
Participants
In total, 1,359 children were eligible for participation in the study because they had active parental consent. A group of children was excluded from the dataset because (a) they did not complete at least one of the measures because they were absent during the data collection or their school only participated in one part of the study (n = 428), (b) they completed fewer than four subtests of the cognitive ability test (n = 10), or (c) they were outside the age range of 9 years and 3 months to 12 years and 6 months (n = 75).
The final sample for this study consisted of 882 children from grades 4, 5, and 6 from 15 primary schools in the Netherlands (48.8% girls, 50.9% boys, and 0.1% not reported; Mage = 10.79, SD = 0.86). Following the vision of Gagné (2005), we applied a cut-off of the top 10% of performance on the cognitive ability test to distinguish between children with high cognitive abilities and those in the comparison group. To mitigate potential biases arising from the inclusion of both relatively high-performing and low-performing children in one comparison group, we subdivided the comparison group.
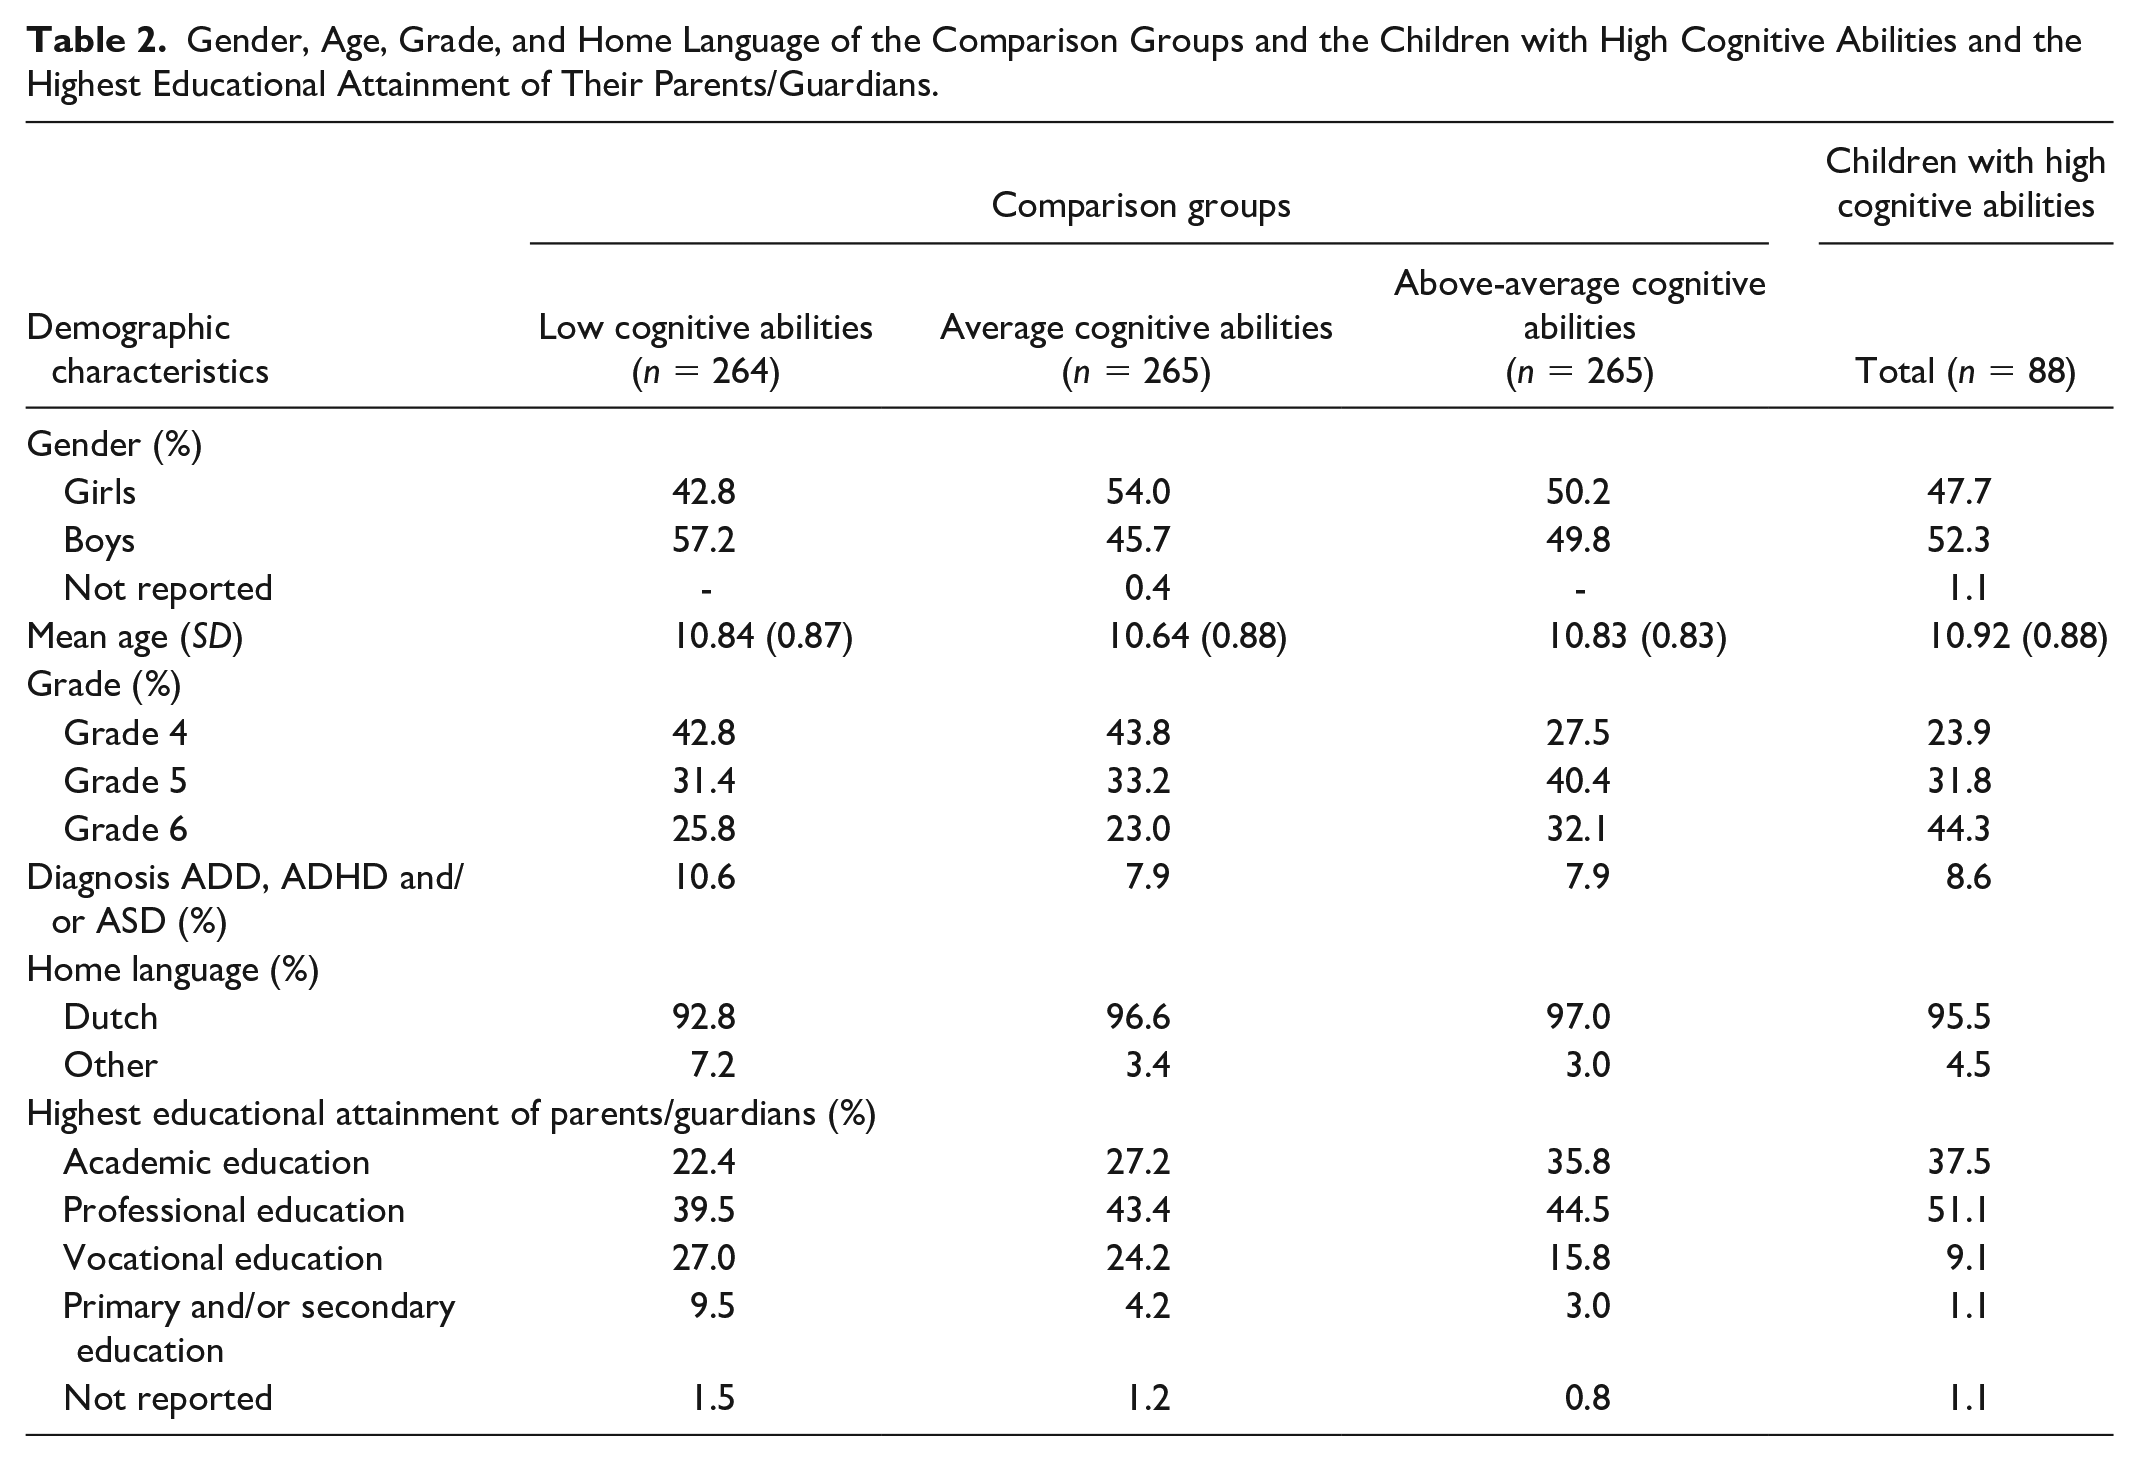
Table 2 presents the descriptive statistics of all groups. The cognitive ability scores were controlled for age by taking age-residualized scores (see Analyses). The percentage of boys and girls and the average age were similar in all groups. Compared with the other children, the children with high cognitive abilities were relatively often in the higher grades. This is probably because the children with high cognitive abilities were accelerated more often and the accelerated children in lower grades were younger than the age criterion of 9 years and 3 months. Each group included children diagnosed with ADD, ADHD, and/or ASD. However, the group of twice-exceptional children was too small (n = 7) to include them as a separate group.
Gender, Age, Grade, and Home Language of the Comparison Groups and the Children with High Cognitive Abilities and the Highest Educational Attainment of Their Parents/Guardians.
Instruments
Measuring Cognitive Ability
The COVAT-3 was used to measure cognitive ability (Magez et al., in preparation). The COVAT-3 is a digital cognitive ability test that measures several broad cognitive abilities of the CHC-model. This test was developed in Belgium and is based on the CoVaT-CHC, a valid (Magez & Bos, 2016; Tierens, 2017) and reliable test (Decaluwé et al., 2017; Tierens & Magez, 2016) to measure individual differences in cognitive ability. The CoVaT-CHC received the quality label A+ from the Belgian Test Committee (Belgian Federation of Psychologists, 2022). The language of the COVAT-3 is Dutch as it is spoken in Flanders; interpretation and use of some words may vary slightly from the Netherlands (comparable to the distinction between British and American English). We used the COVAT-3 as part of standardization research in the Netherlands. Two partly different test batteries of the COVAT-3 were used to measure the cognitive ability domains, see Table 3. The subtests of the COVAT-3 were administered in class by trained junior researchers and graduate students of pedagogical sciences. For each subtest, children received instructional videos. After these videos, children completed practice items to check their understanding of the subtest. If a child made two or more mistakes, the child was notified, and the test leader gave additional explanations.
Two Test Batteries of the COVAT-3 as Used for the Present Study.
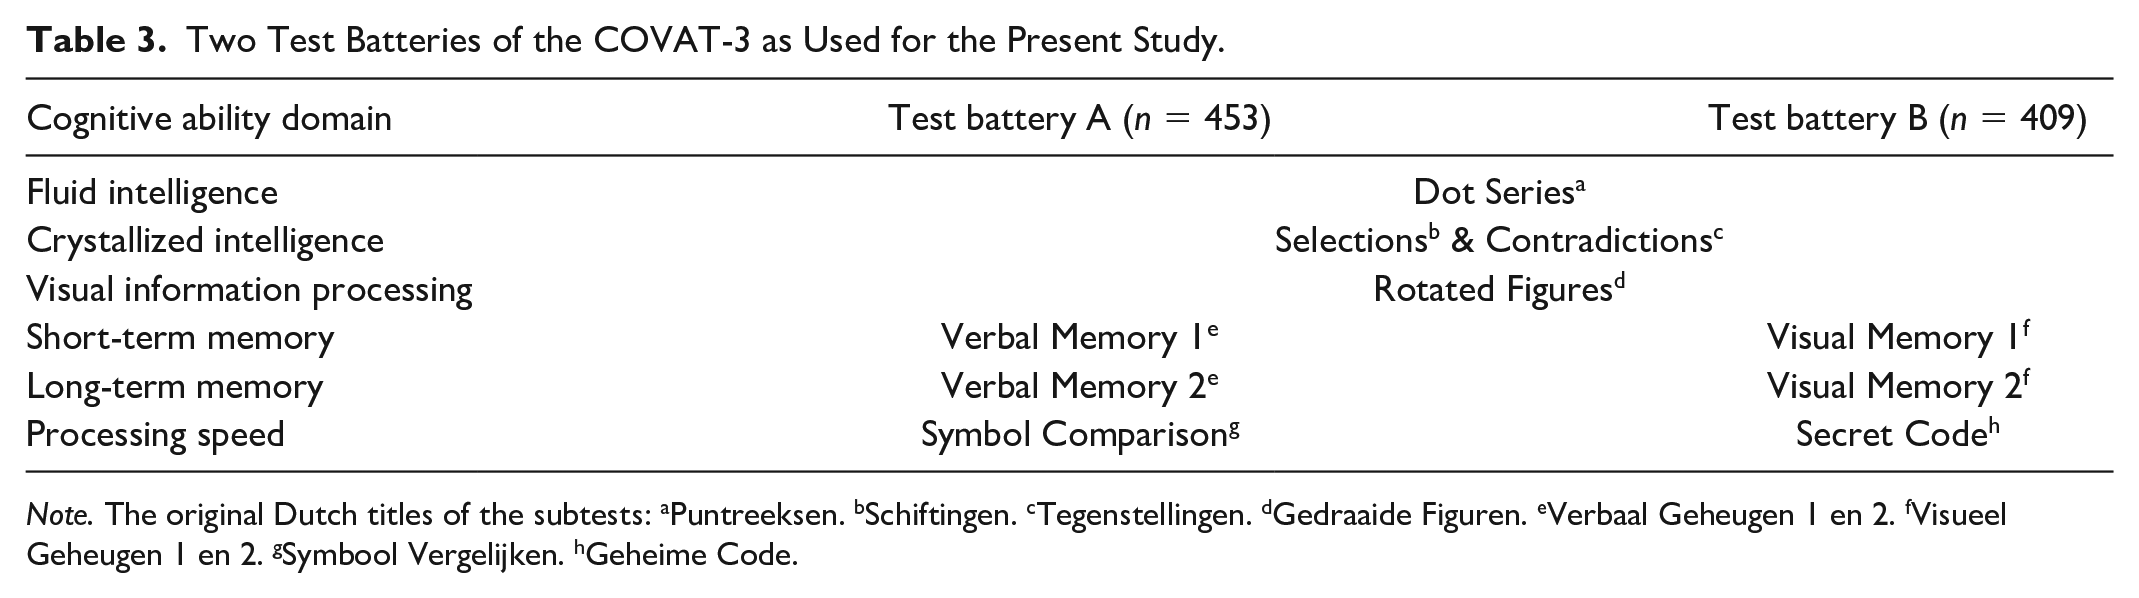
Note. The original Dutch titles of the subtests: aPuntreeksen. bSchiftingen. cTegenstellingen. dGedraaide Figuren. eVerbaal Geheugen 1 en 2. fVisueel Geheugen 1 en 2. gSymbool Vergelijken. hGeheime Code.
Measuring SPS
The Dutch version of the 12-item Highly Sensitive Child scale (HSC scale; Pluess et al., 2018; Weyn, Van Leeuwen, Pluess, Lionetti, Goossens, et al., 2021) and the Children’s Sensitivity to the School Environment Questionnaire (ChiSSEQ; Samsen-Bronsveld et al., 2024) were used to measure SPS in children. A Likert-type scale ranging from 1 (strongly disagree) to 5 (strongly agree) was used for both questionnaires.
According to previous studies, the HSC scale has a bifactor structure, consisting of a general sensitivity factor and three subfactors: Ease of Excitation (EOE), Low Sensory Threshold (LST), and Aesthetic Sensitivity (AES; Pluess et al., 2018; Weyn, Van Leeuwen, Pluess, Lionetti, Greven, et al., 2021). Examples of items on the HSC scale are: “I find it unpleasant to have a lot going on at once” (EOE), “Loud noises make me feel uncomfortable” (LST), and “I love nice smells” (AES). In our sample, the internal consistency of EOE was questionable (ω = .68 and α = .67) and the internal consistencies of LST and AES were poor (resp. ω = .56 and α = .54; ω = .54 and α = .53). As the internal consistency of the Total HSC scale was acceptable (ω = .72 and α = .72), only the Total HSC scale was used for the analyses.
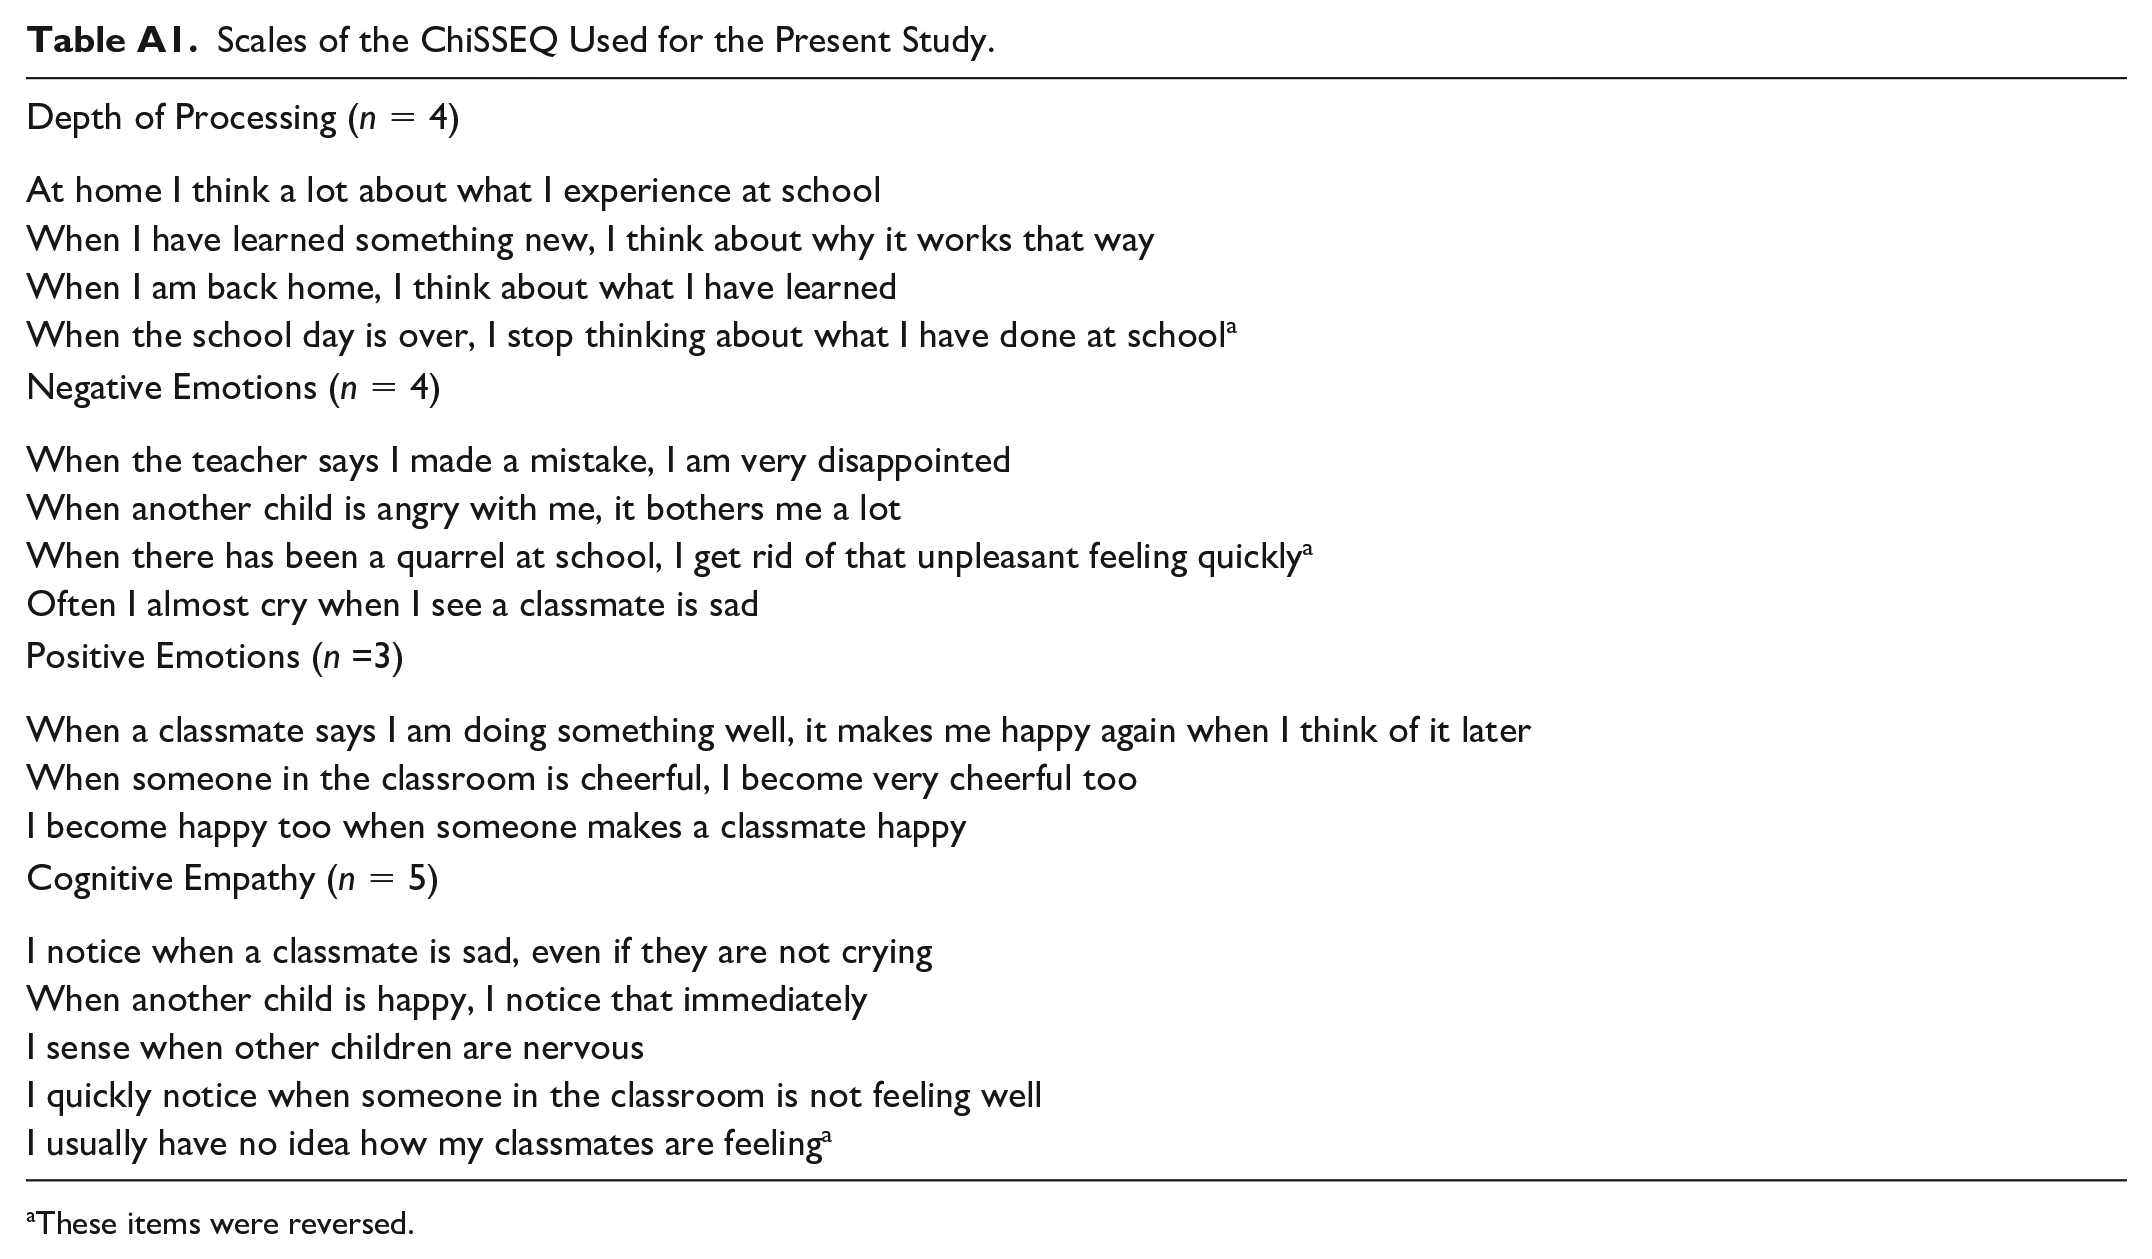
The ChiSSEQ was developed by Samsen-Bronsveld et al. (2024) because the proposed features, depth of processing, emotional reactivity, and empathy, were not fully captured in other self-reports to measure SPS in children. The ChiSSEQ is a 23-item multidimensional questionnaire on SPS in the school environment. Only four factors were used: Depth of Processing (After an Event; n = 4), Negative Emotions (n = 4), Positive Emotions (n = 3), and Cognitive Empathy (n = 5; see Table A1 in the Appendix). The internal consistency was acceptable for Depth of Processing (ω = .71 and α = .71), Positive Emotions (ω = .74 and α = .73), and Cognitive Empathy (ω = .75 and α = .75), but poor for Negative Emotions (ω = .57 and α = .56). This last factor was therefore not included in the analyses. The overall internal consistency of the scales used was good (ω = .81 and α = .81). Examples of items on the ChiSSEQ are: “When I am back home, I think about what I have learned” (Depth of Processing), “When someone in the classroom is cheerful, I become very cheerful too” (Positive Emotions), and “I notice when a classmate is sad, even if they are not crying” (Cognitive Empathy).
Procedure
The ethics committee of Fontys University granted ethical approval for the present study. Grades 4, 5, and 6 from 20 primary schools in the Netherlands were invited for this study. These schools were involved in POINT013 and POINT040, an educational research cooperation where teachers, teacher-educators, and scientists collaborate aimed at fostering giftedness and talent development. The POINT-schools are primary schools, offering inclusive education to both gifted and other children in regular classrooms. Some of these schools have (part-time) pull-out programs for gifted children. An information letter and consent form were sent to the parents and/or caregivers. Only children whose parents had given consent participated in the study. In a period of three months (from March to May 2021), the researchers visited the schools twice for data collection: the first time to conduct the COVAT-3 and the second time to administer the online questionnaires. Per class, respectively, 90 and 30 minutes were reserved for data collection. The children completed the test and questionnaires in their class under the supervision of a junior researcher and/or graduate student of pedagogical sciences.
Analyses
IBM SPSS Statistics version 28 was used to analyze the data (IBM Corp, 2021). Mean scores of the Total HSC scale and ChiSSEQ subscales were calculated. Since there are no norm scores of the COVAT-3 available for the Dutch population yet, sum scores were computed for each subtest. As the participating children were of different ages, these sum scores were corrected for age by taking age-residualized scores. These scores were created by regressing the subtest scores on age and using the residuals, the difference between the obtained and the age-predicted scores, as an age-adjusted score. The age-residualized scores were standardized. Subsequently, an average z-score of these scores was computed for the children who had completed at least four subtests. This total cognitive ability score was used to determine the cut-off: the 10% highest scoring children were defined as children with high cognitive abilities. The comparison group (90%) was divided into three groups: the lowest-performing children (0-30%), the average-performing children (31-60%), and the above-average-performing children (61-90%). We repeated the analyses with a 5% and 3% cut-off. The comparison group (resp. 95% and 97%) was then equally divided into three groups.
Four analyses of covariance (ANCOVAs) with simple contrast were conducted to test for differences in SPS between (a) children with high cognitive abilities and (b) children with respective low, average, and above-average cognitive abilities. Group was the independent variable (high cognitive abilities vs. the other three groups), SPS was the dependent variable (Total HSC scale and ChiSSEQ subscales Depth of Processing, Positive Emotions, and Cognitive Empathy), and age was added as a covariate. In the ANCOVAs, no distinction was made between children who completed Test battery A and those who completed Test battery B, as the subtests within both Test batteries A and B correlated similarly with the other three subtests. There was one exception: the processing speed of Test battery A did not correlate with the visual information processing subtest, while the processing speed subtest of test battery B positively correlated with this subtest.
Assumptions were checked: (a) Histograms and q-q plots showed that the dependent variables were normally distributed. (b) Levene’s test showed that the homogeneity of variance assumption was met. The variances did not differ significantly for the Total HSC scale, F(3, 874) = 0.11, p = .95, the Depth of Processing subscale, F(3, 874) = 0.83, p = .48, the Emotions Positive subscale, F(3, 874) = 1.66, p = .17, and Cognitive Empathy subscale, F(3, 874) = 0.30, p = .83. 3) Furthermore, the homogeneity of the regression slope assumption was also satisfied because there was no significant interaction between the covariate (age) and dependent variable (group): F = 0.64, p = .69 (Total HSC scale); F = 1.01, p = .39 (Depth of Processing); F = 0.78, p = .50 (Positive Emotions); F = 1.30, p = .27 (Cognitive Empathy). Three outliers were found, but full results are reported because analyses without these outliers did not lead to differences in the significance of the results. As multiple ANCOVAs were conducted, we applied a Bonferroni correction and used an alpha cut-off value of .0125 to control for Type I errors.
Results
Descriptive Statistics of the Cognitive Ability Domains and SPS
Table 4 presents the means (M) and standard deviations (SD) of children’s sum scores on the cognitive ability domains and their mean scores on the Total HSC scale and the ChiSSEQ subscales. The results are presented for each group and the total sample.
M and SD of the Cognitive Ability Domains, Total Cognitive Ability, Total HSC Scale, and the ChiSSEQ Subscales: Depth of Processing, Positive Emotions, and Cognitive Empathy.
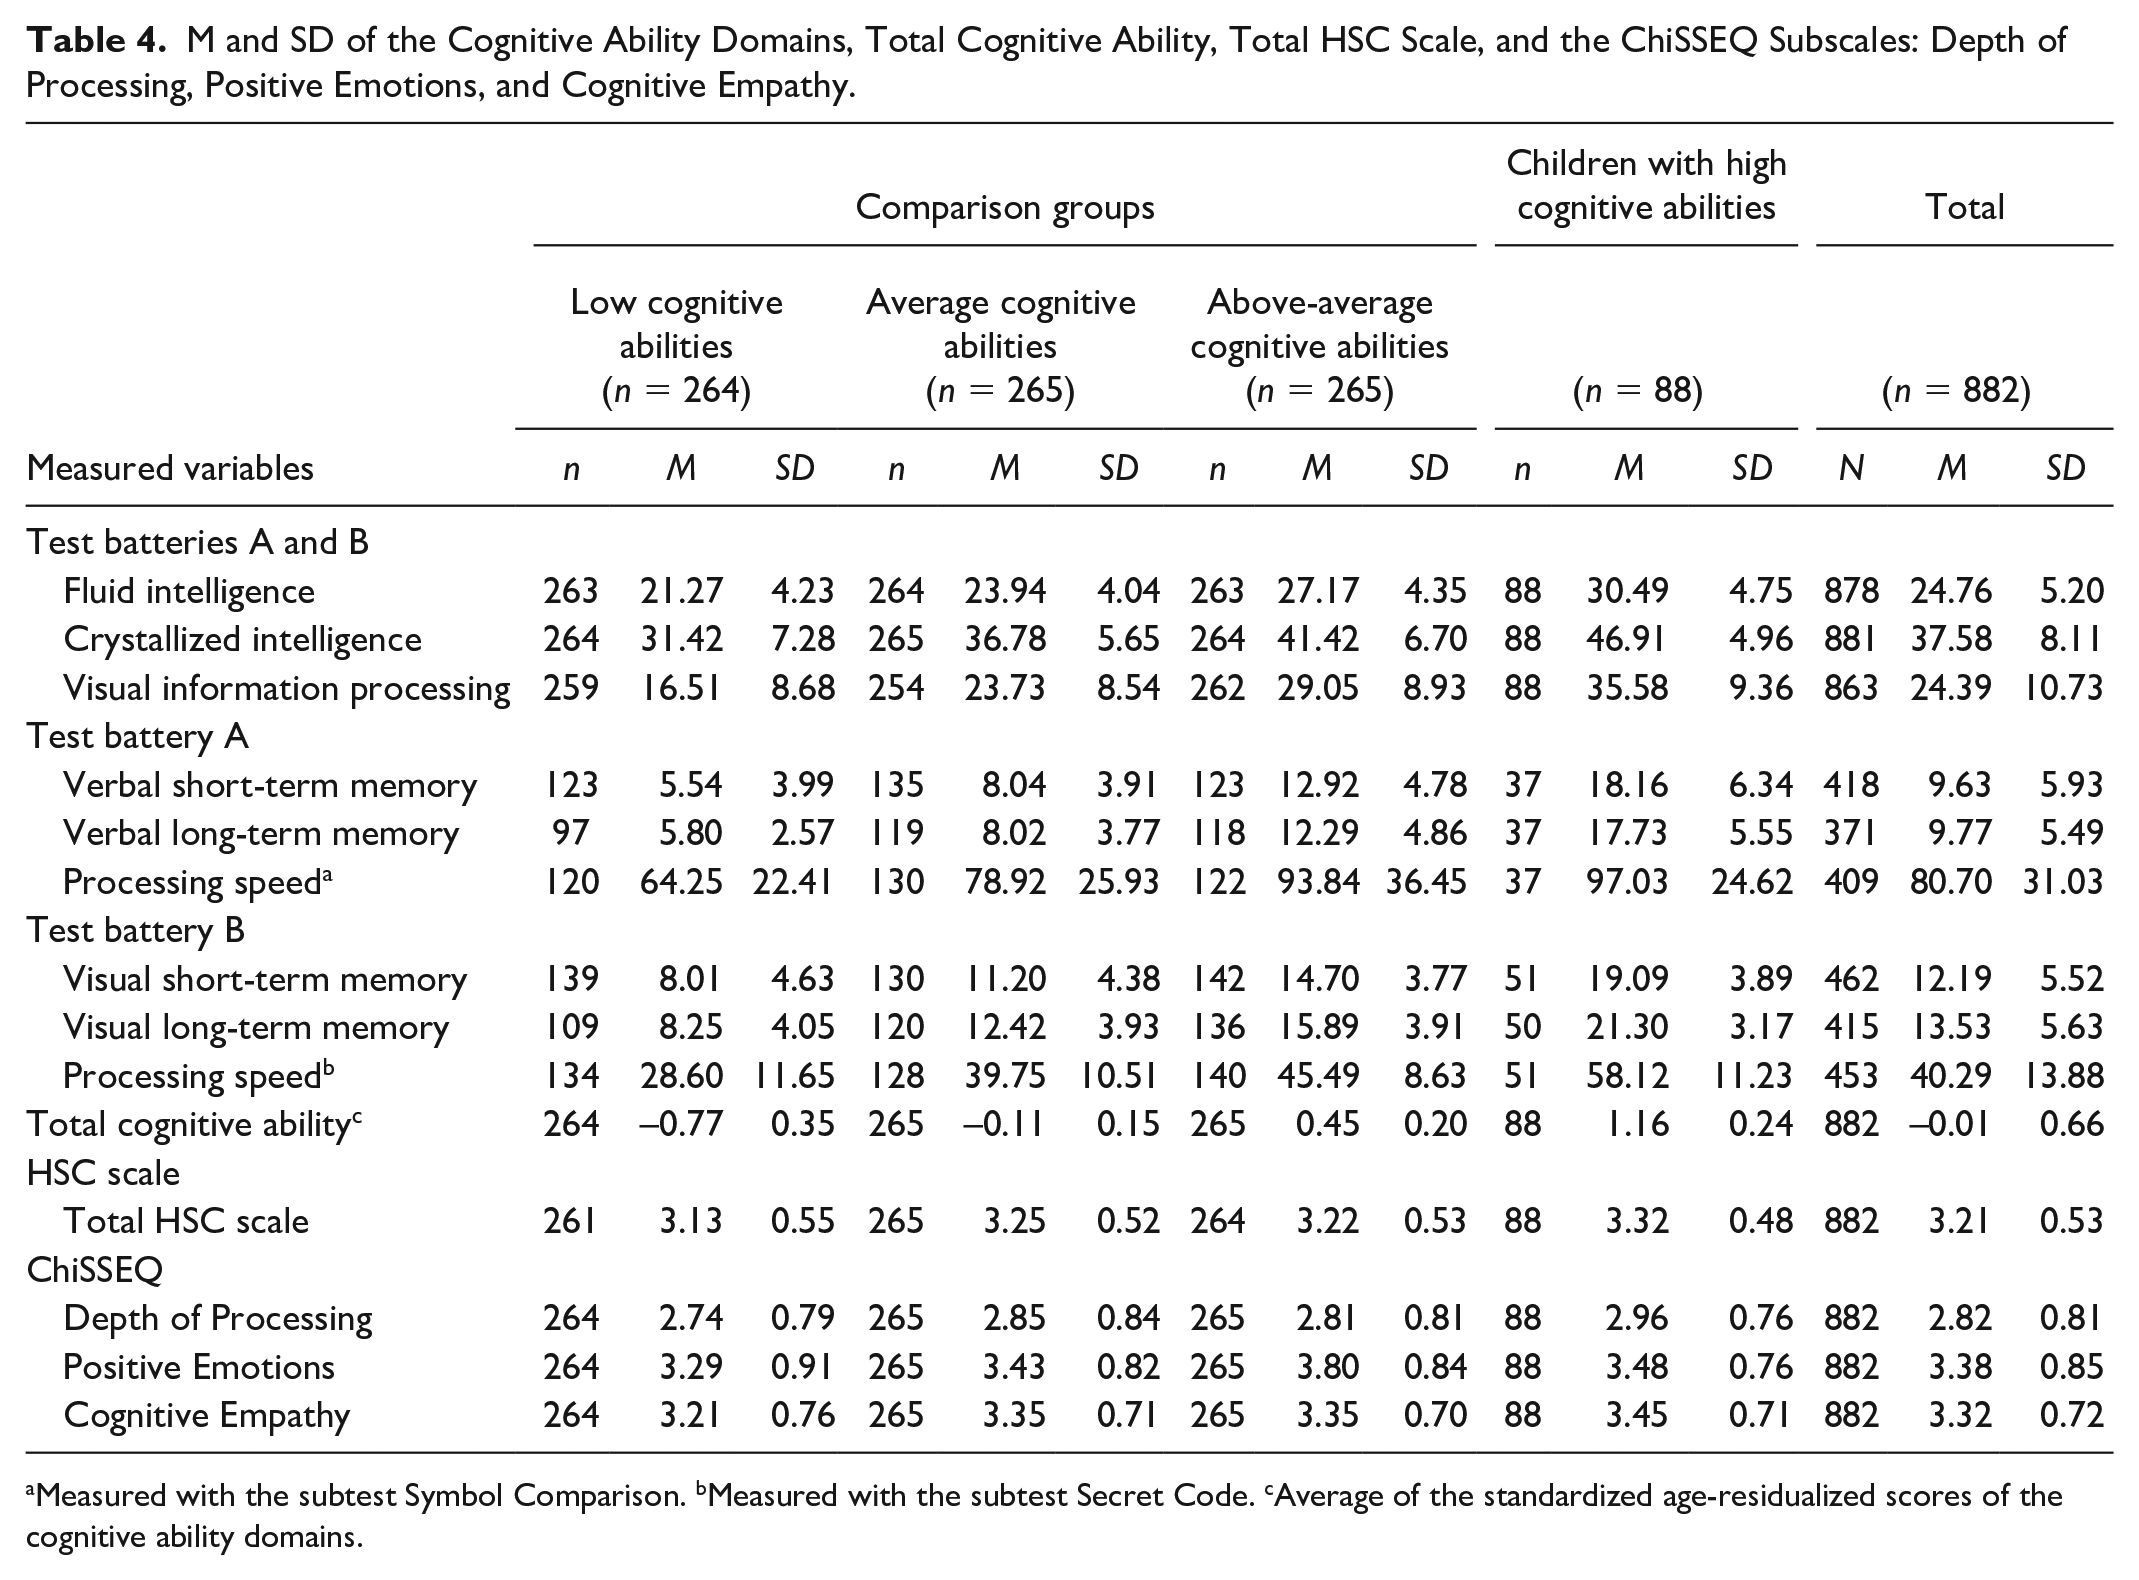
Measured with the subtest Symbol Comparison. bMeasured with the subtest Secret Code. cAverage of the standardized age-residualized scores of the cognitive ability domains.
Correlations Between the Cognitive Ability Domains and SPS
Table 5 presents the correlations between the several cognitive ability domains, the total cognitive ability and the Total HSC scale, Depth of Processing, Positive Emotions, and Cognitive Empathy. The processing speed of Test battery A was not significantly related to crystallized intelligence and verbal long-term memory. All other cognitive domains were positively and significantly related to each other. Note that the children each completed only one of the two subtest batteries (A or B). Relations between Test battery A and Test battery B are therefore not available. The total cognitive ability scale was positively significantly correlated to all cognitive domains. All variables intended to measure SPS or features of SPS were positively significantly interrelated with correlations of medium to strong size. Relations with the COVAT-3 sub-scores, however, were mostly nonsignificant. A few relations were significant, most notably with the total ability scale, visual short-term memory, and processing speed of Test battery B. However, these significant relations were only weak in size.
Correlation Matrix of Children’s Scores on the Cognitive Ability Domains, Total Cognitive Ability and the Total HSC Scale, Depth of Processing, Positive Emotions, and Cognitive Empathy.
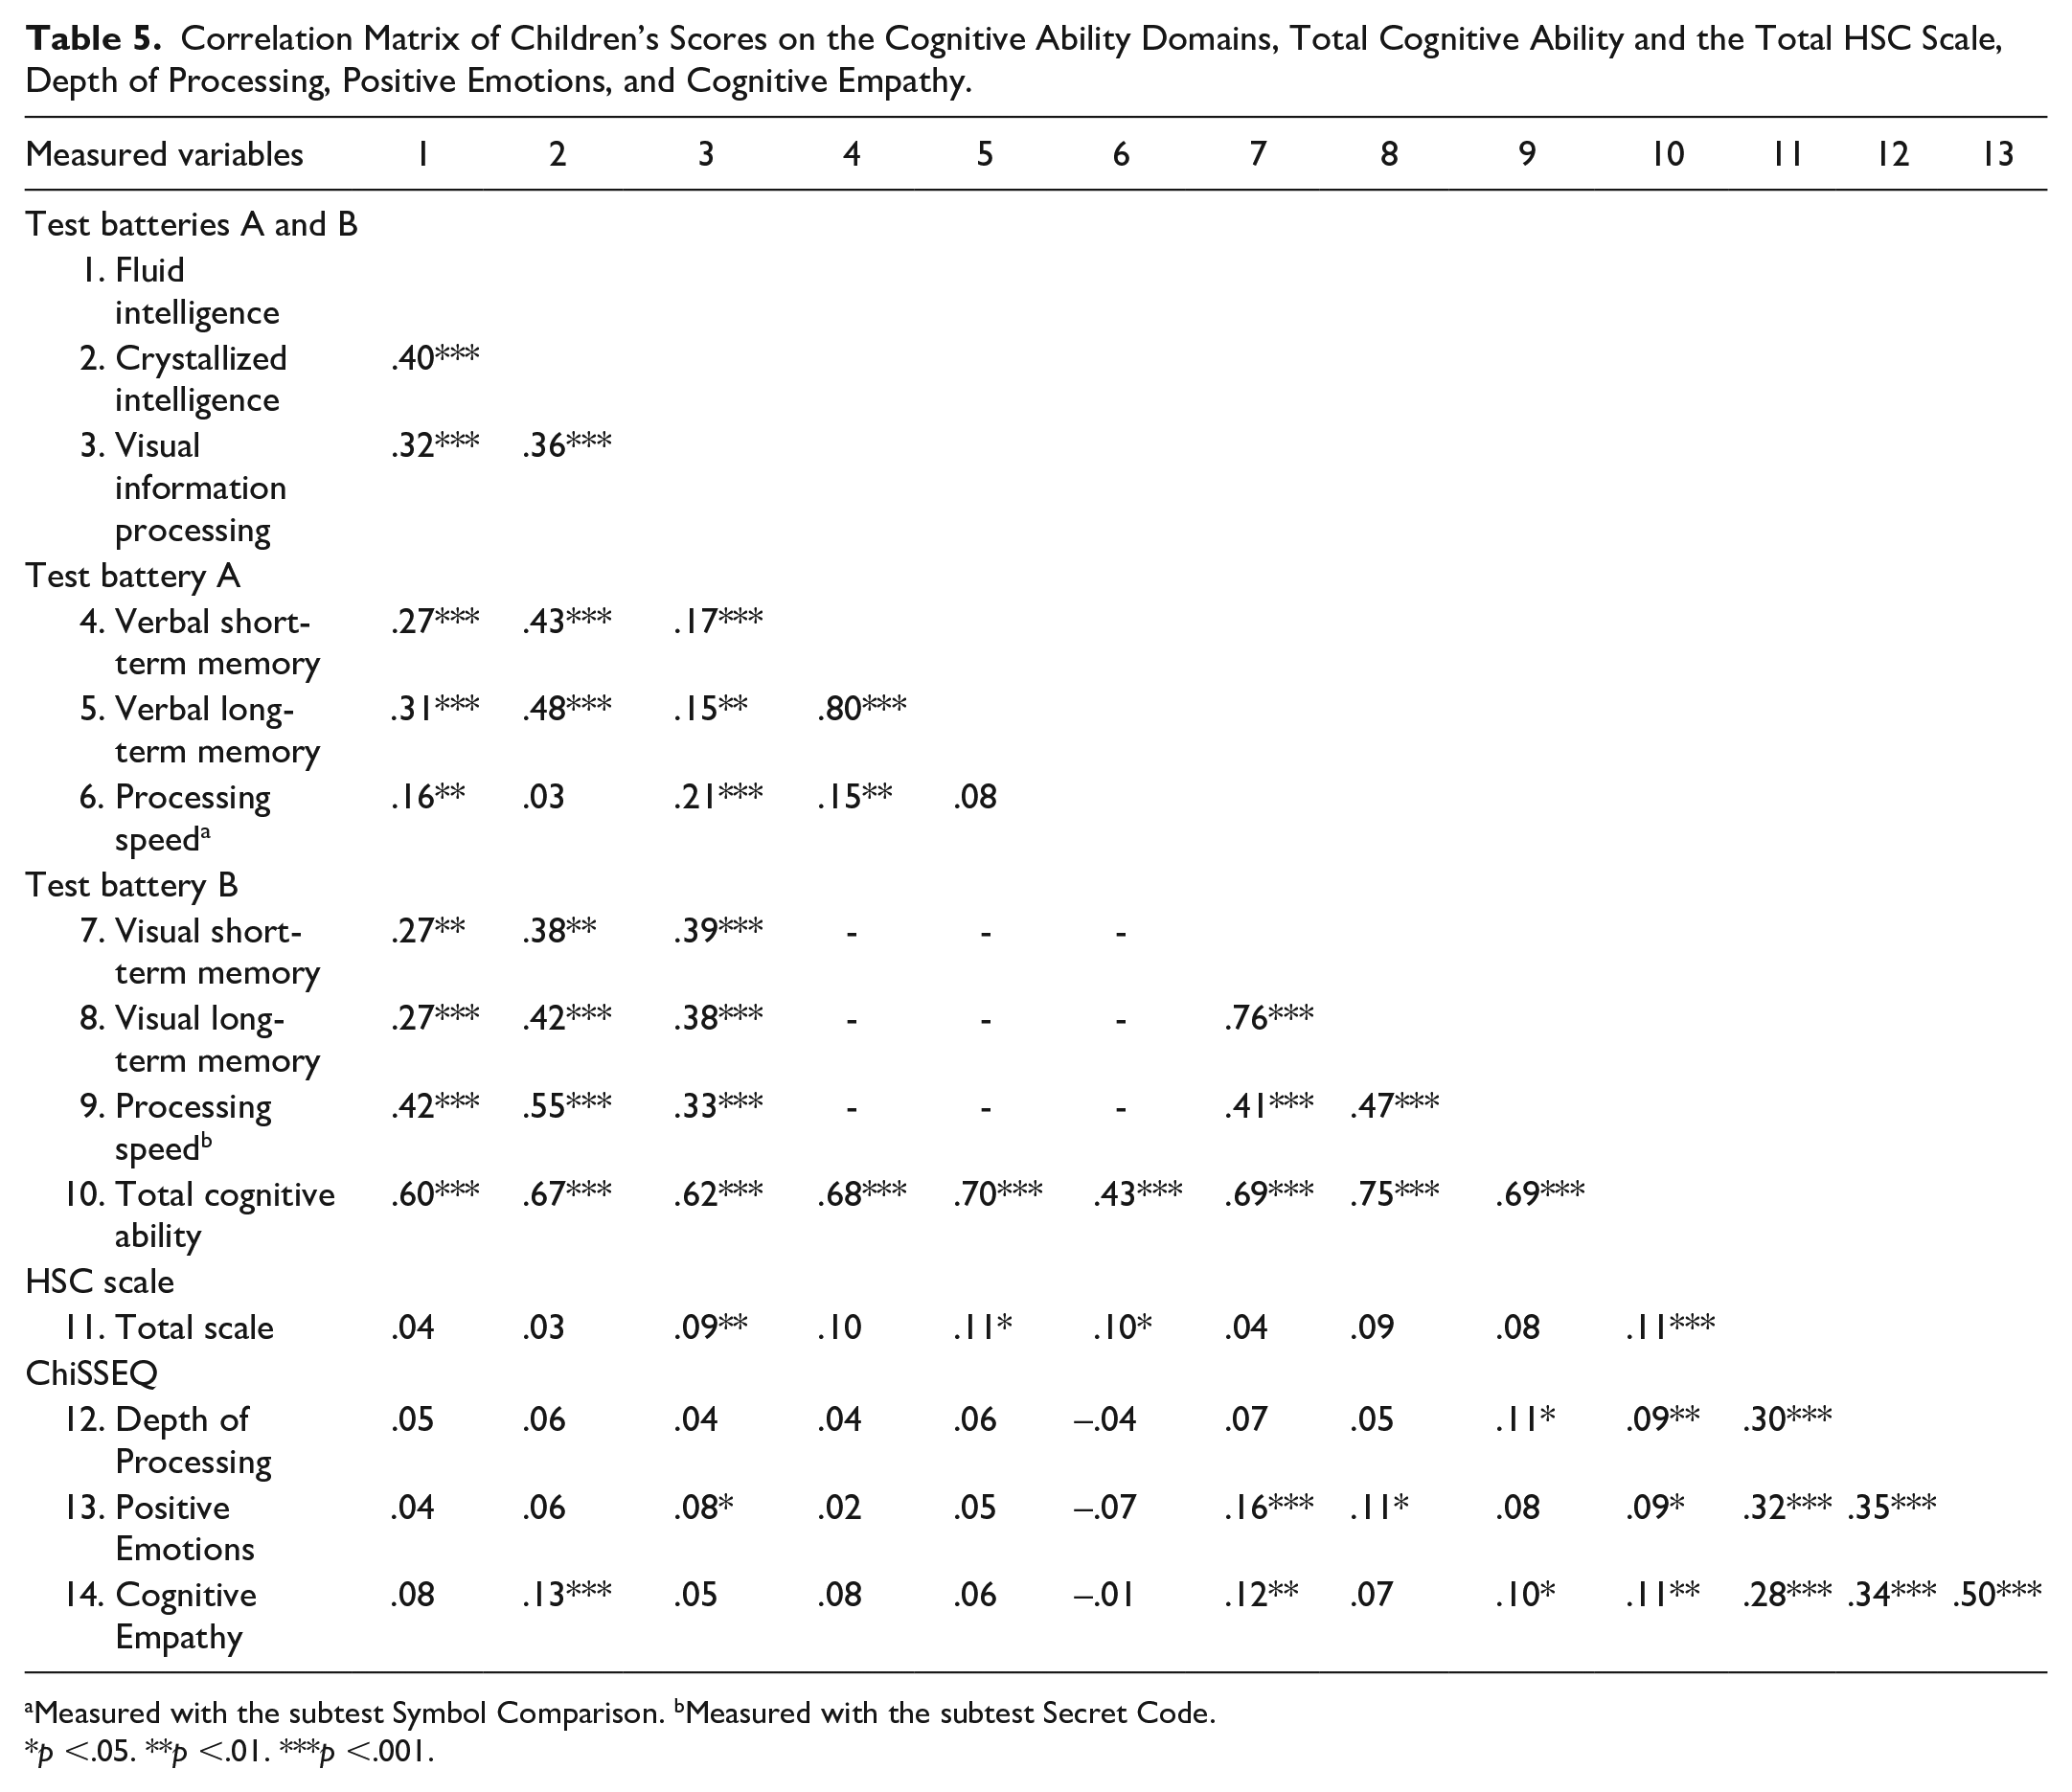
Measured with the subtest Symbol Comparison. bMeasured with the subtest Secret Code.
p <.05. **p <.01. ***p <.001.
Difference Between Children With High Cognitive Abilities and the Comparison Groups in Their Degree of SPS
Finally, the research question of this study was addressed by conducting four ANCOVAs, see Table 6. The results showed that children with high cognitive abilities scored significantly higher than the children with low cognitive abilities on the Total HSC scale (small effect), but they did not differ from the children with average and above-average cognitive abilities. Furthermore, children with high cognitive abilities did not differ significantly from the other three groups on the subscales of the ChiSSEQ.
ANCOVAs: Differences Between 1) Children With High Cognitive Abilities (n = 88) and 2) Children With Low (n = 264), Average (n = 265), and Above-Average Cognitive Abilities (n = 265) in Their Degree of SPS.
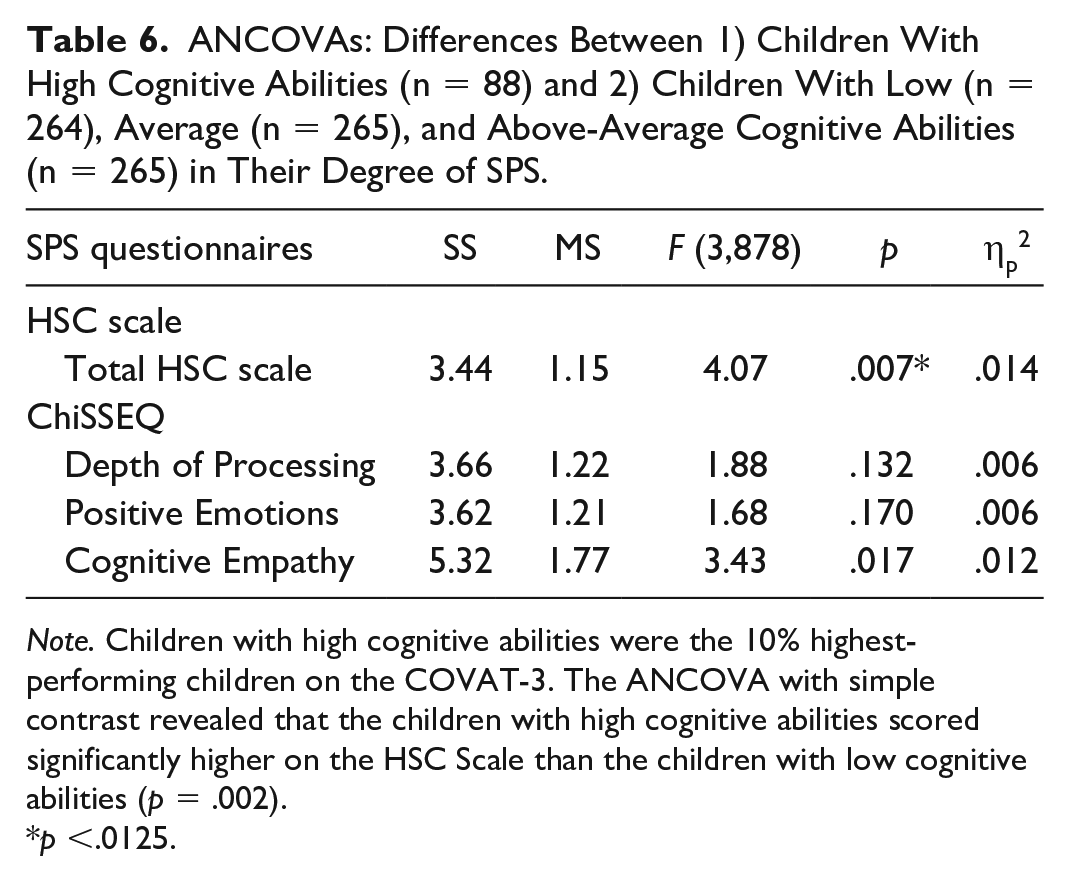
Note. Children with high cognitive abilities were the 10% highest-performing children on the COVAT-3. The ANCOVA with simple contrast revealed that the children with high cognitive abilities scored significantly higher on the HSC Scale than the children with low cognitive abilities (p = .002).
p <.0125.
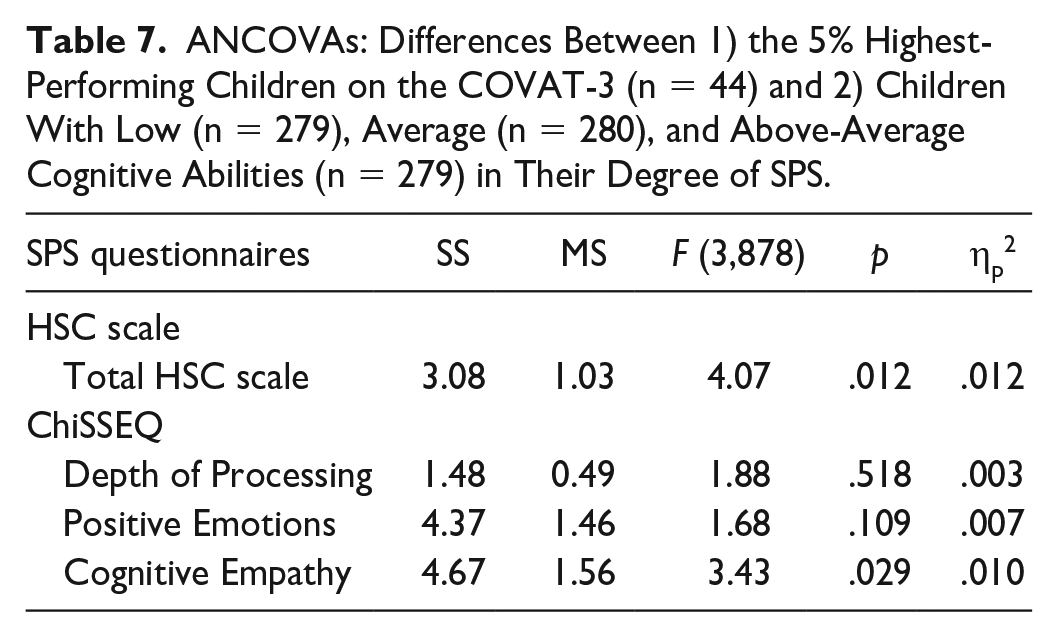
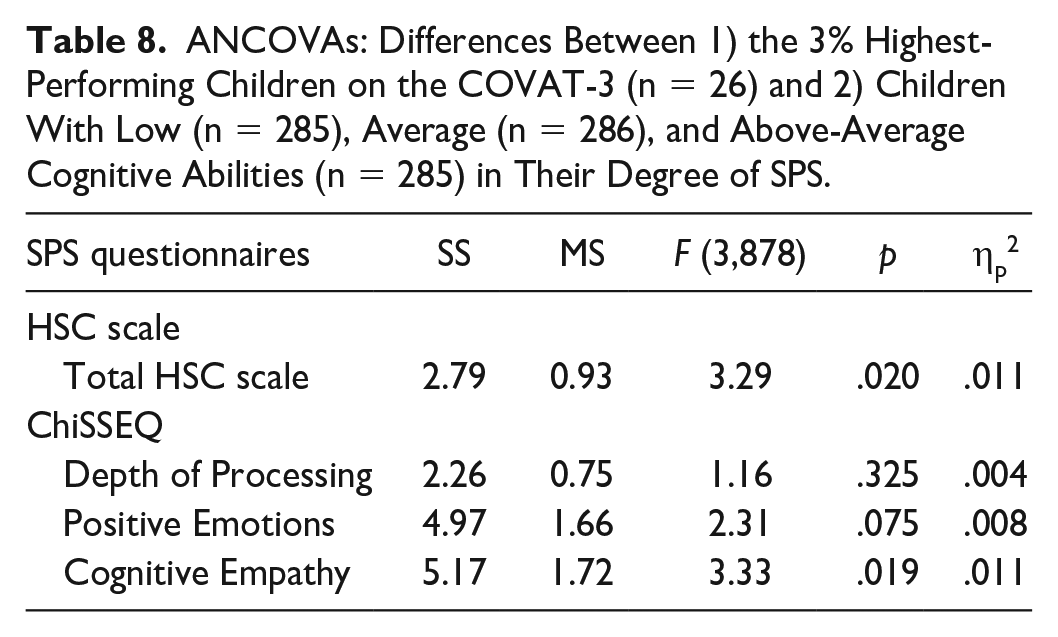
When a stricter cut-off of 5% or 3% was used, no significant differences were found between the highest-performing children and the other groups, see Tables 7 and 8.
ANCOVAs: Differences Between 1) the 5% Highest-Performing Children on the COVAT-3 (n = 44) and 2) Children With Low (n = 279), Average (n = 280), and Above-Average Cognitive Abilities (n = 279) in Their Degree of SPS.
ANCOVAs: Differences Between 1) the 3% Highest-Performing Children on the COVAT-3 (n = 26) and 2) Children With Low (n = 285), Average (n = 286), and Above-Average Cognitive Abilities (n = 285) in Their Degree of SPS.
Discussion
The present study aimed to investigate whether gifted children, defined as children with high cognitive abilities, are higher in SPS than their peers. We hypothesized that children with high cognitive abilities would score higher on deeper cognitive processing of stimuli and cognitive empathy than their peers and similar on emotional reactivity and affective empathy. This hypothesis has been partly confirmed in the present study.
SPS in Children With High-Cognitive Abilities and the Comparison Groups
The results revealed that children with high cognitive abilities on the COVAT-3 did not differ from the children with low, average, and above-average cognitive abilities regarding the degree of SPS, except for the Total HSC scale. On the Total HSC scale children with high cognitive abilities scored higher than those with low cognitive abilities. However, the effect size was very small, and this significant difference disappeared when employing more stringent cut-offs of 5% or 3%. Moreover, no difference was found between the highest performers and the average and above-average performers. These findings were partly contrary to our expectations because we expected children with high cognitive abilities to score higher on two subscales of the ChiSSEQ: depth of processing and cognitive empathy. Our findings raise the question of why heightened sensitivity is often mentioned as a characteristic of giftedness (Edmunds & Edmunds, 2005; Heylighen, 2012; Lo, 2018; Mendaglio, 2003), despite the rather limited empirical evidence for it (e.g., De Gucht et al., 2023). The link comes primarily from observational and anecdotal evidence in which gifted individuals are described as more sensitive and from empirical studies of OEs in gifted individuals (e.g., Mendaglio, 2022; Wood & Laycraft, 2020). This may be the bias for the proclaimed assumption about giftedness and SPS.
The first explanation for the difference between the proclaimed relation between giftedness and SPS and our findings is related to how gifted children are identified. Gifted children may be more likely to be identified as gifted when they score higher in SPS, precisely because of their emotional reactivity (Aron et al., 2012; Greven et al., 2019; Homberg et al., 2016). When gifted children are not appropriately guided, this might lead to underachievement and social or emotional problems (Landis & Reschly, 2013; Ritchotte et al., 2014). In a gifted child higher in SPS, their emotional reactivity may exacerbate these problems, warranting referral for IQ testing. This is in line with the findings of Lavrijsen and Verschueren (2019) who found that secondary school students who were considered gifted as measured by the CoVaT-CHC did not report more problem behavior than other students, but those students who had been identified as gifted with an IQ test in the past did report more problem behavior. In other words, those who are officially labeled as gifted are not necessarily representative of the gifted in general. The stronger reactions to environmental influences may lead to (earlier) identification and testing of gifted children higher in SPS because they stand out more. In the present study, the sample was probably more representative, because the group of gifted children was not selected based on a previous IQ test, but all (gifted) children completed a cognitive ability test.
The second explanation is related to the educational system. As described earlier, teacher nominations are often used to identify and enroll gifted children in special enrichment programs or pull-out classes (Rothenbusch et al., 2016; Sękowski & Łubianka, 2015), but their identifications may be biased by misconceptions about giftedness (e.g., Golle et al., 2023; Lavrijsen & Verschueren, 2020; Weyns et al., 2021). Possibly, gifted children who are also higher in SPS do benefit more from pull-out programs and teachers’ special support because of their emotional reactivity. Pull-out classes often have smaller class sizes, making it easier for teachers to meet these children’s individual needs. It might be that gifted children higher in SPS thrive even more in this environment than gifted children lower in SPS. This may wrongly confirm teachers’ beliefs about SPS and giftedness.
The final explanation for the lack of difference between the gifted and control groups might be that because of their exceptional abilities, gifted children are more often misidentified as higher in SPS than their typically developing peers. Gifted children are also often misdiagnosed as having emotional and behavioral disorders (Mullet & Rinn, 2015; Webb et al., 2016). Because gifted children may interpret their environment differently because of their high abilities, they may react in ways that deviate from the norm (Rinn et al., 2018). For example, a gifted child may react with frustration or withdrawal if a classmate does not understand their request. This seemingly deviant behavior caused by giftedness may be misidentified as higher in SPS.
Finally, we may have missed recognizing SPS as a true characteristic of giftedness in our study. Gifted children were defined as children with high cognitive abilities, but giftedness is more than that (e.g., Renzulli & Reis, 2018; Sternberg & Kaufman, 2018; Worrell et al., 2019). The other groups may have included gifted children who were not identified as gifted because they underachieved on the COVAT-3. These possible false negatives may have biased the results. In addition, a cut-off score of 10% was used, which may have been too lenient. It may be that SPS is a specific characteristic of highly profoundly gifted children with an IQ of at least 145 (see Wood & Laycraft, 2020), but our sample was too small to analyze the data for this <1% subgroup. However, additional analyses showed that applying a stricter cut-off of 5% or even 3% (see Marland, 1972; Renzulli, 1982) did not yield significant differences between the group of children with high cognitive abilities and the other groups. It is worth noting, however, that despite the lack of statistical significance, the children with high cognitive abilities showed a tendency toward higher scores on all measures of SPS compared with the other groups.
Limitations and Suggestions for Future Research
The present study faces a few limitations. A first limitation might be that the COVAT-3 was used. This test is in development and the reliability and validity of this test are still unknown, so caution should be exercised when interpreting the results. No Dutch norm scores were available yet for the COVAT-3, so raw scores had to be used instead. In addition, it is unknown to what extent the scores on the COVAT-3 are comparable to the scores on other commonly used intelligence tests, such as the WISC-V (Wechsler, 2014). Furthermore, categorizing children into cognitive ability groups, based on the COVAT-3, may not fully account for the complexities of underachievement, as some children across all cognitive levels might not have performed at their optimal potential, often due to factors such as learning disabilities or environmental influences. Another limitation is that the COVAT-3 was administered within the classroom. Specific, individual observation data about children taking the test were therefore not available. Several factors may have negatively influenced the data collection, such as attention difficulties in a possibly noisy classroom, fatigue, or lack of motivation. This may have biased the results, possibly especially for the children higher in SPS, as they are more sensitive to internal and external stimuli (Aron et al., 2012; Greven et al., 2019; Homberg et al., 2016). A suggestion for future research is to use individual test administrations.
Furthermore, in the present study, giftedness was defined as cognitive ability. Follow-up research on giftedness and SPS may also involve other aspects of giftedness, such as creativity and motivation, and measure giftedness more broadly, for example, by school achievements, and parental and/or teacher nominations. In follow-up research, a distinction can be made between different groups of gifted children: highly gifted, exceptionally gifted, and profoundly gifted children. In addition, SPS can be investigated in twice-exceptional children, gifted children without a disorder, and typically developing children with and without a disorder such as ASD. Future research should investigate misdiagnoses in (sensitive) gifted children because accurate identification is essential for appropriate support and optimal development. It is also valuable to include the Big Five personality traits and OEs in additional research, since there is a (strong) relationship between the personality trait Openness to Experience and giftedness, SPS, and the OEs (Gallagher, 2022; Hellwig & Roth, 2021; Limont et al., 2014; Peperkorn & Wegner, 2020).
A final limitation is that the HSC scale and the ChiSSEQ have been used to measure SPS. Both questionnaires do not fully capture the complexity of sensitivity in the central nervous system. One reason for this is that both questionnaires are self-reports, which can bias the results. It might be questionable whether children can accurately and reliably assess themselves on these traits. Young children find it difficult to think completely abstractly and reflectively (Maćkiewicz & Cieciuch, 2016; Piaget, 1952), which might distort their self-assessment of their empathic abilities, for example. However, very young children were not included in this study (the youngest were 9.3 years old) and the ChiSSEQ is a school-based questionnaire with examples from everyday life, which facilitates self-assessment for children. Furthermore, Bas et al. (2021) stated in their interview study with highly sensitive adults that SPS is a concept that can be investigated with self-reports because it concerns subjective experiences that the individuals themselves know best. It is plausible that the same could go for children. Furthermore, the HSC subscales and the ChiSSEQ Negative Emotions subscale had low internal consistencies. While we decided to only use the Total HSC scale and exclude the Negative Emotions subscale from the analyses, the low reliabilities of the subscales may have affected the quality of the data. In follow-up research, SPS can be measured more broadly, for example by combining quantitative and qualitative research. To gain more insights into the relationship between giftedness and SPS and especially what gifted and sensitive children, with or without disorder(s), need to develop optimally, future research could include interviews with gifted children and their parents (both lower and higher in SPS) and other children and their parents (both lower and higher in SPS). Further, it could be valuable to investigate whether a particular threshold of SPS exists beyond which (gifted) children encounter difficulties in coping. Using alternative analytical methods that allow for an examination of the prevalence of extreme SPS scores might offer insights into the potential clinical and therapeutic relevance of SPS in (gifted) children. Finally, it would be interesting to investigate the role of teacher misconceptions in the identification of gifted and/or sensitive children to improve identification practices for gifted children.
Conclusion
Children with high cognitive abilities attained significantly higher scores on the Total HSC scale compared to those with low cognitive abilities, but not higher than those with average or above-average cognitive abilities. However, caution is warranted as the effect size is small, and this disparity ceased to be significant when a stricter cut-off was applied to the high cognitive ability group. Furthermore, no significant differences emerged concerning depth of processing, positive emotions, and cognitive empathy. These findings highlight the need to reevaluate (possible) biases about giftedness and SPS. It is important to investigate why heightened sensitivity is often regarded as a characteristic of giftedness and what role misidentification and stereotype ideas play in this association. However, this study is just one part of the broader framework of studies aimed at understanding SPS in gifted children. Further research is needed to comprehensively grasp the multifaceted nature of sensitivity in (gifted) children within the school environment. Although teachers have many different children in their classroom, it is important for every child, gifted or not, and higher in SPS or not, to be seen, understood, and appropriately guided by their teacher.
Footnotes
Appendix
Scales of the ChiSSEQ Used for the Present Study.
| Depth of Processing (n = 4) |
| At home I think a lot about what I experience at school |
| When I have learned something new, I think about why it works that way |
| When I am back home, I think about what I have learned |
| When the school day is over, I stop thinking about what I have done at school a |
| Negative Emotions (n = 4) |
| When the teacher says I made a mistake, I am very disappointed |
| When another child is angry with me, it bothers me a lot |
| When there has been a quarrel at school, I get rid of that unpleasant feeling quickly a |
| Often I almost cry when I see a classmate is sad |
| Positive Emotions (n =3) |
| When a classmate says I am doing something well, it makes me happy again when I think of it later |
| When someone in the classroom is cheerful, I become very cheerful too |
| I become happy too when someone makes a classmate happy |
| Cognitive Empathy (n = 5) |
| I notice when a classmate is sad, even if they are not crying |
| When another child is happy, I notice that immediately |
| I sense when other children are nervous |
| I quickly notice when someone in the classroom is not feeling well |
| I usually have no idea how my classmates are feeling a |
These items were reversed.
Acknowledgements
We would like to thank Dr. M. Tierens and her team from the Center of Expertise Health and Care of Thomas More, for allowing us to use the COVAT-3 and for training the junior researchers and graduate students to administer this test. We would also like to thank the children who participated, their parents, and teachers of the POINT-schools for their cooperation in this study.
Declaration of Conflicting Interests
The author(s) declared no potential conflicts of interest with respect to the research, authorship, and/or publication of this article.
Funding
The author(s) disclosed receipt of the following financial support for the research, authorship, and/or publication of this article: The study was partly funded by the Dutch Initiative for Education Research (NRO 405-16-627/710) and the Educational Research Labs, POINT013 and POINT040.
Open Science Disclosure Statement
The data analyzed in this study are not available for purposes of reproducing the results. The code or protocol used to generate the findings reported in the article are not available for purposes of reproducing the results or replicating the study. The newly created, unique materials used to conduct the research are not available for the purposes of reproducing the results or replicating the procedure.