
Abstract
Objective:
The objective was to examine response rates, types of callers and their probability of being answered, prevalence of at-risk callers, and to calculate national call rates.
Methods:
Data on all calls to the Danish, national telephone helpline for suicide prevention during July 2019 to December 2022 were analysed. A measure of unique calls was developed to account for repeat calls not being answered. We examined the probability of calls being answered by caller types using logistic regression and calculated national call rates for individuals aged ⩾15 years.
Results:
Overall, 526,533 calls were made by 31,317 individuals, and 131,621 unique calls were identified, of which 48.9% were answered. First-time callers (95.1%) accounted for 5.7% of calls. We found that 0.1% of callers accounted for 61.8% of all calls. This group of daily callers (>1000 calls each year) consisted of 8–12 unique callers and was more likely to be answered (odds ratio = 24, 95% confidence interval = [23, 25] vs first-time callers), often hung up (49.1% vs first-time callers: 4.4%), and received 33.0% of the total counselling time. The yearly national call and caller rates were 893 calls and 212 unique callers per 100,000 inhabitants, respectively.
Conclusions:
Correcting for repeated unanswered calls provided an informative estimate of the response rate. The call distribution was highly skewed; a small group of daily callers accounted for most calls and were more likely to be answered. These callers frequently hung up before a conversation was initiated. National call rates facilitate cross-country comparisons.
Keywords
Introduction
Telephone helplines that provide counselling services to people with suicidal thoughts are recommended by the World Health Organization (2018) as a central component in national strategies.
Helplines report varying response rates (Samaritans, 2016), as seen in US states where rates range between 10% and 98% in 2020 (Purtle et al., 2023). A low response rate may trigger more repeat calls and, consequently, deflate the response rate. Hang-up calls, that is, calls where the caller hangs up when the call is answered, have been reported to occur in 0.7% and 55% of calls (Kalafat et al., 2007; Mishara et al., 2007; Spittal et al., 2015). Frequent callers, that is, individuals who call repeatedly, can be a challenge for helplines (Middleton et al., 2016). In Australia, it was estimated that 60% of calls derived from just 3% of callers (Spittal et al., 2015). Qualitative findings suggest that frequent callers intentionally call when the call volume is low, which may increase their chances of being answered (Middleton et al., 2016). Using a clinical scale, counsellors at the Danish national helpline evaluated that 37% of callers were at risk of suicide (Jacobsen et al., 2023). However, the proportion of at-risk callers may vary, for example, showing a higher prevalence during winter months (Doki et al., 2016; Samaritans, 2019). The evidence base regarding helplines’ call volume is restrained due to selection bias, for example, by eliminating unlisted callers, use of data from helplines focused on specific groups or self-selection surveys (Coveney et al., 2012; Spittal et al., 2015). Findings based on national and complete data will help optimize planning and support for callers.
The aim of this study was to identify the response rate, types of callers, temporal distribution of at-risk callers, and to calculate the national call rate of the Danish national telephone helpline for suicide prevention. We also analysed whether specific types of callers were more likely to be answered than others.
Methods
Study design and data sources
A cohort design was applied to data from the national Danish helpline for suicide prevention (‘Livslinien’, Tel 70 201 201). Open daily from 11 AM to 5 AM, this is the only helpline in the country to focus on people with suicidal ideation. The helpline is run by a non-governmental organization (NGO). Their telephone company, Ipnordic, provided electronic records on all calls directed from 1 July 2019 to 31 December 2022. Each phone number was replaced by an anonymised identification number, which was reset on 18 June 2021 as a General Data Protection Regulation (GDPR) precaution. Data on risk of suicide and reasons for calling for the same period were obtained from an anonymous electronic database, in which counsellors log information on each answered call. To calculate national call rates, we obtained data on individuals aged ⩾15 years living in Denmark from 1 January 2020 to 31 December 2022 from Statistics Denmark (2019). The age criterion of 15 years was used, since few callers (<1%) were below this age (Livslinien, 2018).
Calls
We examined all calls between 1 January 2020 and 31 December 2022, that is, the period of follow-up. Calls were categorized into 18-hour timespans, which began at 11 AM each day and ended just before 5 AM on the consecutive day, corresponding to the opening hours of the helpline.
Measures
For technical reasons, calls from unlisted numbers, that is, phone numbers withheld from public directories, had been replaced by the same anonymised number. Calls of this type were therefore excluded.
Unanswered callers tended to repeat their call numerous times, which deflated the response rate. To compensate for this, we defined unique calls as the number of non-related calls received from the same phone number over a 24-hour period. For instance, if a caller tried calling five times on the same day and was not answered until the fifth call, these calls were assumed to be due to the same motive and, thus, considered as one unique call (Supplemental eFigure 1). If the same caller called again later the same day, this would be considered as a new call. The time of the first call was considered as the index time.
We distinguished between first-time, frequent, daily and other callers. First-time callers were defined as calls from a phone number, from which no previous call had been made. Frequent callers were defined as individuals who had either placed 20 unique calls within 30 days or 120 calls within 182 days. This approach has previously been applied (Spittal et al., 2015). Based on preliminary analyses, we defined a new measure, daily callers, denoting individuals who placed ⩾1000 calls within a year, equivalent to 83 unique calls within 30 days or 499 calls within 182 days. All remaining callers were categorized as other callers. Having historical data on all calls during 1 July to 31 December 2019 allowed us to determine whether a caller was, for instance, a first-time or frequent caller, at the start of follow-up. Type of caller was included as a time-varying covariate and updated on a daily basis.
Answered calls were classified as either hang-up calls or conversation calls. If a caller hung up within 10 seconds of being answered, this was considered a hang-up call. All other calls were considered to be conversation calls.
At the start and end of each call, counsellors recorded the caller’s risk of suicide in the helpline’s database as: no suicidal ideation, low, middle, high, acute risk, not answered and too little information. Counsellors could also indicate whether a caller had suicidal thoughts or plans. Callers were considered at risk of suicide if they had been evaluated as being at high or acute risk or presence of suicidal thoughts or plans had been indicated. Reasons for calling the helpline were recorded as bullying; eating disorders; loneliness; mental health–related; substance misuse; physical health; rape/incest; self-harm; and missing. Several reasons could be indicated for each call. When counting the time spent addressing different concerns, we divided time evenly if several reasons were selected.
Outcome
The primary outcome was answered calls.
Statistical analyses
Distributions of calls were examined by calendar year (2020, 2021, 2022); season (spring, summer, autumn, winter); month (January, February, . . . December); monthly segments (first, second, and third tertile); weekday (Monday, Tuesday, . . . Sunday); daily segments (midday, afternoon, evening, late evening, nighttime). Inverse probabilities weights by year, season, monthly segment and daily segment were applied to compensate for the exclusion of calls from unlisted numbers. Response rates were calculated as the percentage of answered calls from all calls. We identified unique calls and types of callers and examined characteristics of answered calls (i.e. hang-up and conversation calls). In logistic regression analyses, we examined whether other caller types had higher probabilities of being answered when compared with first-time callers. Reasons for calling and at-risk callers were assessed across days and hours. Time intervals were rounded down to the nearest integer and smoothing was conducted using moving averages. National rates were calculated as a) number of unique calls and b) number of individual callers per 100,000 inhabitants and presented with their 95% confidence intervals (CIs). As sensitivity analysis, the robustness of unique calls and the response rate were evaluated by considering unanswered calls to be related to the same motive for two consecutive days instead of one.
Data analyses were conducted using SAS and R Studio (R Foundation for Statistical Computing, 2016; SAS Institute, 2003).
Ethical concerns
The study was conducted in conformity with research regulations of the Danish Data Protection Agency.
Results
A total of 530,820 calls were directed to the helpline between 1 January 2020 and 31 December 2022. Of these, 4287 (0.8%) were excluded, leaving 526,533 (99.2%) calls (Figure 1). Most calls occurred in 2022 (38.0%), May (9.3%), on Sundays (15.7%), and at nighttime (25.5%) (Supplemental eTable 1). Overall, 430,253 (81.7%) calls came from listed and 96,280 (18.3%) from unlisted numbers. Calls from unlisted phone numbers were more frequent in 2020 and during nighttime. Inverse probability weighting was applied to compensate for the exclusion of unlisted calls.
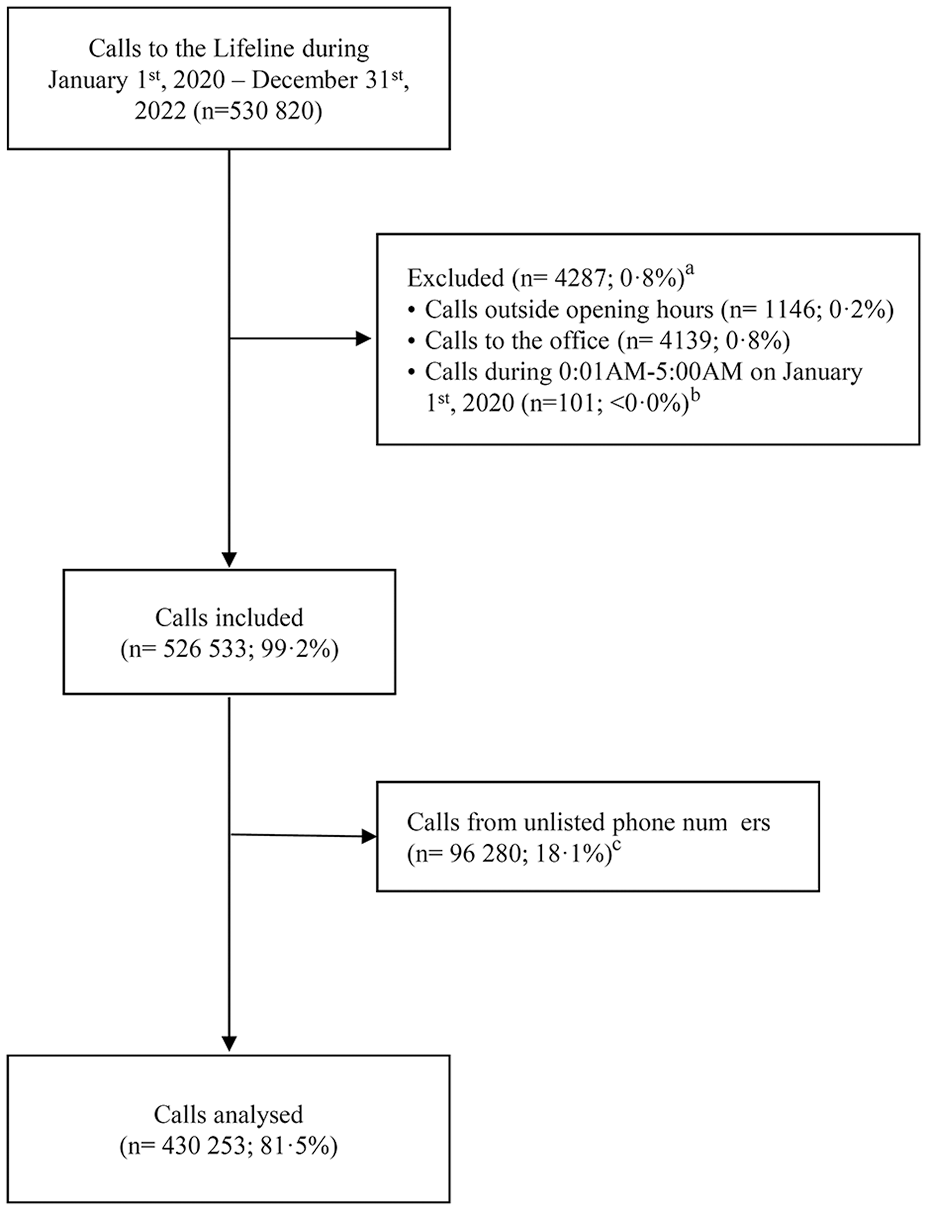
Flow diagram.
A weighted total of 64,335 (2020: 20,605; 2022: 22,709) calls were answered, indicating a crude response rate of 12.2%. The crude response rate decreased to 1.3-5.9% around 4 PM, 6 PM, 8 PM, and 11 PM during weekdays and to 1.0–2.7% around 3 PM, 7 PM, and 11 PM during weekends (Figure 2).
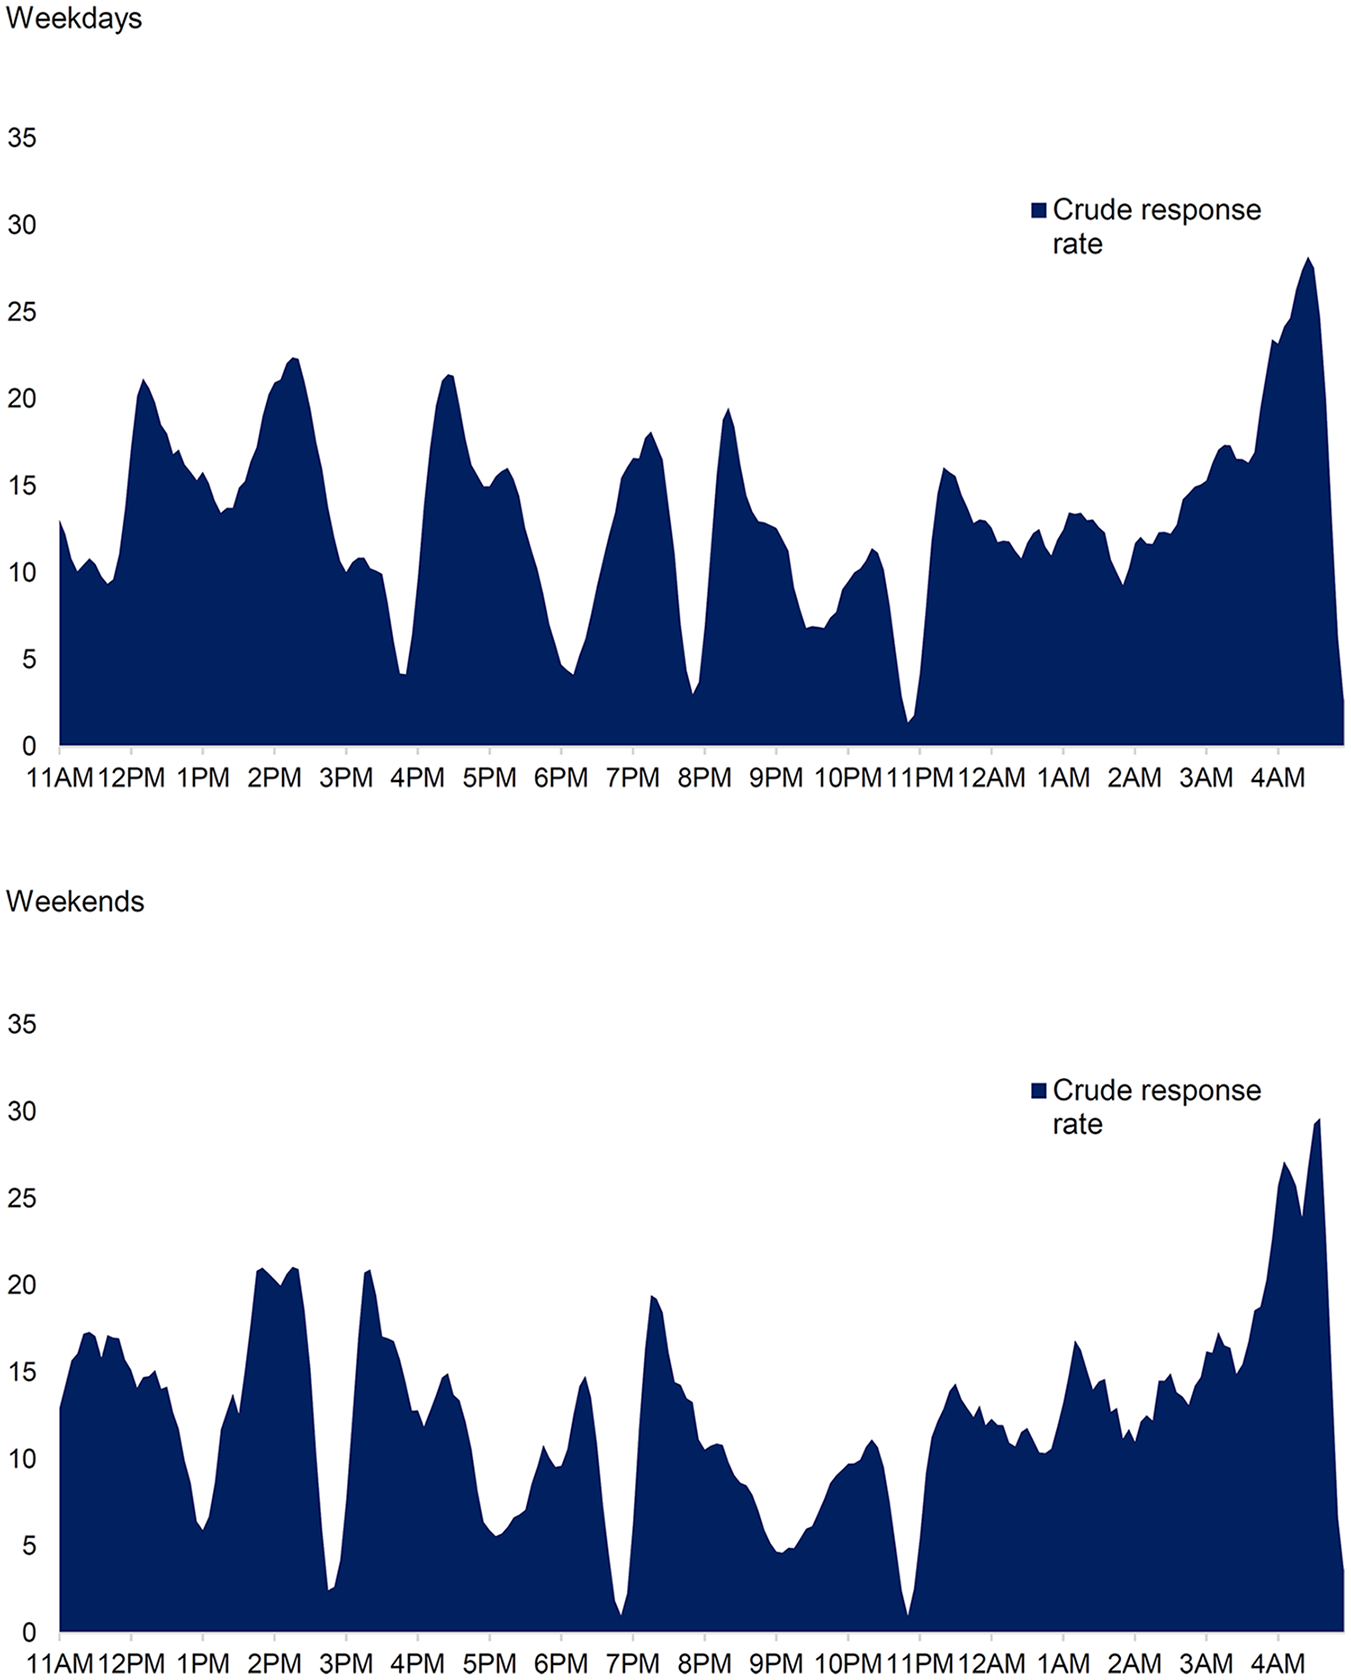
Weighted crude response rates during weekdays and weekends assessed over 5-minute intervals.a
We identified 131,621 (25.0%; yearly mean: 43,874) unique calls (Supplemental eTable 2), which suggested that 394,912 (75.0%; yearly mean: 131,637) repeat calls were made because the initial call had not been answered. Calls came from 31,317 individuals. The adjusted response rate based on unique calls was 48.9% and highest during summer (50.6%), midday (60.4%), and afternoons (56.1%). Each caller had on average called 5.2 times (STD = 10.2; median = 2; interquartile range [IQR] = 1–5) before being answered and the mean time between the index and answered call was 58 (median = 4; IQR = 0–51) minutes. Among answered calls, 14,402 (22.4%) were hang-up calls, while a conversation was initiated in 49,933 (77.6%) calls; the median conversation length was 16 (IQR = 6–30) minutes, which accumulated to a total of 17,775 hours of counselling time over the 3-year period.
Types of callers
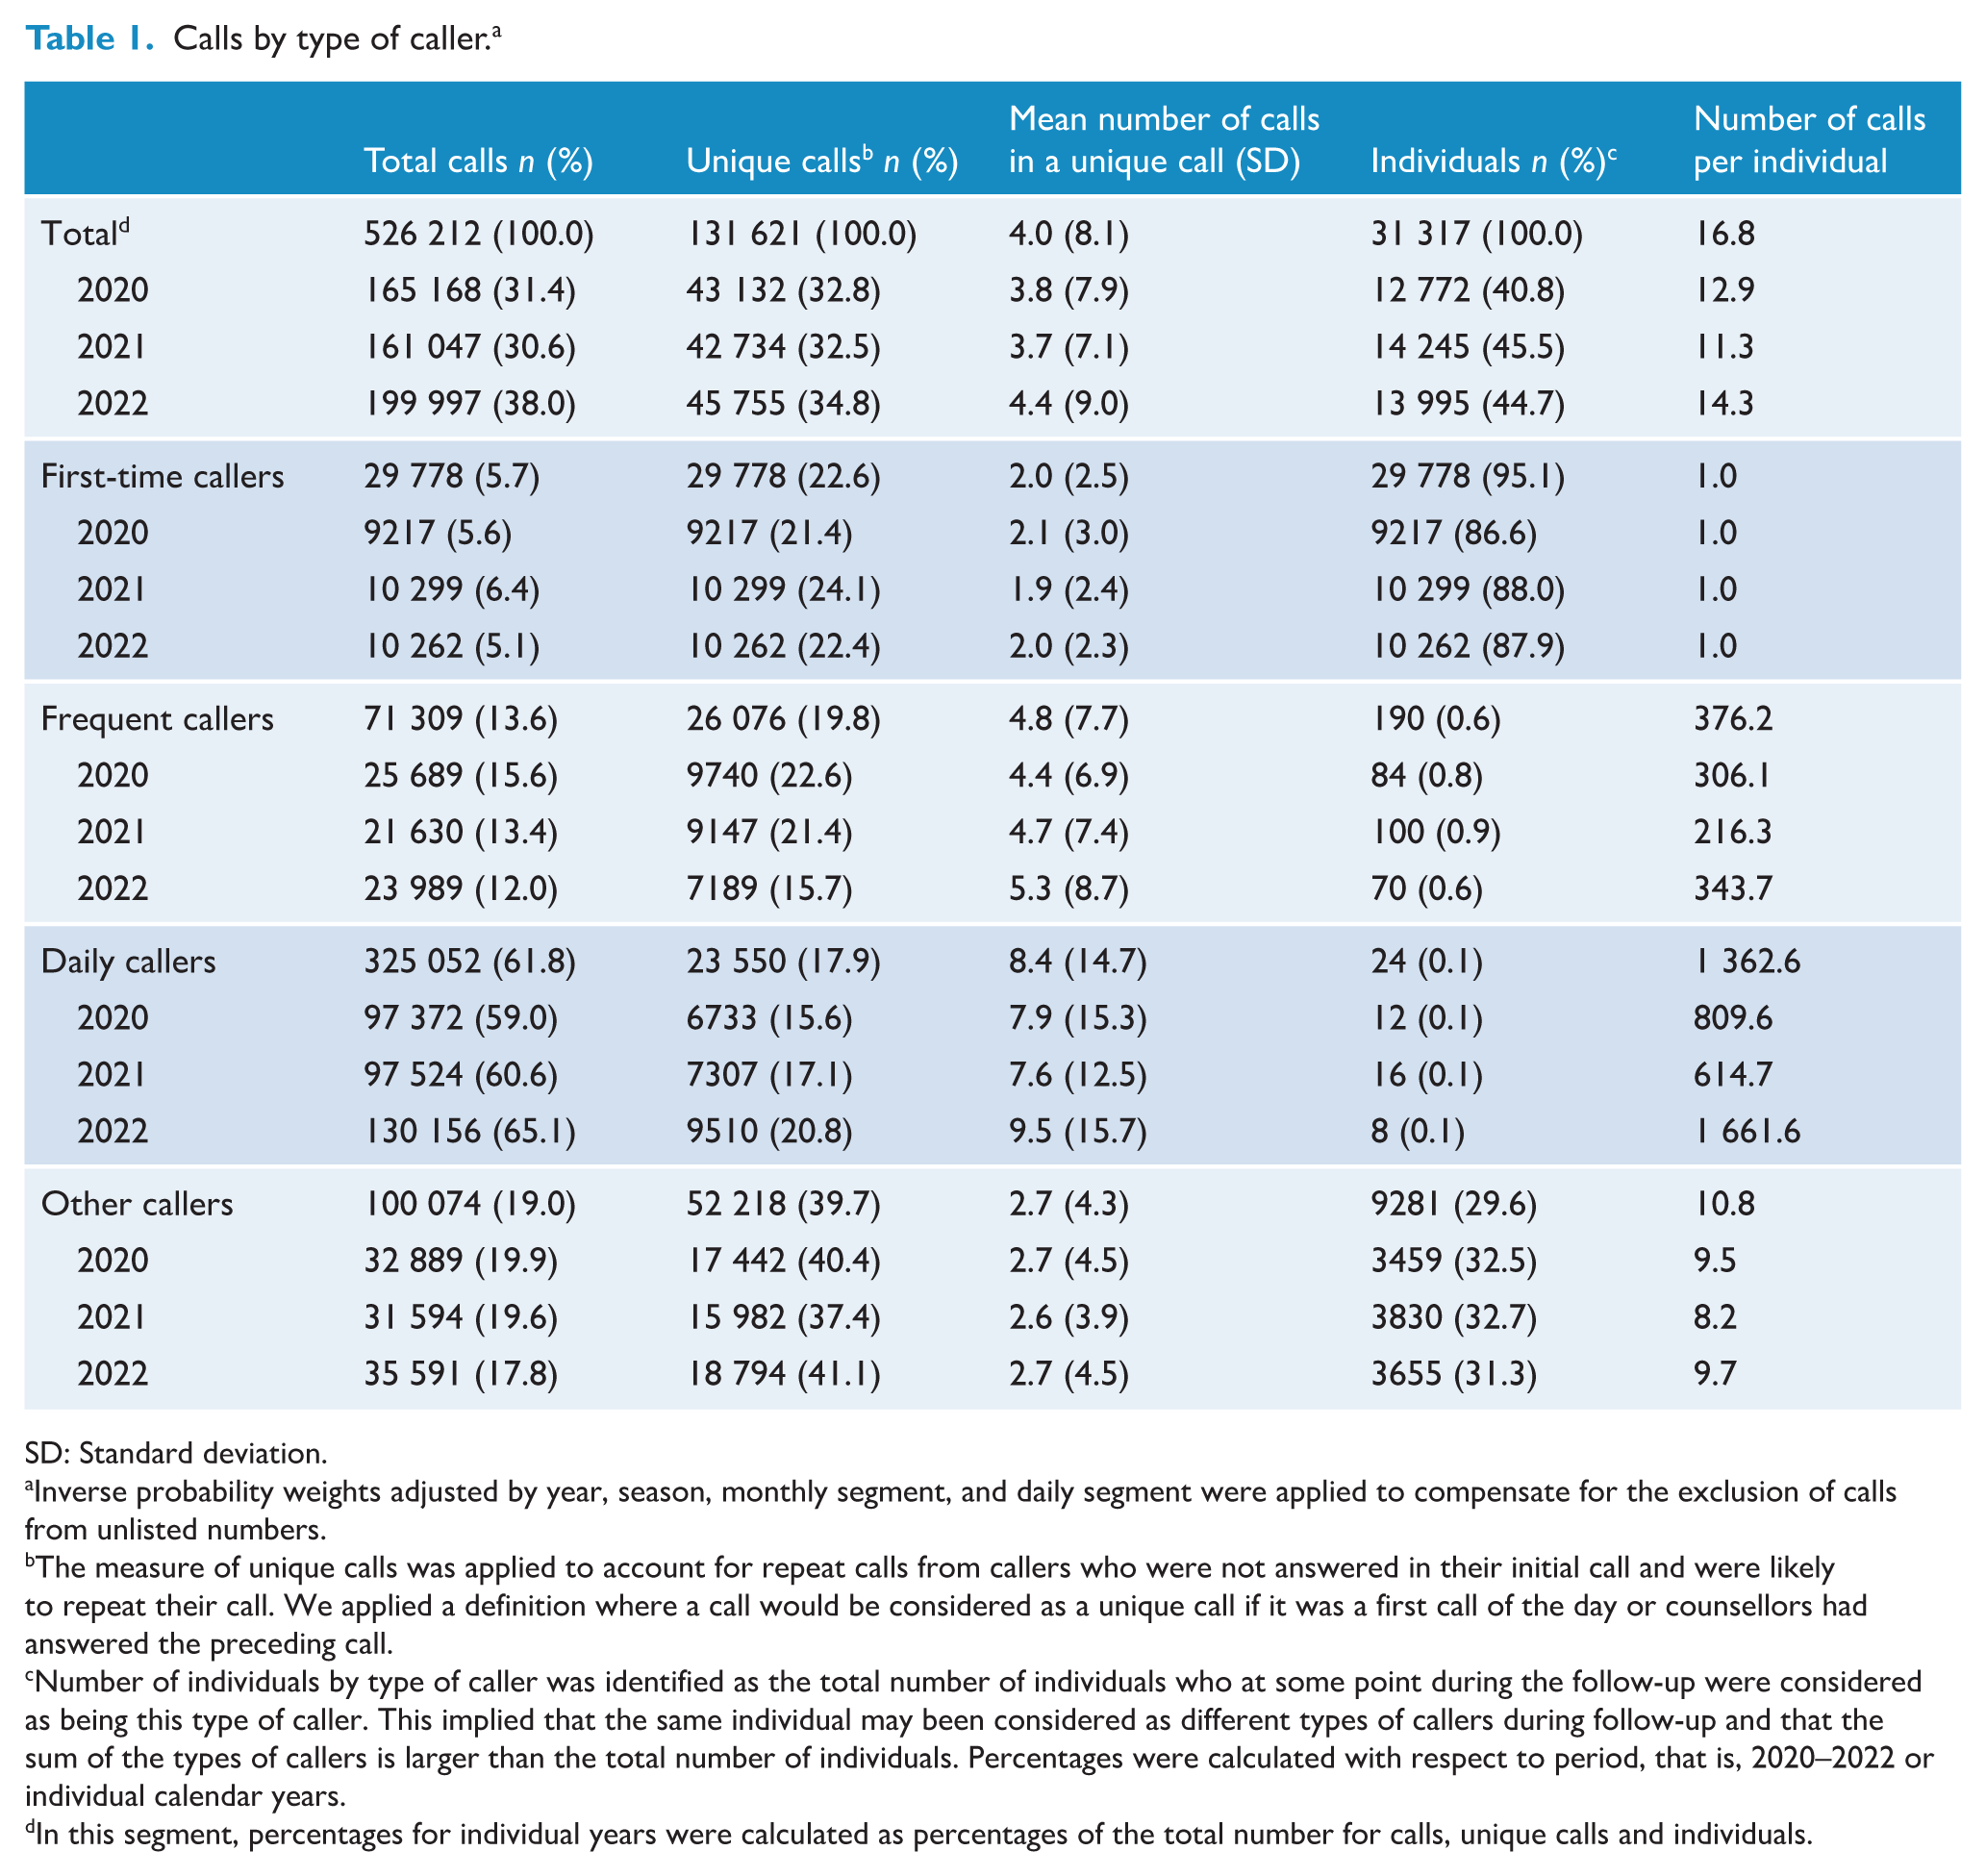
A total of 29,778 (95.1%) individuals were first-time callers, accounting for 29,778 (5.7%) calls (Figure 3 and Table 1). Based on unique calls, the response rate for first-time callers was 28.2% (Table 2). Except for the 4.4% of hang-up calls, the median length of conversation was 21 minutes (IQR = 10–34) and a total of 1927 (10.8%) counselling hours were provided to first-time callers over the 3 years.
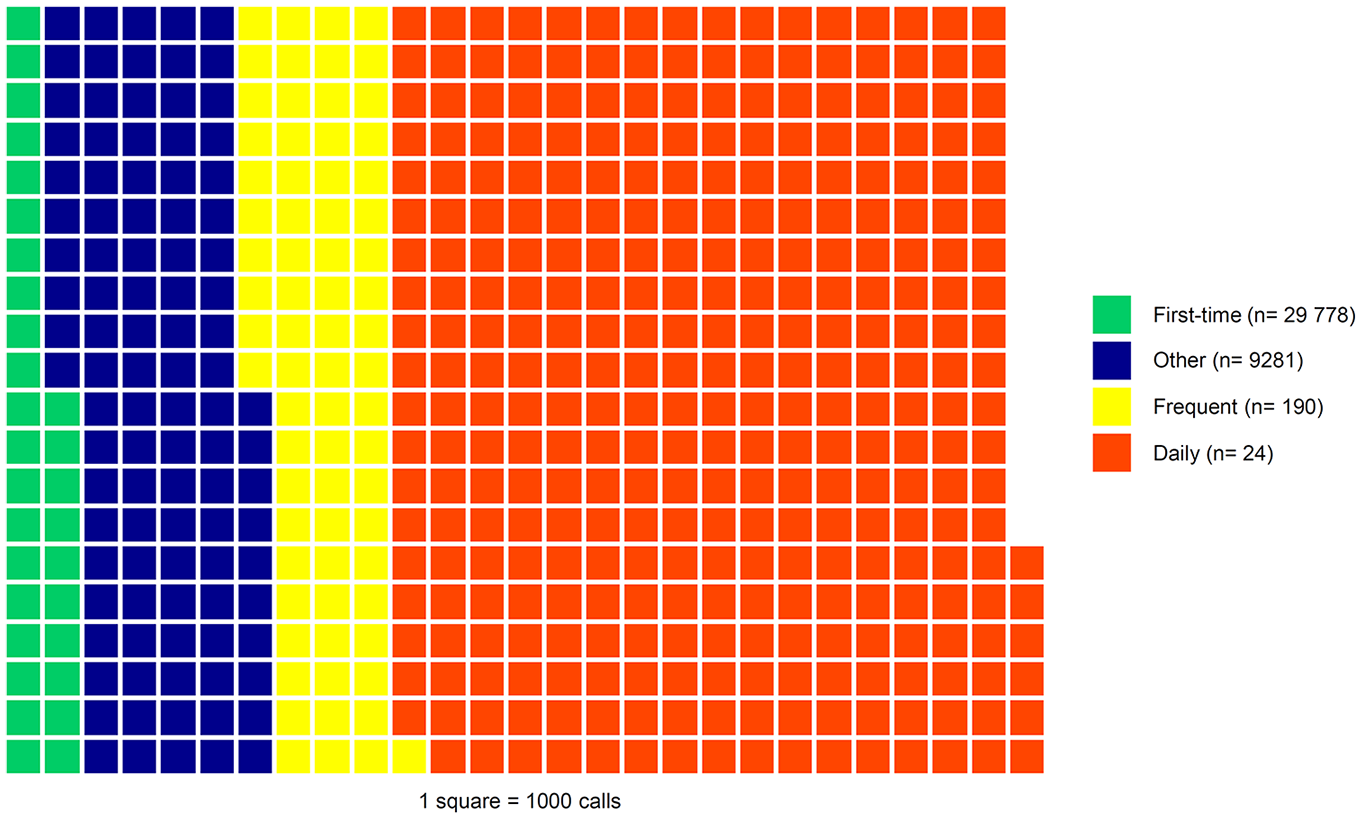
Distribution of all calls and number of callers by caller type.a
Calls by type of caller. a
SD: Standard deviation.
Inverse probability weights adjusted by year, season, monthly segment, and daily segment were applied to compensate for the exclusion of calls from unlisted numbers.
The measure of unique calls was applied to account for repeat calls from callers who were not answered in their initial call and were likely to repeat their call. We applied a definition where a call would be considered as a unique call if it was a first call of the day or counsellors had answered the preceding call.
Number of individuals by type of caller was identified as the total number of individuals who at some point during the follow-up were considered as being this type of caller. This implied that the same individual may been considered as different types of callers during follow-up and that the sum of the types of callers is larger than the total number of individuals. Percentages were calculated with respect to period, that is, 2020–2022 or individual calendar years.
In this segment, percentages for individual years were calculated as percentages of the total number for calls, unique calls and individuals.
Answered calls by caller type. a
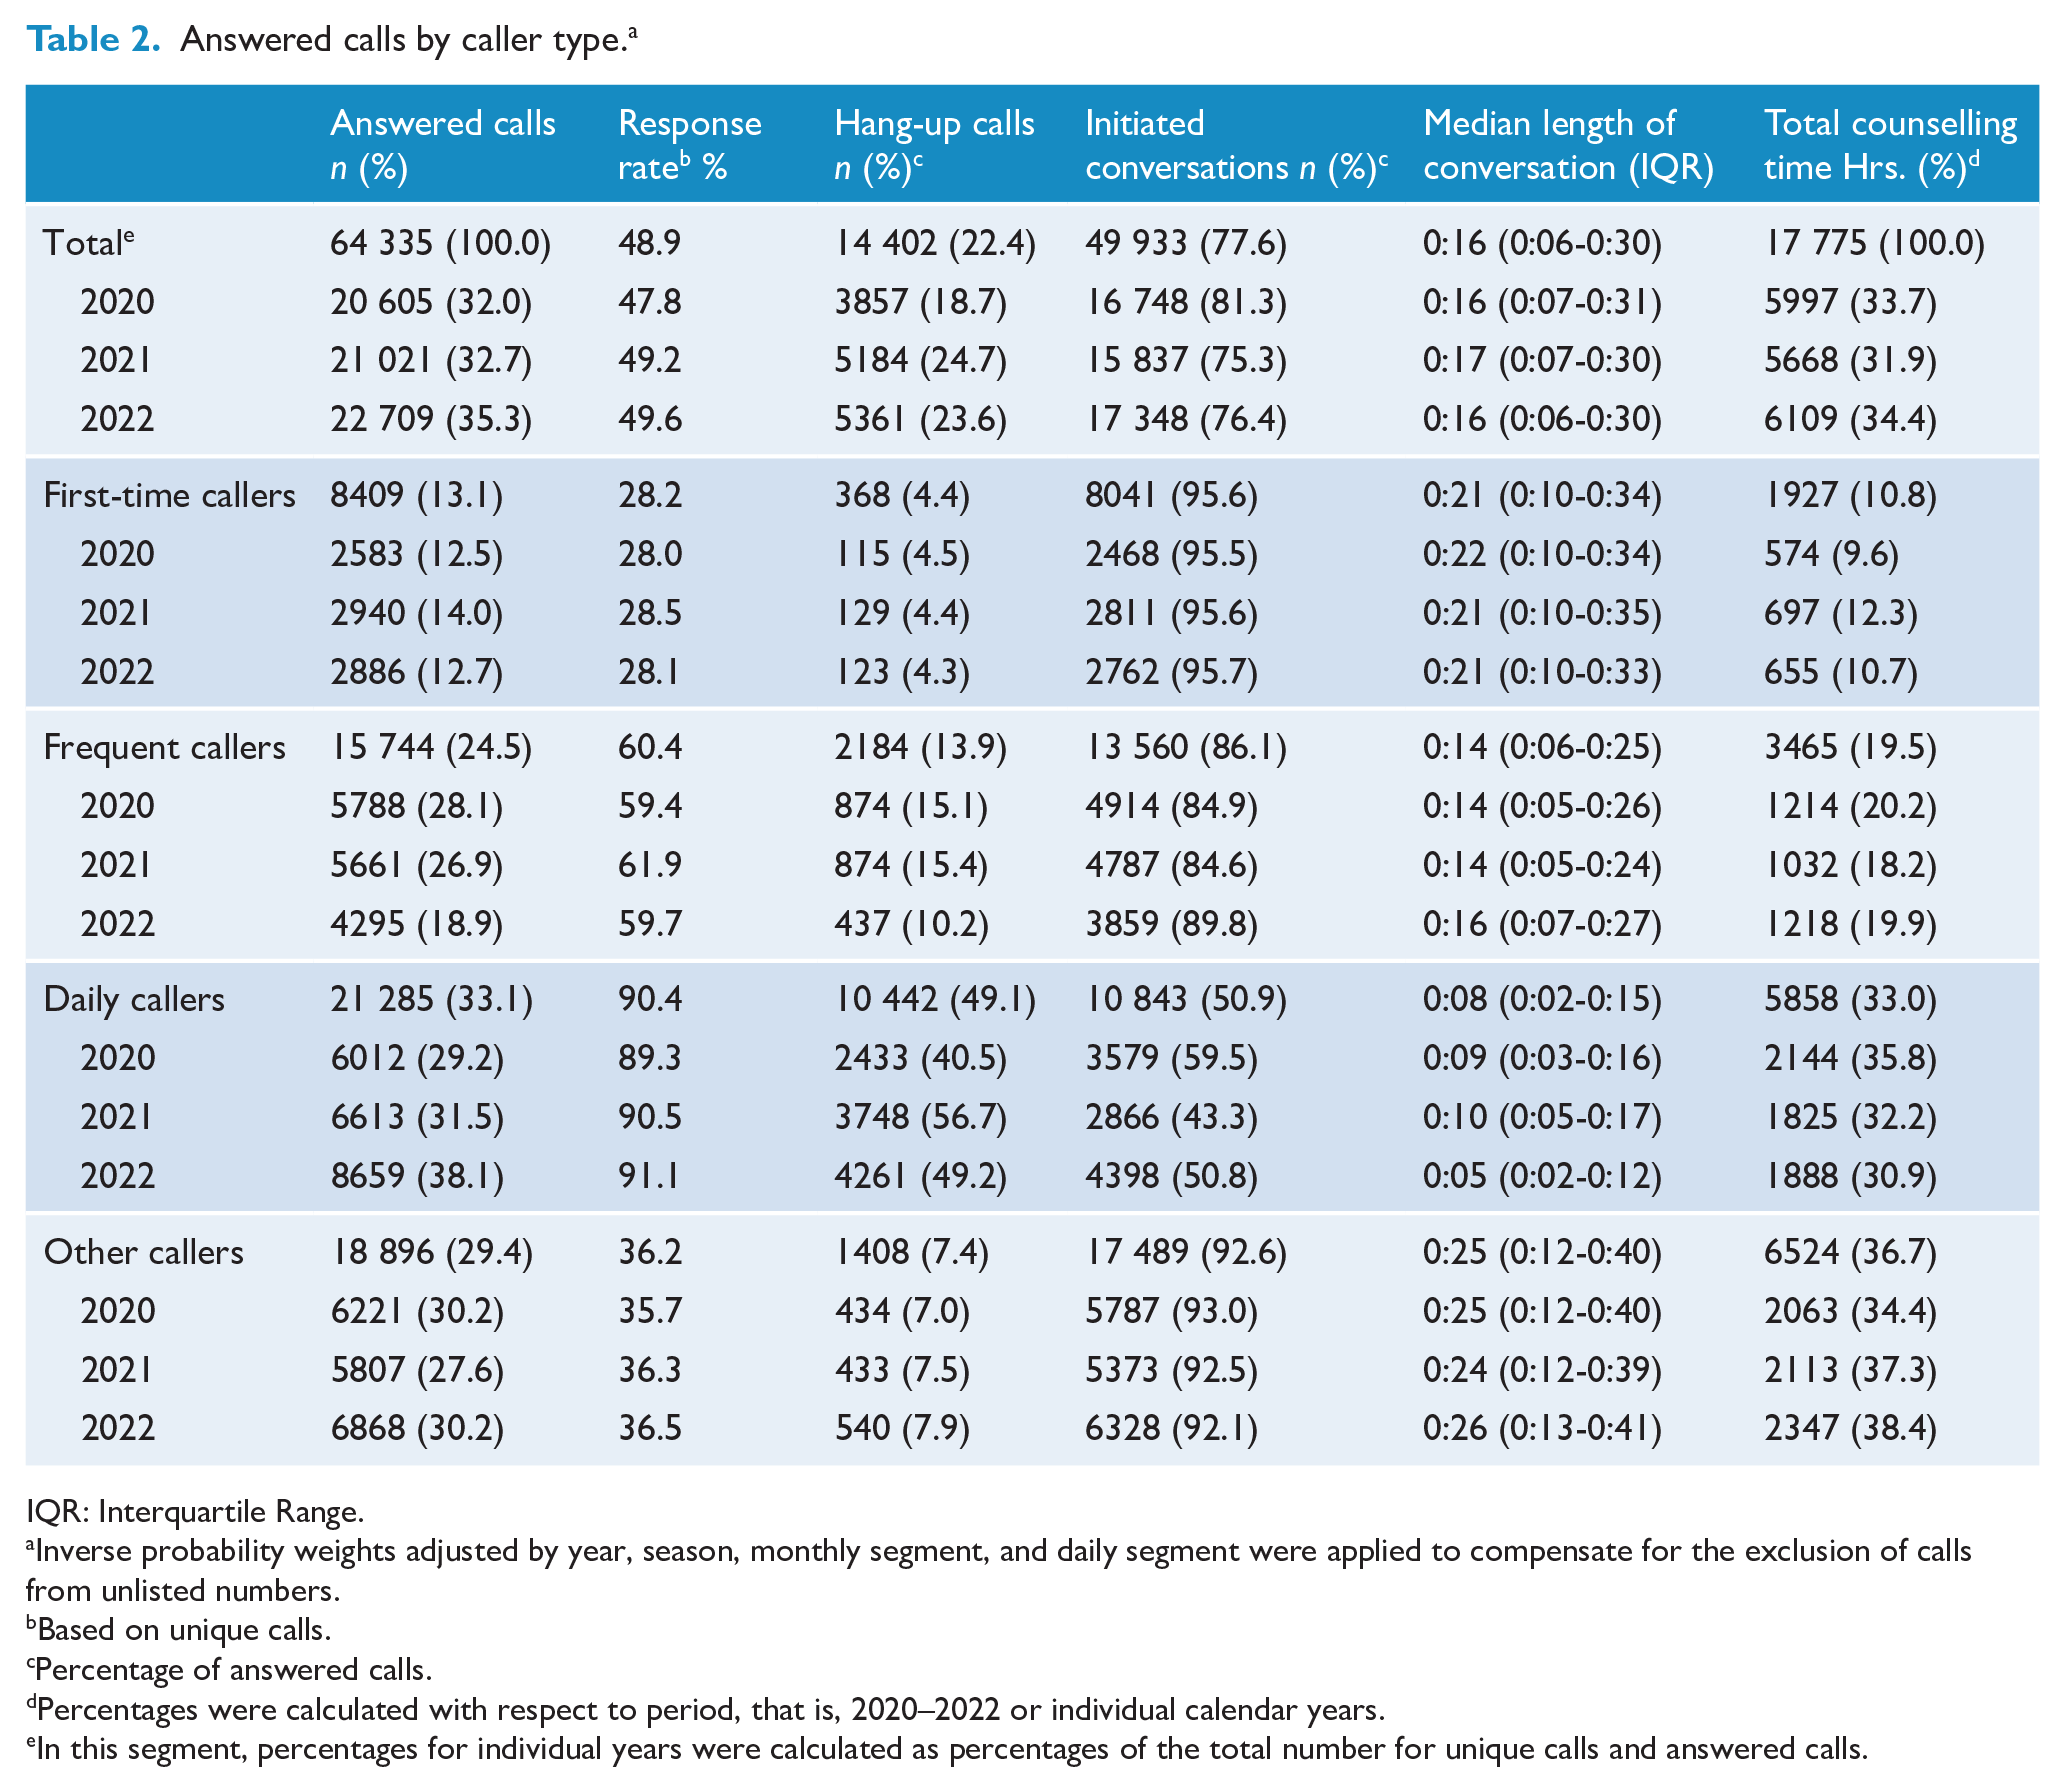
IQR: Interquartile Range.
Inverse probability weights adjusted by year, season, monthly segment, and daily segment were applied to compensate for the exclusion of calls from unlisted numbers.
Based on unique calls.
Percentage of answered calls.
Percentages were calculated with respect to period, that is, 2020–2022 or individual calendar years.
In this segment, percentages for individual years were calculated as percentages of the total number for unique calls and answered calls.
During follow-up, 71,309 (13.6%) calls derived from 190 (0.6%) callers were identified as frequent callers. On a yearly basis, 84–100 frequent callers each made 216–344 unique calls and their overall response rate was 60.4%. Of answered calls, 13.9% were hang-up calls and the total counselling time was 3465 (19.5%) hours. Based on yearly data, this corresponds to approximately 7.6 hours of counselling per individual per year.
We identified 24 (0.1%) individuals who called the helpline >1000 times yearly and were considered daily callers. On a yearly basis, 8–12 daily callers each directed between 6147 and 16,616 calls to the helpline. Although 16 were listed in 2021, this is likely due to the reset of the anonymised numbering half way through the year. Overall, this group accounted for most calls (n = 325,052; 61.8%); ranging from 97,372 in 2020 to 130,156 calls in 2022. Daily callers had a response rate of 90.4%, which increased from 89.3 in 2020 to 91.1 in 2022. The mean wait time before being answered was 59 minutes (median = 9 minutes; IQR = 0–57 minutes). Their proportion of hang-up calls was 49.1%. Their median conversation time was 8 (IQR = 2–15) minutes. In total, daily callers received 5858 (33.0%) hours of counselling, corresponding to 244 hours per individual over 3 years. Based on yearly data, approximately 162 hours of counselling were provided per individual per year.
Other callers (n = 9281; 29.6%) accounted for 100,074 (19.0%) calls. Unique calls from this group had a response rate of 36.2%. The counselling time of these callers was 6524 (36.7%) hours, corresponding to 42 minutes per individual.
When compared to first-time callers, daily callers were 23.9-fold (95% CI = [22.7, 25.1]) more likely to be answered (Supplemental eTable 3). A higher probability of being answered was also found for frequent (odds ratio [OR] = 3.9; 95% CI = [3.7, 4.0]) and other callers (OR = 1.4; 95% CI = [1.4, 1.5]).
Content of calls
Among the callers, 47.4% were evaluated to be at risk of suicide (Supplemental eTable 4). At-risk callers were more frequent during April (50.0%) and late evenings (55.4%). Assessed in 15-minute intervals, percentages of at-risk callers were highest on Tuesday at 11 AM, Tuesday, Wednesday and Thursday around 4 PM, and Tuesday and Saturday at 11 PM (Supplemental eFigure 2). Frequent reasons for calling the helpline were mental health difficulties (41.5%), loneliness (21.4%), physical health (10.3%), substance misuse (3.7%), self-harm (2.1%), and others (9.0%) (Supplemental eFigure 3).
National call rates
The yearly national call rate was 892.6 (95% CI = [887.8, 897.4]) calls; equivalent to 2.4 (95% CI = [2.2, 2.7]) daily calls per 100,000 inhabitants aged 15 years and over. In terms of individuals, 212.4 (95% CI = [210.0, 214.7]) persons per 100,000 inhabitants aged 15 years and over sought phone counselling from the helpline each year. This is equivalent to 1 out of 471 inhabitants.
Sensitivity analysis
Summarizing unique calls over two days instead of one, resulted in a total of 102,546 (19.5%; yearly mean: 34,182) unique calls and a response rate of 62.7% (Supplemental eTable 5). The numbers of frequent callers was 110 (0.4%) and 15 (<0.1%) were identified as daily callers.
Discussion
Using complete national call data and a corrective measure, we identified that about half of all calls to the Danish helpline for suicide prevention were answered. Many callers called repeatedly before being answered. However, during counsellor shift changes hardly any callers were answered. First-time callers were the largest group of individuals using the helpline. However, a small fraction of daily callers consisting of 8–12 callers placed more than 60% of all calls. When compared to first-time callers, daily callers called and hung up more often but were also more likely to be answered. One in 431 people in Denmark called the helpline each year, which amounted to almost 900 calls per 100,000 inhabitants.
Applying weights, the findings may be considered nationally representative. Although the reset of the anonymised identification number might have led to an over-estimation of first-time callers and an under-estimation of frequent and daily callers, the yearly numbers remain unbiased. Applying the measures of unique calls provided more correct estimates, which were supported by the sensitivity analysis. Furthermore, the number of unique and overall calls would – per definition – be equal when all calls are answered. Potentially, a doubling of existing resources might enable the helpline to respond to all callers, although an increased number of unique calls were observed after the opening of a new call-centre in 2022. Given that as many as half of callers might be at risk (Doki et al., 2016; Gould et al., 2013; Mishara et al., 2007; Ohtaki et al., 2017; Ramsey et al., 2018), the considerable amount of time spent calling before being answered is concerning.
First-time callers were the largest group of callers. They were less persistent than daily and frequent callers. However, the low rate of hang-up calls suggests they were keen to receive counselling. The low response rate is worrisome because more suicides have been observed among short-term users when compared to age- and gender-matched controls (Ramsey et al., 2018).
To our knowledge, the existence of 8–12 daily callers who made 62% of all calls has not previously been addressed but makes this group an appealing target for interventions. Seemingly, some of these callers remained as daily callers during the entire period, while others only held this status for a shorter period. When considering daily callers as a sub-group of frequent callers, our findings resemble previous reports where 3% of callers placed 60% of calls (Pirkis et al., 2016; Spittal et al., 2015). Summarized as one joint group, we found that 0.7% of callers made 75% of calls; thus, potentially suggesting that frequent callers may place more calls in Denmark, potentially due to the lower response rate. However, daily callers differ from frequent callers with respect to numbers of calls, hang-up and response rates. The high prevalence of hang-up calls might relate to searches for specific counsellors whom they wanted to talk with (Coveney et al., 2012). The high response rate was due to repeated calls. Also, daily callers may have identified times of low call volume (Middleton et al., 2016). The increase in number of calls and hang-ups in 2022 could be due to an increased availability of counsellors. While frequent and non-frequent callers have comparable levels of suicidality (Spittal et al., 2015), this remains to be confirmed for daily callers. Their extensive use of the helpline may be indicative of needs for long-term support, or may relate to other factors such as loneliness or boredom (Middleton et al., 2016; Spittal et al., 2015).
The national rate of yearly calls per inhabitants was higher than previous regional estimates, which may relate to different age cut-offs and availability of alternate helplines (Kandula et al., 2023; Purtle et al., 2023). Callers per inhabitants, that is, 1 out of approximately 500, have seemingly not previously been reported.
Implications
In support of existing guidelines (Draper et al., 2015), almost half of all callers were evaluated to be at risk of suicide. Although individuals may not act on their suicide thoughts, our findings underscore the importance of answering all calls. The hours with extreme low response rates coincided with counsellor shift changes at the helpline and may be addressed by adapting work hour schedules. Evenings and other specific time points with a higher preponderance of at-risk callers could also be prioritized when planning work schedules.
Telephone counselling may reduce short-term levels of suicidality (Gould et al., 2007; Mishara and Daigle, 1997; Shaw and Chiang, 2019). The benefit of using helpline counselling as a long-term coping strategy, as in the case of daily callers, remains to be evaluated (Middleton et al., 2016; Spittal et al., 2015). Shorter conversation lengths have been suggested as a strategy for frequent callers (Middleton et al., 2014; Mishara et al., 2023). In this study, daily callers had the shortest counselling conversations but also the highest number of calls. The many unanswered calls may be detrimental for daily callers, and we need to better understand their needs. Considering the extensive number of counselling hours, a tailored intervention for daily callers may be a cost-efficient intervention (Pirkis et al., 2016).
Strengths and limitations
Strengths of the study included complete and national data and a long follow-up. The prospectively assembled electronic database improved the validity. Access to historical data on callers during the preceding 6 months, allowed for more precise estimates regarding types of callers. Furthermore, having exact time points allowed us to define caller types on a day-to-day basis, and thereby improving the reliability of this measure (Spittal et al., 2015). Although the phone company’s reset may have led to an over-estimate of first-time callers, the stability observed across calendar years supports the validity. Individuals at risk of suicide may also call medical emergency or other crisis helplines. Still, the examined helpline was the only one in Denmark to explicitly target callers with suicide thoughts; other helplines focused on mental health, depression and children. The callers may resemble those of suicide prevention helplines in other countries (Coveney et al., 2012), although generalizability should be undertaken with caution.
Limitations should be acknowledged. First, we assumed that each phone number was used by one individual, which seemed reasonable as 85% of Danes reported having smartphones in 2020 (Statistics Denmark, 2020). Still, some callers may have had several phone numbers or changed their number during the period of study. Second, individuals with unlisted numbers may have differed from other callers, and their exclusion may have biased estimates despite being compensated by weights. Third, the definitions of unique and hang-up calls may be imprecise, although the sensitivity analyses supported the identified response rate. Fourth, the number of first-time callers might have been overestimated as only 6 months of historical data were available. Fifth, suicide risk assessments and reasons for calling were evaluated by counsellors and not based upon clinical measures. Sixth, callers may have called other helplines (Coveney et al., 2012), which would render the national rates as conservative. Seventh, lack of personal identifiers precluded linkage of data across databases.
In sum, three out of four calls to the Danish helpline for suicide prevention were not answered, implying that at-risk callers were not attended to in a timely manner. Introducing a correction term, we were able to account for repeated calls by unanswered callers, and, thus, identified a more exact response rate. Almost half of all unique calls were answered. A low response rate was found for first-time callers who constituted the largest group of callers. Daily callers, defined as callers who called more than 1000 times each year, were the smallest group. Yearly, they consisted of 8–12 individuals, but placed more than 60% of all calls. These daily callers had the highest response rate due to repeatedly calling and received a substantial share of the total counselling. Nevertheless, they frequently hung up when answered. It might be considered whether the existing service model meets the needs of daily callers. National rates of 889 calls per 100,000 inhabitants were identified. Each year, approximately one out of 500 inhabitants called the helpline.
Supplemental Material
sj-docx-1-anp-10.1177_00048674251361753 – Supplemental material for Use of suicide prevention helpline services by first-time, frequent, and daily callers: A national cohort study
Supplemental material, sj-docx-1-anp-10.1177_00048674251361753 for Use of suicide prevention helpline services by first-time, frequent, and daily callers: A national cohort study by Annette Erlangsen, Nikolaj Kjær Høier, Agnieszka Storgaard Nielsen, Nicolai Køster Rimvall, Matthew Spittal, Brian Mishara and Merete Nordentoft in Australian & New Zealand Journal of Psychiatry
Footnotes
Author contributions
AE, ASN, NKR and MN conceived the idea for the study. AE, MS and MN discussed the study design and made the plan for the analyses. NKH conducted the literature search and reviewed the evidence in collaboration with AE. AE ASN, NKR and NKH conducted data management and had access to the data. AE performed the analyses with feedback from MS, BM and MN. AE wrote the first draft of the manuscript. All authors interpreted the results, commented on the manuscript and had the final responsibility for the decision to submit for publication.
Declaration of Conflicting Interests
The author(s) declared no potential conflicts of interest with respect to the research, authorship and/or publication of this article.
Funding
The author(s) disclosed receipt of the following financial support for the research, authorship and/or publication of this article: The National Partnership for Suicide Prevention, Danish Health Authority.
Ethical approval
Not applicable.
Data availability statement
Data are available at the discretion of the Danish helpline for suicide prevention.
Supplemental material
Supplemental material for this article is available online.
References
Supplementary Material
Please find the following supplemental material available below.
For Open Access articles published under a Creative Commons License, all supplemental material carries the same license as the article it is associated with.
For non-Open Access articles published, all supplemental material carries a non-exclusive license, and permission requests for re-use of supplemental material or any part of supplemental material shall be sent directly to the copyright owner as specified in the copyright notice associated with the article.