
Abstract
Objective:
To investigate prevalence and trends in key mental health and well-being indicators among New Zealand secondary school students.
Methods:
Representative cross-sectional youth health surveys with 2–4% of the New Zealand secondary school population were conducted in 2001, 2007, 2012 and 2019 (total n = 34,548).
Results:
In 2019, 69.1% reported good well-being (95% confidence interval = [67.6, 70.6]; World Health Organization 5-item), 22.8% reported clinically significant depression symptoms (95% confidence interval = [21.4, 24.1]; Reynolds Adolescent Depression Scale–Short Form) and 41.8% reported possible anxiety symptoms (95% confidence interval = [40.5, 43.2]; Generalized Anxiety Disorder 2, adapted). Past-year prevalence of periods of low mood (38.3%, 95% confidence interval = [36.6, 40.1]), deliberate self-harm (24.1%, 95% confidence interval = [22.8, 25.4]), suicide thoughts (20.8%, 95% confidence interval = [19.2, 22.4]) and suicide attempts (6.3%, 95% confidence interval = [5.5, 7.0]) were observed. After relative stability from 2001 to 2012, there were large declines in mental health to 2019. The proportion reporting good well-being decreased (odds ratio 0.71, 95% confidence interval = [0.65, 0.78], p < 0.001), depression symptoms increased (odds ratio 1.96, 95% confidence interval = [1.75, 2.20], p < 0.001) and past-year suicide thoughts and suicide attempts increased (odds ratio 1.41, 95% confidence interval = [1.25, 1.59], p < 0.001; odds ratio 1.60, 95% confidence interval = [1.32, 1.92], p < 0.001). Past-year deliberate self-harm was largely stable. Declines in mental health were unevenly spread and were generally greater among those with higher need in 2012 (females, Māori and Pacific students and those from higher deprivation neighbourhoods), increasing inequity, and among Asian students.
Conclusion:
Adolescent mental health needs are high in New Zealand and have increased sharply from 2012 among all demographic groups, especially females, Māori, Pacific and Asian students and those from high-deprivation neighbourhoods. Ethnic and socioeconomic disparities have widened.
Introduction
International evidence suggests large and rapid increases in the prevalence of common mental health concerns (e.g. anxiety, depression) among adolescents since around 2012. While often presented as a global phenomenon, most of these findings are from the United Kingdom, the United States and Canada (Collishaw, 2015; Cook et al., 2021; Keyes et al., 2019; Twenge et al., 2019; Wiens et al., 2020). Important, although perhaps less marked, increases have been reported in other Western and Northern European nations (e.g. Haugan et al., 2021), while data from low- and middle-income countries are less available (Erskine et al., 2017). Many studies report the increases in mental distress as concentrated among females, but few provide trends by ethnicity or socioeconomic status.
Aotearoa New Zealand is a multi-ethnic society, with 27% of the population born overseas (Statistics New Zealand, 2020). Indigenous Māori people (comprising 17% of the total population and 25% of the youth population) were colonised largely by people from the United Kingdom. Historically, Aotearoa New Zealand has not had a good track record for adolescent mental health, with the adolescent suicide rate consistently among the highest in developed nations (e.g. Gromada et al., 2020). The burden of mental ill health is unevenly distributed, with long-standing inequities by sex, ethnicity and deprivation. Most notably, Indigenous rangatahi Māori have persistent health inequity compared with their Pākehā (New Zealand European) peers (Clark et al., 2022). In Aotearoa, Te Tiriti o Waitangi (a treaty) was signed between Māori and the Crown to confer (among other things) the right of Māori to equitable outcomes (Reid et al., 2019). There are ongoing and clear breaches of Te Tiriti o Waitangi regarding mental health, with Māori populations disproportionately affected (Clark et al., 2022; Reid et al., 2019; Waitangi Tribunal, 2019). Higher mental health needs are also consistently reported by females (although, notably, more males die by suicide), Pacific young people and those living in higher deprivation neighbourhoods (Fleming et al., 2020c), among other groups.
The Youth2000 survey series comprises large-scale surveys that assess a broad range of health and well-being factors among New Zealand secondary school students, including mental health indicators such as well-being, depression symptoms, self-harm and suicidality. We previously compared mental health results from 2001, 2007 and 2012 (Fleming et al., 2014) and reported little change, with small increases in self-reported depression symptoms, emotional symptoms, peer problems and past-year periods of low mood and self-harm between 2007 and 2012. The prevalence of past-year suicide thoughts and suicide attempts remained largely stable.
The Youth19 Rangatahi Smart Survey (Youth19; n = 7374) is the latest in the Youth2000 series, offering robust, recent, comparable data. Here, we describe the mental health and well-being of New Zealand secondary school students in 2019 and identify important changes between 2012 and 2019 among key population groups.
Methods
Survey procedure
Comprehensive, cross-sectional youth health and well-being surveys were completed by representative samples of New Zealand secondary school students in 2001, 2007, 2012 and 2019.
Detailed methods are available elsewhere (Adolescent Health Research Group, 2003, 2008; Clark et al., 2013; Fleming et al., 2020b; Rivera-Rodriguez et al., 2021). In brief, the surveys used a two-stage cluster design. In 2001, 2007 and 2012, schools throughout New Zealand with over 50 students in years 9–13 (secondary school) were randomly selected and invited to participate. Kura Kaupapa Māori (Māori-language immersion schools) were included from 2007, but sampling methods differed between waves, so Kura Kaupapa Māori are excluded from this analysis to ensure comparability.
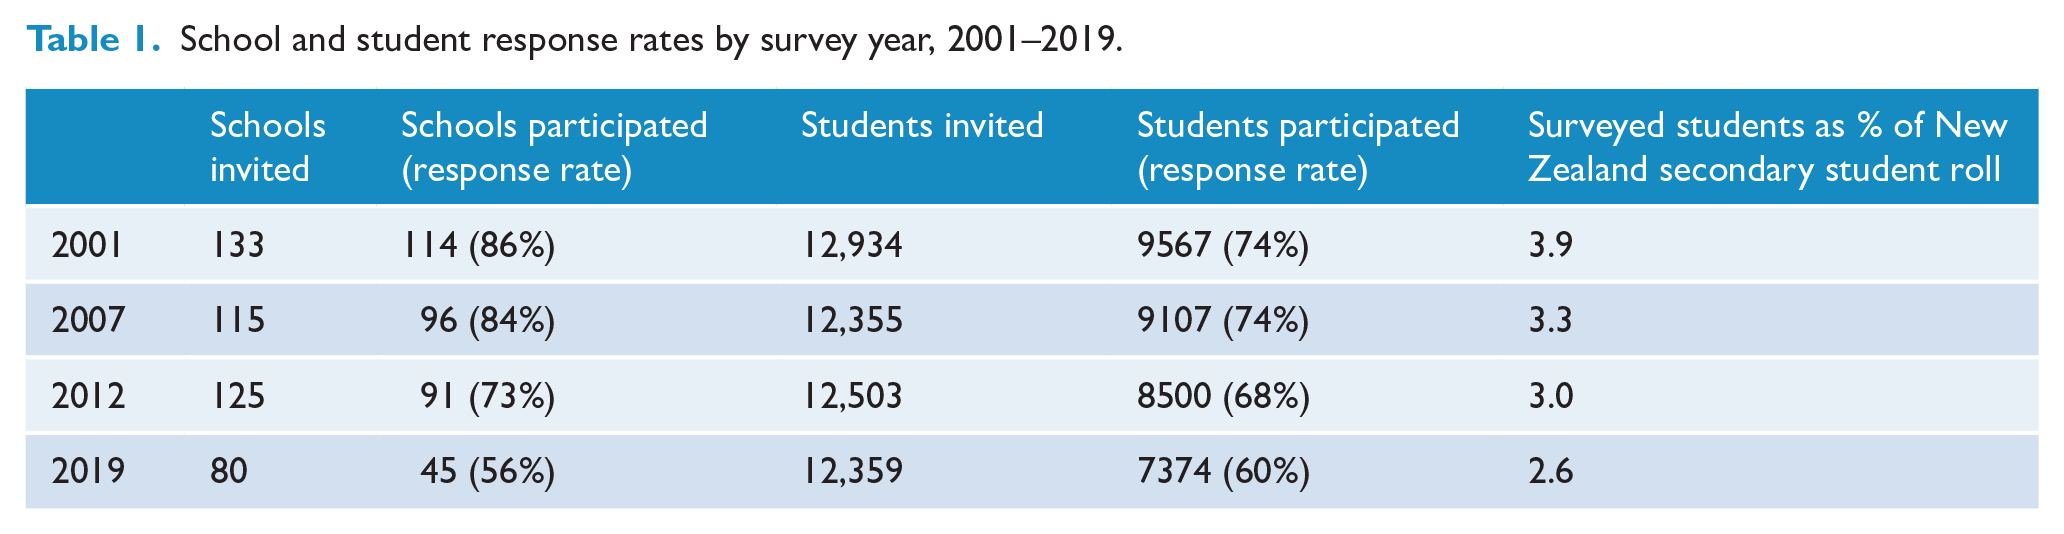
Youth19 used a regional sample. Schools with over 50 students in years 9–13 from the Northland, Auckland and Waikato regions of New Zealand were randomly selected. This area includes 47% of New Zealand’s secondary school population and is highly diverse in ethnicity, socioeconomic deprivation and population density (e.g. urban, small town, rural setting). Numbers and response rates of participating schools and students across survey waves are shown in Table 1.
School and student response rates by survey year, 2001–2019.
In all waves, in participating schools, parents and caregivers were given information about the survey and could opt for their child to be excluded. Non-excluded students were randomly selected from school rolls and gave their own consent. Surveys were delivered on laptop computers (2001) or handheld Internet tablets (from 2007) in te reo Māori (New Zealand’s Indigenous language) or English, with optional voiceover through headphones. The surveys used a branching design, so students only received questions that were relevant to them. From 2007, during the survey, students were invited to enter their main residential address into a standalone computer to identify their census meshblock number (neighbourhood area unit), which was later linked with their survey files.
Ethics approval for each survey was granted by The University of Auckland Human Subjects Ethics Committee (Youth19: #022244).
Measures
Single-item measures are shown in Table 2. Other measures are described below.
Youth2000 survey measures.
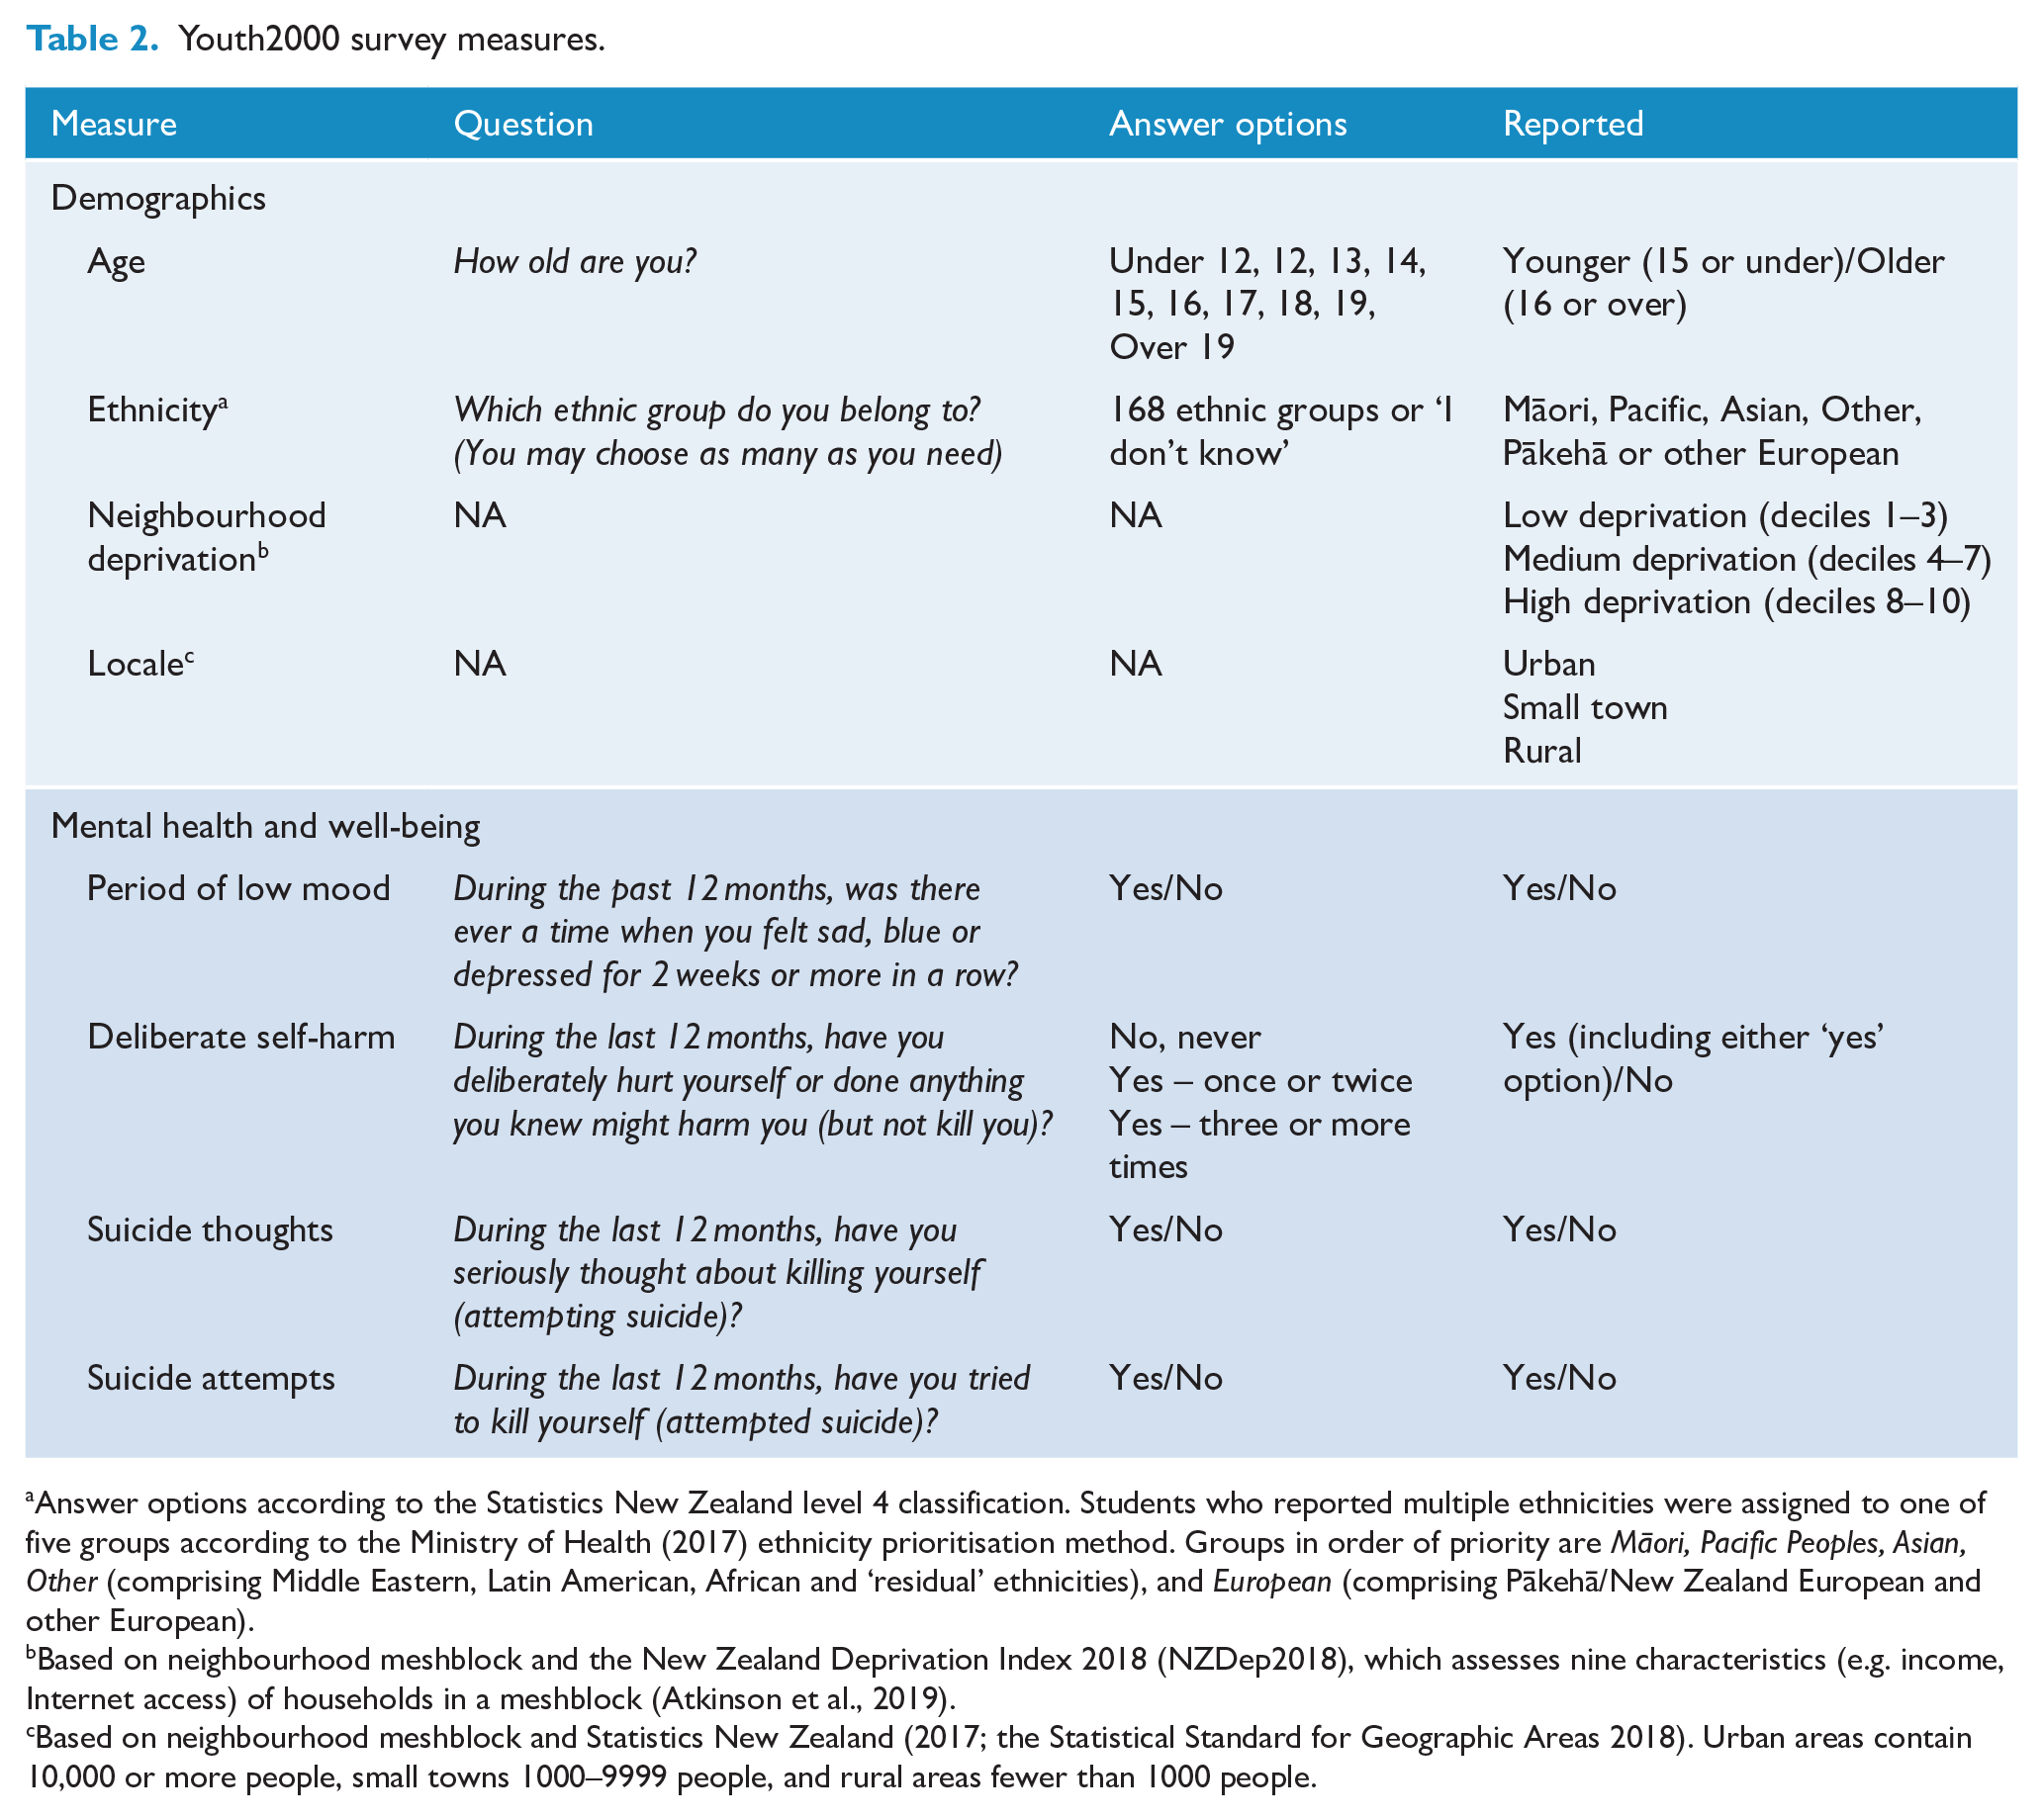
Answer options according to the Statistics New Zealand level 4 classification. Students who reported multiple ethnicities were assigned to one of five groups according to the Ministry of Health (2017) ethnicity prioritisation method. Groups in order of priority are Māori, Pacific Peoples, Asian, Other (comprising Middle Eastern, Latin American, African and ‘residual’ ethnicities), and European (comprising Pākehā/New Zealand European and other European).
Based on neighbourhood meshblock and the New Zealand Deprivation Index 2018 (NZDep2018), which assesses nine characteristics (e.g. income, Internet access) of households in a meshblock (Atkinson et al., 2019).
Based on neighbourhood meshblock and Statistics New Zealand (2017; the Statistical Standard for Geographic Areas 2018). Urban areas contain 10,000 or more people, small towns 1000–9999 people, and rural areas fewer than 1000 people.
Sex
In 2001, 2007 and 2012, students were asked What sex are you? (Male/female). The 2019 survey included more expansive response options around sex and gender. To enable trend comparison, we used sex at birth (male/female) where this could be identified, allowing the inclusion of transgender and non-binary participants. Results for the 63 students who did not report a male or female sex at birth in 2019 will be reported elsewhere, where contexts can be fully explored.
Statistical analysis
A data access proposal including the research question, selected variables, analysis plan and consideration for data sovereignty principles was approved as per Youth2000 policy (www.youth19.ac.nz/the-surveys). All analyses were completed using R 4.1.1 (R Core Team, 2021) and the survey package (v 1.1.1; Ellis and Schneider, 2022). Data were cleaned and weighted by the inverse probability of selection, and the variance of estimates was adjusted for a two-stage clustered and stratified survey design and calibrated for student age, sex and ethnicity to enable estimates representative of the national secondary school population (Rivera-Rodriguez et al., 2021). Missing data for individual items were not imputed.
Main analysis
We present percentages with 95% confidence intervals (CIs) for the prevalence of each outcome (overall and by sex, age, ethnicity and neighbourhood deprivation) in 2019 and other years where available. Mental health trends over earlier survey waves have been explored previously (Fleming et al., 2014), thus we explored changes between 2012 and 2019 using logistic regression. Adjusted odds ratios (ORs) are presented, showing the odds of each outcome in 2019 relative to 2012, adjusted for sex, age, ethnicity, neighbourhood deprivation and locale. A conservative p-value of <0.01 indicates statistically significant differences between waves.
Secondary analysis
To explore whether observed changes in national estimates were due to differences in the sampling frame between 2012 (national sample) and 2019 (regional sample), we ran a secondary analysis comparing mental health outcomes over time in the Auckland, Tai Tokerau and Waikato regions only (i.e. with no changes in the included region over the survey waves).
Results
In total, 34,548 secondary school students have participated in a Youth2000 survey, representing 2.6–3.9% of the New Zealand secondary school student population (see Table 1). Participants’ demographic characteristics are shown in Table 3.
Participant characteristics by survey year, 2001–2019.
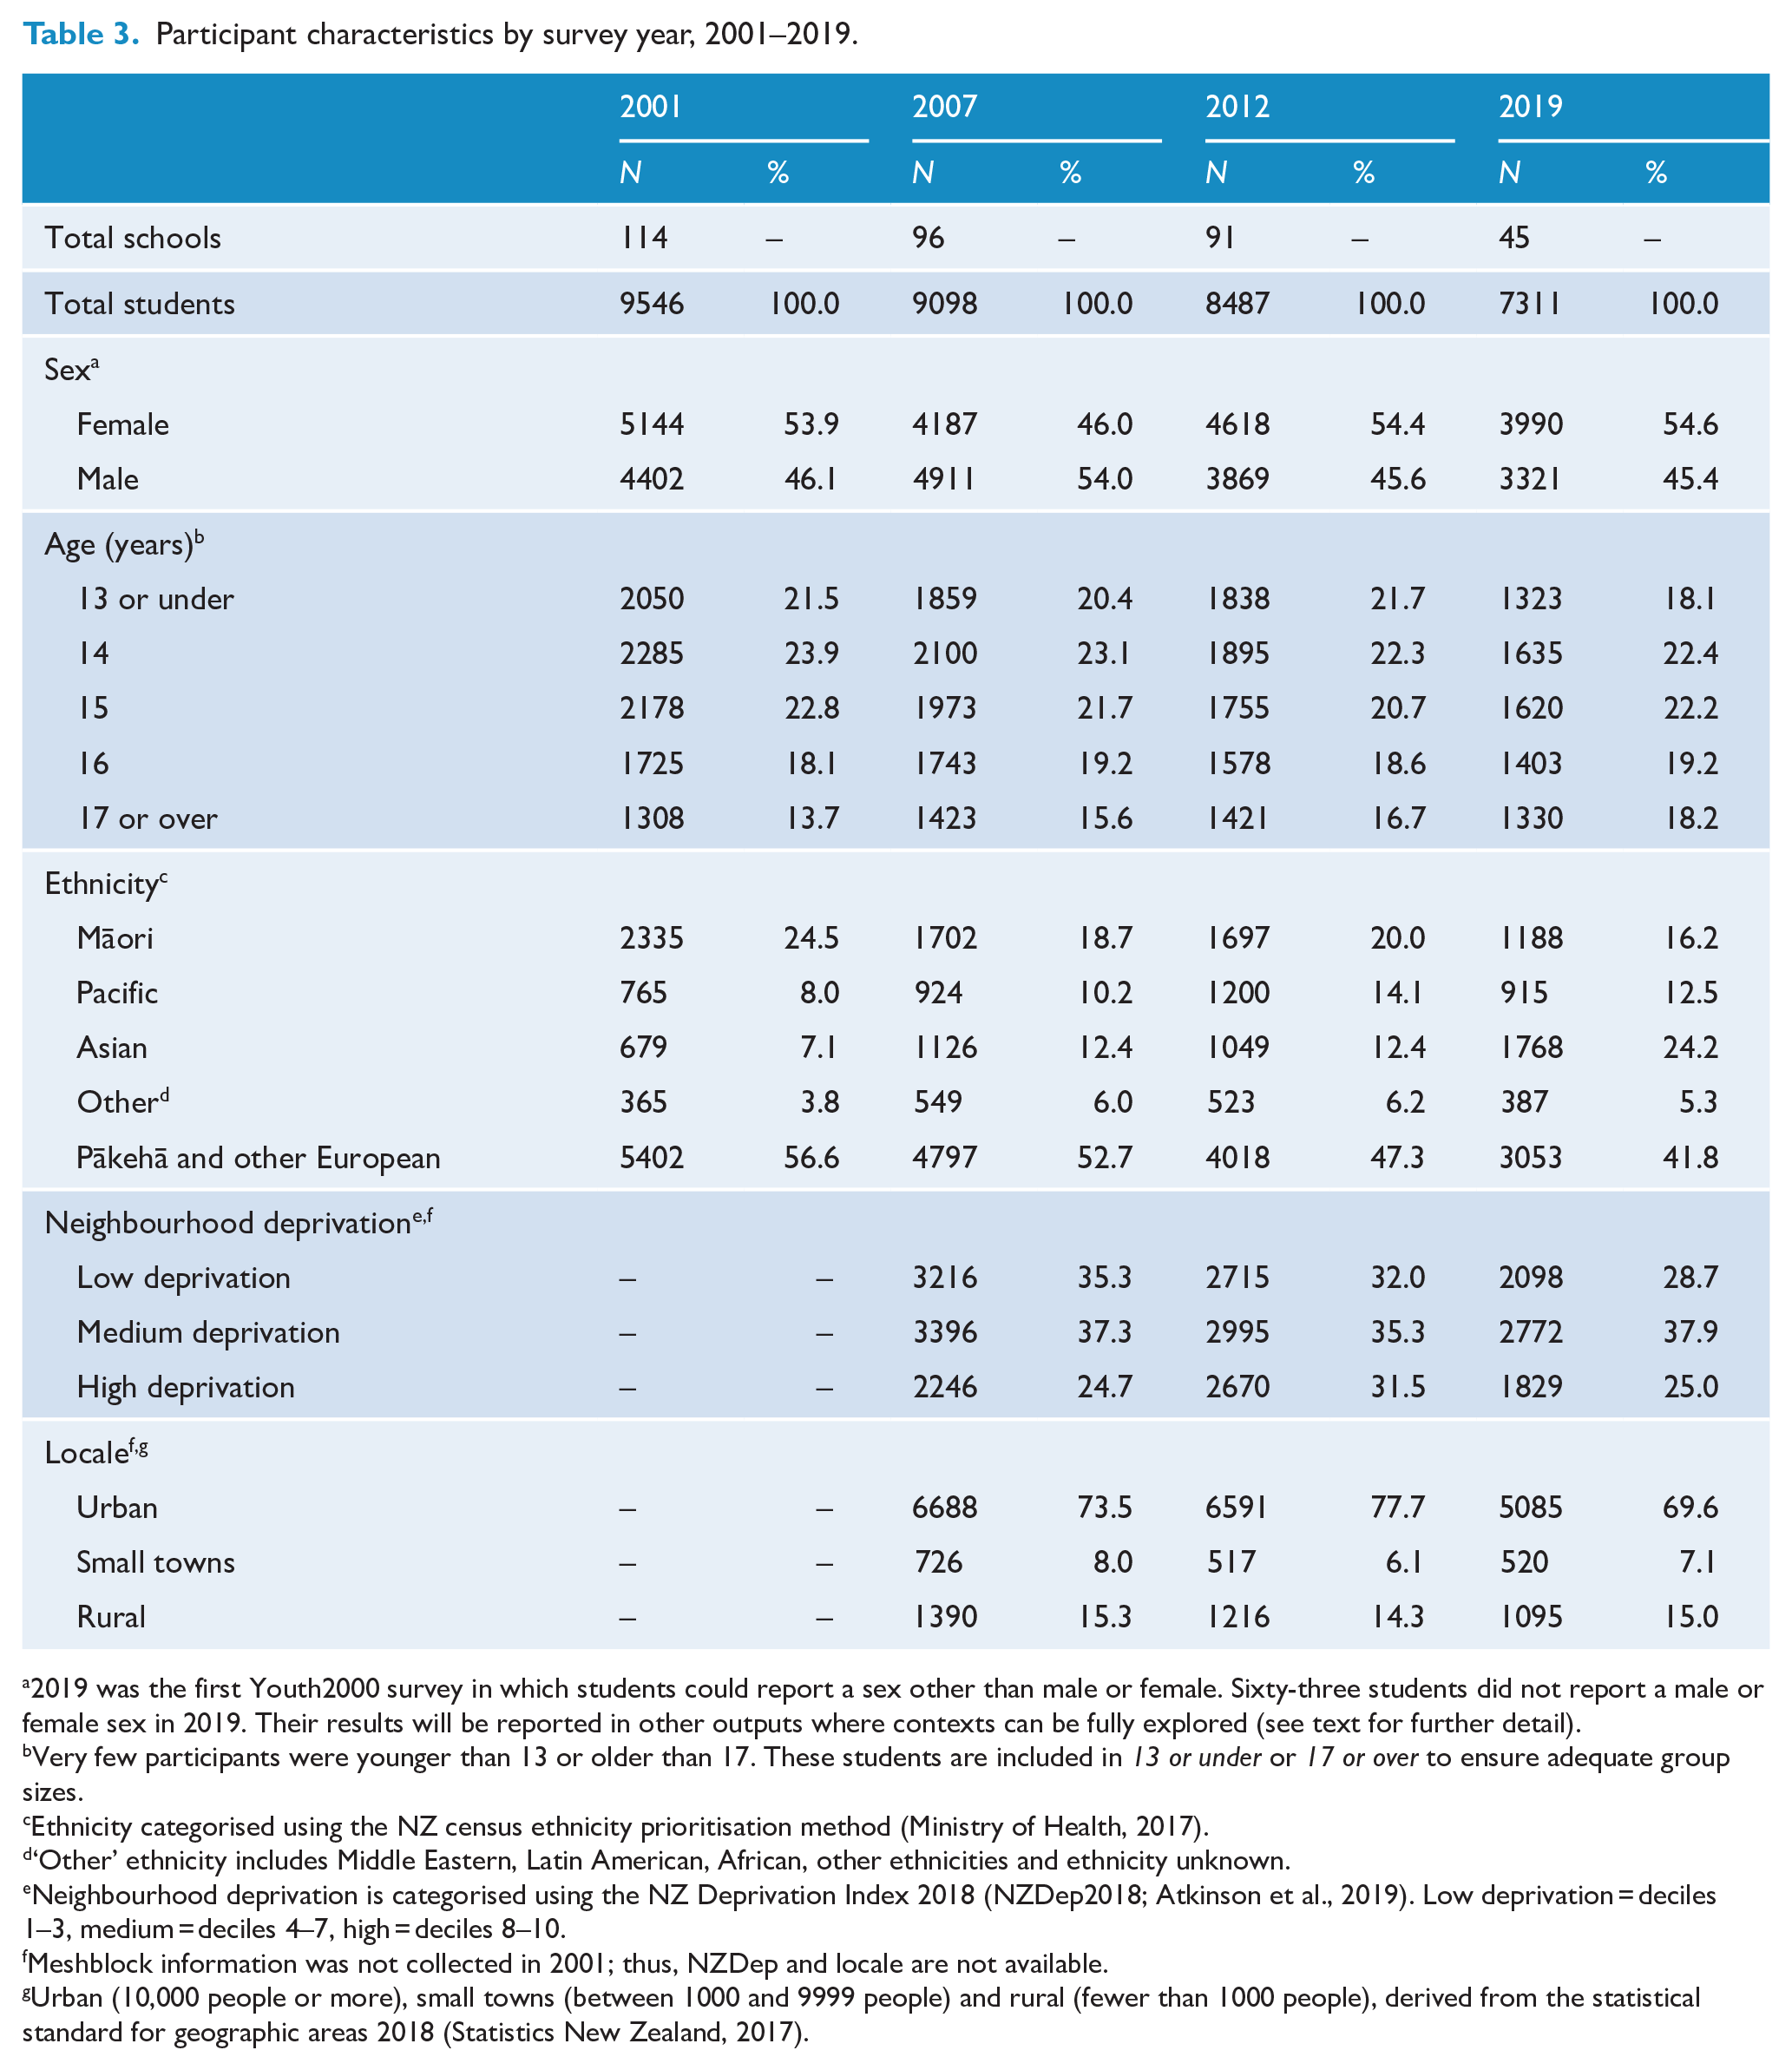
2019 was the first Youth2000 survey in which students could report a sex other than male or female. Sixty-three students did not report a male or female sex in 2019. Their results will be reported in other outputs where contexts can be fully explored (see text for further detail).
Very few participants were younger than 13 or older than 17. These students are included in 13 or under or 17 or over to ensure adequate group sizes.
Ethnicity categorised using the NZ census ethnicity prioritisation method (Ministry of Health, 2017).
‘Other’ ethnicity includes Middle Eastern, Latin American, African, other ethnicities and ethnicity unknown.
Neighbourhood deprivation is categorised using the NZ Deprivation Index 2018 (NZDep2018; Atkinson et al., 2019). Low deprivation = deciles 1–3, medium = deciles 4–7, high = deciles 8–10.
Meshblock information was not collected in 2001; thus, NZDep and locale are not available.
Urban (10,000 people or more), small towns (between 1000 and 9999 people) and rural (fewer than 1000 people), derived from the statistical standard for geographic areas 2018 (Statistics New Zealand, 2017).
Mental health indicators
The prevalence of mental health and well-being indicators for males and females in each survey wave is shown in Figure 1. The prevalence of variables in each survey wave and changes between 2012 and 2019 by sex, age, ethnicity and neighbourhood deprivation are shown in Tables 4–6. Key results are described below.
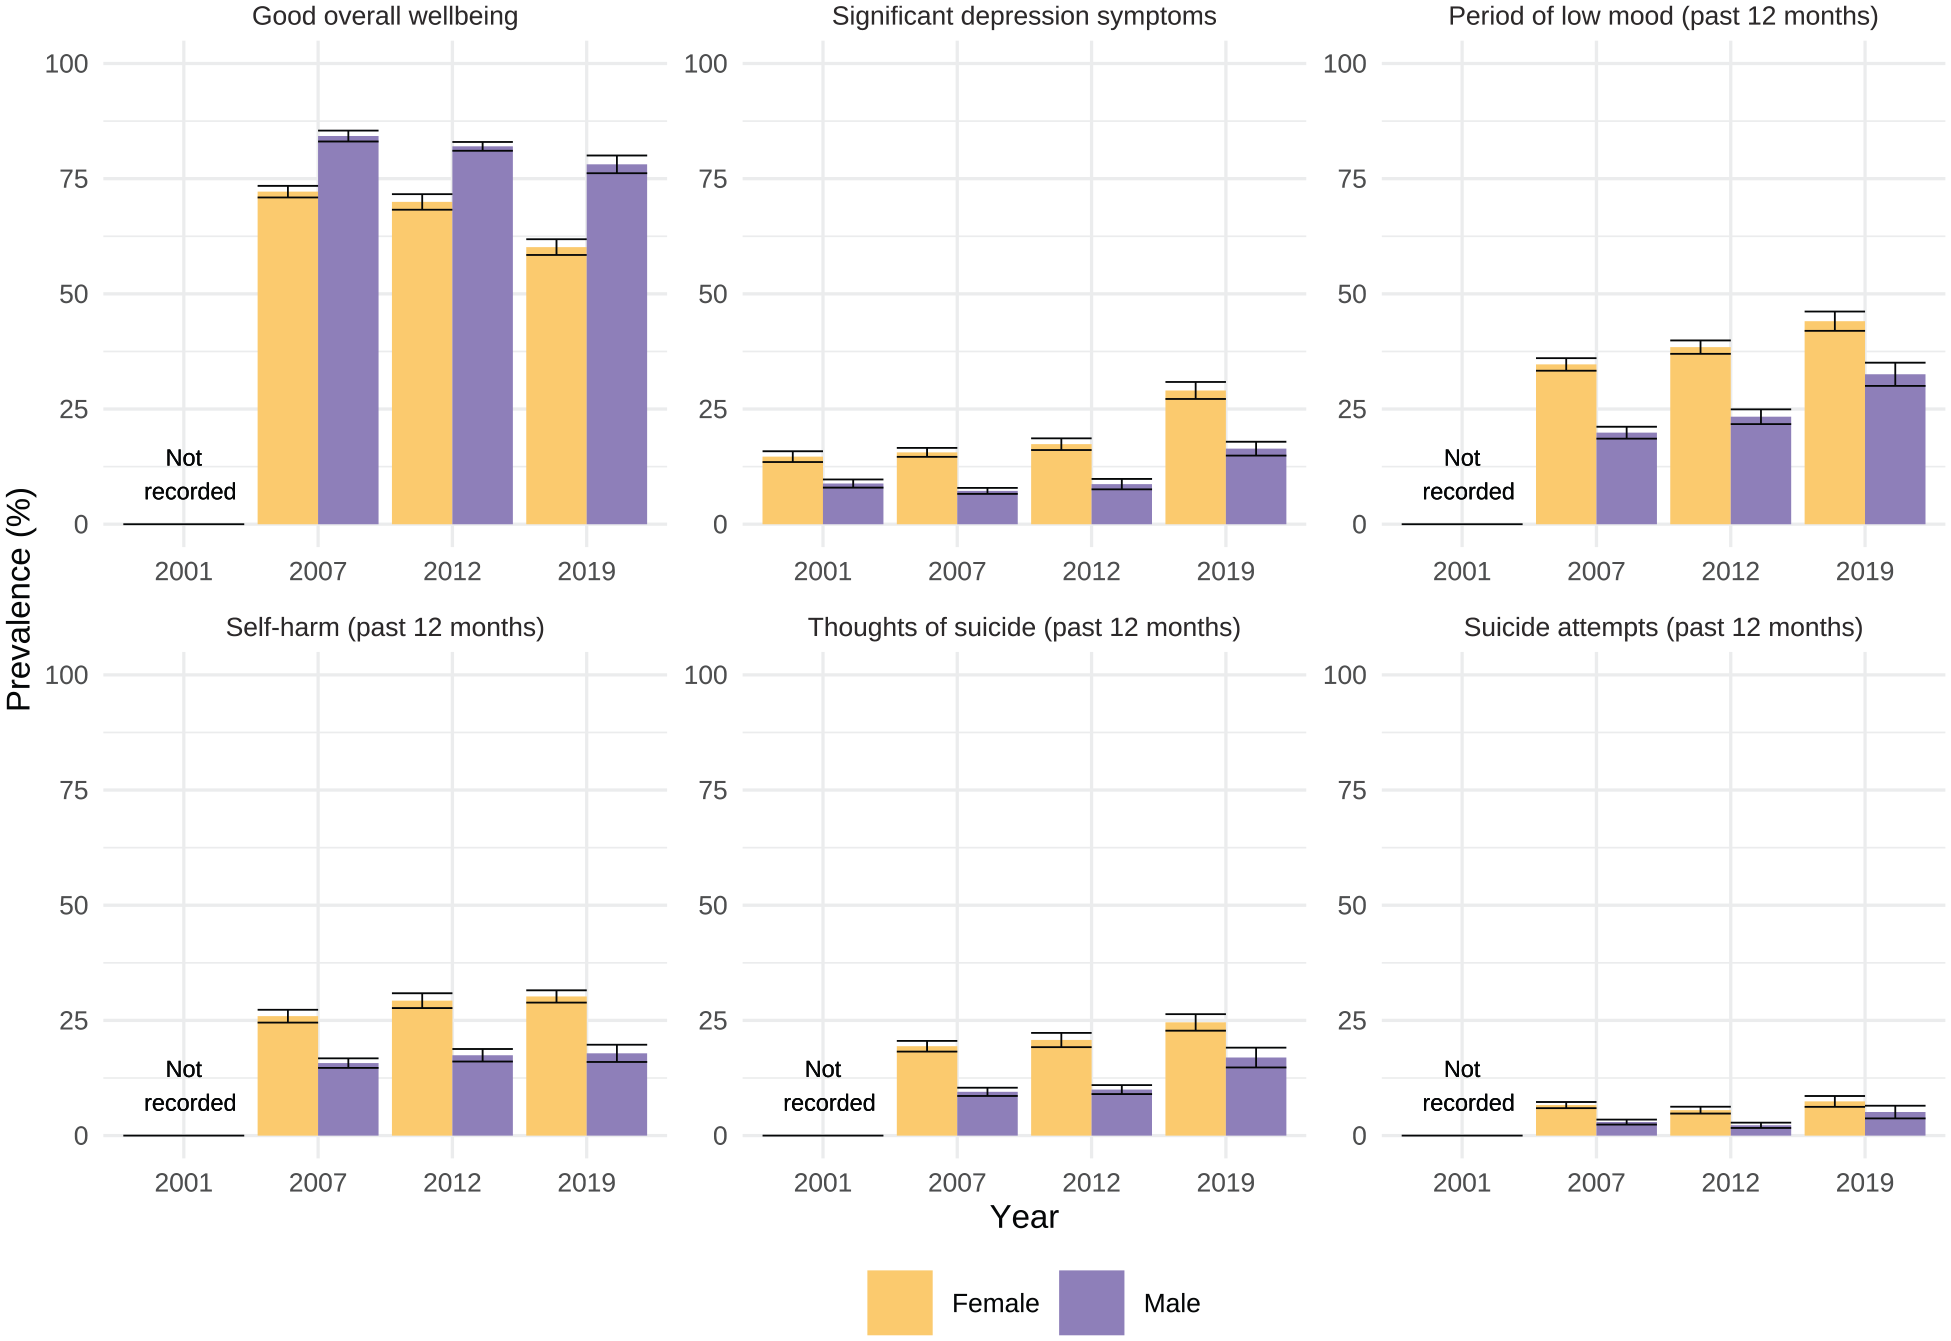
Prevalence of mental health indicators 2001, 2007, 2012 and 2019, by sex.
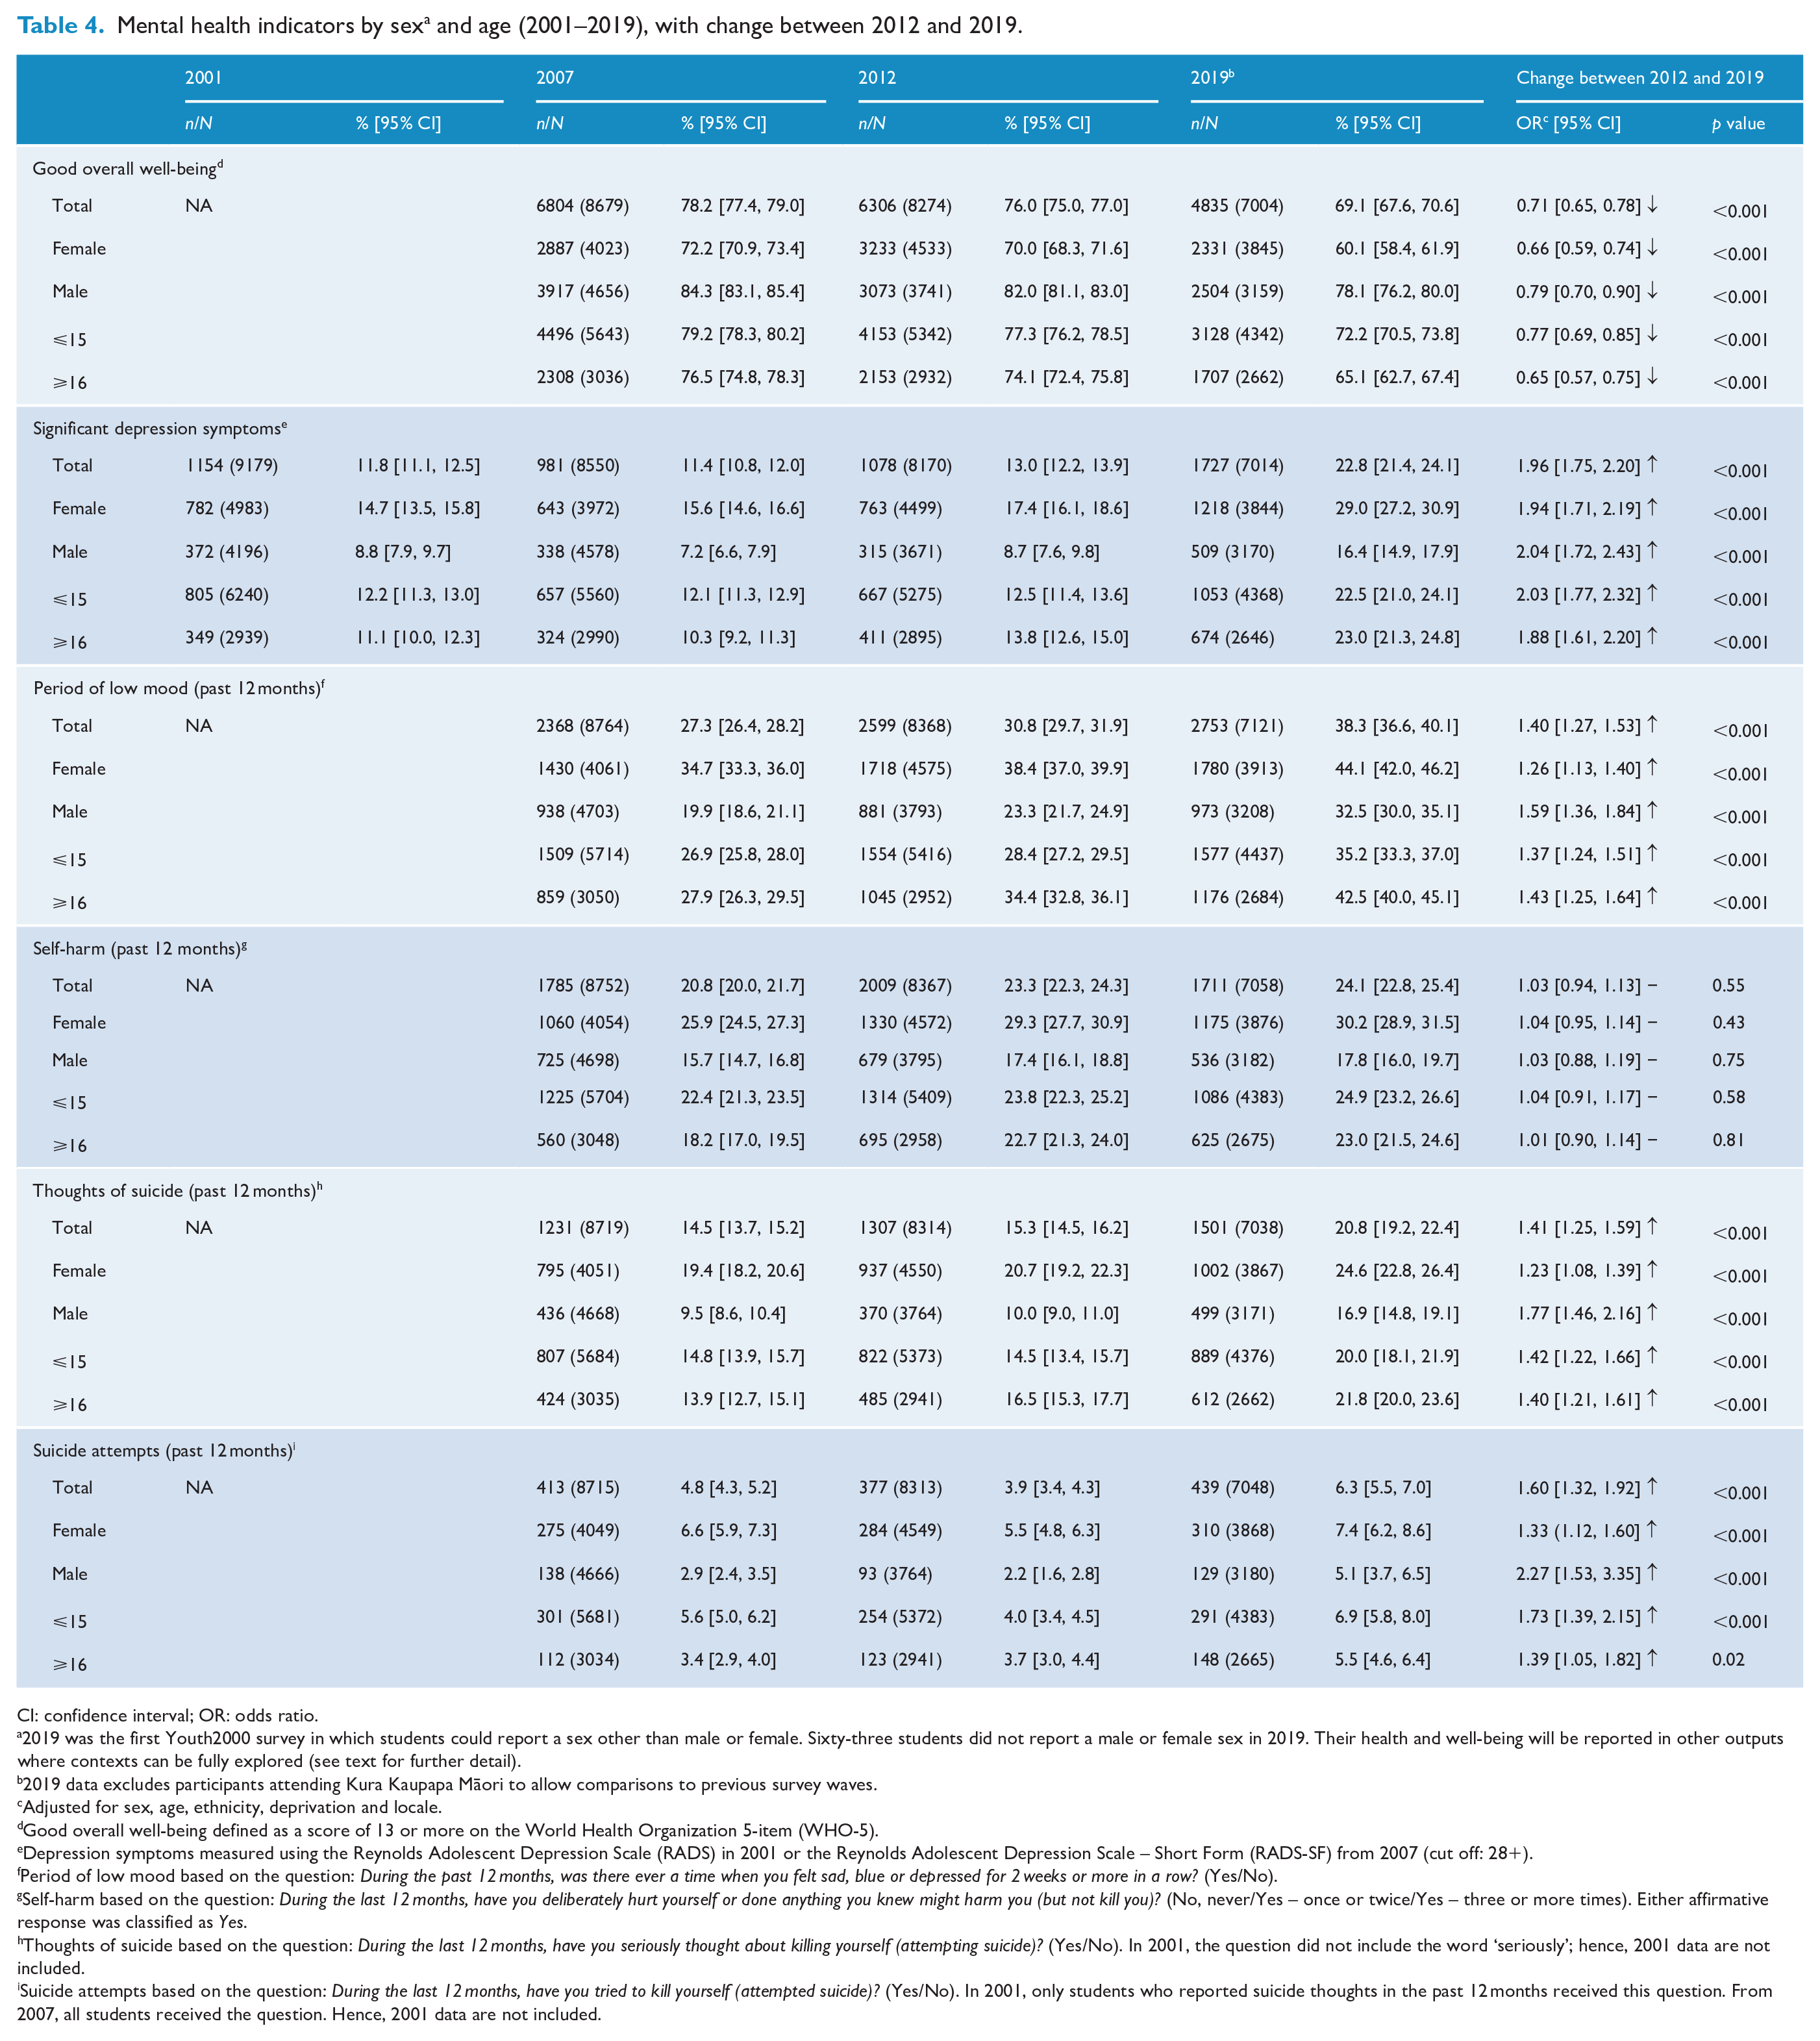
Mental health indicators by sex a and age (2001–2019), with change between 2012 and 2019.
CI: confidence interval; OR: odds ratio.
2019 was the first Youth2000 survey in which students could report a sex other than male or female. Sixty-three students did not report a male or female sex in 2019. Their health and well-being will be reported in other outputs where contexts can be fully explored (see text for further detail).
2019 data excludes participants attending Kura Kaupapa Māori to allow comparisons to previous survey waves.
Adjusted for sex, age, ethnicity, deprivation and locale.
Good overall well-being defined as a score of 13 or more on the World Health Organization 5-item (WHO-5).
Depression symptoms measured using the Reynolds Adolescent Depression Scale (RADS) in 2001 or the Reynolds Adolescent Depression Scale – Short Form (RADS-SF) from 2007 (cut off: 28+).
Period of low mood based on the question: During the past 12 months, was there ever a time when you felt sad, blue or depressed for 2 weeks or more in a row? (Yes/No).
Self-harm based on the question: During the last 12 months, have you deliberately hurt yourself or done anything you knew might harm you (but not kill you)? (No, never/Yes – once or twice/Yes – three or more times). Either affirmative response was classified as Yes.
Thoughts of suicide based on the question: During the last 12 months, have you seriously thought about killing yourself (attempting suicide)? (Yes/No). In 2001, the question did not include the word ‘seriously’; hence, 2001 data are not included.
Suicide attempts based on the question: During the last 12 months, have you tried to kill yourself (attempted suicide)? (Yes/No). In 2001, only students who reported suicide thoughts in the past 12 months received this question. From 2007, all students received the question. Hence, 2001 data are not included.
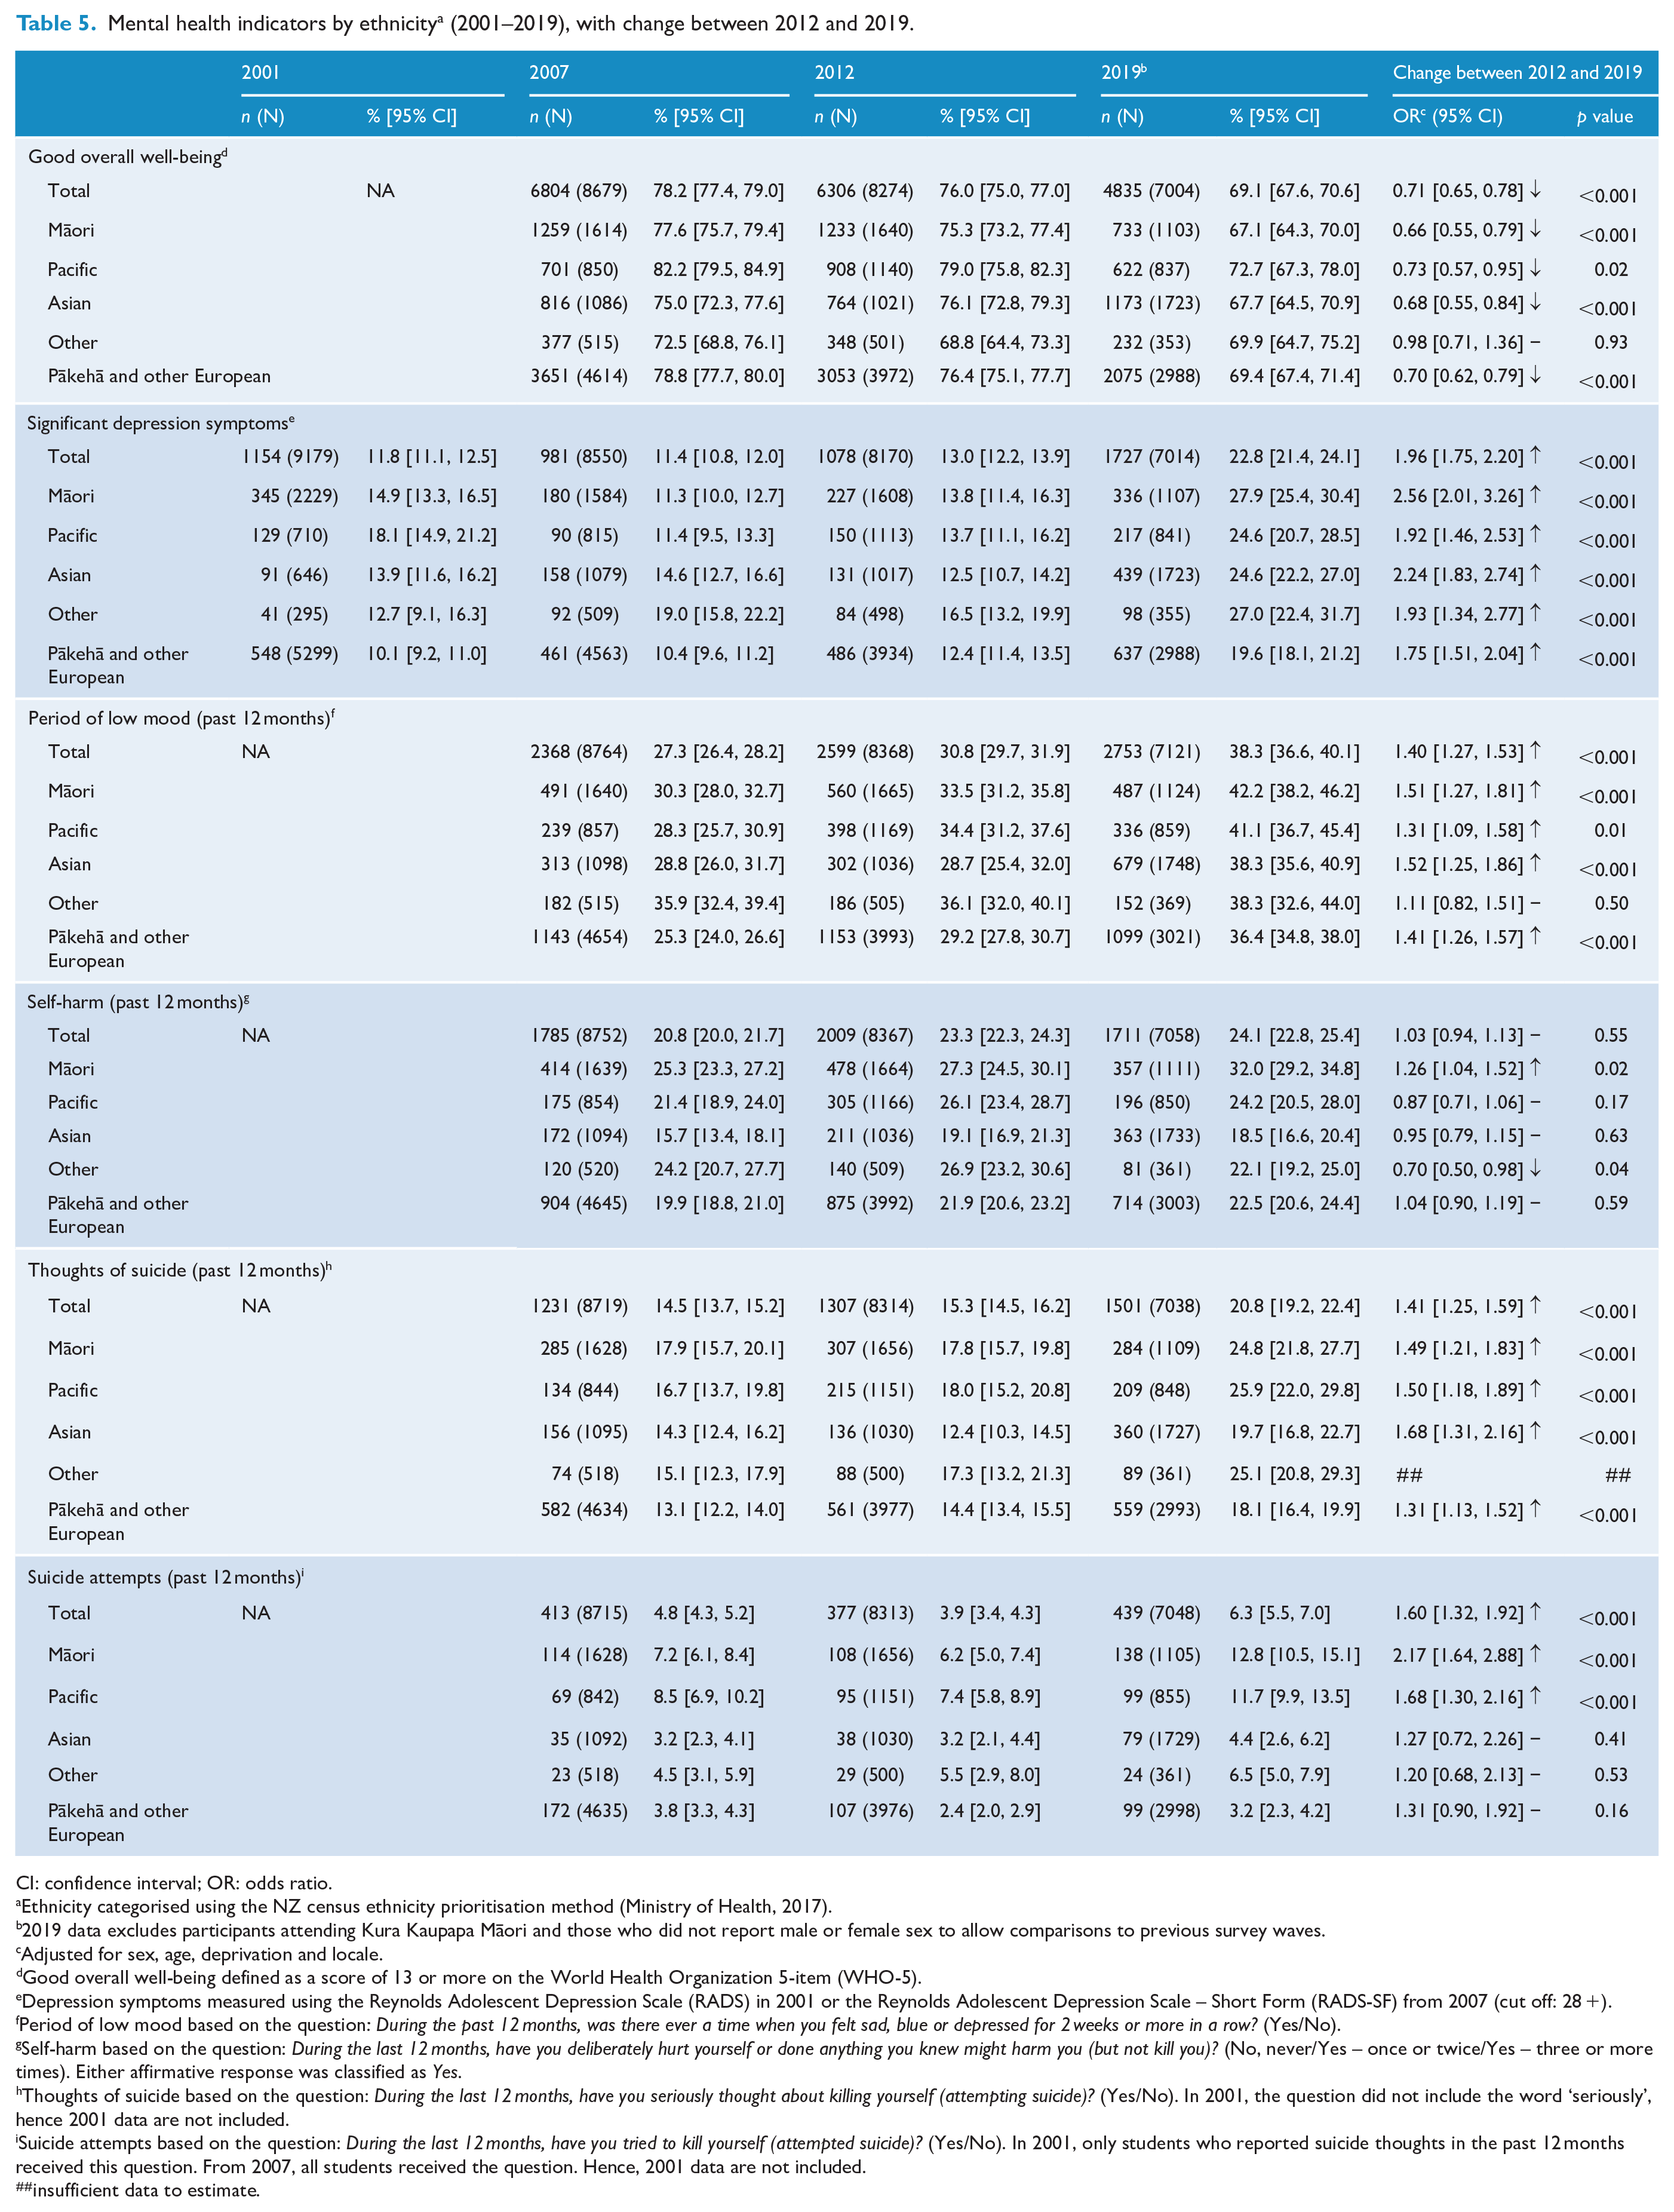
Mental health indicators by ethnicity a (2001–2019), with change between 2012 and 2019.
CI: confidence interval; OR: odds ratio.
Ethnicity categorised using the NZ census ethnicity prioritisation method (Ministry of Health, 2017).
2019 data excludes participants attending Kura Kaupapa Māori and those who did not report male or female sex to allow comparisons to previous survey waves.
Adjusted for sex, age, deprivation and locale.
Good overall well-being defined as a score of 13 or more on the World Health Organization 5-item (WHO-5).
Depression symptoms measured using the Reynolds Adolescent Depression Scale (RADS) in 2001 or the Reynolds Adolescent Depression Scale – Short Form (RADS-SF) from 2007 (cut off: 28 +).
Period of low mood based on the question: During the past 12 months, was there ever a time when you felt sad, blue or depressed for 2 weeks or more in a row? (Yes/No).
Self-harm based on the question: During the last 12 months, have you deliberately hurt yourself or done anything you knew might harm you (but not kill you)? (No, never/Yes – once or twice/Yes – three or more times). Either affirmative response was classified as Yes.
Thoughts of suicide based on the question: During the last 12 months, have you seriously thought about killing yourself (attempting suicide)? (Yes/No). In 2001, the question did not include the word ‘seriously’, hence 2001 data are not included.
Suicide attempts based on the question: During the last 12 months, have you tried to kill yourself (attempted suicide)? (Yes/No). In 2001, only students who reported suicide thoughts in the past 12 months received this question. From 2007, all students received the question. Hence, 2001 data are not included.
insufficient data to estimate.
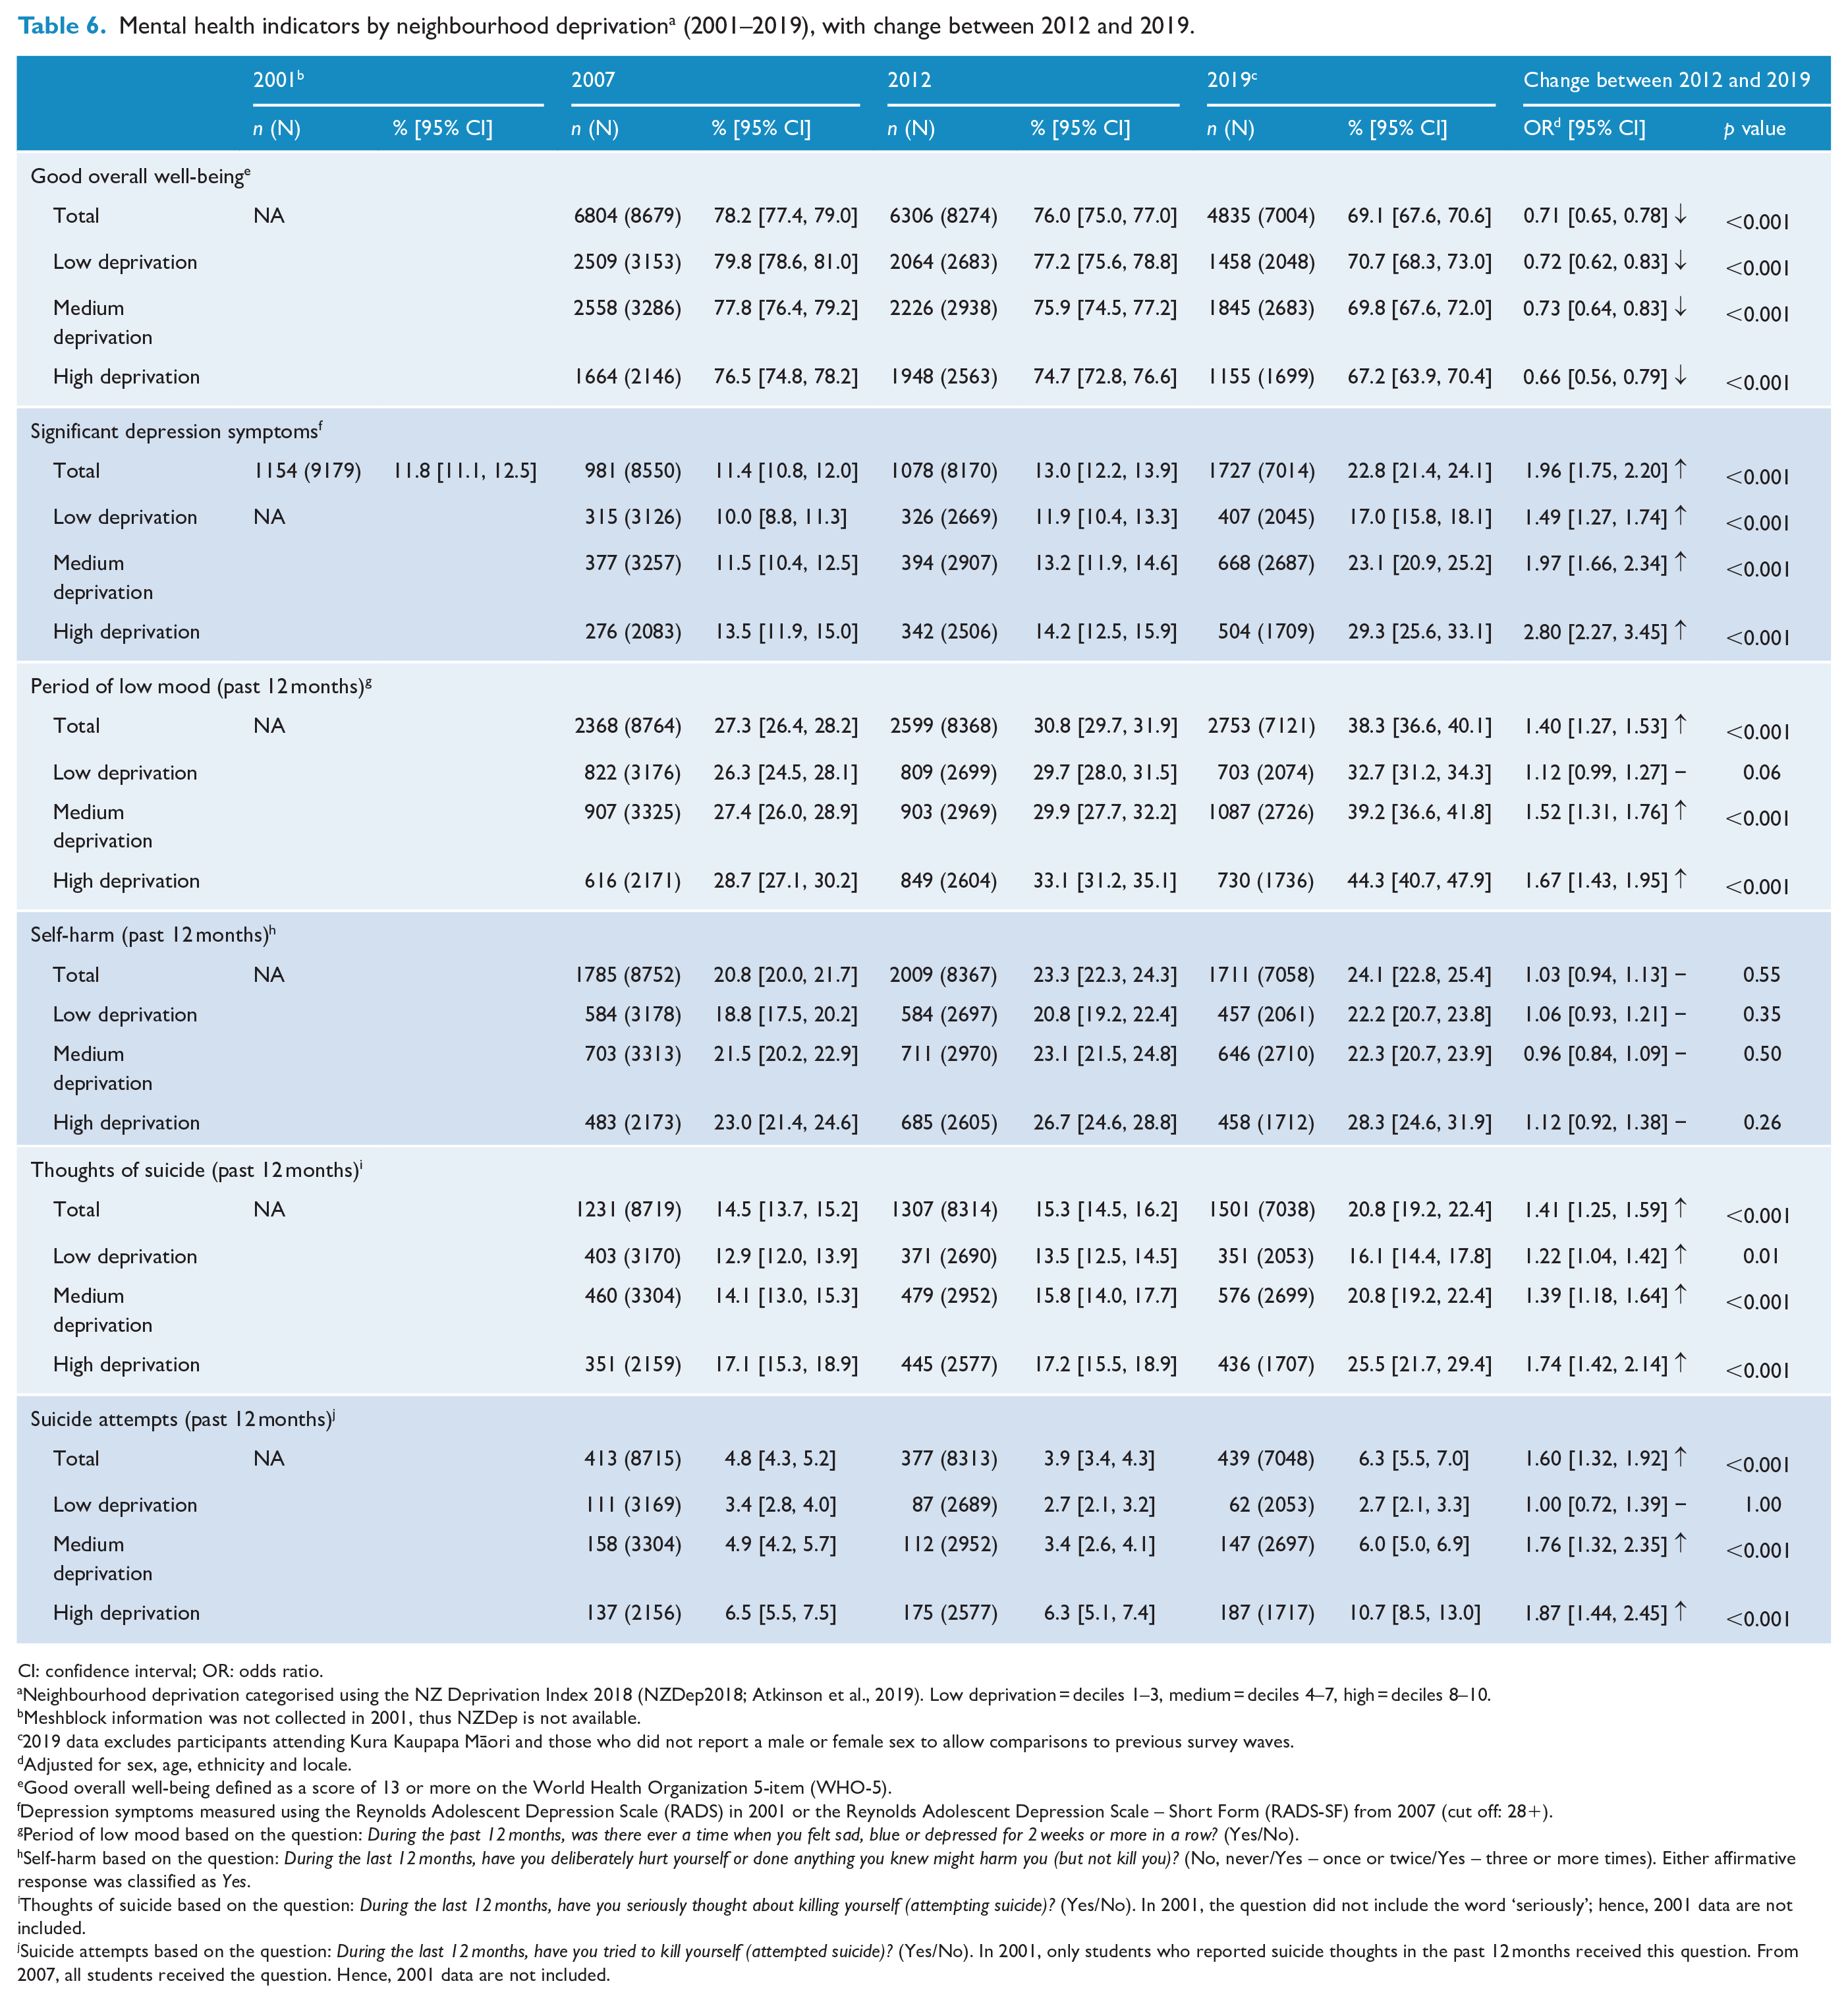
Mental health indicators by neighbourhood deprivation a (2001–2019), with change between 2012 and 2019.
CI: confidence interval; OR: odds ratio.
Neighbourhood deprivation categorised using the NZ Deprivation Index 2018 (NZDep2018; Atkinson et al., 2019). Low deprivation = deciles 1–3, medium = deciles 4–7, high = deciles 8–10.
Meshblock information was not collected in 2001, thus NZDep is not available.
2019 data excludes participants attending Kura Kaupapa Māori and those who did not report a male or female sex to allow comparisons to previous survey waves.
Adjusted for sex, age, ethnicity and locale.
Good overall well-being defined as a score of 13 or more on the World Health Organization 5-item (WHO-5).
Depression symptoms measured using the Reynolds Adolescent Depression Scale (RADS) in 2001 or the Reynolds Adolescent Depression Scale – Short Form (RADS-SF) from 2007 (cut off: 28+).
Period of low mood based on the question: During the past 12 months, was there ever a time when you felt sad, blue or depressed for 2 weeks or more in a row? (Yes/No).
Self-harm based on the question: During the last 12 months, have you deliberately hurt yourself or done anything you knew might harm you (but not kill you)? (No, never/Yes – once or twice/Yes – three or more times). Either affirmative response was classified as Yes.
Thoughts of suicide based on the question: During the last 12 months, have you seriously thought about killing yourself (attempting suicide)? (Yes/No). In 2001, the question did not include the word ‘seriously’; hence, 2001 data are not included.
Suicide attempts based on the question: During the last 12 months, have you tried to kill yourself (attempted suicide)? (Yes/No). In 2001, only students who reported suicide thoughts in the past 12 months received this question. From 2007, all students received the question. Hence, 2001 data are not included.
Well-being
In 2019, 69.1% of students scored above the cut off for good well-being, which was more prevalent among males (78%, 95% CI = [76.2, 80.0]) than females (60%, 95% CI = [58.4, 61.9]) and among younger students (72%, 95% CI = [70.5, 73.8]) than older students (65%, 95% CI = [62.7, 67.4]) (Table 4). Differences in well-being among ethnic groups and neighbourhood deprivation bands were small, with overlapping 95% CIs (Tables 5 and 6).
The overall prevalence of good well-being declined substantially from 76% in 2012 to 69% in 2019 (OR 0.7), with declines similar across demographic groups, including sex (ORs for most groups, 0.7–0.8).
Depression symptoms
In 2019, 23% of students reported significant symptoms of depression, with marked demographic differences. Prevalence was higher among females (29%) than males (16%); higher among Māori (28%) and Other ethnic groups (27%) than European (20%; Pacific and Asian both 25%); and higher in high-deprivation neighbourhoods (29%; medium-deprivation 23%; low-deprivation 17%).
The prevalence of significant depression symptoms increased overall from 13% in 2012 to 23% in 2019 (OR = 2.0), with similar relative increases among males (9–16%, OR = 2.0), females (17–29%, OR = 1.9), older students (14–23%, OR = 1.9) and younger students (13–23%, OR = 2.0). The increase was statistically significant for all ethnic groups and deprivation bands, and particularly marked among Māori students (14–28%, OR = 2.6) and Asian students (13–25%, OR = 2.2) and students in high-deprivation neighbourhoods (14–29%, OR = 2.8).
Period of low mood
In 2019, 38% of students reported periods of low mood of 2 weeks or more, within the past year. Demographic differences were marked, with prevalence higher among females (44%) than males (33%) and higher among older (43%) than younger students (35%); higher among Māori (42%) and Pacific students (41%) than European (36%); and higher in both high-deprivation (44%) and medium-deprivation (39%) neighbourhoods than low-deprivation neighbourhoods (33%).
Period of low mood was more prevalent in 2019 than that in 2012 for almost all groups, with marked increases for males (23–33%, OR = 1.6; females 38–44% OR = 1.3), increases for all ethnic groups except Other, particularly among Asian students (29–38%, OR = 1.5), and increases in all deprivation bands, particularly high-deprivation (33–44%, OR = 1.7).
Self-harm
In 2019, 24% of students reported deliberate self-harm. Prevalence was particularly high among females (30%; males 18%), Māori (32%; Asian 19%, Other 22%, European 23%, Pacific 24%) and those in high-deprivation neighbourhoods (28%; medium- and low-deprivation both 22%). The prevalence of self-harm increased among Māori students between 2012 and 2019 (27–32%, OR = 1.3). Changes for other groups were not statistically significant.
Suicide thoughts
In 2019, 21% of students reported serious thoughts of suicide in the past year, with prevalence higher among females (25%) than males (17%); higher among Māori (25%), Other (25%) and Pacific students (26%) than European students (18%); and higher among those in high- (26%) and medium-deprivation neighbourhoods (21%) than those in low-deprivation neighbourhoods (16%).
Suicide thoughts were more prevalent for most demographic groups in 2019 than in 2012, with the odds of suicide thoughts increasing, particularly in males (10–17%, OR = 1.8; females 21–25%, OR = 1.2), increasing in both age groups (younger 15–20%, older 17–22%, both OR = 1.4) and across ethnic groups. There were large increases for Asian (12–20%, OR = 1.7), Pacific (18–26%, OR = 1.5) and Māori students (18–25%, OR = 1.5; European 14–18%, OR = 1.3) and those in high-deprivation neighbourhoods (17–26%, OR = 1.7; medium-deprivation 16–21%, OR = 1.4; low-deprivation 14–16%, OR = 1.2).
Suicide attempts
In 2019, 6.3% of students reported past-year suicide attempts, with prevalence higher among female students (7.4%; males 5.1%), Māori (12.8%) and Pacific students (11.7%; Other 6.5%, Asian 4.4%, European 3.2%) and those in high-deprivation neighbourhoods (10.7%; medium-deprivation 6%; low-deprivation 2.7%).
Suicide attempts were more prevalent in 2019 than 2012, with particularly marked increases among males (2.2–5.1%, OR = 2.3; females 5.5–7.4%, OR = 1.3), younger students (4.0–6.9%, OR = 1.7; older students 3.7–5.5%, OR = 1.4) and Māori (6.2–12.8%, OR = 2.2) and Pacific students (7.4–11.7%, OR = 1.7; changes in other ethnic groups were not statistically significant) and among those in high- (6.3–10.7%, OR = 1.9) and medium-deprivation (3.4–6.0%, OR = 1.8) neighbourhoods (no change observed in the low-deprivation group).
Percentage changes in mental health and well-being indicators between 2012 and 2019 are presented in Figures 2–4. The ORs described above and shown in Tables 4–6 highlight changes in the odds of indicators for each group.
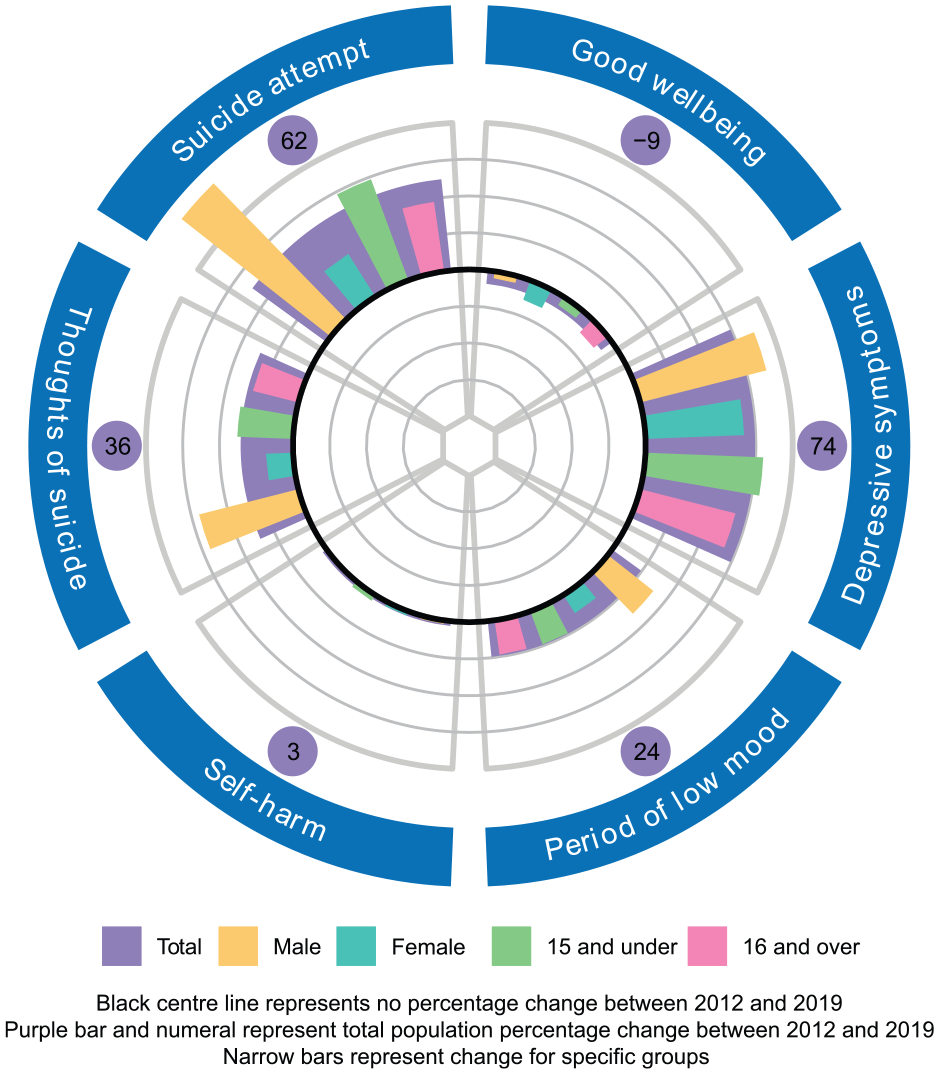
Prevalence change on mental health indicators 2012–2019, by age and sex.
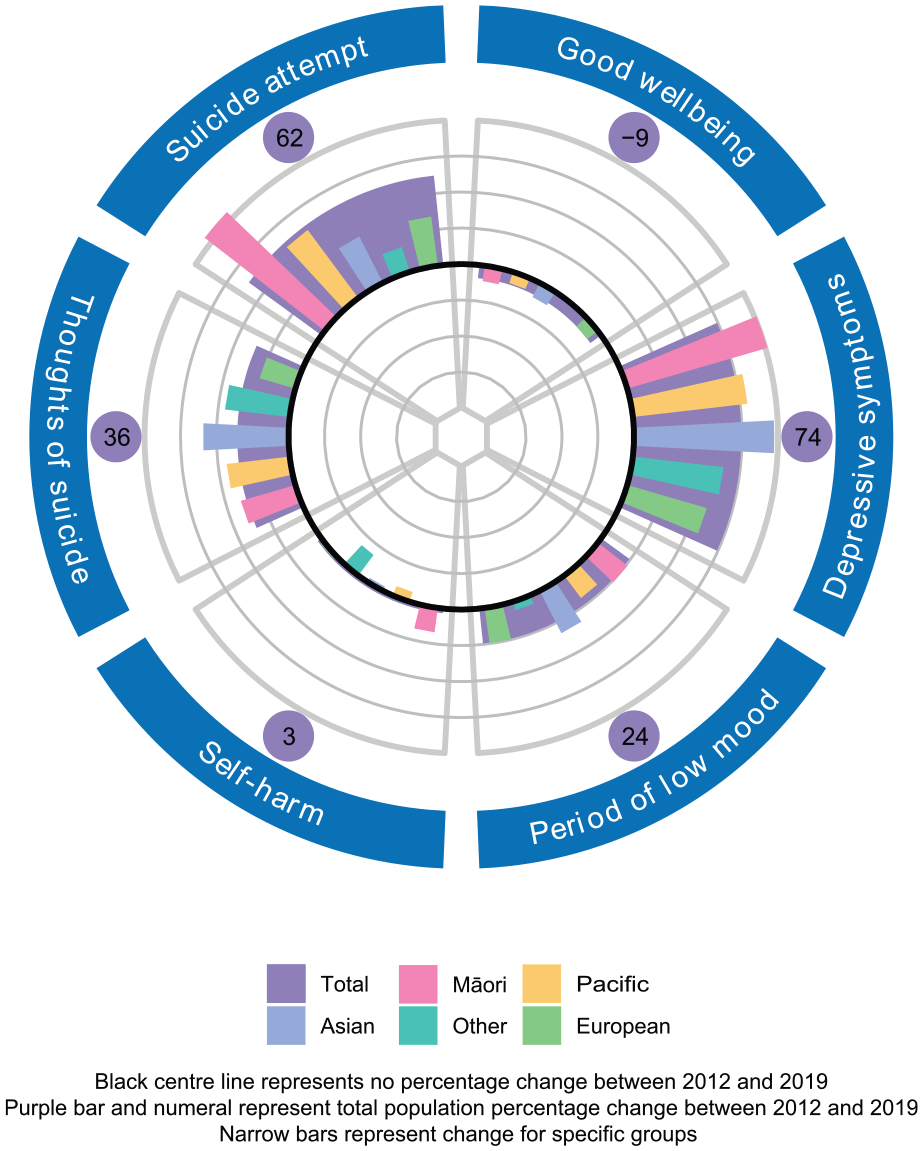
Prevalence change on mental health indicators 2012–2019, by ethnicity.
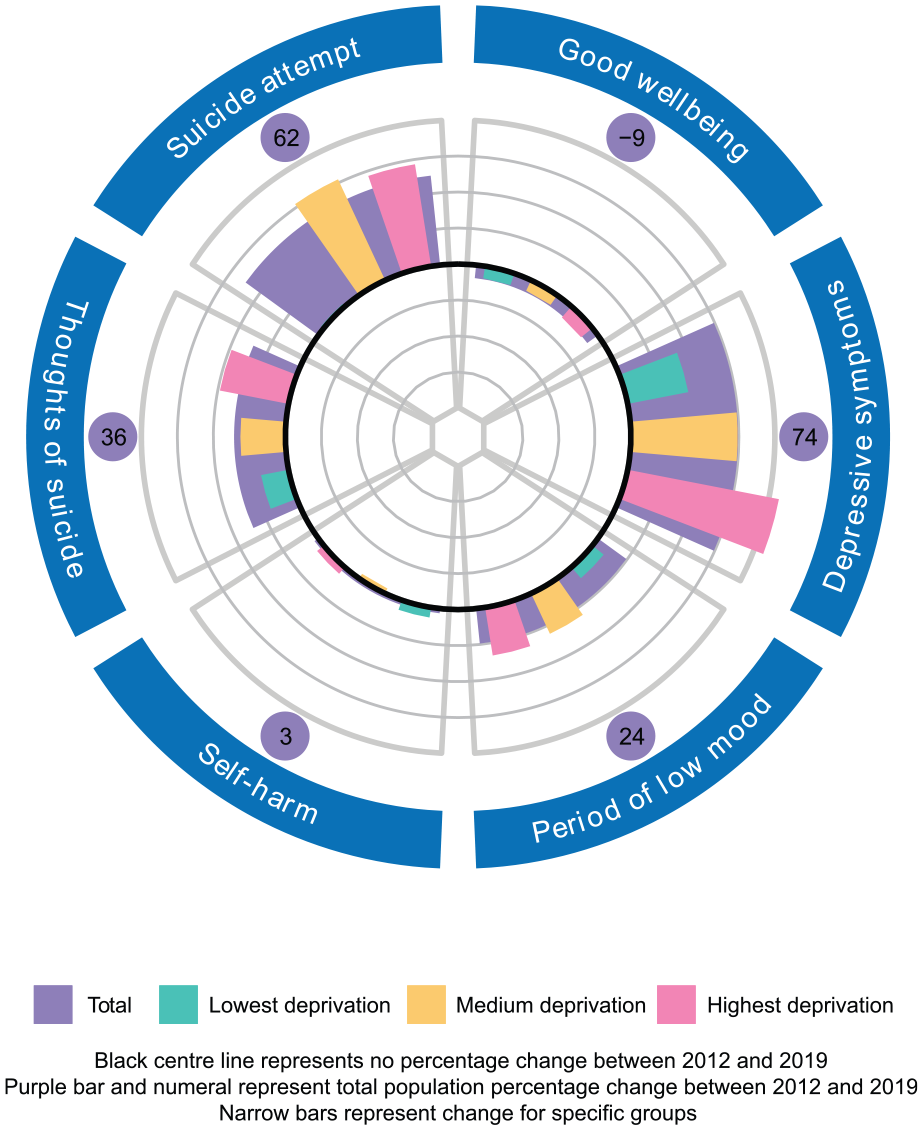
Prevalence change on mental health indicators 2012–2019, by neighbourhood deprivation.
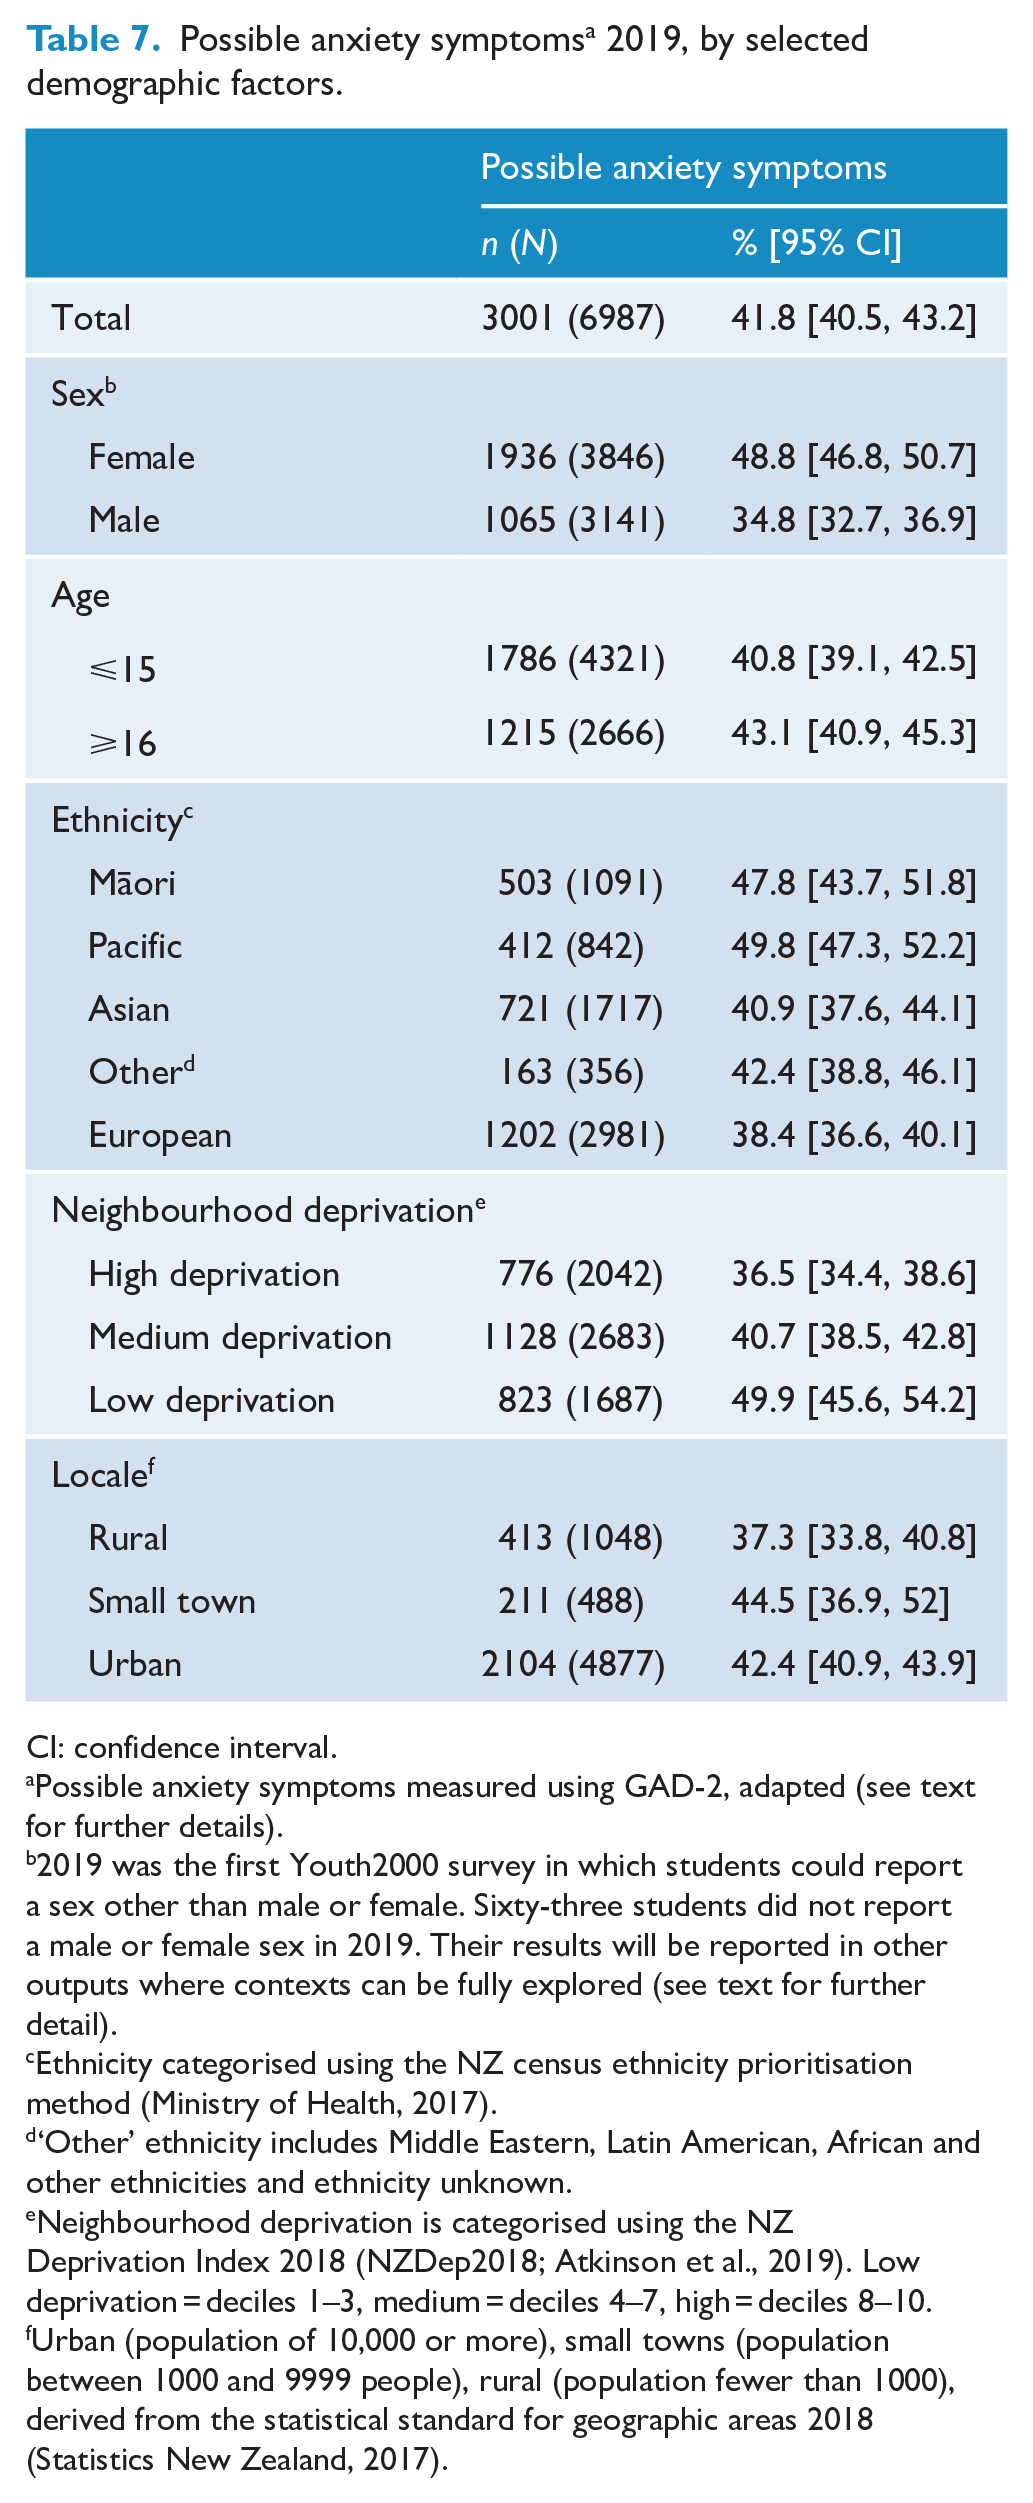
Possible anxiety symptoms were measured in 2019 only (Table 7). Overall, 42% of students scored at or above the cut off on this measure. Prevalence was particularly high among females (49%; males 35%), Māori (48%) and Pacific students (50%; European 38%), and those in high-deprivation neighbourhoods (50%; medium-deprivation 40%, low-deprivation 37%).
Possible anxiety symptoms a 2019, by selected demographic factors.
CI: confidence interval.
Possible anxiety symptoms measured using GAD-2, adapted (see text for further details).
2019 was the first Youth2000 survey in which students could report a sex other than male or female. Sixty-three students did not report a male or female sex in 2019. Their results will be reported in other outputs where contexts can be fully explored (see text for further detail).
Ethnicity categorised using the NZ census ethnicity prioritisation method (Ministry of Health, 2017).
‘Other’ ethnicity includes Middle Eastern, Latin American, African and other ethnicities and ethnicity unknown.
Neighbourhood deprivation is categorised using the NZ Deprivation Index 2018 (NZDep2018; Atkinson et al., 2019). Low deprivation = deciles 1–3, medium = deciles 4–7, high = deciles 8–10.
Urban (population of 10,000 or more), small towns (population between 1000 and 9999 people), rural (population fewer than 1000), derived from the statistical standard for geographic areas 2018 (Statistics New Zealand, 2017).
Secondary analysis
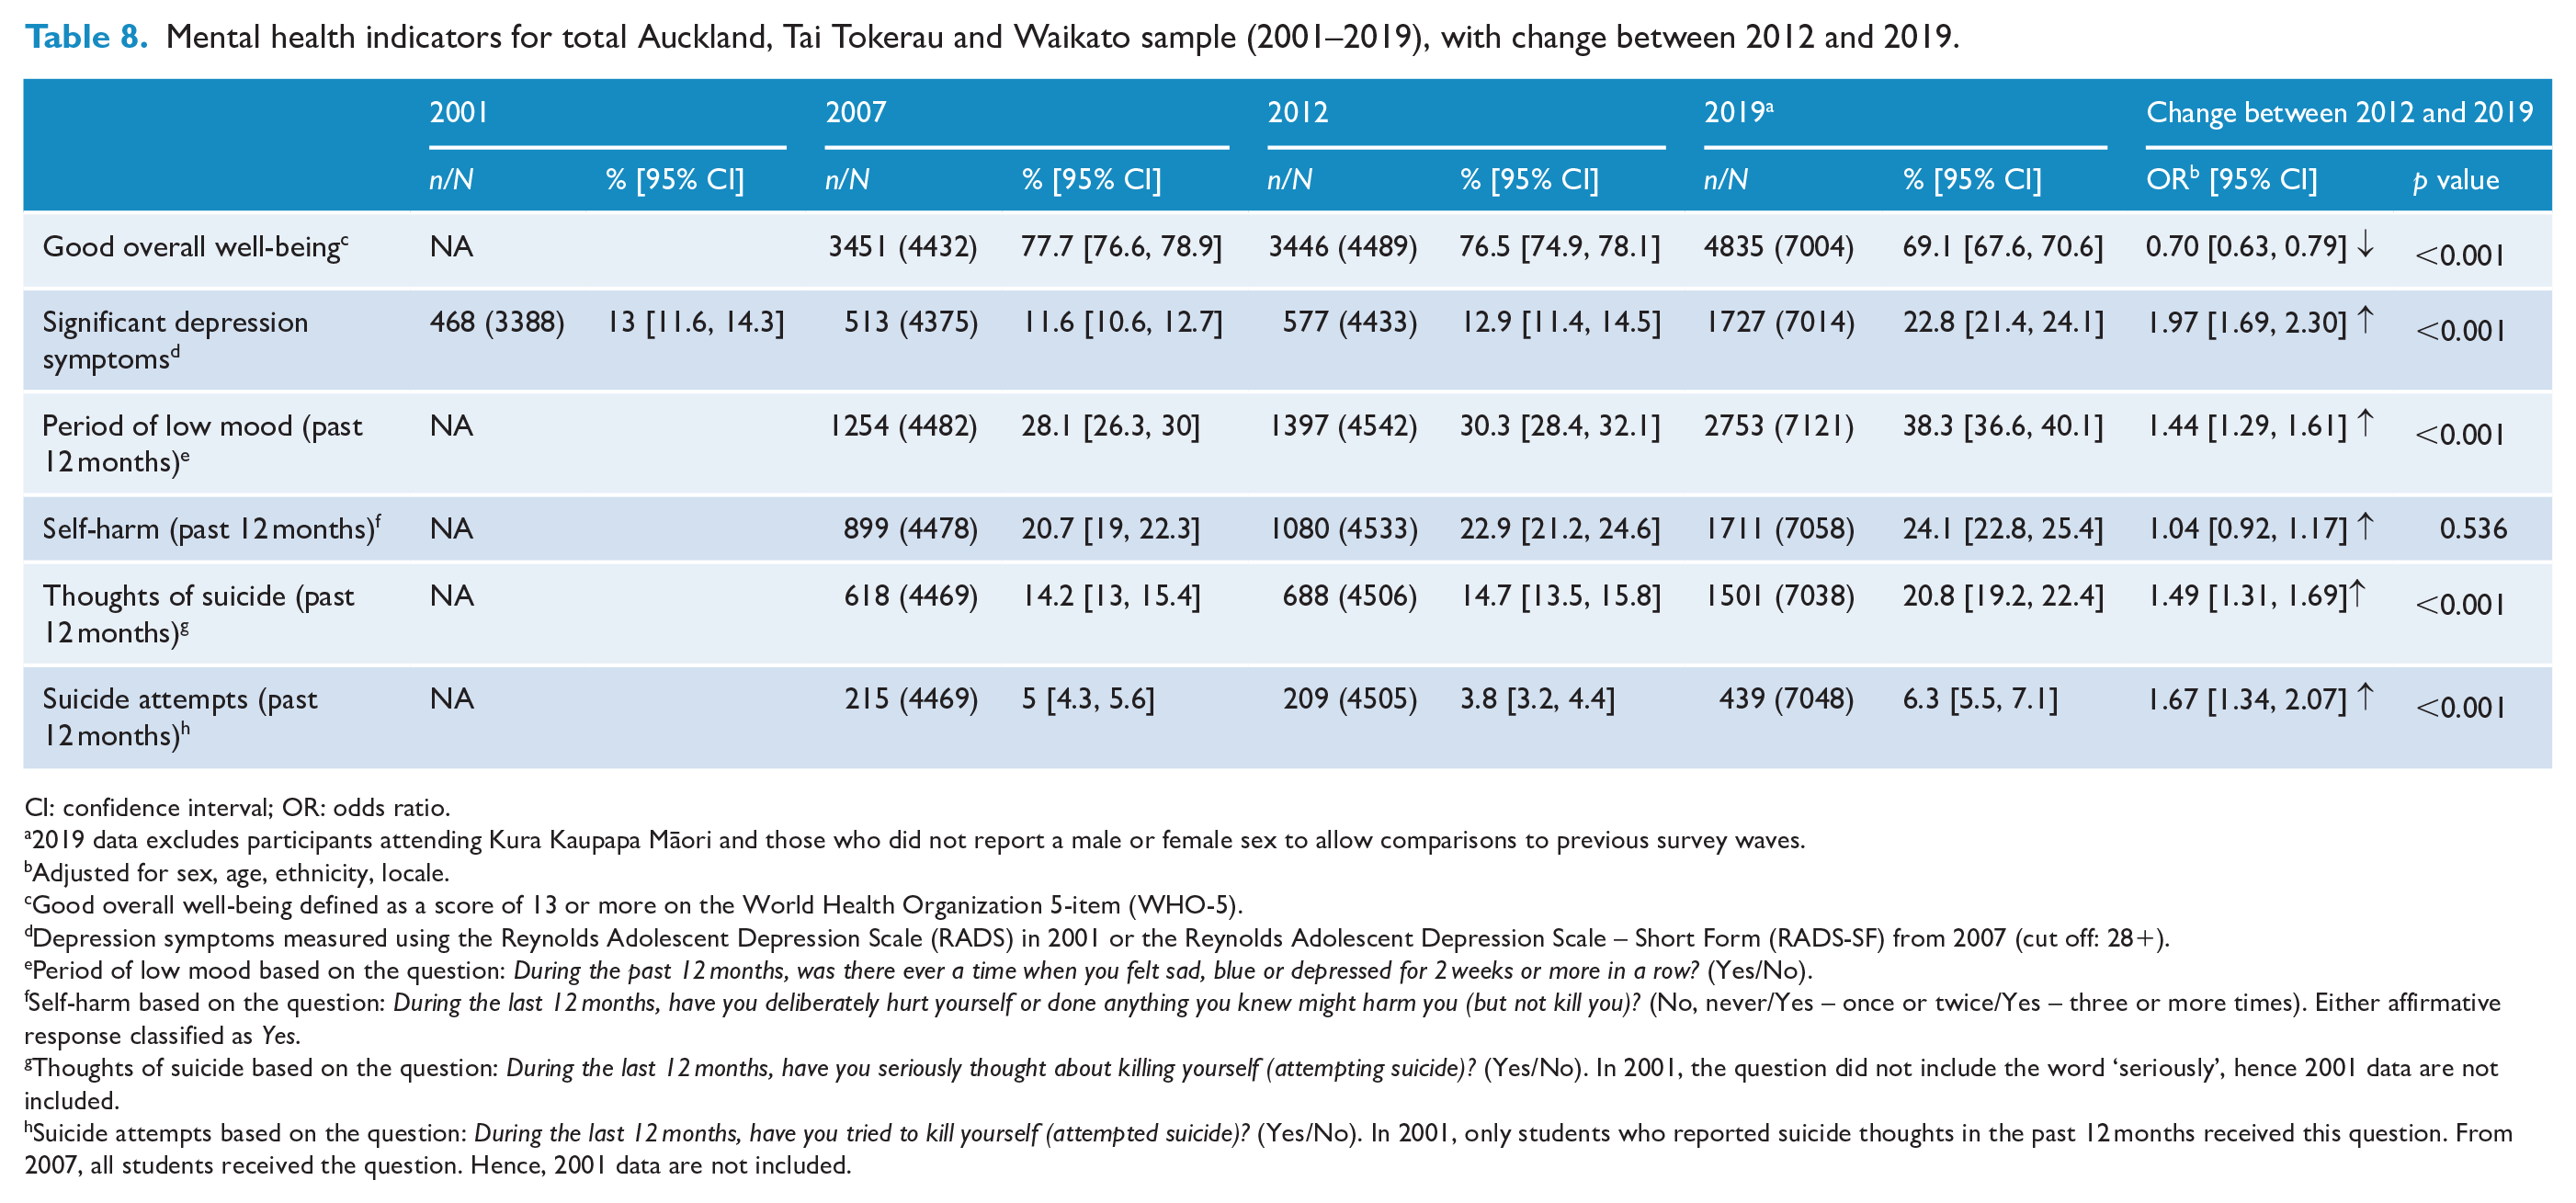
As shown in Table 8, the secondary analysis (reporting findings from the Auckland, Tai Tokerau and Waikato regions only) also identified large declines in mental health over the 2012 to 2019 period. Adjusted odds ratios did not differ substantially from those produced in the original analysis. For example, in the regional analysis, the OR describing changes in well-being between 2012 and 2019 for the total population was 0.70 (compared to 0.71 for the primary analysis), the OR for depression symptoms was 1.97 (1.96 for the primary analysis) and the OR for suicide attempts was 1.67 (1.60 for the primary analysis). These findings suggest that the increase in distress observed in the primary analysis is not an artefact of methodological differences between 2012 and 2019.
Mental health indicators for total Auckland, Tai Tokerau and Waikato sample (2001–2019), with change between 2012 and 2019.
CI: confidence interval; OR: odds ratio.
2019 data excludes participants attending Kura Kaupapa Māori and those who did not report a male or female sex to allow comparisons to previous survey waves.
Adjusted for sex, age, ethnicity, locale.
Good overall well-being defined as a score of 13 or more on the World Health Organization 5-item (WHO-5).
Depression symptoms measured using the Reynolds Adolescent Depression Scale (RADS) in 2001 or the Reynolds Adolescent Depression Scale – Short Form (RADS-SF) from 2007 (cut off: 28+).
Period of low mood based on the question: During the past 12 months, was there ever a time when you felt sad, blue or depressed for 2 weeks or more in a row? (Yes/No).
Self-harm based on the question: During the last 12 months, have you deliberately hurt yourself or done anything you knew might harm you (but not kill you)? (No, never/Yes – once or twice/Yes – three or more times). Either affirmative response classified as Yes.
Thoughts of suicide based on the question: During the last 12 months, have you seriously thought about killing yourself (attempting suicide)? (Yes/No). In 2001, the question did not include the word ‘seriously’, hence 2001 data are not included.
Suicide attempts based on the question: During the last 12 months, have you tried to kill yourself (attempted suicide)? (Yes/No). In 2001, only students who reported suicide thoughts in the past 12 months received this question. From 2007, all students received the question. Hence, 2001 data are not included.
Discussion
Summary of main findings
In this large-scale, representative survey series, we identified marked declines in mental health on key indicators for New Zealand secondary school students from 2012 to 2019, after relative stability from 2001 to 2012. Declines were dramatic, with the overall prevalence of depressive symptoms rising from 13% to 23% in this 7-year period. Declines were unevenly spread and were generally greater among Māori and Pacific students and those in lower socioeconomic neighbourhoods, resulting in increased inequity. The included indicators are self-reported and relate to well-being, anxiety, depression, periods of low mood, self-harm, suicide thoughts and suicide attempts. These findings from diverse population samples including detailed sub-group analyses form an important addition to the global and local adolescent mental health discourse.
Rangatahi Māori reported particularly high prevalence of all mental health indicators in both 2012 and 2019, with inequities widening over this period. Rangatahi Māori were the only ethnic group to report an increase in self-harm, and inequities for depression symptoms and suicide attempts were stark. Given Te Tiriti o Waitangi obligations and Aotearoa cross-government goals of improving equity for Māori, these findings highlight significant failures of the current system (Clark et al., 2022). Pacific students also reported high prevalence of depressive symptoms, suicide thoughts and suicide attempts in both 2012 and 2019, with large increases over the period. Almost all of the observed increase in prevalence of suicide attempts in the total population could be accounted for by increases among Māori and Pacific students. Asian students generally reported relatively low mental health need in 2012 but reported some of the largest increases in 2019, in both relative and absolute terms, including the largest increase in suicide thoughts of any ethnic group (from 12% to 20%) and large increases in depression symptoms.
Socioeconomic deprivation and mental health status had a clear inverse relationship, with those from higher deprivation neighbourhoods reporting lower mental health status on all measures in both 2012 and 2019. Declines in mental health status across this period were largest among those in high-deprivation neighbourhoods and smallest among those in low-deprivation neighbourhoods, in both relative and absolute terms, resulting in a substantial widening of pre-existing inequities.
Females reported higher prevalence of mental health problems than males on all included indicators (depression symptoms, period of low mood, self-harm, suicide thoughts, and suicide attempts) in both 2012 and 2019, in keeping with long-recognised differences (Altemus et al., 2014). Declines in mental health status from 2012 to 2019 were generally larger among males in relative terms but larger among females in absolute terms. For example, prevalence of depression symptoms increased for males from 8.7% to 16.4% (relative increase OR = 2.04, absolute increase 7.7%), and for females from 17.4% to 29.0% (relative increase OR = 1.94, absolute increase 11.6%). Although the gap in need between the sexes could be seen to be narrowing, females still reported very much higher need in 2019.
Younger students (<16) reported larger increases in the prevalence of depression symptoms, suicide thoughts and suicide attempts than older students (16+), in both absolute and relative terms, suggesting a downward shift in the age of onset of depression and suicidality, both traditionally thought to develop later in adolescence (Solmi et al., 2021).
While total population increases in distress reported here largely resemble patterns observed in other high-income English-speaking nations over a similar timeframe, there are important differences. We see less distinction in patterns of increases between males and females than in some international studies, where increases were reported as highly concentrated among females (Keyes et al., 2019; Twenge et al., 2019; Wiens et al., 2020). We also see stronger increases among Indigenous and ethnic minority youth and those from lower socioeconomic groups, while others who provide demographic analyses report larger increases among more privileged White Americans (Twenge et al., 2019), or mainly consistent across ethnicities and socioeconomic American groups (e.g. Keyes et al., 2019).
Causality for population-level changes in mental health is difficult to determine, and full consideration of this issue is outside our scope. Artefactual explanations may account for some increased reporting, but corresponding increases in related behavioural phenomena offer converging evidence in support of actual increases in the prevalence of distress (e.g. Cook et al., 2021; Cybulski et al., 2021).
Seemingly paradoxically, many established drivers of distress appear stable or moving in a desirable direction (Fleming et al., 2022b; Twenge et al., 2019). In Aotearoa, most students continued to report strong family and school connections, the prevalence of bullying appeared largely stable, and substance use and risk behaviours trended downwards, although there was some evidence of increasing financial stress (Fleming et al., 2022b).
Key among proposed drivers of increased distress is the rapid increase in adolescents’ use of new technologies (Cook et al., 2021; Twenge et al., 2019). Although the association between social media use and distress among individuals is not strong (Cook et al., 2021; Odgers and Jensen, 2020), the impact of new technologies may have important population effects. Other proposed drivers include increases in perfectionism (Curran and Hill, 2019), school pressure (Cosma et al., 2020) and future concerns such as climate anxiety (Hickman et al., 2021), although these do not provide a strong rationale for the rapid pace of change. There have been other changes in important contextual factors, such as increases in parental monitoring, changes in parenting and, in some areas, increased political polarisation. New Zealand adolescents have identified climate change as a major problem facing young people (Fleming et al., 2020a).
The increases in inequities in distress we observed (i.e. greater increases among Māori students, Pacific students and those in high-deprivation areas) are not explained by these global hypotheses. A possible contributor to increased inequity in mental health need in Aotearoa is widening income inequality. Aotearoa saw the most rapid increases in income inequality among OECD nations between the mid-1980s and the mid-2000s, reaching roughly the seventh highest level of income inequality in the OECD (Barber, 2011). Such increases have since slowed, but highincome inequality remains embedded. Continuing research is required, which should include ethnic- and socioeconomic-specific data and explore causality. Increasing inequity in distress may also be linked to compounding vulnerabilities, by which members of groups with initial higher socioeconomic need and/or affected by discrimination, racism and limited opportunities are disproportionately affected by the drivers of increasing mental health need (Simon-Kumar et al., 2022). None of these hypotheses provide an explanation on their own. Observed changes may result from complex interplays of factors at individual, family, school and society levels (Collishaw and Sellers, 2020; Fleming et al., 2022b).
Despite incomplete understandings of causal processes, these findings and international research highlight the need for an urgent and immediate response. Improving the population mental health requires efforts at multiple levels (Fusar-Poli et al., 2021). Along with continued attention to known determinants of distress (e.g. racism, discrimination, social exclusion, poverty, inequality, and exposure to abuse and neglect) youth and mental health professionals and advocates must be alert and responsive to evidence around emerging determinants. Universal public health approaches hold promise, in combination with prevention, early intervention, and more and diversified treatment options (Fusar-Poli et al., 2021). Services should be resourced to meet changing need profiles, e.g., increased supports in primary and intermediate schools, given evidence for earlier onset of mental health problems.
Population-specific responses to address profound inequities are required. In Aotearoa, reducing mental health inequity among rangatahi Māori is a priority (Government Inquiry into Mental Health and Addiction 2018; Waitangi Tribunal, 2019). Policy directives must be actively anti-racist and anti-discrimination, and address entrenched disadvantage caused by mechanisms of colonisation compounding over generations. In line with the principle of tino rangatiratanga (self-determination), Māori-led solutions and those incorporating mātauranga Māori (Māori knowledge) are needed.
Further population-specific initiatives are required to address high need among other groups reported here (Pacific students, those from high-deprivation neighbourhoods, females and, increasingly, Asian students) and those outside the scope of this paper, including adolescents who are: takatāpui, rainbow and/or gender diverse (Fenaughty et al., 2021a, 2021b); disabled (Clark et al., 2021); and care-experienced (Fleming et al., 2022a). Need is especially high among adolescents with particular intersections of identity (Roy et al., 2021), including Māori, Pacific and Asian females (Fleming et al., 2020c).
Strengths and limitations
Strengths of the Youth2000 series include large, representative samples comprising high proportions of the New Zealand adolescent population, robust sampling techniques, and a broad range of indicators, most used consistently over time.
There are also limitations. Only students attending school on the day of the survey participated. Those not enrolled in mainstream schools or absent are generally likely to be less healthy than those present, thus the true levels of some difficulties are likely underrepresented. Similarly, response rates have decreased over time, possibly resulting in increased non-response bias. Reliable and valid measures were used to assess distress, and questions were extensively piloted; however, formal diagnoses of disorders based on the clinical interview were not possible. Youth19 used a regional rather than a national sample; however, the findings of our secondary analysis of trends in the regions only provided the same, or even marginally stronger results (albeit with wider confidence intervals), suggesting that findings are unlikely to be an artefact of differences in sampling frame. Youth19 predates the COVID-19 global pandemic, thus did not capture the effects of the pandemic on student well-being. We provide a snapshot of mental health and well-being immediately preceding the pandemic, capturing earlier changes and providing a baseline for measuring future change.
Future research
We report findings for male and female sex, major ethnic groups and neighbourhood deprivation bands. High mental health needs were also reported by other groups. Further work considering these findings in context is required, including for young people who are outside the male/female binary.
We observed large changes in reported needs based on binarised variables and top-down segmentation using demographic factors. While this is useful to demonstrate population-level changes, future research should further unpack mental health need, e.g., by considering changes in scale distribution or changes on individual scale items over time. It would also be useful to investigate specific profiles of need not captured by a top-down approach. Bottom-up, data-driven techniques such as cluster analysis could be useful here. Work to understand the drivers and mechanisms of increases in need was outside the scope of this study, but is important. To enable meaningful trend comparisons in future, continued collection of comparable data is vital.
Conclusion
We found high prevalence of mental distress among New Zealand secondary school students in 2019 and sharp increases between 2012 and 2019. Needs and changes were unevenly distributed, with a general pattern of larger increases among groups with pre-existing higher prevalence (e.g. females, rangatahi Māori, those in higher deprivation neighbourhoods), resulting in widening inequities. Increases on some indicators were notably high among Asian students. Urgent work to address these needs is required, with equity as a priority. It is important to understand where the changes are, for whom, to attempt to address causal processes and inform our response. Further work is needed to understand the drivers. These findings provide a baseline of distress prior to the COVID-19 global pandemic. Continued collection of directly comparable data is required to ensure that changes (related to the pandemic and otherwise) are captured.
Footnotes
Acknowledgements
Thank you first and foremost to the students, staff and schools who have taken part in Youth2000 surveys over almost 20 years. Thank you to the members of the research teams who implemented the surveys and to our steering and advisory groups. Thank you to Stefanie Lash for editing support.
Declaration of Conflicting Interests
The author(s) declared no potential conflicts of interest with respect to the research, authorship and/or publication of this article.
Funding
The author(s) disclosed receipt of the following financial support for the research, authorship and/or publication of this article: Youth12 was funded by the Ministries of Youth Development, Social Development, Health, Education and Justice; the Department of Labour; The Families Commission; and the Health Promotion Agency. The Youth19 Rangatahi Smart Survey was funded by the Health Research Council of New Zealand (HRC project grants 17/315 and 18/473). The lead author was funded by a Victoria Doctoral Scholarship, Te Herenga Waka – Victoria University of Wellington.