
Abstract
Objective:
To describe the self-reported mental health of New Zealand secondary school students in 2012 and to investigate changes between 2007 and 2012.
Methods:
Nationally representative health and wellbeing surveys of students were completed in 2007 (n=9107) and 2012 (n=8500). Logistic regressions were used to examine the associations between mental health and changes over time. Prevalence data and adjusted odds ratios are presented.
Results:
In 2012, approximately three-quarters (76.2%, 95% CI 74.8–77.5) of students reported good overall wellbeing. By contrast (also in 2012), some students reported self-harming (24.0%, 95% CI 22.7–25.4), depressive symptoms (12.8%, 95% CI 11.6–13.9), 2 weeks of low mood (31%, 95% CI 29.7–32.5), suicidal ideation (15.7%, 95% 14.5–17.0), and suicide attempts (4.5%, 95% CI 3.8–5.2). Between 2007 and 2012, there appeared to be slight increases in the proportions of students reporting an episode of low mood (OR 1.14, 95% CI 1.06–1.23, p=0.0009), depressive symptoms (OR 1.16, 95% CI 1.03–1.30, p=0.011), and using the Strengths and Difficulties Questionnaire - emotional symptoms (OR 1.38, 95% CI 1.23–1.54, p<0.0001), hyperactivity (OR 1.16, 95% CI 1.05–1.29, p=0.0051), and peer problems (OR 1.27, 95% CI 1.09–1.49, p=0.0022). The proportion of students aged 16 years or older reporting self-harm increased slightly between surveys, but there was little change for students aged 15 years or less (OR 1.29, 95% CI 1.15–1.44 and OR 1.10, 95% 0.98–1.23, respectively, p=0.0078). There were no changes in reported suicidal ideation and suicide attempts between 2007 and 2012. However, there has been an improvement in self-reported conduct problems since 2007 (OR 0.78, 95% CI 0.70–0.87, p<0.0001).
Conclusions:
The findings suggest a slight decline in aspects of self-reported mental health amongst New Zealand secondary school students between 2007 and 2012. There is a need for ongoing monitoring and for evidence-based, accessible interventions that prevent mental ill health and promote psychological wellbeing.
Keywords
Introduction
There is a growing global focus on mental health (Sawyer et al., 2012) and an acknowledgement that many mental health issues emerge during the adolescent years (Blum and Nelson-Mmari, 2004; Sawyer et al., 2012). When left untreated, mental health concerns in adolescence can lead to more severe, more difficult to treat illness; co-occurring mental disorders; and a range of poor outcomes in adulthood including increased risk of suicide (Kessler et al., 2005). Mental health issues are often characterized by protracted periods of poor health, frequent recurrence, and impairment in social and academic domains for adolescents (Keller et al., 2001; Kessler et al., 2001; Rao et al., 1995). Mental disorders amongst adolescents are the largest contributor to years lost because of disability in young people aged 10–24 years old (Gore et al., 2011).
Poor mental health is a particularly salient issue for many New Zealand adolescents (Feehan et al., 1994; Fergusson and Horwood, 2001) with approximately a quarter of participants in both the Dunedin Multidisciplinary Study and the Christchurch Health and Development Study meeting the DSM-III-R criteria for at least one disorder at age 15 (Fergusson and Horwood, 2001; McGee et al., 1990). Both birth cohort studies reported nearly one in five adolescents to have experienced depression. At age 18, 18.4% in the Christchurch study (Fergusson et al., 2005) and 16.8% in the Dunedin study met criteria for major depressive disorder (Hankin et al., 1998), with the prevalence rates reported being broadly comparable to findings from other Western countries (Hankin et al., 1998; Lewinsohn et al., 1993, 1998). In addition, the Dunedin study reported, 9% of 15 year olds to have conduct or oppositional disorder (McGee et al., 1990).
Adolescent deliberate self-harm and suicide are issues of considerable concern in New Zealand, with the country having the highest rate of completed youth suicides in the developed world for those aged 15–19 years (Organisation for Economic Co-operation and Development, 2012) and with almost a quarter of those hospitalized for deliberate self-harm being aged 10–19 years (644 out of 2728 patients; Conner et al., 2003).
Globally, there is considerable debate on the extent to which population rates of mental disorder are changing (Collishaw et al., 2004, 2010; Costello et al., 2006). Whilst some report rates of mental ill health to have increased among young people (Collishaw et al., 2004, 2010; Kessler et al., 2001; Rutter and Smith, 1995), other reviews conclude that much of the apparent shifts, particularly for disorders such as depression (Costello et al., 2006), are due to increased recognition and reporting of disorder (Busfield, 2012; Costello et al., 2006). In contrast, suicide rates are known to change dramatically over time (Pritchard, 1992).
The Youth2000 survey series assess a range of health and wellbeing factors amongst secondary school students, with surveys being completed in 2001, 2007, and 2012. The aim of this paper is to describe the mental health of students in 2012 and to consider changes in mental health status since 2007. This is of interest in order to: highlight current youth mental health needs; consider how much has changed in population youth mental health across this short period; and provide a baseline for future studies.
Methods
The Youth2000 surveys are cross-sectional, self-administered health and wellbeing questionnaires, carried out with representative samples of New Zealand secondary school students. The most recent surveys were conducted in 2007 (Youth’07) and 2012 (Youth’12). Detailed descriptions of the Youth2000 surveys’ methodology are available elsewhere (Adolescent Health Research Group, 2008; Clark et al., 2013) and are briefly described below.
In summary, each survey used a two-stage sample cluster design to select a nationally representative sample of secondary school students in New Zealand. Of the 125 invited schools in 2012, 91 (73%) participated, and of the 12,503 students approached to participate in the study 8500 (68%) took part. In 2007, of the 115 invited schools, 96 (84%) participated, and of the 12,355 students approached to participate in the study 9107 (74%) took part. The surveyed students accounted for 3% of the total secondary school roll in both 2012 and 2007. The anonymous comprehensive survey was administered using internet tablets (Denny et al., 2008). Each student provided their consent before completing the survey questionnaire. Ethics approval was gained for the survey in 2007 and 2012 from the University of Auckland Human Participants Ethics Committee.
Measures
Demographic information
Participants identified whether they were male or female and their age in years. Students indicated the ethnic groups that they belonged to using the New Zealand Census standard 2001/2006 ethnicity question (Statistics New Zealand, 2005). For the purposes of this analysis, participants were categorized as ‘≤15’ or ‘≥16’ and ethnicity was categorized as New Zealand European, Māori, Pacific, Asian, or Other, using the Statistics New Zealand ethnicity prioritization method (Lang, 2002). Socioeconomic deprivation was measured using the New Zealand Deprivation Index (NZDep2006; Salmond et al., 2006) for the census area unit that the student lived in. The NZDep2006 combines eight dimensions of deprivation derived from the NZ census and assigns each census area unit a deprivation decile (a decile of 1 represents areas with the least deprived scores and 10 represents areas with the most deprived scores). For data analyses, students were grouped into one of three decile bands indicating lower deprivation (deciles 1 to 3), medium deprivation (deciles 4 to 7), and higher deprivation (deciles 8 to 10) levels. Student’s home locale was divided into three categories: main urban (a city with ≥30,000 people), secondary urban (a town with 1000–29,999 people), and rural areas (an area with <1000 people).
Wellbeing
Wellbeing was measured by the WHO-5 Well-being Index (World Health Organization, 1998). The WHO-5 is a short, self-administered questionnaire covering five items, related to positive mood, vitality, and general interests. Scores range from 0–25. A score of ≥13 is used to indicate good wellbeing and participants with scores ≥13 were classified as having good overall wellbeing.
Symptoms of depression
Symptoms of depression were measured using the Reynolds Adolescent Depression Scale, Short Form (RADS-SF). Significant depressive symptoms were identified by scores ≥28 on the RADS-SF. This score was based on the analysis of the 2001 survey data, which showed that a level of 28 best matched the cut-off of the full Reynolds Adolescent Depression Scale and gave closer agreement than the lower recommended RAD-SF cut-off level of 26 in the percentage classified with significant levels of depressive symptoms (Milfont et al., 2008).
Period of low mood
Period of low mood was defined as an affirmative response to the question “During the past 12 months, was there ever a time when you felt sad, blue, or depressed for 2 weeks or more in a row?”
Suicidality
Suicidal ideation was identified by an affirmative response to the question “During the last 12 months, have you seriously thought about killing yourself (attempting suicide)?” Attempted suicide was identified by an affirmative response to the question “During the last 12 months, have you tried to kill yourself (attempted suicide)?”
Deliberate self-harm
In Youth’07, self-harm was defined as an affirmative response to the question “In the last 12 months, have you ever deliberately (on purpose) hurt yourself or done anything you knew might have harmed you or even killed you?” In Youth’12, the wording was “During the last 12 months, have you deliberately hurt yourself or done anything you knew might have harmed you (but not kill you)?”
Strengths and Difficulties Questionnaire
The Strengths and Difficulties Questionnaire (SDQ) is a short, self-administered questionnaire covering five areas (emotional symptoms, conduct problems, hyperactivity, peer problems, and a prosocial scale); total difficulty scores range from 0–40 (Goodman, 2001). A total score of ≥20 is used to indicate an abnormal total score or of concern score (Mellor, 2005). Previously established abnormal or of concern scores (Mellor, 2005) were used to determine if participants had difficulties in relation to emotional symptoms (subscale scores ≥7), conduct problems (subscale scores ≥5), hyperactivity (subscale scores ≥7), peer problems (subscale scores ≥6), and prosocial issues (subscale scores ≤4, where lower scores indicate difficulties and higher scores prosocial strengths).
Analyses
In all analyses the data have been weighted by the inverse probability of selection and the variance of estimates were adjusted to allow for correlated data from the same schools. Total numbers, adjusted percentages, and 95% confidence intervals were calculated for the selected outcomes. Logistic regression models, including the possible confounders of age, sex, ethnicity, locale, and level of neighbourhood socioeconomic deprivation, were used to investigate the associations between mental health behaviours or outcomes and survey wave (i.e. Youth’07 and Youth’12). The interaction between survey wave and sex, survey wave and age, survey wave and ethnicity, survey wave and NZDep2006, and survey wave and locale were tested for each outcome. Where an interaction was significant (p<0.01), analyses were stratified by sex, age, ethnicity, NZDep2006, or locale as appropriate. All analyses were carried out using SAS software version 9.3 (2010) using the survey procedures. A p-value of ≤0.01 was taken to indicate statistical significance. Box plots were prepared to provide an indication of changes in symptom distribution across survey waves where statistically significant changes were found using pre-established cut-off scores on measurement scales.
Results
Table 1 presents the demographic features of students in Youth’07 and Youth’12. There were slightly more male students in 2007 and slightly more female students in 2012. This variation in sex distribution reflects the number of single-sex schools randomly selected for each survey wave. The age distribution of students in 2007 and 2012 was similar. The 2012 sample was slightly more ethnically diverse and urbanized and had higher deprivation than in 2007.
Demographic features of students in Youth’07 and Youth’12.
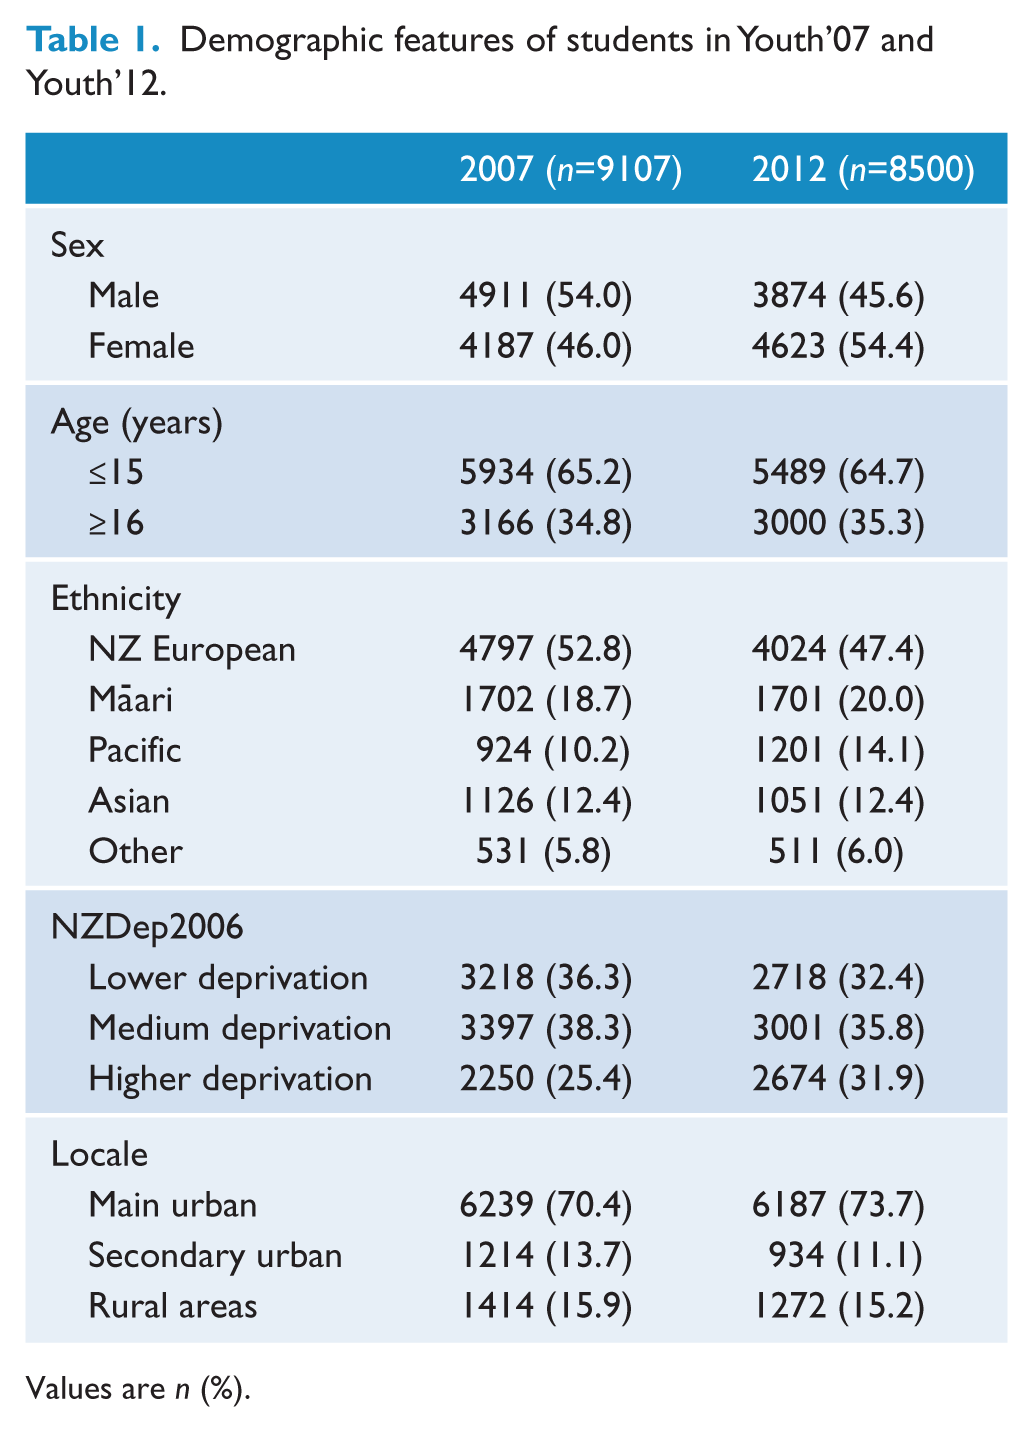
Values are n (%).
More than three-quarters of students in 2007 and 2012 reported good overall wellbeing (Table 2). However, many students reported significant depressive symptoms, a period of low mood, and self-harm. A number of students also reported suicidal ideation and having attempted suicide. There were small increases in significant depressive symptoms, low mood, and self-harm from 2007–2012 (Table 2). The increase in self-harming was more pronounced amongst senior students (i.e. ≥16 years: OR 1.29, 95% CI 1.15–1.44, p=0.0078).
Selected mental health variables by sex and age and associations between variables and survey wave (Youth’07 and Youth’12).
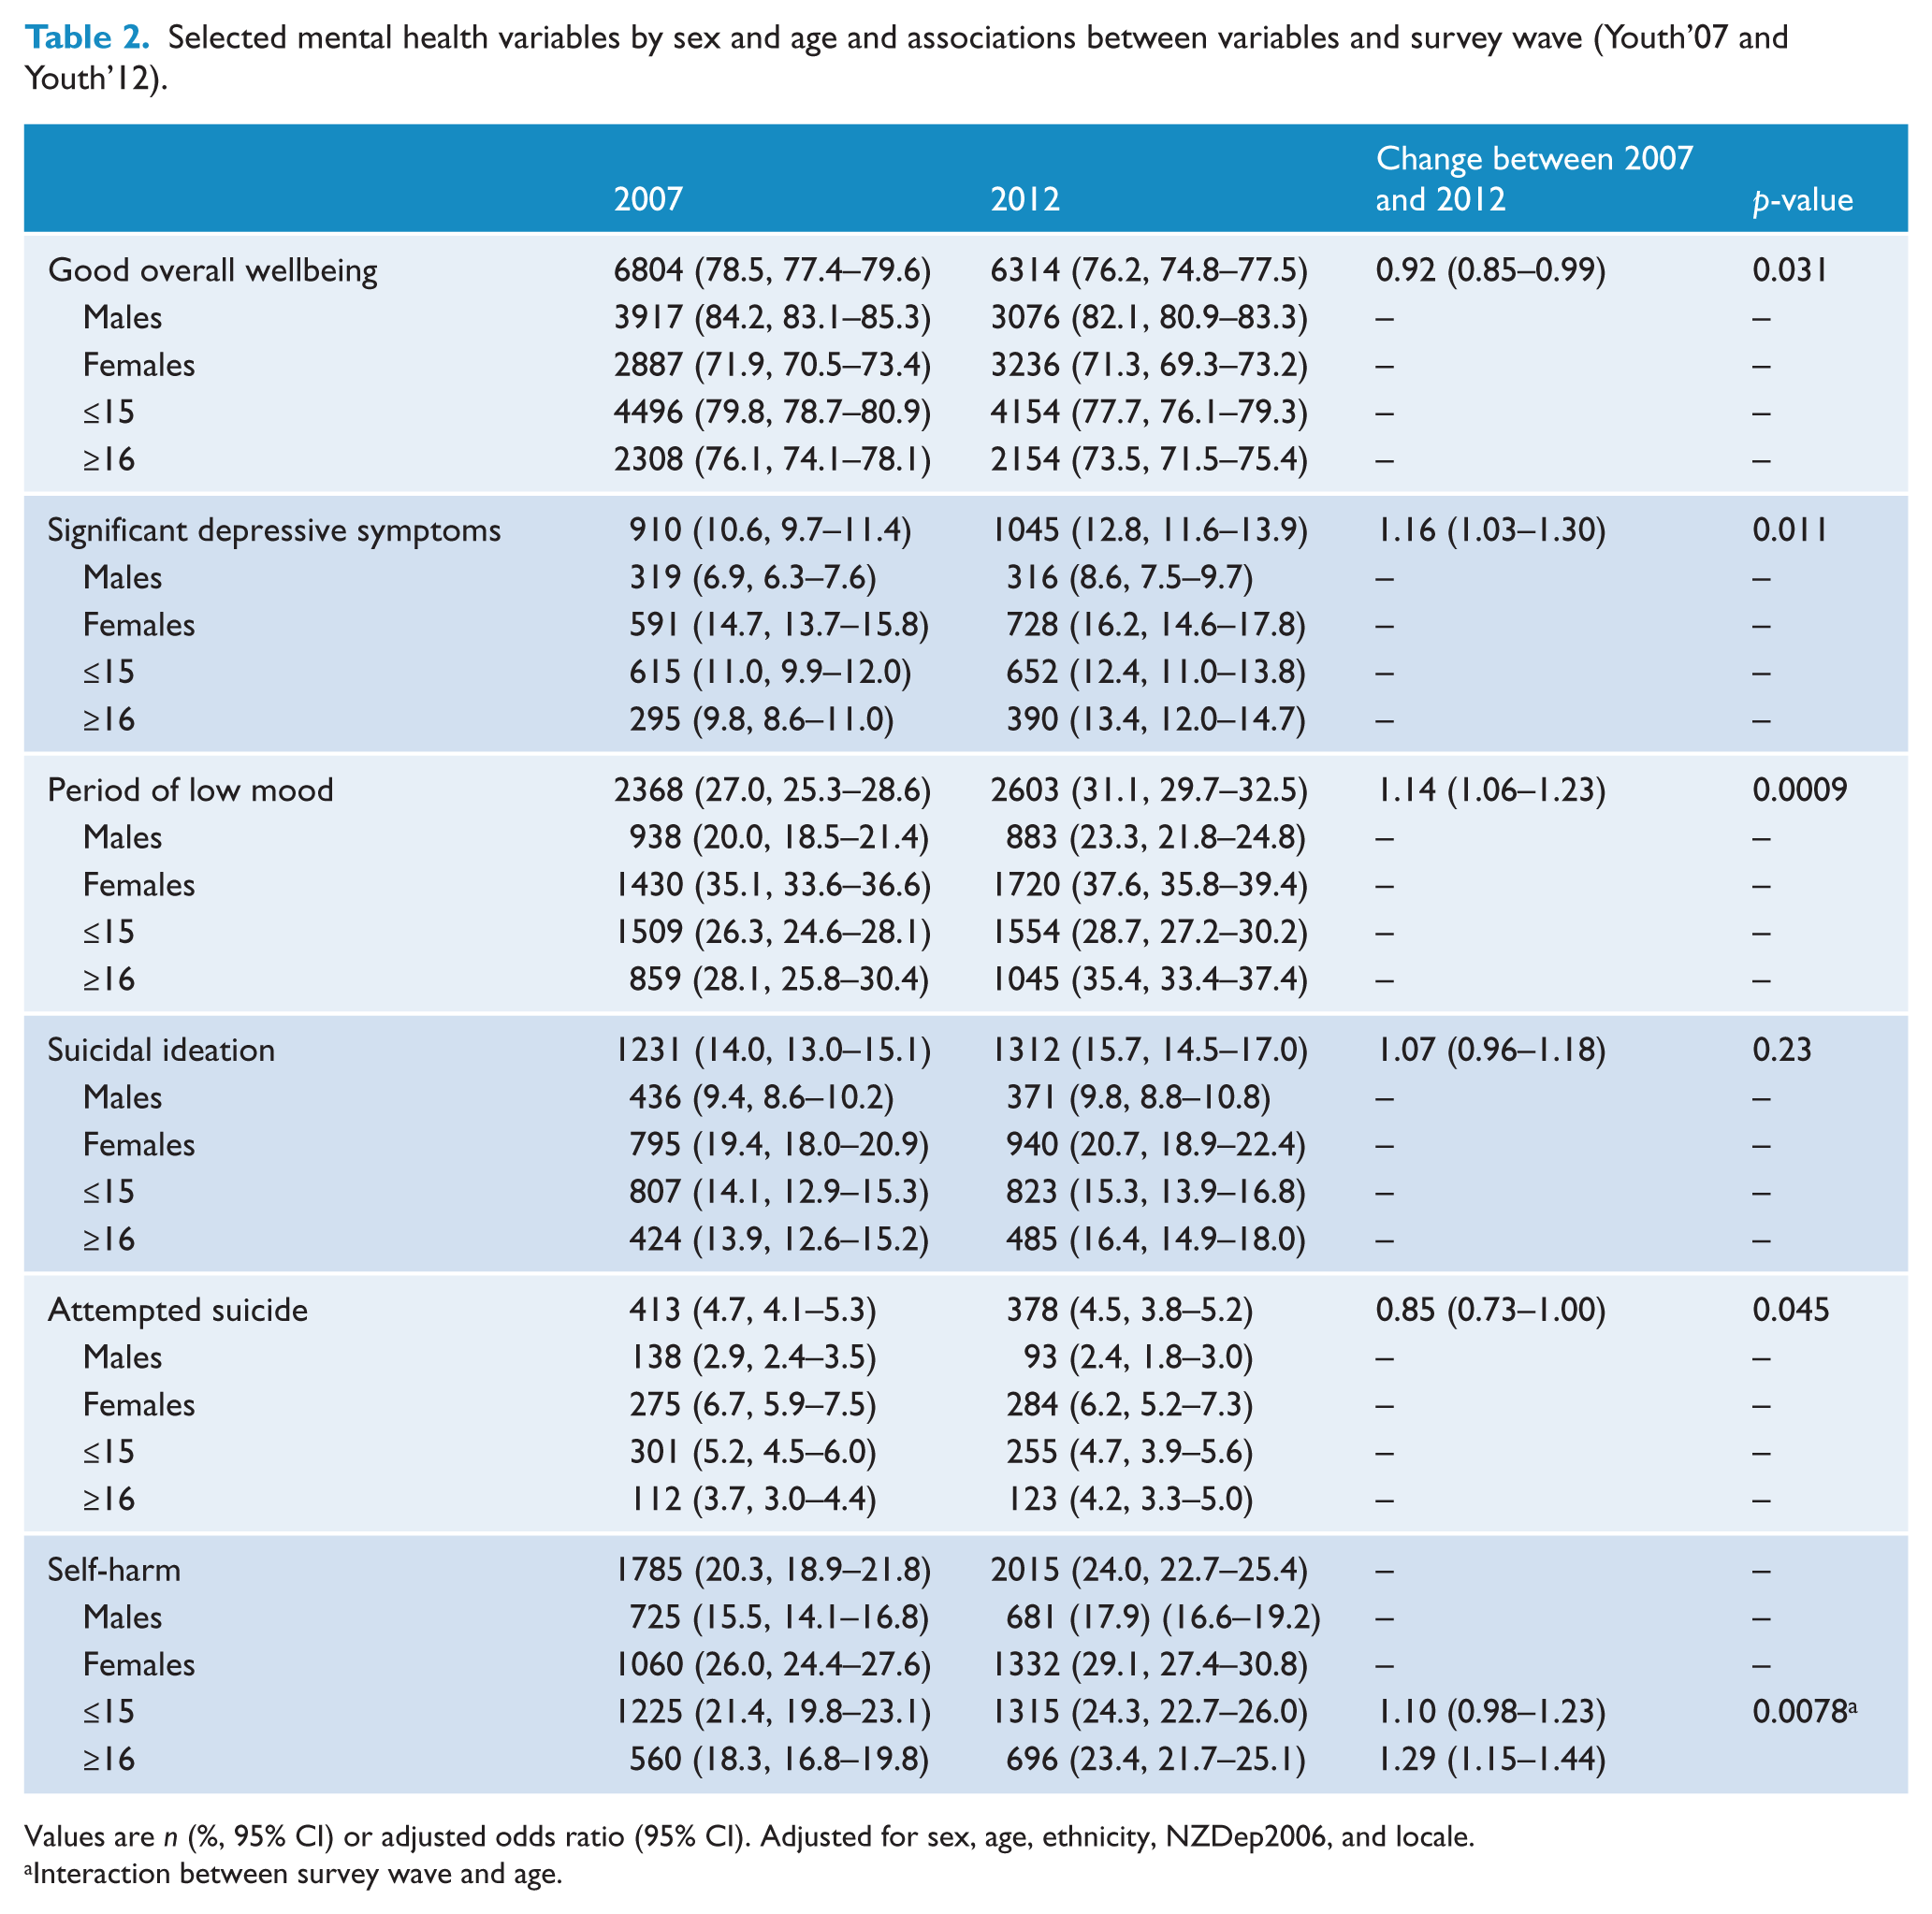
Values are n (%, 95% CI) or adjusted odds ratio (95% CI). Adjusted for sex, age, ethnicity, NZDep2006, and locale.
Interaction between survey wave and age.
Results from the SDQ suggest that the mental health of students overall may have deteriorated since 2007 (OR 1.18, 95% CI 1.06–1.31, p=0.0036). In particular, there was an increase in the proportion of students reporting emotional symptoms, hyperactivity, and peer problems. However, there has been an improvement in self-reported conduct problems since 2007 (Table 3).
Strengths and Difficulties Questionnaire results by sex and age and associations between variables and survey wave (Youth’07 and Youth’12).
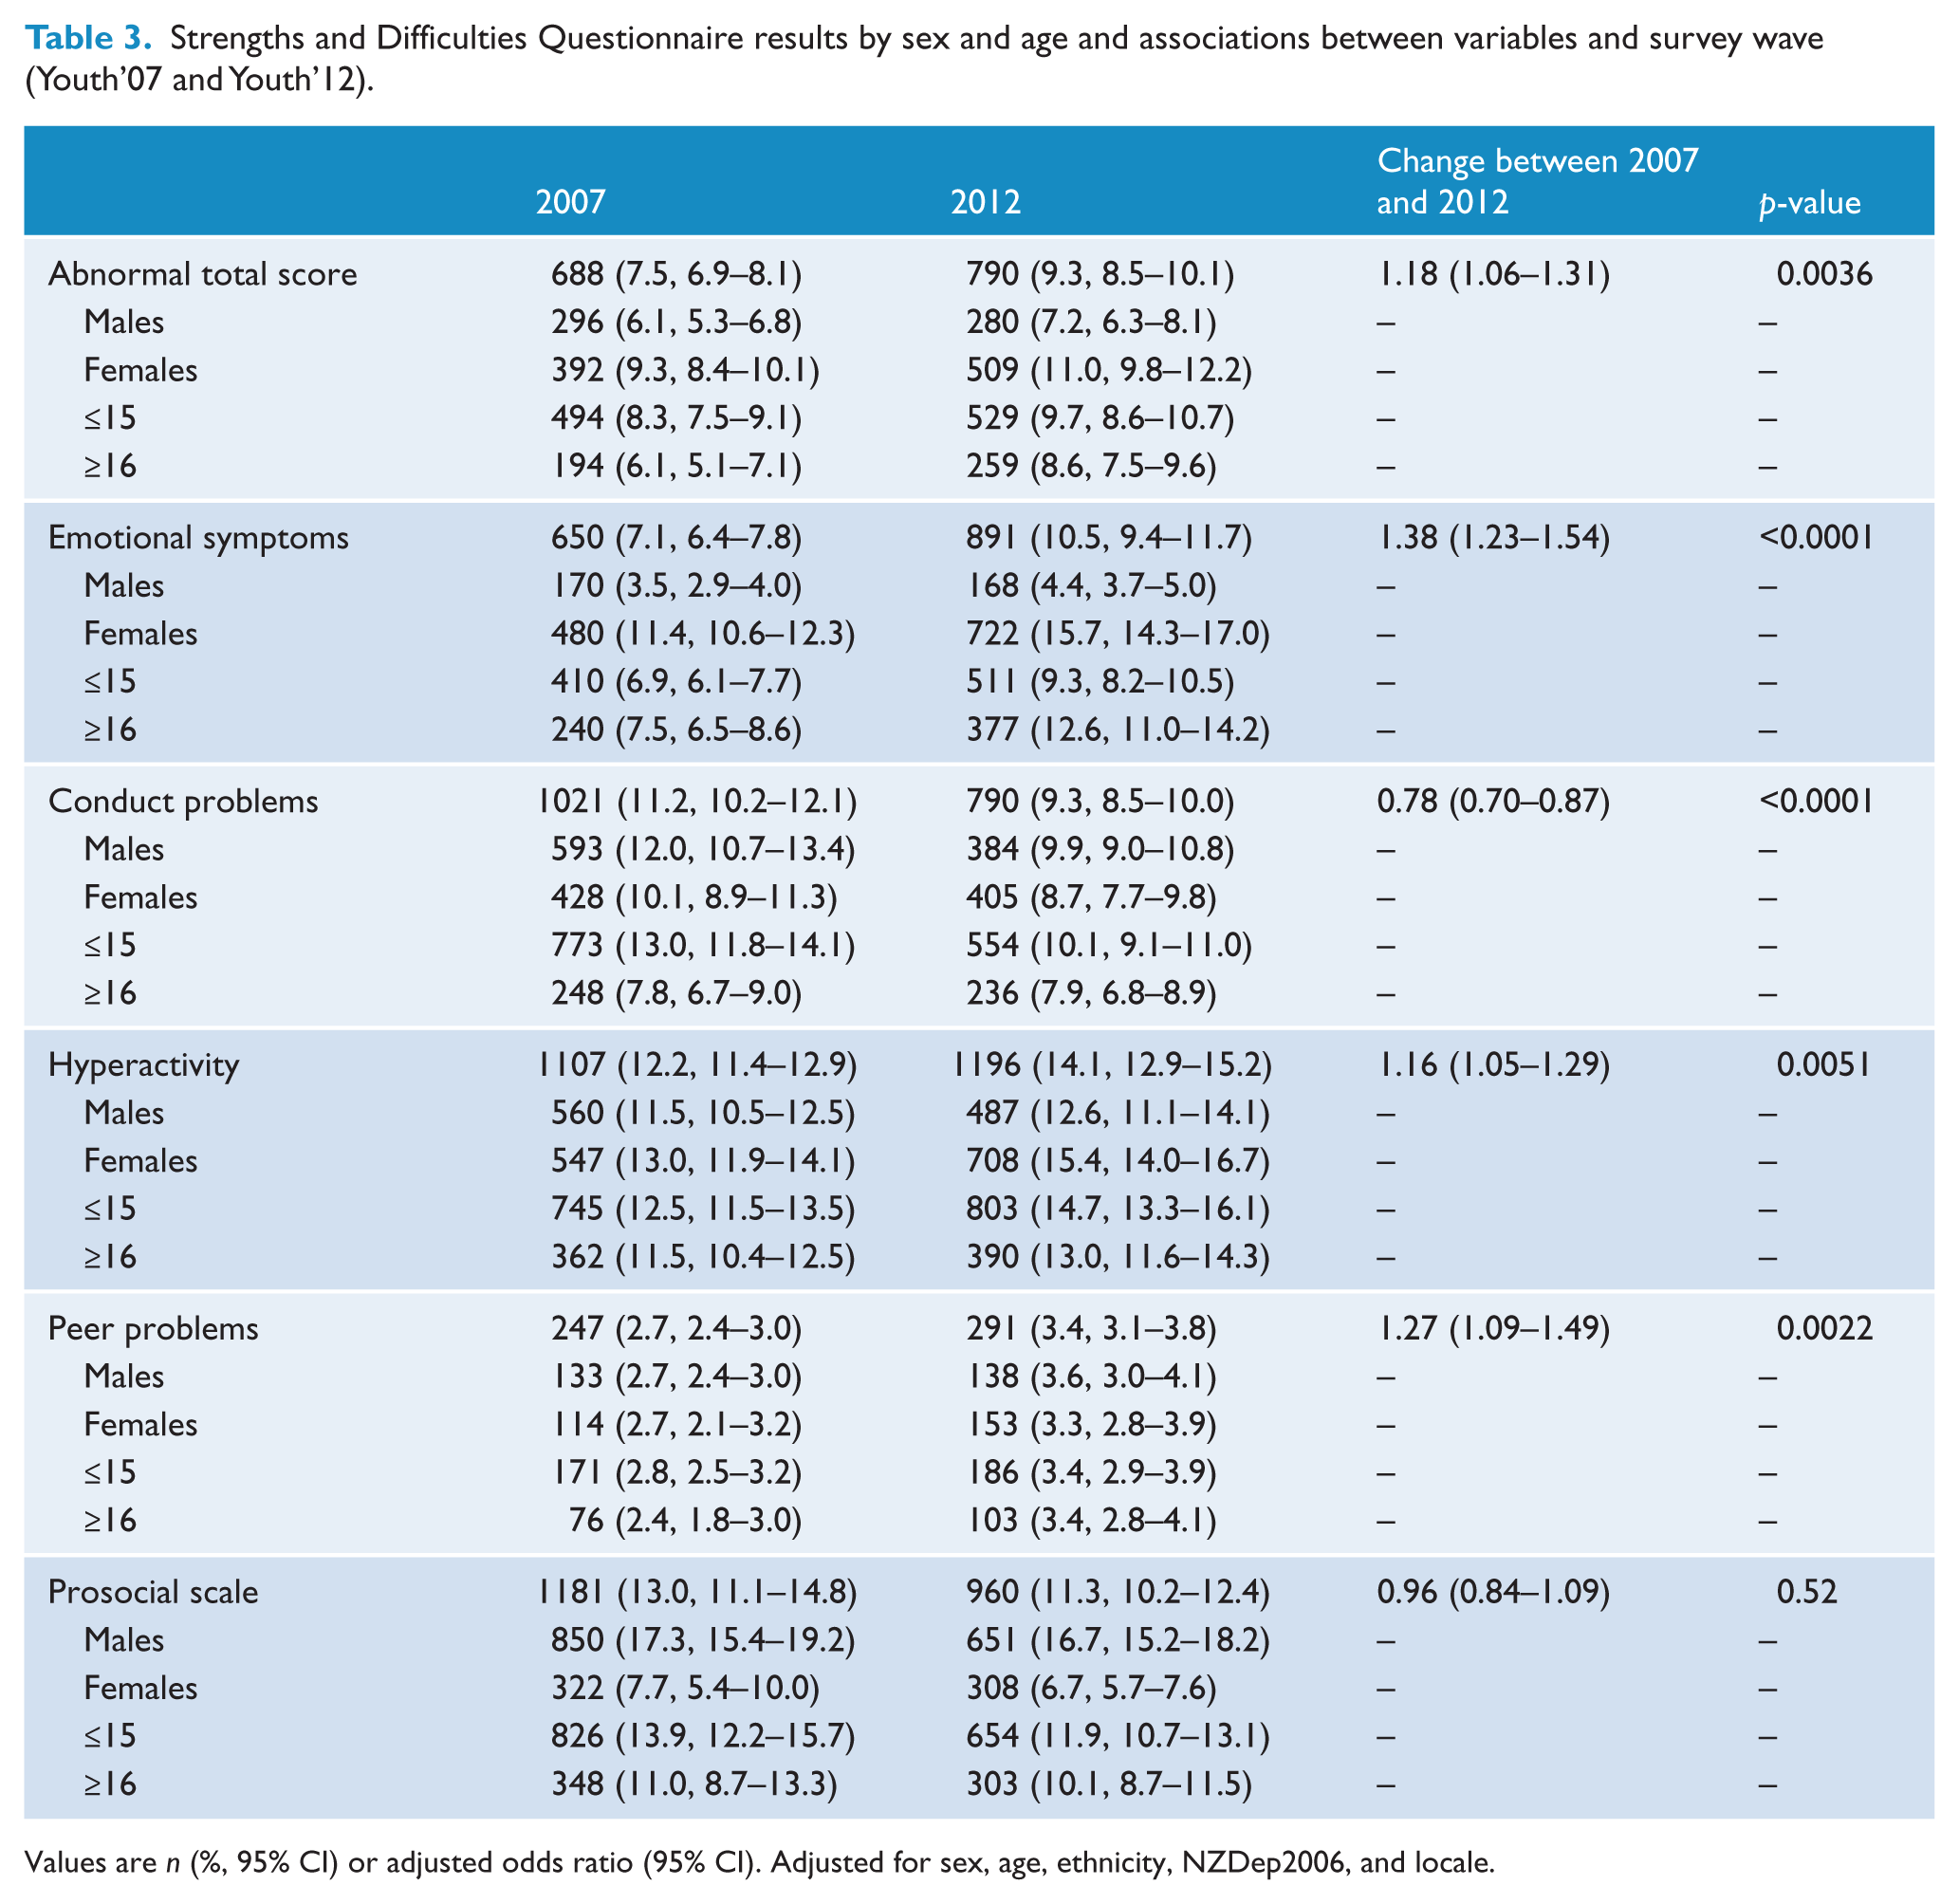
Values are n (%, 95% CI) or adjusted odds ratio (95% CI). Adjusted for sex, age, ethnicity, NZDep2006, and locale.
Figure 1 presents box plots for RADS-SF and the SDQ subscales. These suggest that the reported changes in proportions of students with significant symptoms are not merely due to minor distribution changes around the chosen cut-off points.
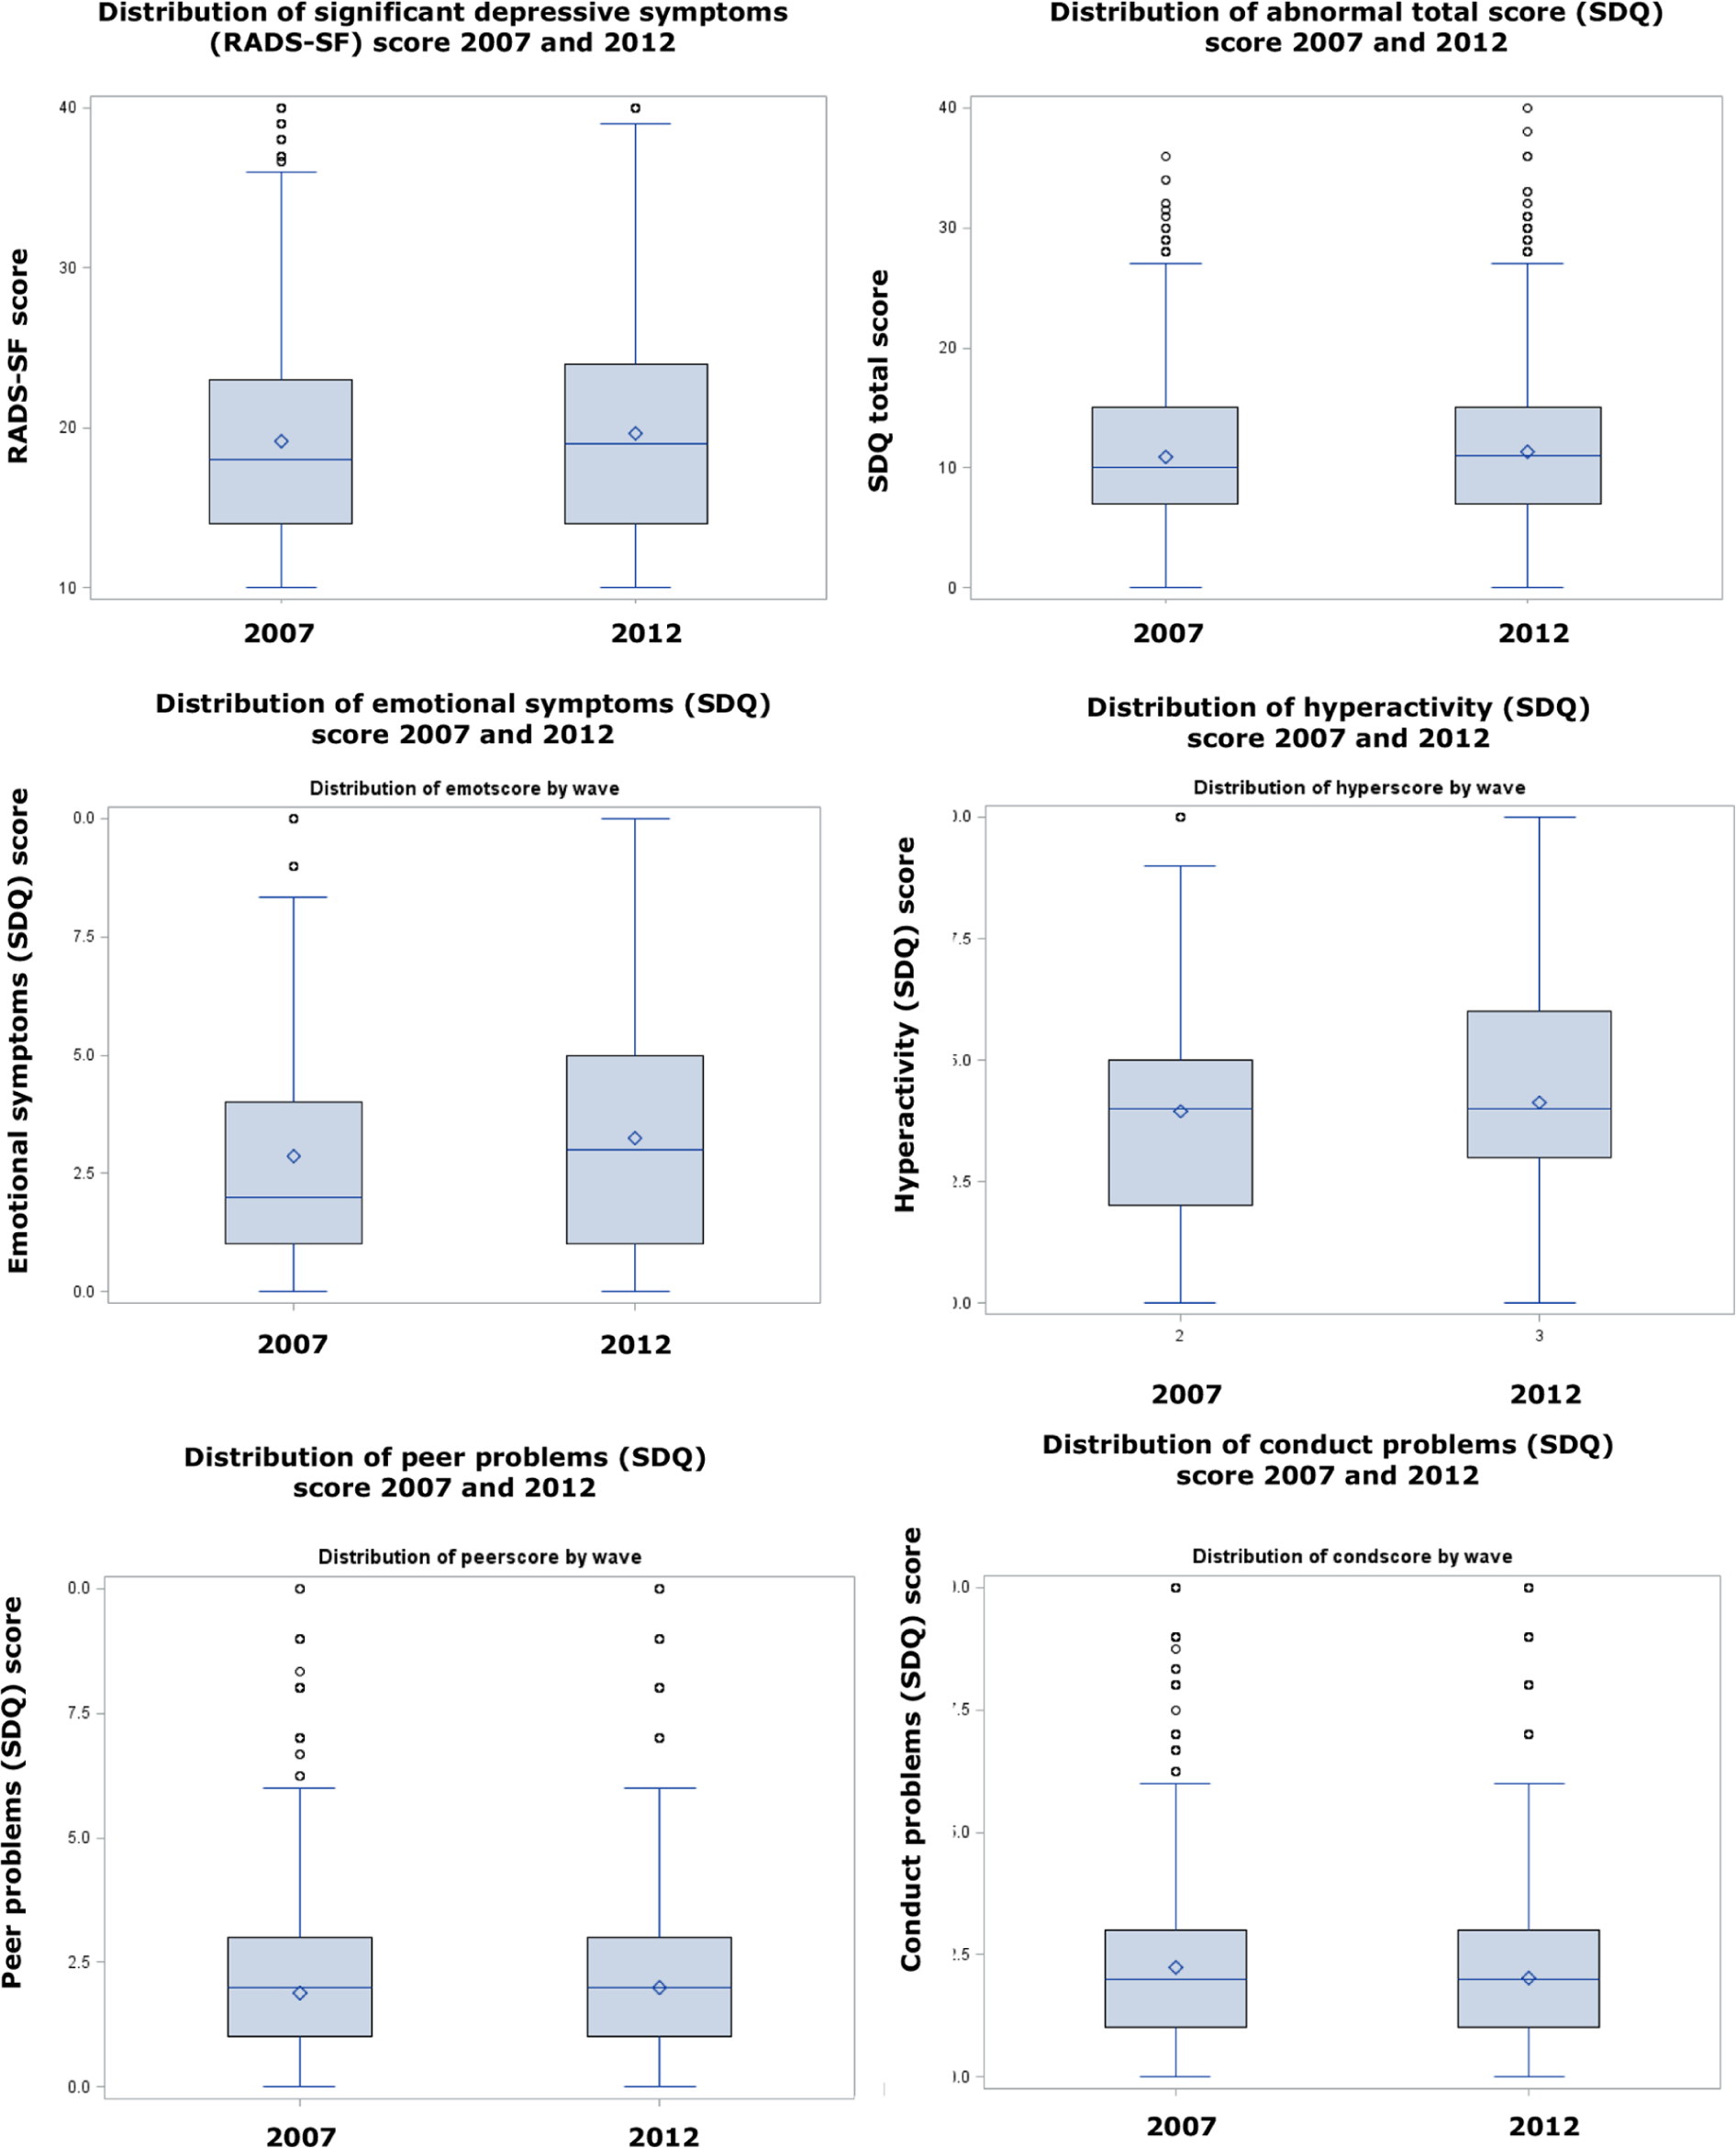
Box plots of distribution of symptoms with significant changes between 2007 and 2012 Reynolds Adolescent Depression Scale, Short Form (RADS-SF) and Strengths and Difficulties Questionnaire (SDQ) scores.
Discussion
Summary of main findings
We investigated mental health indicators in large nationally representative cross-sectional surveys of secondary school students in New Zealand in 2007 and 2012. Consistent with previous research, we report higher rates of emotional symptoms among females and older students (Collishaw et al., 2004; Fergusson and Horwood, 2001; Hankin et al., 1998; Lewinsohn et al., 1993, 1998). Overall, the mental wellbeing of students appears to have deteriorated slightly, with small increases in the proportions of students reporting significant depressive symptoms, periods of low mood, emotional symptoms, deliberately self-harming, experiencing hyperactivity, and suffering from peer problems. Fewer students reported conduct problems in 2012. There have been no substantial changes to suicidal ideation or suicide attempts. Interestingly, changes in mental health indicators across the two waves are similar for male and female students, older and younger students, and according to other demographic features (i.e. ethnicity, locale, and deprivation).
Unfortunately, New Zealand continues to do poorly in relation to youth suicide, leading the developed world in completed suicides amongst 15–19 year olds (Organisation for Economic Co-operation and Development, 2012). Although we could not measure completed suicides, known risk factors for completing suicide, suicidal ideation, and suicide attempts were measured (Fleming et al., 2007). Furthermore, previous suicide attempts are one of the best predictors of both another suicide attempt and completing suicide (Spirito and Esposito-Smythers, 2006). Based on the results from Youth’07 and Youth’12, there has been no substantial improvement with respect to suicidality among secondary school students in New Zealand. Government initiatives for suicide prevention (e.g. Associate Minister of Health, 2006) require a continued emphasis on young people that ensures an adolescent-focused approach.
International comparisons of mental health are fraught with challenges due to issues such as differences in sampling and in measures used (Bromet et al., 2011). Indicators such as depression have a strong age gradient: even small sampling differences can lead to erroneous conclusions. Even when parallel methods are used, significant national variations in interpretation and reporting mean that reported differences must be interpreted with caution (Goodman et al., 2012). The most comparable international data in this case is of representative samples of school students using the same measures. The SDQ has been used widely (Achenbach et al., 2008) but efforts to compare findings for multiple societies have revealed large, cross-cultural reporting effects (Goodman et al., 2012). School level surveys of depressive symptoms using the RADS scale and similar methods to ours have been reported in recent years in Spain (Fonseca-Pedrero et al., 2010), in the USA among Latinos (Céspedes and Huey Jr, 2008), and in Australia (Boyd et al., 2000). The rates of depressive symptoms obtained our study are considerably higher than those reported in Spain and the USA and close to those in Australia. However, limited details about the sampling procedures used in these other studies and differing years of data collection prevent firm conclusions. Rigorous meta-analyses or international studies with robust comparable methods are called for.
What this study shows is that there has been a possible decline, or at the most a conservative interpretation of a lack of improvement, in secondary school students reports of mental symptoms (excluding conduct problems), using the same methods in parallel New Zealand samples just 6 years apart.
This time period between these surveys is brief and apparent changes in mental health are small, hence conjecture about possible reasons for change and differential changes is not justified. It is, however, appropriate to conclude that mental health issues remain important for secondary school students and that ongoing monitoring and action to address mental health needs is called for.
Strengths and limitations
This study includes data from two large nationally representative samples of secondary school students from throughout New Zealand. A point to consider is whether changes which are statistically significant are significant in terms of clinical outcomes or overall population wellbeing. This study utilizes a large sample, and as such has the power to identify differences which may have limited importance in real terms. Our choice of p-value was made so that we would avoid over emphasizing very small differences, but would not miss important findings by being too conservative. We have included the estimates with their confidence intervals to facilitate consideration of the importance of the findings. The box plots suggest that changes in prevalence are not an artefact of the specific cut-off points chosen. The fact that most of the mental health indicators trended in the same direction gives increased confidence that the findings are not merely due to chance.
We have not yet investigated mental health variables by ethnicity. There is known ethnic variation in mental health outcomes within New Zealand (Baxter et al., 2006a, 2006b), hence ethnic specific analyses are planned.
There are other limitations. This study is based on a cross-sectional survey of secondary school students; therefore, the findings cannot be generalized to all New Zealand adolescents. Young people who do not attend mainstream schools or who are absent from school are not as healthy as their peers who are well engaged in mainstream schooling (Bovet et al., 2006; Clark et al., 2010; Denny et al., 2004).
Formal diagnoses of psychiatric disorders based on diagnostic interviews were not possible. However, reliable and valid instruments were used to measure mental wellbeing, specifically the WHO-5, RADS-SF, and SDQ. Furthermore, the surveys as a whole have been subjected to extensive pilot testing prior to Youth’07 and Youth’12 being conducted. There was a slight change in the way the question pertaining to deliberate self-harm was worded between 2007 and 2012, with the Youth’12 survey more clearly making the distinction between deliberate self-harm and a possible suicide attempt. However, the earlier self-harm question (in Youth’07) was broader and, therefore, more inclusive, so would not explain the increase in self-harming behaviour in 2012.
Differences between the students from 2007 and 2012 may be confounded by changes in demographics between the two surveys. For this reason sex, age, ethnicity, deprivation, and locale were included in the logistic regression models. However, changes in demographics between the surveys may reflect changes in student demographics overall. For example, Ministry of Education roll returns show a decrease in the proportion of New Zealand European students and an increase in Māori, Pacific, Asian, and Other students between 2007 and 2012 (Ministry of Education, 2013). As school climate has a modest impact on aspects of emotional health (Denny et al., 2011), we carried out sensitivity analyses with the inclusion of school factors (size of school, school authority, and type of school); these did not change the findings.
Not all students completed all sections of the survey. Some areas, particularly in the later sections of the Youth’07 and Youth’12 questionnaires, had missing data. However, this is a minor limitation for this study as the items on mental health were located in the middle of the survey.
Finally, meaningful comparisons between all three survey waves of Youth2000 were not possible, as the 2001 survey did not include many of the items reported here (e.g. WHO-5, SDQ, or an item on self-harm) or the questions were substantially different to those used in Youth’07 and Youth’12 (e.g. for period of low mood, suicidal ideation, and suicide attempts).
Conclusion
In summary, we have found an apparent small decline in the mental health of New Zealand secondary school students between 2007 and 2012. In particular, an increased proportion of students reported low mood, depressive symptoms, self-harm, emotional symptoms, hyperactivity, and peer problems in 2012. By contrast, conduct problems were significantly less prevalent in 2012. Based on these findings, we consider that the mental health of secondary school students in New Zealand does require further attention. There is also a need for ongoing monitoring and for interventions that promote wellbeing and prevent mental ill health.
Footnotes
Acknowledgements
We would like to thank the students, staff and schools who took part in the survey. We would also like to acknowledge the Youth’12 project manager, Sarah Masson, the administrator, Toni Jardine, and the members of the research team who implemented the survey in the participating schools. We also thank our steering and advisory groups for their guidance and support.
Funding
The Youth’12 survey was funded by the Ministries of Youth Development, Social Development, Health, Education and Justice, the Department of Labour, the Families Commission and the Health Promotion Agency.
Declaration of interest
The authors report no conflicts of interest. The authors alone are responsible for the content and writing of the paper.