
Abstract
Objective:
The objective was to identify clinically meaningful groups of adolescents based on self-reported mental health and wellbeing data in a population sample of New Zealand secondary school students.
Methods:
We conducted a cluster analysis of six variables from the Youth19 Rangatahi Smart Survey (n = 7721, ages 13–18 years, 2019): wellbeing (World Health Organization Well-Being Index), possible anxiety symptoms (Generalized Anxiety Disorder 2-item, adapted), depression symptoms (short form of the Reynolds Adolescent Depression Scale) and past-year self-harm, suicide ideation and suicide attempt. Demographic, contextual and behavioural predictors of cluster membership were determined through multiple discriminant function analysis. We performed cross-validation analyses using holdout samples.
Results:
We identified five clusters (n = 7083). The healthy cluster (n = 2855, 40.31%) reported positive mental health across indicators; the anxious cluster (n = 1994, 28.15%) reported high possible anxiety symptoms and otherwise generally positive results; the stressed and hurting cluster (n = 667, 9.42%) reported sub-clinical depression and possible anxiety symptoms and some self-harm; the distressed and ideating cluster (n = 1116, 15.76%) reported above-cutoff depression and possible anxiety symptoms and high suicide ideation; and the severe cluster (n = 451; 6.37%) reported the least positive mental health across indicators. Female, rainbow, Māori and Pacific students and those in higher deprivation areas were overrepresented in higher severity clusters. Factors including exposure to sexual harm and discrimination were associated with increasing cluster severity.
Conclusion:
We identified high prevalence of mental health challenges among adolescents, with distinct clusters of need. Youth mental health is not ‘one size fits all’. Future research should explore youth behaviour and preferences in accessing support and consider how to best support the mental health of each cluster.
Introduction
Over the last decade, self-report surveys of adolescents in many nations have identified substantial increases in clinically significant anxiety and depression symptoms. For example, close to doubling of significant depressive symptoms among adolescents in Aotearoa New Zealand (NZ) 2012–2019 has been reported (Fleming et al., 2020b; Sutcliffe et al., 2023), as have similar increases in the United States 2012–2018 (Keyes et al., 2019) and Canada 2011–2018 (Wiens et al., 2020), and large increases in Russia, the Netherlands and elsewhere (Collishaw and Sellers, 2020; Slobodskaya et al., 2023). Since these periods, further increases in distress have been reported, potentially exacerbated by the COVID-19 pandemic (Power et al., 2020). Suicidality is a particular concern, with NZ’s youth suicide rates consistently among the highest in the Organisation for Economic Co-operation and Development (Gromada et al., 2020), and recent notable increases in prevalence of suicide ideation and attempts (Sutcliffe et al., 2023). The mental health treatment gap (i.e. the gap between demand for and supply of mental health services) has remained wide or even widened, despite increased investments or new approaches in many nations (Patel et al., 2018).
In this context, it is vital to explore patterns and levels of need to better target already limited resources. While reporting rates of clinically concerning scores on measures of specific disorders is helpful, this approach has limitations in understanding population needs. Analyses based on dichotomised variables (disorder or absence of disorder; under or over cutoff) do not capture information on variations in severity or comorbidities. It might be, e.g., that while prevalence of depression has increased, the severity of disorder may have declined. Further, comorbidities are common and there is an increasing clinical focus on patterns of symptoms that cross traditional diagnostic boundaries (Shah et al., 2020). Understanding constellations of distress can help to guide responses.
Cluster analysis is a data reduction technique that allows the identification of groups or clusters within a sample, such that members within each group are maximally similar to one another, and different from those in other groups (Giles, 2002). Such analyses allow greater parsimony in subsequent analyses by reducing the number of potential comparisons needed, thus reducing the risk of familywise error. Cluster analysis also allows both continuous and categorical (coded numerically) variables, such that researchers can take advantage of the greater variance associated with scale scores rather than dichotomising variables according to cutoffs, to identify statistically meaningful groups within a population (Giles, 2002). Multiple discriminant function analysis (MDFA) is a multivariate analysis that predicts group membership based on a set of variables and determines the contribution of each variable in distinguishing between groups (Hair et al., 1995).
The Youth19 Rangatahi Smart Survey of NZ secondary school students (13–18 years, n = 7721, see www.youth19.ac.nz) is the latest in the NZ Youth2000 survey series (Fleming et al., 2022). Previous Youth19 analyses identified high levels of distress among NZ adolescents, especially females, Indigenous Māori students, Pacific students and those living in less wealthy neighbourhoods (Clark et al., 2022; Sutcliffe et al., 2023). Large increases in distress from 2012 to 2019 were apparent across all demographic groups but were particularly stark among groups with pre-existing higher prevalence, increasing disparities (Sutcliffe et al., 2023). Other Youth19 analyses identified high distress among gender-diverse and same- and multiple-sex attracted students (Fenaughty et al., 2021a, 2021b), among other groups. In NZ, as in many nations, there are strong calls to action, from increasing clinical services, to greater prevention efforts (Government Inquiry into Mental Health and Addiction, 2018). We aimed to contribute to understanding population mental health needs by exploring clusters of need and predictors of cluster membership in a large population survey.
Method
Survey design and procedure
We used data from the Youth19 Rangatahi Smart Survey (Youth19). Full methods are described elsewhere (Fleming et al., 2020a; Rivera-Rodriguez et al., 2021). Briefly, Youth19 is an anonymous, cross-sectional, health and wellbeing survey of NZ secondary school students (ages 13–18 years; n = 7721) conducted between May and September 2019 in the Auckland, Tai Tokerau and Waikato education regions. Combined, these regions include >47% of NZ’s secondary school population (Ministry of Education, 2019) and are highly diverse in ethnicity, deprivation and urban/rural distribution. Ethics approval was granted by the University of Auckland Ethics Committee (Reference #022244).
The survey used a two-stage cluster design. Mainstream schools with >50 students in years 9–13 (the secondary school years in NZ) were randomly selected from government databases (Education Counts, 2018). Forty-three of 78 selected schools participated. Two further pilot schools were included in the sample as methods remained consistent. Students were randomly selected from the school rolls (n = 12,359) and 7374 participated. Six kura kaupapa Māori (Māori language immersion schools) were purposively sampled and 4 participated, with all students invited (n = 486) and 347 participating. The final sample comprised 49 schools (response rate 57%) and 7721 participants (response rate 60%). For characteristics of participating schools, see Fleming et al. (2020a). Participant characteristics are shown in Table 2.
Leadership of each participating school provided written informed consent. Parents/caregivers were informed and could withdraw their young person before student selection. Students provided informed consent on hand-held tablets, which they then used to complete the survey. Participating students were invited to enter their main home address into a separate tablet. Resulting neighbourhood meshblock information was later linked with students’ survey files.
This study
A data access proposal (including research questions, selected variables, analysis plan and consideration for data sovereignty principles) was approved as per Youth2000 policy (www.youth19.ac.nz/the-surveys).
Variables
Variables are described in Table 1. Mental health and wellbeing variables were selected prior to analyses based on common indicators available within Youth19 data. Contextual variables were selected based on known adolescent risk and protective factors. All variables were assessed by self-report, except neighbourhood deprivation and locale (both based on neighbourhood meshblock data) and school decile (reflecting the socio-economic status of enrolled students’ communities; Ministry of Education, n.d.).
Youth19 variables.
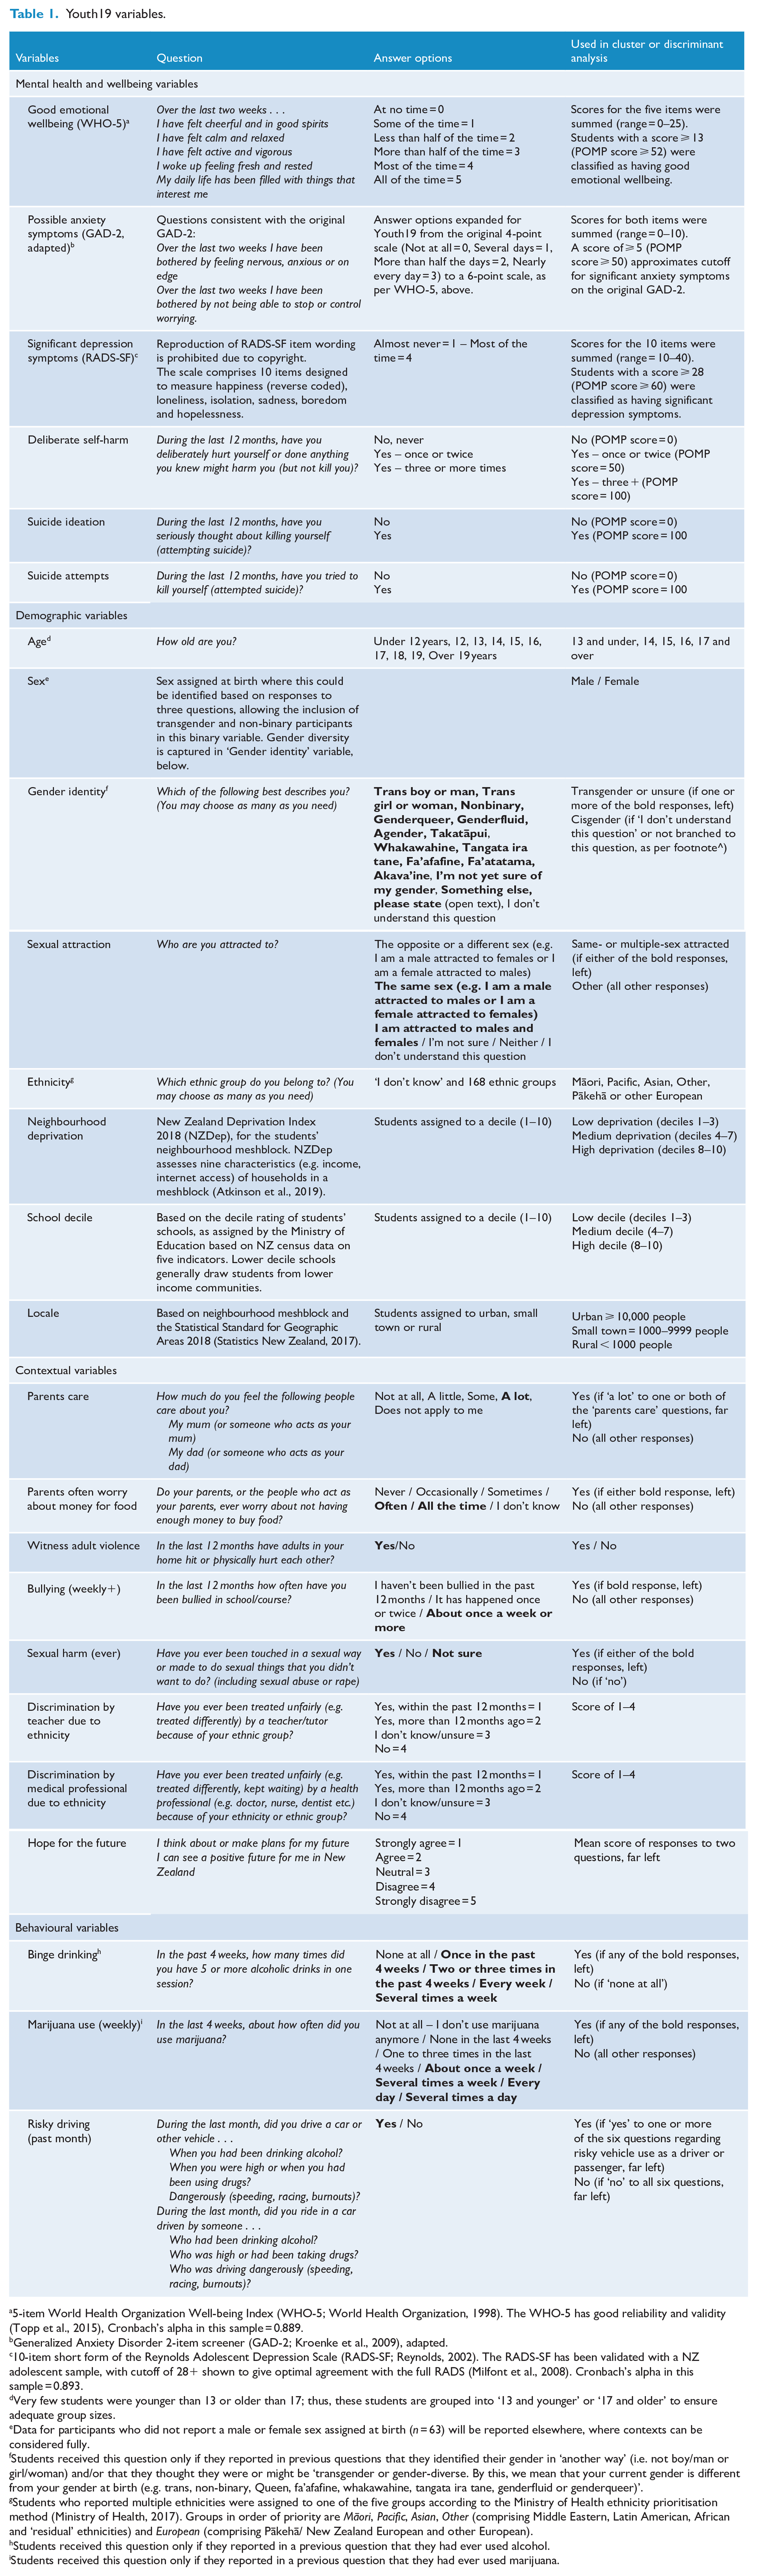
5-item World Health Organization Well-being Index (WHO-5; World Health Organization, 1998). The WHO-5 has good reliability and validity (Topp et al., 2015), Cronbach’s alpha in this sample = 0.889.
Generalized Anxiety Disorder 2-item screener (GAD-2; Kroenke et al., 2009), adapted.
10-item short form of the Reynolds Adolescent Depression Scale (RADS-SF; Reynolds, 2002). The RADS-SF has been validated with a NZ adolescent sample, with cutoff of 28+ shown to give optimal agreement with the full RADS (Milfont et al., 2008). Cronbach’s alpha in this sample = 0.893.
Very few students were younger than 13 or older than 17; thus, these students are grouped into ‘13 and younger’ or ‘17 and older’ to ensure adequate group sizes.
Data for participants who did not report a male or female sex assigned at birth (n = 63) will be reported elsewhere, where contexts can be considered fully.
Students received this question only if they reported in previous questions that they identified their gender in ‘another way’ (i.e. not boy/man or girl/woman) and/or that they thought they were or might be ‘transgender or gender-diverse. By this, we mean that your current gender is different from your gender at birth (e.g. trans, non-binary, Queen, fa’afafine, whakawahine, tangata ira tane, genderfluid or genderqueer)’.
Students who reported multiple ethnicities were assigned to one of the five groups according to the Ministry of Health ethnicity prioritisation method (Ministry of Health, 2017). Groups in order of priority are Māori, Pacific, Asian, Other (comprising Middle Eastern, Latin American, African and ‘residual’ ethnicities) and European (comprising Pākehā/ New Zealand European and other European).
Students received this question only if they reported in a previous question that they had ever used alcohol.
Students received this question only if they reported in a previous question that they had ever used marijuana.
Analysis
All analyses were performed using SPSS (IBM SPSS Statistics 27).
Cluster analysis
Mental health and wellbeing variables were transformed into percent of maximum possible (POMP) scores (range = 0–100; Cohen et al., 1999). Scale variables (wellbeing, depression symptoms, possible anxiety symptoms) were directly transformed (e.g. for short form of the Reynolds Adolescent Depression Scale [RADS-SF; range 10–40], 10 became 0, 40 became 100). Binary, single-item variables (suicide ideation, suicide attempt) were coded as 0 = ‘no’, 100 = ‘yes’. Self-harm was coded as 0 = ‘no’, 50 = ‘once or twice’, 100 = ‘three or more times’.
We used Ward’s method of clustering, a hierarchical agglomerative method that identifies clusters using squared Euclidean distances, according to least variance (Ward, 1963). We examined the agglomeration schedule and observed points of inflection (Norušis, 2012), which we considered alongside pragmatic clinical reasoning (e.g. acknowledging the important clinical distinction between suicide ideation and attempt), to identify the optimal number of clusters. Next, we generated two equal-sized analysis and holdout sub-samples based on median split of a uniform random variable and analysed each separately to test solution stability (Breckenridge, 2000; Clatworthy et al., 2005).
We then explored cluster membership by demographic factors (age, sex, gender identity, sexual attraction, ethnicity, neighbourhood deprivation, school decile and locale) using descriptive statistics and chi-square tests.
Secondary analysis
Of the combined 7721 participants, 638 (8.26%) were excluded from the cluster analysis due to missing data for ⩾1 mental health variable(s). We tested for differences between included and excluded sub-samples using t tests and chi-square analysis of available data for mental health and demographic variables.
Discriminant analysis
We performed a series of MDFAs to investigate demographic, contextual and behavioural predictors of cluster membership. Initial analyses indicated unequal covariances between clusters, so we classified cases using the separate-groups covariance matrix based on the discriminant functions (Hair et al., 1995). We generated two new equal-sized analyses and holdout sub-samples based on median split of a uniform random variable and tested the stability of the classification procedure using cross-validation of the two sub-samples (Hair et al., 1995).
Regardless of whether discriminant functions are statistically significant, Hair et al. (1995) recommend correct classification of participants at least 25% better than chance to be considered meaningful. Given unequal cluster sizes, we calculated the proportional chance criterion based on actual group sizes (27.98%). Hair et al. (1995) recommend interpretation of discriminant loadings greater than 0.50. Given the large sample size, we selected a lower criterion, interpreting as meaningful loadings greater than 0.20.
Results
Participants
Participant demographics for the entire Youth19 sample and those included in the cluster analysis are shown in Table 2.
Demographics of Youth19 participants overall and those included.
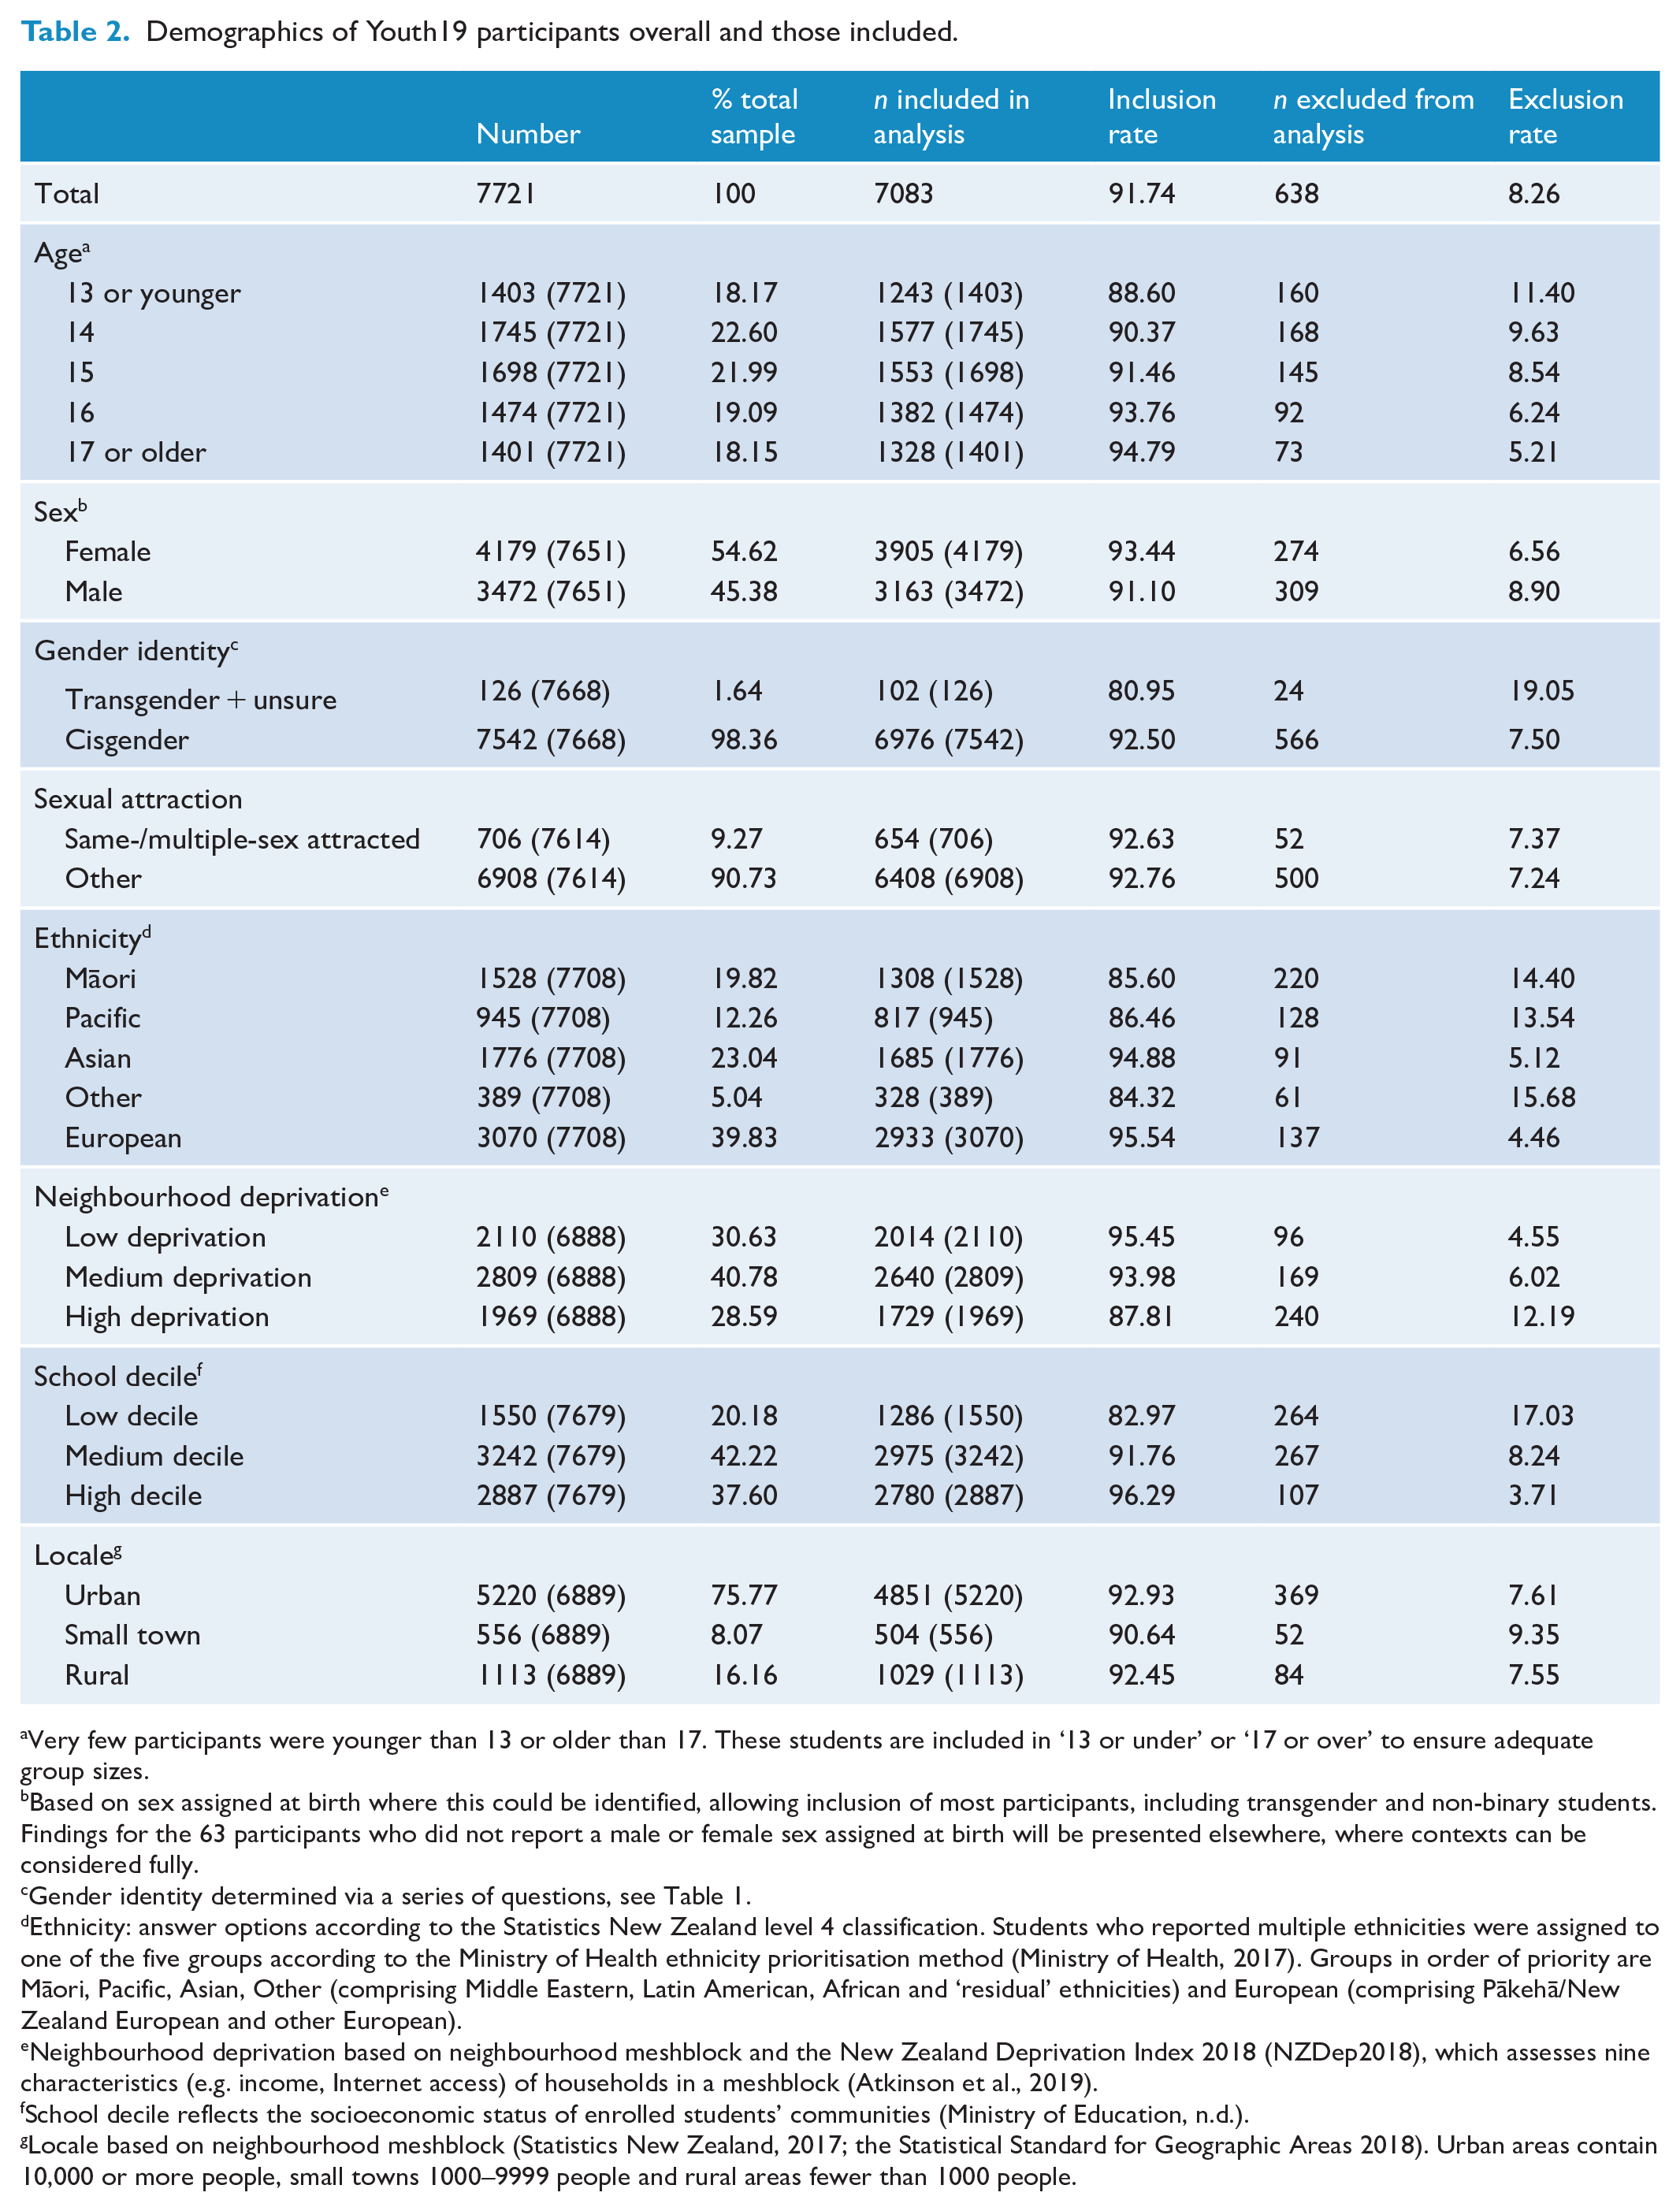
Very few participants were younger than 13 or older than 17. These students are included in ‘13 or under’ or ‘17 or over’ to ensure adequate group sizes.
Based on sex assigned at birth where this could be identified, allowing inclusion of most participants, including transgender and non-binary students. Findings for the 63 participants who did not report a male or female sex assigned at birth will be presented elsewhere, where contexts can be considered fully.
Gender identity determined via a series of questions, see Table 1.
Ethnicity: answer options according to the Statistics New Zealand level 4 classification. Students who reported multiple ethnicities were assigned to one of the five groups according to the Ministry of Health ethnicity prioritisation method (Ministry of Health, 2017). Groups in order of priority are Māori, Pacific, Asian, Other (comprising Middle Eastern, Latin American, African and ‘residual’ ethnicities) and European (comprising Pākehā/New Zealand European and other European).
Neighbourhood deprivation based on neighbourhood meshblock and the New Zealand Deprivation Index 2018 (NZDep2018), which assesses nine characteristics (e.g. income, Internet access) of households in a meshblock (Atkinson et al., 2019).
School decile reflects the socioeconomic status of enrolled students’ communities (Ministry of Education, n.d.).
Locale based on neighbourhood meshblock (Statistics New Zealand, 2017; the Statistical Standard for Geographic Areas 2018). Urban areas contain 10,000 or more people, small towns 1000–9999 people and rural areas fewer than 1000 people.
Cluster analysis
We observed points of inflection at the two and four cluster points of the agglomeration schedule (see Supplemental Figure 1). As per the recommendations of Hair et al. (1995), we examined solutions for two to five clusters (one above the second inflection point). There is no standard, objective procedure for selecting the optimal number of clusters (Hair et al., 1995), with researchers advised to use ‘a priori criteria, practical judgement, common sense, or theoretical foundations’ (Hair et al., 1995, p. 443). The two- and three-cluster solutions simply separated participants reporting suicidality from others, with those reporting other indicators of distress without suicidality clustered with those reporting little or no distress, providing insufficient information to meet our research objectives. Thus, we considered the four- and five-cluster solutions. Both identified ‘healthy’ and apparently sub-clinical groups, with the five-cluster solution further separating the ‘subclinical’ group into those characterised by above-threshold anxiety symptoms only and those reporting at-threshold concerns across indicators. We determined that the five-cluster solution offered the best balance of interpretability and practicality (Giles, 2002) to meet our objective of identifying clinically meaningful groups. Analysis and holdout samples produced near-identical proportions of participants allocated to each of the five clusters. Sensitivity analysis showed that the POMP score encoding of the binary variable as ‘No’ = 0 and ‘Yes’ = 100 had little effect on the specified clusters or the prediction accuracy (e.g. recoding ‘No’ = 25 ‘Yes’ = 75 made no difference). Having validated the number of clusters, all further analyses are based on a five-cluster solution of the whole sample. Figure 1 and Supplemental Table 1 show the mean POMP score for each mental health variable in each cluster. We then interpreted the nature of the clusters based on comparison of variables within and across clusters.
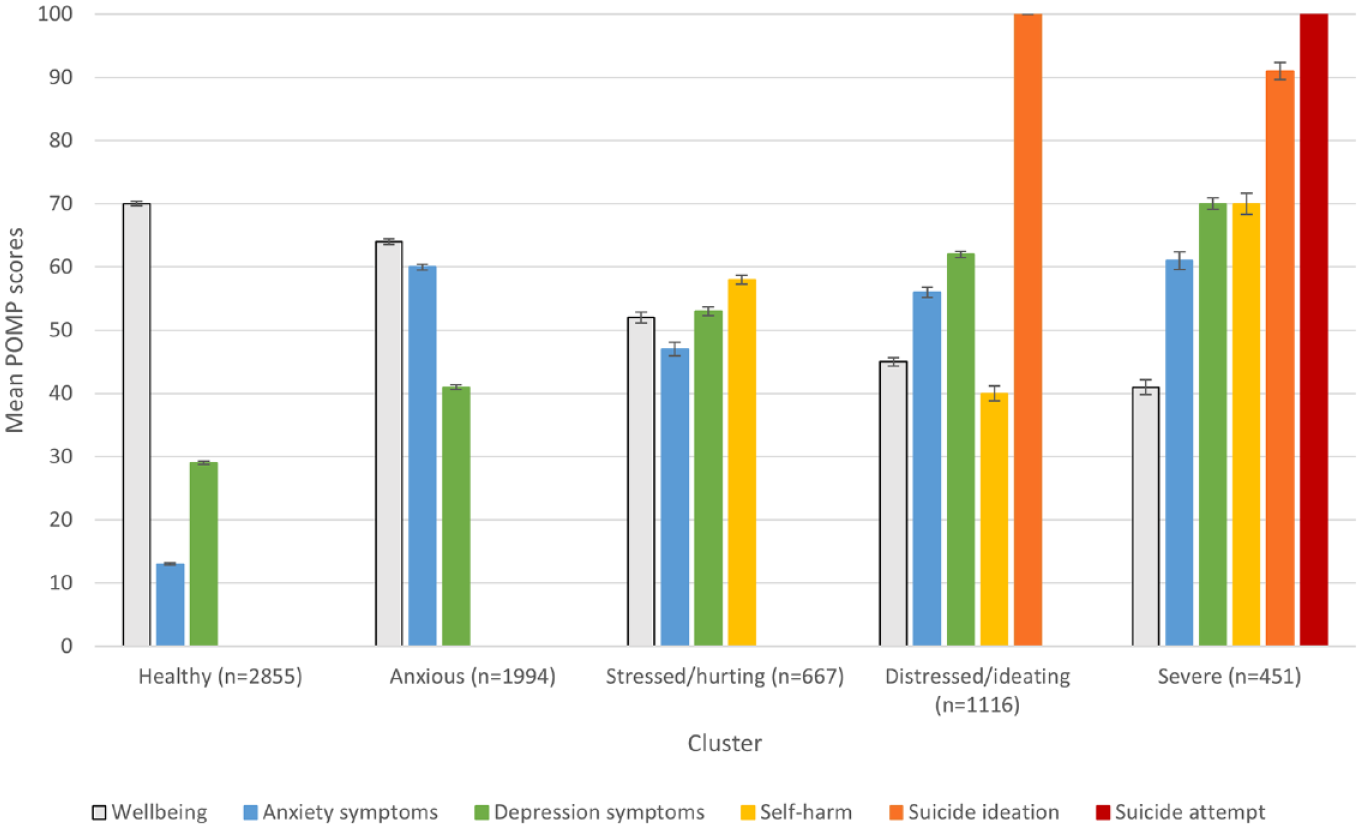
Mean POMP scores (with standard error) for mental health and wellbeing indicators, by cluster.
Healthy (n = 2855, 40.31%)
Members reported the most positive mental health on all indicators, including the highest mean wellbeing score (M = 70.10, vs cutoff for good wellbeing = 52+) and the lowest mean scores for possible anxiety (M = 13.42, vs cutoff = 50+) and depression (M = 28.79, vs cutoff = 60+) symptoms. None reported past-year self-harm or suicidality.
Anxious (n = 1994, 28.15%)
Members reported very high possible anxiety scores (M = 59.96) and relatively positive results on other indicators, including good wellbeing (M = 63.52), slightly elevated (but sub-cutoff) scores for depression symptoms (M = 41.44) and no past-year self-harm or suicidality.
Stressed and hurting (n = 667, 9.42%)
Members reported reduced, but above cutoff, wellbeing (M = 52.24) and elevated, sub-cutoff scores for possible anxiety (M = 47.41) and depression (M = 52.81) symptoms. Some reported past-year self-harm (M = 57.72). None reported past-year suicidality.
Distressed and ideating (n = 1116, 15.76%)
Members reported concerning levels of wellbeing (M = 44.63), possible anxiety symptoms (M = 55.66) and depression symptoms (M = 62.23). Some reported past-year self-harm (M = 40.28), all reported suicide ideation and none reported suicide attempt.
Severe (n = 638, 6.37%)
Members reported the least positive mental health across indicators, including the lowest wellbeing scores (M = 41.09) and the highest scores for possible anxiety (M = 60.51) and depression (M = 70.06) symptoms and past-year self-harm (M = 69.29). Almost all reported past-year suicide ideation (M = 91.35) and all reported past-year suicide attempts (M = 100).
Descriptive statistics and chi-square analyses of cluster membership by demographic factors indicated important differences in the proportion of members of various demographic groups within clusters. Groups overrepresented in higher severity clusters included females, transgender and gender questioning students, same- or multiple-sex attracted students, Māori students, Pacific students and those from less wealthy areas. Results of chi-square tests are shown in Table 3. Given eight tests were performed, a Bonferroni correction for multiple comparisons was applied (original α = 0.05; eight comparisons; adjusted α = 0.00625).
Demographic groups by cluster membership.
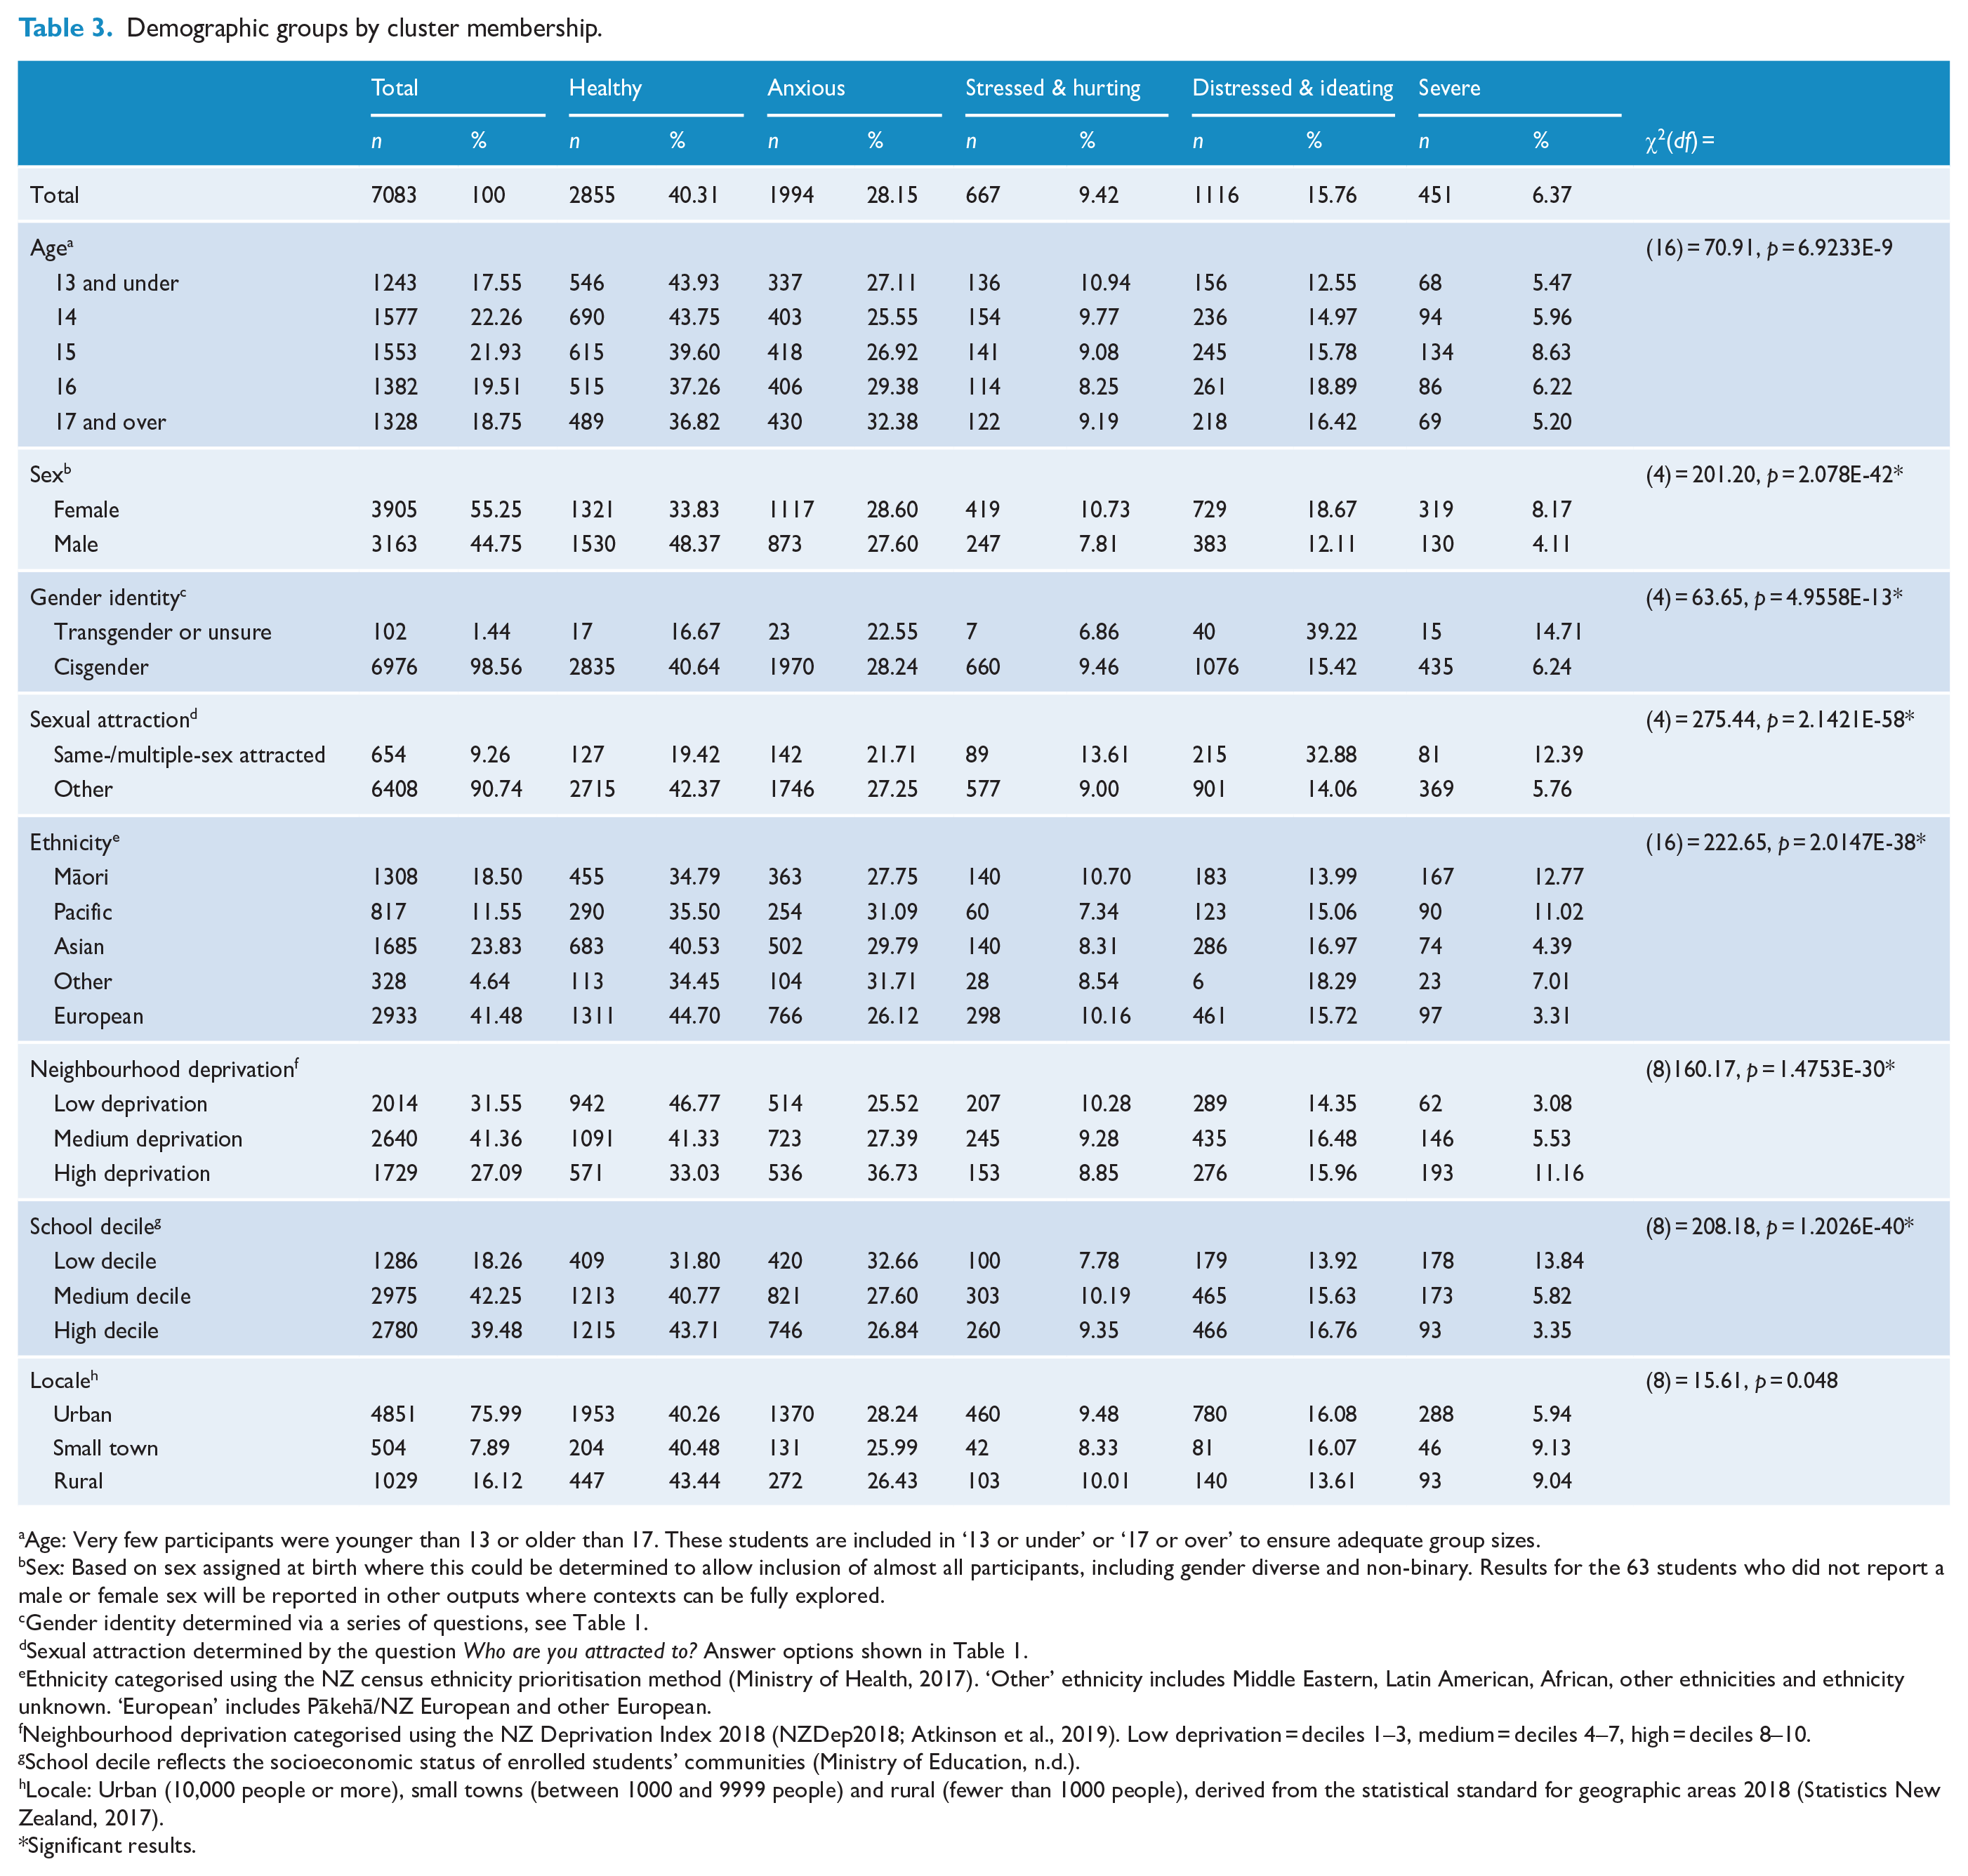
Age: Very few participants were younger than 13 or older than 17. These students are included in ‘13 or under’ or ‘17 or over’ to ensure adequate group sizes.
Sex: Based on sex assigned at birth where this could be determined to allow inclusion of almost all participants, including gender diverse and non-binary. Results for the 63 students who did not report a male or female sex will be reported in other outputs where contexts can be fully explored.
Gender identity determined via a series of questions, see Table 1.
Sexual attraction determined by the question Who are you attracted to? Answer options shown in Table 1.
Ethnicity categorised using the NZ census ethnicity prioritisation method (Ministry of Health, 2017). ‘Other’ ethnicity includes Middle Eastern, Latin American, African, other ethnicities and ethnicity unknown. ‘European’ includes Pākehā/NZ European and other European.
Neighbourhood deprivation categorised using the NZ Deprivation Index 2018 (NZDep2018; Atkinson et al., 2019). Low deprivation = deciles 1–3, medium = deciles 4–7, high = deciles 8–10.
School decile reflects the socioeconomic status of enrolled students’ communities (Ministry of Education, n.d.).
Locale: Urban (10,000 people or more), small towns (between 1000 and 9999 people) and rural (fewer than 1000 people), derived from the statistical standard for geographic areas 2018 (Statistics New Zealand, 2017).
Significant results.
Cluster membership by demographic factors is shown in Table 3, Supplemental Table 2 and Supplemental Figures 2–14. While discriminant analysis considers the relationship between demographic factors and cluster membership in a more nuanced way, these simple analyses provide clear information that can easily be represented visually, which may be useful for some audiences.
Secondary analysis
T tests and chi-square analyses indicated that, based on their incomplete survey information, excluded participants (n = 638) reported less positive mental health than included participants (n = 7083) and that males, younger participants and members of Māori, Pacific and ‘Other’ ethnic groups were disproportionately excluded. For details of analysis, see ‘Excluded participant analysis’ in the Supplemental material.
Discriminant analysis
We introduced potential predictors of cluster membership in phases based on theoretical similarity, beginning with the most ‘distal’.
Phase 1
Using demographic factors (age, sex, gender identity, sexual attraction, ethnicity, school decile, neighbourhood deprivation and locale) as predictors of cluster membership, we calculated four discriminant functions, three of which were significant, function 1 χ2 (44) = 454.24, p < 0.001; function 2 χ2 (30) = 151.80, p < 0.001; function 3 χ2 (18) = 52.15, p < 0.001. Comparison of group centroids (means) indicated that the first function maximally separated the healthy and severe groups, the second separated the distressed and ideating and severe groups and the third separated the severe and anxious groups (Table 4).
Groups centroids (means) for each discriminant function, phase 1.
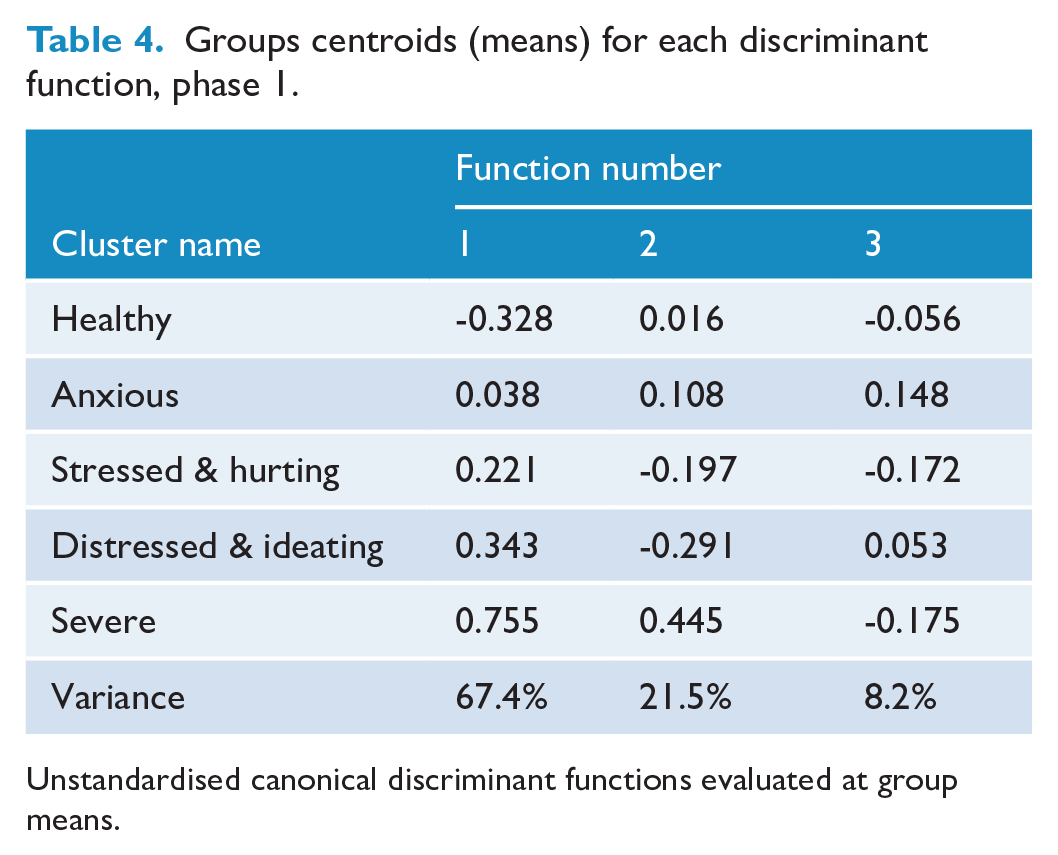
Unstandardised canonical discriminant functions evaluated at group means.
To interpret the discriminant functions, we considered the structure matrix of correlations between predictors and participant scores on each function (see Supplemental Table 3). Same- or multiple-sex attraction (0.63), higher neighbourhood deprivation (0.42), gender diversity (0.24) and Māori ethnicity (0.22) were associated with higher function 1 scores, thus greater likelihood of allocation to the severe (vs healthy) cluster. Males (−0.60) and those attending higher decile schools (-0.35) had lower function 1 scores and were therefore more likely to be classified as healthy (vs severe).
Allocation to the severe rather than the distressed and ideating cluster (function 2) was associated with lower school decile (−0.72), higher neighbourhood deprivation (0.54), Pacific ethnicity (0.42) and Māori ethnicity (0.41). Same- or multiple-sex attraction (−0.56) predicted the reverse allocation.
Finally, allocation to the severe over the anxious cluster (function 3) was associated with Pacific ethnicity (−0.28), same- or multiple-sex attraction (−0.27) and Māori ethnicity (−0.26). Older age (0.71), Asian ethnicity (0.42) and more urban locale (−0.21) predicted the reverse allocation.
Correct classification rates were similar for the analysis (39.9%) and holdout (38.8%) samples, indicating that the discriminant functions were robust. Importantly, both rates were >34.98% (i.e. 25% greater than proportional chance 27.98%), thus can be considered meaningful (Hair et al., 1995).
Phase 2
Next, we added contextual factors (discrimination by a teacher, discrimination by a medical professional, witnessing adult violence, sexual harm, experiencing bullying, parents care, parents worry about money for food and future hopes and plans) to the demographic predictors.
Again, we identified three significant discriminant functions, function 1 χ2 (76) = 826.57, p < 0.001; function 2 χ2 (54) = 158.66, p < 0.001; function 3 χ2 (34) = 65.77, p = 0.001, with the first primarily discriminating between the healthy and severe groups, the second between the distressed and ideating and severe groups and the third between the anxious and severe groups (Table 5).
Groups centroids (means) for each discriminant function, phase 2.
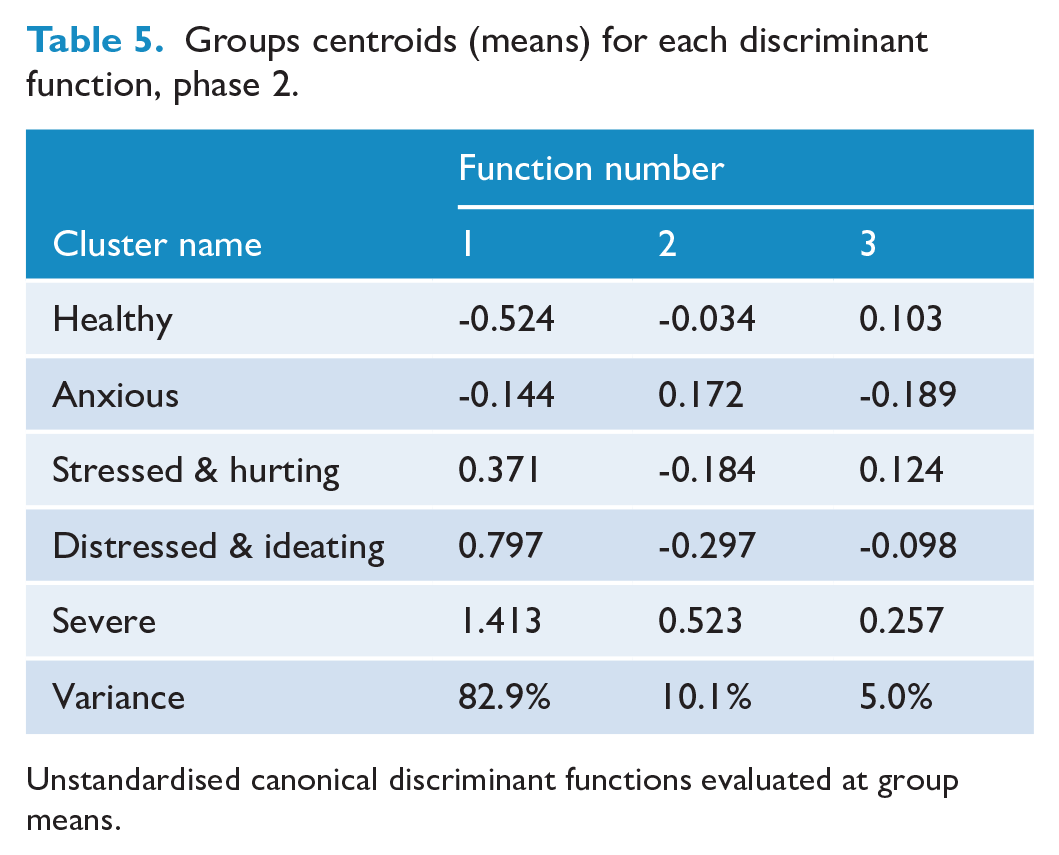
Unstandardised canonical discriminant functions evaluated at group means.
Again, the structure matrix (see Supplemental Table 4) suggested that function 1 differentiated clusters in order of severity. Increasing cluster severity was associated with experiencing sexual harm (0.53), same- or multiple-sex attraction (0.41), less parental care (−0.38), fewer future hopes and plans (0.37), discrimination by a teacher (−0.34), being female (−0.34), parental worry about money for food (0.32), discrimination by a medical professional (−0.27), experiencing bullying (0.27), witnessing adult violence (0.24) and higher neighbourhood deprivation (0.22).
Allocation to the severe vs the distressed and ideating cluster (function 2) was associated with lower school decile (−0.62), higher neighbourhood deprivation (0.51), Māori ethnicity (0.34), parental worry about money for food (0.33), Pacific ethnicity (0.30), witnessing adult violence (0.27) and discrimination by a medical professional (−0.24). Same- or multiple-sex attraction (−0.48) and experiencing sexual harm (−0.21) predicted the reverse allocation.
Allocation to the severe over the anxious cluster (function 3) was associated with younger age (−0.61), being male (0.43), more rural locale (0.33), experiencing bullying (0.32), Māori ethnicity (0.25), Pacific ethnicity (0.22) and lower school decile (−0.21). Asian ethnicity (−0.38) predicted the reverse allocation.
Inclusion of contextual variables improved the correct classification rate further above proportional chance (analysis sample 44.1%, holdout sample 42.6%), with reasonably good consistency in the classification scheme.
Phase 3
We added behavioural variables (marijuana, binge drinking, risky driving) to demographic and contextual predictor variables. Again, there were three significant functions, function 1 χ2 (88) = 893.63, p < 0.001; function 2 χ2 (63) = 207.37, p < 0.001; function 3 χ2 (40) = 87.68 p < 0.001, with the first primarily discriminating between the healthy and severe groups and the second between the distressed and ideating and severe groups. However, the third function primarily distinguished between the anxious and stressed and hurting groups (Table 6).
Groups centroids (means) for each discriminant function, phase 3.
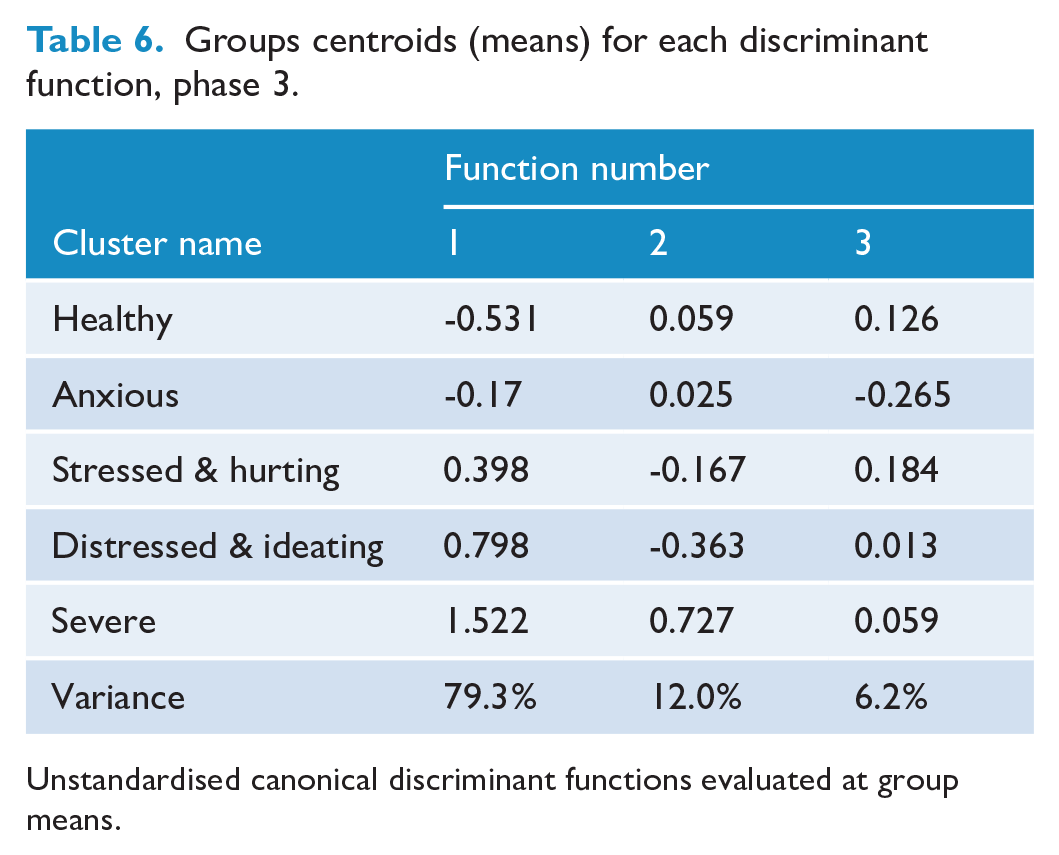
Unstandardised canonical discriminant functions evaluated at group means.
The structure matrix (see Supplemental Table 5) indicates that increasing cluster severity (function 1) was associated with sexual harm (0.52), same- or multiple-sex attraction (0.40), less parental care (−0.37), fewer future hopes and plans (0.36), risky driving (0.35), discrimination by a teacher (−0.32), being female (0.32), parental worry about money for food (0.32), experiencing bullying (0.27), discrimination by a medical professional (−0.26), witnessing adult violence (0.23), binge drinking (0.23) and marijuana use (0.22).
Allocation to the severe over the distressed and ideating cluster (function 2) was associated with marijuana use (0.53), lower school decile (−0.53), higher neighbourhood deprivation (0.35), Māori ethnicity (0.31), Pacific ethnicity (0.27), parental worry about money for food (0.24), witnessing adult violence (0.21) and being male (0.21). Same- or multiple-sex attraction (−0.39) predicted the reverse allocation.
Allocation to the stressed and hurting over the anxious cluster (function 3) was associated with younger age (−0.51), lower neighbourhood deprivation (−0.37), marijuana use (0.34), being male (0.29), higher school decile (0.24) and more rural locale (0.22). Asian ethnicity (−0.25) predicted the reverse allocation.
Addition of the behavioural variables did not improve the predictive validity of the model, with the percentage of cases correctly classified (analysis sample 44.3%, holdout sample 41.9%) similar to that in phase 2. There was reasonably good consistency in the classification scheme.
The final classification results (Table 7) show 44.3% of the analysis sample (and 41.9% of the holdout sample) were correctly classified at 50% or more above proportional chance, indicating that the included variables did a reasonably good job of predicting cluster membership and the analysis can be considered meaningful. Chi-square tests of the differences in proportion (predicted vs actual) indicated that cluster membership was predicted significantly better than chance for all groups (all ps < 0.00001) and particularly well for the severe (Z = 120.69), healthy (Z = 40.66) and distressed and ideating (Z = 40.17) groups. The MDFA was (relatively) poorest at correctly predicting stressed and hurting (Z = 18.46) and anxious (Z = 8.79) group membership.
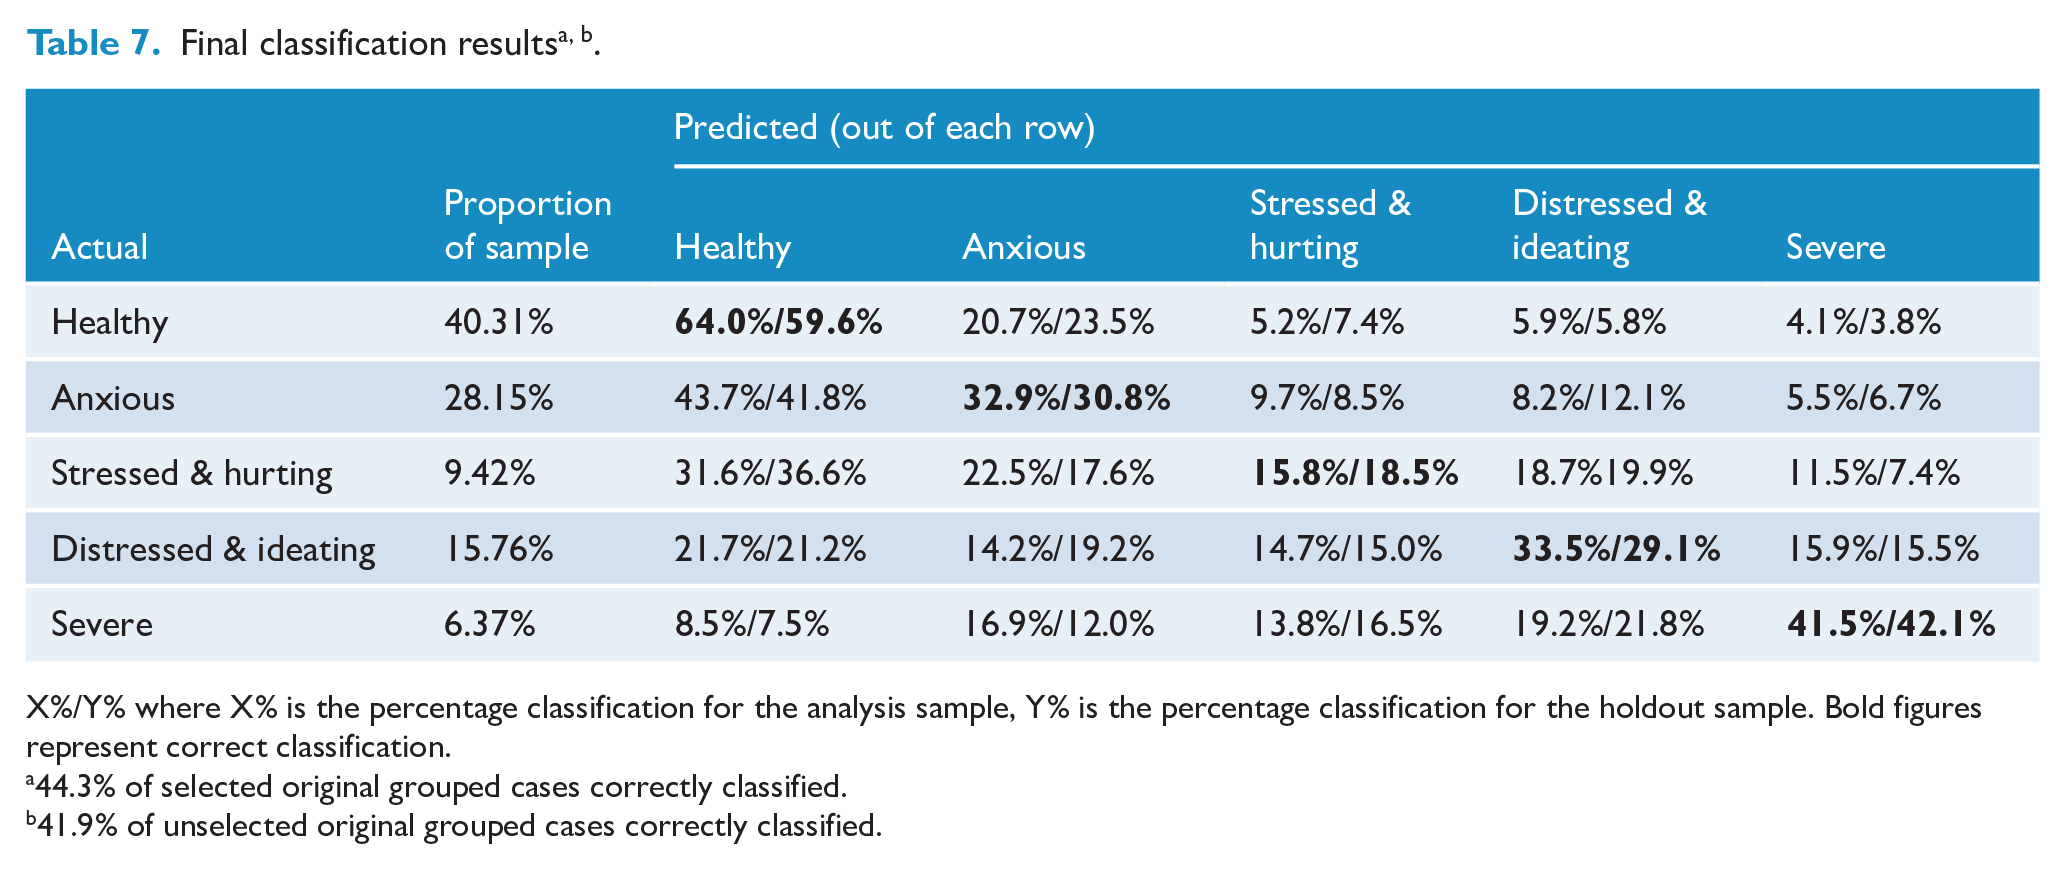
X%/Y% where X% is the percentage classification for the analysis sample, Y% is the percentage classification for the holdout sample. Bold figures represent correct classification.
44.3% of selected original grouped cases correctly classified.
41.9% of unselected original grouped cases correctly classified.
Discussion
Of 7721 participating adolescents, 7083 were statistically allocated to one of the five distinct mental health clusters based on self-reported wellbeing, depression and possible anxiety symptoms and past-year self-harm, suicide ideation and suicide attempt. Importantly, only 40% were healthy with no significant symptoms on any included measures, while around 6% appeared severe, with 100% prevalence of suicide attempt and high overall levels of self-harm, depression symptoms and possible anxiety symptoms. Three intermediate clusters were characterised by high anxiety symptoms with otherwise positive results (anxious, 28%); scores approaching cutoffs for depression and anxiety symptoms and some self-harm (stressed and hurting, 9%); and above-cutoff scores for depression and possible anxiety symptoms and high suicide ideation without attempt (distressed and ideating, 16%). Female, Māori, Pacific and rainbow students were overrepresented in higher severity clusters, with inequities at least partially explained by factors including exposure to harms such as sexual abuse and discrimination. Key factors differentiating those reporting suicide attempt (severe) vs ideation without attempt (distressed and ideating) were marijuana use; school, neighbourhood and household deprivation; Māori and Pacific ethnicity; and exposure to violence and discrimination. While findings are cross-sectional so cannot address causality, they enhance our understanding of patterns of youth mental health needs and highlight important targets for policy and practice.
Concerningly, healthy students comprised only 40% of the sample. Mental health service models are typically predicated on the assumption that a substantial majority are ‘well’ and small groups have significant symptoms, which can be managed by primary health or specialist services, the latter often funded for the most severely affected 5% or fewer. Considering that around 6% were classed as severe, indicating past-year suicide attempt and current significant needs, 16% as distressed and ideating, indicating suicide ideation and high depression symptoms, and 9% as stressed and hurting, indicating scores close to clinical cutoffs and some self-harm, there is a challenging mismatch between level of need and capacity to address it.
Our findings of inequity in mental health outcomes by sex, ethnicity, socio-economic status and sexuality were consistent with our and others’ previous findings. Experience of harms including sexual abuse, exposure to violence, bullying and discrimination, as well as food insecurity and poorer perceived parental care, were stronger predictors of increased severity than ethnicity and less proximal indicators of deprivation, suggesting important implications for a mental health equity focus and targeted response. These minority identities are predictive largely because they are markers of predisposing experiences, the effects of minority stress and (for Māori) colonisation, such as experiencing violence, deprivation and exclusion in their homes, schools and communities (Clark et al., 2022; Meyer, 2003).
Sexual harm, the strongest single predictor of higher cluster severity, is alarmingly common among youth (e.g. in Youth19, 18% responded ‘yes’ or ‘maybe/not sure’; Fleming et al., 2022) and is known to be highly disruptive to development, increasing negative outcomes across domains (Fergusson et al., 2013). Clinicians should be alert to and action signs of sexual harm as part of presentations. Exposure to other harms such as witnessing adult violence in the home, bullying and discrimination in school/health settings was also important. Initiatives to address these are required, including clinician responsivity and enhancing community willingness and ability to respond appropriately. Same- or multiple-sex attraction was also among key predictors of increasing severity. While sexuality does not increase risk per se, it contributes to negative outcomes through the accumulation of additional minority stressors that accompany living in a heteronormative world (Meyer, 2003). Previous work showing that rainbow-friendly school environments ameliorate sexuality-based differences in depression (Denny et al., 2016) highlights the value of creating welcoming environments for rainbow students and others (see Fenaughty 2021a, 2021b for specific strategies). Reporting poorer perceptions of parental care and greater food insecurity were also key predictors. The extensive attachment literature indicates the importance of parental relationships for sense of security and ability to manage threats such as poverty (e.g. Johnson et al., 2018). The necessity for dual-working households may ease deprivation at the expense of additional stress and limited time with children.
Combining cluster and discriminant analyses confirmed that self-harm, suicide ideation and, especially, suicide attempts are strongly associated with anxiety, depression and also with experiences of harm such as sexual abuse, exposure to violence and ethnic discrimination, along with food insecurity. This affirms the necessity of taking self-harm and suicidality seriously, and not dismissing these or framing them primarily or necessarily as a ‘lack of resilience’ or ‘attention-seeking’. It is vital to acknowledge that such distress may be a normal response to an unbearable, and potentially chronic, situation. Systemic action at multiple levels to reduce exposure to harms is required, as is the provision of affirming, trauma-informed support to individuals.
Strengths, limitations and future research
Strengths include a large, representative sample selected using robust sampling methods and use of a data-driven approach to gain a more nuanced understanding of mental health need than is typically explored in such datasets. A key limitation was differential exclusion. Only students present on the day of the survey who opted to participate and completed all six measures were included. Those absent or providing incomplete responses are likely to have had less positive mental health, decreasing our confidence that our solution is optimal. Alternatively, our solution may be optimal, but excluded participants are likely to have increased the relative sizes of more severe clusters. Further, males, younger participants and Māori, Pacific and ‘Other’ ethnicity participants are underrepresented (e.g. around 14% of Māori participants were excluded due to missing data, compared with 8% of the total sample), potentially impacting outcomes. Findings for Māori students may be further limited through unintentional omission of contextual and risk variables of particular importance for Māori (e.g. identity, belonging and culturally important aspects of family connectedness). Data were collected prior to the COVID-19 pandemic; thus, changes in the size or shape of mental health need due to the pandemic are not captured. Despite very high scores for anxiety symptoms, the anxious cluster (28%) generally reported otherwise reasonably good wellbeing. The anxiety measure used here is less tested than other included indicators; thus, conclusions about this group should be more tentative. Future research should explore the validity of the measure in an adolescent population. Finally, our predictors of mental health need do not fully or consistently explain cluster membership. Mental health difficulties result from complex interplay of factors, including factors we did not assess; thus, we did not intend or expect to fully (or even close to fully) predict cluster membership based on these limited variables.
Separate analyses are required to determine the optimal cluster structure and ensure inclusion of key contextual and behavioural variables for Māori students. Analyses for other groups (e.g. females, rainbow students) could also be valuable, where participant numbers allow.
Implications for policy and practice
We cannot assume good adolescent mental health is the norm, highlighting the need for multiple interventions at all levels from systemic to individual.
Long-term, societal-level interventions are vital for addressing key harms that predict severity, particularly sexual harm, racism/discrimination and exposure to violence (and poverty).
In the shorter term, we need to reach more individuals than currently by providing more (and more diverse) scalable services that do not assume unrealistically low levels of high need.
Given the disproportionate burden for Māori, rainbow and other groups, responses need to centre these groups at the heart of service provision. There is a particular need for Indigenous leadership to ‘self-determine holistic Indigenous health models, systems, practices, and strategies that are developmentally appropriate, comprehensive, and well-resourced’ (Clark et al., 2022: 2).
Conclusion
We found high mental health challenges, which grouped into five distinct clusters, with most students reporting some significant distress, and around one in five at a potentially clinical level. Need was unfairly distributed, with female, Māori, Pacific and rainbow students and those living with socio-economic deprivation disproportionately represented in higher severity clusters. Predictors of increasing severity included exposure to harms such as sexual abuse, violence and ethnic discrimination, as well as food insecurity and poorer perceived parental care. Long-term actions to address determinants and ensure all young people are safe, supported and have opportunities to thrive are required, as well as increased access to support in services and communities. Given the scale of serious need, mental health services for a small, specialist percentage are not sufficient.
Supplemental Material
sj-docx-1-anp-10.1177_00048674241243262 – Supplemental material for Distinct profiles of mental health need and high need overall among New Zealand adolescents – Cluster analysis of population survey data
Supplemental material, sj-docx-1-anp-10.1177_00048674241243262 for Distinct profiles of mental health need and high need overall among New Zealand adolescents – Cluster analysis of population survey data by Kylie Sutcliffe, Marc Wilson, Terryann C Clark, Sue Crengle and Terry (Theresa) Fleming in Australian & New Zealand Journal of Psychiatry
Supplemental Material
sj-png-10-anp-10.1177_00048674241243262 – Supplemental material for Distinct profiles of mental health need and high need overall among New Zealand adolescents – Cluster analysis of population survey data
Supplemental material, sj-png-10-anp-10.1177_00048674241243262 for Distinct profiles of mental health need and high need overall among New Zealand adolescents – Cluster analysis of population survey data by Kylie Sutcliffe, Marc Wilson, Terryann C Clark, Sue Crengle and Terry (Theresa) Fleming in Australian & New Zealand Journal of Psychiatry
Supplemental Material
sj-png-11-anp-10.1177_00048674241243262 – Supplemental material for Distinct profiles of mental health need and high need overall among New Zealand adolescents – Cluster analysis of population survey data
Supplemental material, sj-png-11-anp-10.1177_00048674241243262 for Distinct profiles of mental health need and high need overall among New Zealand adolescents – Cluster analysis of population survey data by Kylie Sutcliffe, Marc Wilson, Terryann C Clark, Sue Crengle and Terry (Theresa) Fleming in Australian & New Zealand Journal of Psychiatry
Supplemental Material
sj-png-12-anp-10.1177_00048674241243262 – Supplemental material for Distinct profiles of mental health need and high need overall among New Zealand adolescents – Cluster analysis of population survey data
Supplemental material, sj-png-12-anp-10.1177_00048674241243262 for Distinct profiles of mental health need and high need overall among New Zealand adolescents – Cluster analysis of population survey data by Kylie Sutcliffe, Marc Wilson, Terryann C Clark, Sue Crengle and Terry (Theresa) Fleming in Australian & New Zealand Journal of Psychiatry
Supplemental Material
sj-png-13-anp-10.1177_00048674241243262 – Supplemental material for Distinct profiles of mental health need and high need overall among New Zealand adolescents – Cluster analysis of population survey data
Supplemental material, sj-png-13-anp-10.1177_00048674241243262 for Distinct profiles of mental health need and high need overall among New Zealand adolescents – Cluster analysis of population survey data by Kylie Sutcliffe, Marc Wilson, Terryann C Clark, Sue Crengle and Terry (Theresa) Fleming in Australian & New Zealand Journal of Psychiatry
Supplemental Material
sj-png-14-anp-10.1177_00048674241243262 – Supplemental material for Distinct profiles of mental health need and high need overall among New Zealand adolescents – Cluster analysis of population survey data
Supplemental material, sj-png-14-anp-10.1177_00048674241243262 for Distinct profiles of mental health need and high need overall among New Zealand adolescents – Cluster analysis of population survey data by Kylie Sutcliffe, Marc Wilson, Terryann C Clark, Sue Crengle and Terry (Theresa) Fleming in Australian & New Zealand Journal of Psychiatry
Supplemental Material
sj-png-15-anp-10.1177_00048674241243262 – Supplemental material for Distinct profiles of mental health need and high need overall among New Zealand adolescents – Cluster analysis of population survey data
Supplemental material, sj-png-15-anp-10.1177_00048674241243262 for Distinct profiles of mental health need and high need overall among New Zealand adolescents – Cluster analysis of population survey data by Kylie Sutcliffe, Marc Wilson, Terryann C Clark, Sue Crengle and Terry (Theresa) Fleming in Australian & New Zealand Journal of Psychiatry
Supplemental Material
sj-png-2-anp-10.1177_00048674241243262 – Supplemental material for Distinct profiles of mental health need and high need overall among New Zealand adolescents – Cluster analysis of population survey data
Supplemental material, sj-png-2-anp-10.1177_00048674241243262 for Distinct profiles of mental health need and high need overall among New Zealand adolescents – Cluster analysis of population survey data by Kylie Sutcliffe, Marc Wilson, Terryann C Clark, Sue Crengle and Terry (Theresa) Fleming in Australian & New Zealand Journal of Psychiatry
Supplemental Material
sj-png-3-anp-10.1177_00048674241243262 – Supplemental material for Distinct profiles of mental health need and high need overall among New Zealand adolescents – Cluster analysis of population survey data
Supplemental material, sj-png-3-anp-10.1177_00048674241243262 for Distinct profiles of mental health need and high need overall among New Zealand adolescents – Cluster analysis of population survey data by Kylie Sutcliffe, Marc Wilson, Terryann C Clark, Sue Crengle and Terry (Theresa) Fleming in Australian & New Zealand Journal of Psychiatry
Supplemental Material
sj-png-4-anp-10.1177_00048674241243262 – Supplemental material for Distinct profiles of mental health need and high need overall among New Zealand adolescents – Cluster analysis of population survey data
Supplemental material, sj-png-4-anp-10.1177_00048674241243262 for Distinct profiles of mental health need and high need overall among New Zealand adolescents – Cluster analysis of population survey data by Kylie Sutcliffe, Marc Wilson, Terryann C Clark, Sue Crengle and Terry (Theresa) Fleming in Australian & New Zealand Journal of Psychiatry
Supplemental Material
sj-png-5-anp-10.1177_00048674241243262 – Supplemental material for Distinct profiles of mental health need and high need overall among New Zealand adolescents – Cluster analysis of population survey data
Supplemental material, sj-png-5-anp-10.1177_00048674241243262 for Distinct profiles of mental health need and high need overall among New Zealand adolescents – Cluster analysis of population survey data by Kylie Sutcliffe, Marc Wilson, Terryann C Clark, Sue Crengle and Terry (Theresa) Fleming in Australian & New Zealand Journal of Psychiatry
Supplemental Material
sj-png-6-anp-10.1177_00048674241243262 – Supplemental material for Distinct profiles of mental health need and high need overall among New Zealand adolescents – Cluster analysis of population survey data
Supplemental material, sj-png-6-anp-10.1177_00048674241243262 for Distinct profiles of mental health need and high need overall among New Zealand adolescents – Cluster analysis of population survey data by Kylie Sutcliffe, Marc Wilson, Terryann C Clark, Sue Crengle and Terry (Theresa) Fleming in Australian & New Zealand Journal of Psychiatry
Supplemental Material
sj-png-7-anp-10.1177_00048674241243262 – Supplemental material for Distinct profiles of mental health need and high need overall among New Zealand adolescents – Cluster analysis of population survey data
Supplemental material, sj-png-7-anp-10.1177_00048674241243262 for Distinct profiles of mental health need and high need overall among New Zealand adolescents – Cluster analysis of population survey data by Kylie Sutcliffe, Marc Wilson, Terryann C Clark, Sue Crengle and Terry (Theresa) Fleming in Australian & New Zealand Journal of Psychiatry
Supplemental Material
sj-png-8-anp-10.1177_00048674241243262 – Supplemental material for Distinct profiles of mental health need and high need overall among New Zealand adolescents – Cluster analysis of population survey data
Supplemental material, sj-png-8-anp-10.1177_00048674241243262 for Distinct profiles of mental health need and high need overall among New Zealand adolescents – Cluster analysis of population survey data by Kylie Sutcliffe, Marc Wilson, Terryann C Clark, Sue Crengle and Terry (Theresa) Fleming in Australian & New Zealand Journal of Psychiatry
Supplemental Material
sj-png-9-anp-10.1177_00048674241243262 – Supplemental material for Distinct profiles of mental health need and high need overall among New Zealand adolescents – Cluster analysis of population survey data
Supplemental material, sj-png-9-anp-10.1177_00048674241243262 for Distinct profiles of mental health need and high need overall among New Zealand adolescents – Cluster analysis of population survey data by Kylie Sutcliffe, Marc Wilson, Terryann C Clark, Sue Crengle and Terry (Theresa) Fleming in Australian & New Zealand Journal of Psychiatry
Footnotes
Acknowledgements
First and foremost, thank you to participating students, their families and whānau and participating schools and staff. Thank you to study manager Dan Archer and the Youth19 team. The authors are grateful to Dr Jude Ball for thoughtful review of an early draft and to Dr Kealagh Robinson for insightful comments on a later version.
Declaration of Conflicting Interests
The author(s) declared no potential conflicts of interest with respect to the research, authorship and/or publication of this article.
Funding
The author(s) disclosed receipt of the following financial support for the research, authorship and/or publication of this article: The Youth19 Rangatahi Smart Survey was funded by Health Research Council of New Zealand Project Grants 17/315 and 18/473. The lead author was funded by a Victoria Doctoral Scholarship, Te Herenga Waka – Victoria University of Wellington.
Supplemental Material
Supplemental material for this article is available online.
References
Supplementary Material
Please find the following supplemental material available below.
For Open Access articles published under a Creative Commons License, all supplemental material carries the same license as the article it is associated with.
For non-Open Access articles published, all supplemental material carries a non-exclusive license, and permission requests for re-use of supplemental material or any part of supplemental material shall be sent directly to the copyright owner as specified in the copyright notice associated with the article.