
Abstract
Objectives:
Several recent studies have reported a strong association between the cerebellar structural and functional abnormalities and psychiatric disorders. However, there are no studies to investigate possible changes in cerebellar functional connectivity in bipolar disorder. This study aimed to examine the whole-brain functional connectivity pattern of patients with remitted bipolar disorder II, in particular in the cerebellum.
Methods:
A total of 25 patients with remitted bipolar disorder II and 25 controls underwent resting-state functional magnetic resonance imaging and neuropsychological tests. Voxel-wise whole-brain connectivity was analyzed using a graph theory approach: functional connectivity strength. A seed-based resting-state functional connectivity analysis was further performed to investigate abnormal functional connectivity pattern of those regions with changed functional connectivity strength.
Results:
Remitted bipolar disorder II patients had significantly decreased functional connectivity strength in the bilateral posterior lobes of cerebellum (mainly lobules VIIb/VIIIa). The seed-based functional connectivity analyses revealed decreased functional connectivity between the right posterior cerebellum and the default mode network (i.e. right posterior cingulate cortex/precuneus and right superior temporal gyrus), bilateral hippocampus, right putamen, left paracentral lobule and bilateral posterior cerebellum and decreased functional connectivity between the left posterior cerebellum and the right inferior parietal lobule and bilateral posterior cerebellum in patients with remitted bipolar disorder II.
Conclusion:
Our results suggest that cerebellar dysconnectivity, in particular distributed cerebellar–cerebral functional connectivity, might be associated with the pathogenesis of bipolar disorder.
Keywords
Introduction
The World Health Organization (WHO) Global Burden of Disease study currently ranks mood disorders, including bipolar disorder (BD), among the leading cause of disease burden in the world. BD is a severe, chronic and recurrent mood disorder characterized by the fluctuation of mood between the two poles of depression and mania (bipolar I) or hypomania (bipolar II), passing through a period of affective remission, known as euthymia (Grande et al., 2016). Although a growing number of neuroimaging studies revealed structural and functional abnormalities in BD, the etiology and the pathogenesis underlying this disorder remain poorly understood.
Neuroimaging studies demonstrated that BD is associated with locally functional and structural deficits in the brain, such as the medial prefrontal cortex, anterior cingulate cortex, superior temporal gyrus, cerebellum and so on (Hozer and Houenou, 2016; Phillips et al., 2015; Vargas et al., 2013). However, several recent studies suggested that BD is a disconnection syndrome, associated with alterations of connectivity between distributed brain areas rather than local deficits in specific brain regions. Studies using diffusion tensor imaging (DTI) techniques reported widespread anatomical disconnectivity in BD patients, in particular white matter disruption within the frontolimbic network (Bellani et al., 2016). Several resting-state functional magnetic resonance imaging (rs-fMRI) studies observed altered functional connectivity in BD, including the default mode network (DMN), thalami-striatum connectivity, anterior cingulate-amygdalae connectivity and prefrontal-limbic connectivity, using independent component analysis (ICA) and seed-based correlation analysis (Vargas et al., 2013). However, most previous studies included acutely depressive and manic BD patients and did not provide further insight into their persistent abnormalities. A recent review of longitudinal neuroimaging study reported that there was a strong relationship between brain-volume outcomes and the current mood state (Dohm et al., 2017). In addition, recent rs-fMRI studies indicated abnormal cerebro-cerebellar functional connectivity in psychiatric disorders, including autism spectrum disorder (Khan et al., 2015), schizophrenia (Guo et al., 2015b) and major depressive disorder (MDD; Guo et al., 2013).
Whole-brain functional connectivity strength (FCS) mapping, a data-driven graph theory approach, measures the number of functional connections between a given voxel and others voxels (Buckner et al., 2009). It can reflect the complexity of the connectome as a whole, better than other functional connectivity study approaches, such as seed-based approaches or ICA. Furthermore, such a voxel-wise approach avoids parcellation-dependent effects on the topological organization of brain networks (Smith et al., 2011). Several studies have demonstrated that the FCS metric is closely associated with physiological measures such as regional cerebral blood flow, aerobic glycolysis and oxidative glucose metabolism (Wang et al., 2016). FCS alterations and correlation with pathophysiologic mechanisms have also been demonstrated in MDD (Guo et al., 2015a), bipolar depression (Wang et al., 2016) and schizophrenia (Wang et al., 2014).
Notably, there are two established subtypes of BD: type I and type II. The subtype BD II is distinguished from BD I mainly by the absence of full-blown manic episodes. Most neuroimaging studies have involved bipolar I samples, but comparatively few studies have focused on bipolar II disorder. However, a recent growing body of evidence suggests that there are neurobiological differences between BD I and BD II (Abe et al., 2016).
In this study, we constructed voxel-wise whole-brain functional networks in patients with remitted bipolar II disorder and well-matched healthy control subjects using rs-fMRI data and performed FCS analyses. Based on previous findings from functional magnetic resonance imaging (fMRI), we hypothesized that there would be altered cerebellar–cerebral circuits involved in cognition and emotion in BD and that these changes may be associated with clinical or behavioral variables.
Method
Participants
In total, 30 right-handed, out-patients with remitted BD II were recruited from the psychiatry department of First Affiliated Hospital of Jinan University, Guangzhou, China. The patients were aged from 18 to 48 years. All patients had previously met Diagnostic and Statistical Manual of Mental Disorders (4th ed.; DSM-IV) criteria for BD type II according to the diagnostic assessment by the Structured Clinical Interview for DSM-IV Patient Edition (SCID-P). At the time of the measurements, all patients were in disease remission. Remitted state was defined by Young Mania Rating Scale (YMRS) scores less than 6 and Hamilton Rating Scale for Depression-24 (HAMD-24) scores less than 8, and the manic or depressive symptoms disappeared for at least or more than 6 months. These quite strict requirements were used in order to avoid the potentially confounding effects of subthreshold depressive and manic symptoms on cognitive function. Exclusion criteria included the presence of (1) any current psychiatric disorder (with the exception of BD and anxiety disorders); (2) a history of electroconvulsive therapy; (3) any history of moderate/severe head injury, head trauma, neurological disorder or mental retardation; (4) alcohol/substance abuse or dependence; (5) the presence of a concurrent significant physical illness; and (6) pregnancy or any contraindication to magnetic resonance imaging (MRI) scanning. Most patients (n = 20) were on treatment with mood stabilizers (lithium, sodium valproate) and/or antidepressants (selective serotonin reuptake inhibitors or serotonin and norepinephrine reuptake inhibitors) and/or antipsychotics (second generation).
A total of 28 right-handed age- and gender-matched healthy control subjects were recruited via local advertisements. They were carefully screened through a diagnostic interview, the Structured Clinical Interview for DSM-IV Nonpatient Edition (SCID-NP), to rule out the presence of current or past psychiatric illness. Further exclusion criteria for healthy controls were any history of psychiatric illness in first-degree relatives, current or past significant medical or neurological illness.
The study was approved by the Ethics Committee of First Affiliated Hospital of Jinan University, China. All subjects signed a written informed consent form after a full written and verbal explanation of the study. Two senior clinical psychiatrists confirmed that all subjects had the ability to consent to participate in the examination.
Neuropsychological assessment
All participants underwent comprehensive neuropsychological assessments (Lin et al., 2015), including: (1) attention by the Digit Span Forward of the Wechsler Adult Intelligence Scale–Revised by China (WAIS-RC; Gong, 1982), (2) processing speed by the trail making test–part A (TMT-A; Lezak et al., 2004) and the Digit Symbol Coding subtest of the WAIS-RC (Gong, 1982), (3) set shifting by the Modified Wisconsin Card Sorting Test (WCST-M; Nelson, 1976) and the trail making test–part B (TMT-B; Lu and Bigler, 2000), (4) verbal working memory by the Digit Span Backward subtest of the WAIS-RC (Gong, 1982), (5) verbal fluency by the animal naming test (Chen et al., 2000) and (6) visual spatial memory by the Immediate Visual Reproduction subtest of the Wechsler Memory Scale–Revised by China (WMS-RC; Gong, 1987). The neuropsychological assessment was administered within 3 days of imaging.
Imaging acquisition
MRI data were acquired on a 3-T magnetic resonance (MR) system (Discovery MR 750 System; GE Healthcare, Milwaukee, WI) with an eight-channel phased-array head coil. Whole-brain resting-state functional images were acquired using gradient-echo echo-planar imaging sequence with the following parameters: repetition time (TR) = 2000 milliseconds, echo time (TE) = 25 milliseconds, flip angle = 90°, 35 axial sections per volume, thickness/gap = 3.0/1.0 mm, interleaved slice, data matrix = 64 × 64, field of view = 240 × 240 mm2 and voxel size = 3.75 × 3.75 × 3 mm3. For each participant, 210 volumes were acquired, which resulted in an imaging time of 420 seconds. The anatomic images were then acquired using a three-dimensional brain-volume imaging sequence that covered the whole brain that was used for structural data acquisition (TR = 8.2 milliseconds, TE = 3.2 milliseconds, flip angle = 12°, data matrix = 256 × 256, field of view = 240 × 240 mm2, section thickness = 1 mm, no intersection gap). The participants were instructed to relax with their eyes closed without falling asleep and to move as little as possible. In addition, two routine scans using axial T1-weighted fluid attenuation inversion recovery and fast spine echo T2-weighted MR sequences were also applied to obtain brain images to confirm the absence of any brain structural abnormalities.
Image preprocessing
Image preprocessing was performed using Statistical Parametric Mapping (SPM8; www.fil.ion.ucl.ac.uk/spm) and Data Processing Assistant for Resting-State fMRI (DPARSF; Chao-Gan and Yu-Feng, 2010). For each participant, the first 10 volumes of the rs-fMRI dataset were discarded to allow for MR signal equilibrium, leaving 200 volumes for further analyses. The remaining volumes were corrected for the intra-volume acquisition time delay using slice timing and were realigned to the first volume using the six-parameter (rigid body) spatial transformation. All participants had no more than 1.5 mm of maximum displacement in x-, y- or z-axis and 1.5° of angular motion. The individual T1-weighted images were coregistered to functional images. The coregistered T1-weighted structural images were segmented (gray matter, white matter and cerebrospinal fluid) using the unified segmentation algorithm, and they were then transformed into standard Montreal Neurologic Institute space. The functional images were also spatially normalized to Montreal Neurologic Institute space by applying the parameters of structural image normalization and were resampled to 3 × 3 × 3 mm3 resolution. Furthermore, linear trend removal and temporal band-pass filtering (0.01–0.08 Hz) was performed. During nuisance signal regression, several regressors, including six head motion parameters, global mean signal, cerebrospinal fluid signal and white matter signal, were regressed out from the data.
Whole-brain functional connectivity analysis
Whole-brain resting-state functional connectivity analysis was performed using the Gretna (www.nitrc.org/projects/gretna/) packages (Fang et al., 2015). First, we computed Pearson correlation coefficient between the time series of all pairs of gray matter voxels and obtained a whole-brain functional connectivity matrix (55,857 × 55,857) for each individual. This computation was constrained within a gray matter mask that was generated by setting a threshold of 0.2 on the mean map of all gray matter maps involving all participants. Individual correlation matrices were transformed into a z score matrix using a Fisher r-to-z transformation to improve normality for group-level t-tests. Then, for a given voxel, FCS was computed as the sum of the connections (z values) between a given voxel and all other voxels. By considering the ambiguous interpretation of negative correlations with removal of the global signal, we conservatively restricted our analysis to positive correlations above a threshold of r = 0.25 (Buckner et al., 2009; Wang et al., 2015a). Such a threshold was chosen to eliminate the voxels with weak correlations that possibly arise from signal noise. To evaluate the effects of different correlation thresholds, we also analyzed FCS with different thresholds of r values of 0.2, 0.3 and 0.4, respectively (these results did not change our main conclusion; data not shown). Moreover, Buckner et al. (2009) indicated that different threshold selections did not qualitatively change their results for cortex. Notably, an FCS metric is similar to the so-called weighted degree centrality of networks in terms of graph theory (Buckner et al., 2009; Wang et al., 2015a). Finally, all individual FCS maps were further spatially smoothed with a 4-mm Gaussian kernel.
Seed-based functional connectivity analysis
To examine more detailed resting-state functional connectivity alterations, we performed a seed-based interregional correlation analysis using the DPARSF software package. The regions with abnormal FCS values in patients with BD were selected as regions of interest (ROIs). The mean time series of each spherical ROI with the centroid at its corresponding peak voxel (radius = 6 mm) was extracted, and functional connectivity analysis was performed using the data resulting from preprocessing. A correlation analysis was then performed voxel-wise between each seed ROI and the remaining voxels in the whole brain. The correlation coefficients were z-transformed using Fisher r-to-z transformation to improve Gaussianity of the distribution.
Statistical analysis
Independent-sample t-tests and χ2 tests were used to compare the demographic variables between the BD and healthy control groups with software (SPSS 17.0; SPSS, Chicago, IL). The neuropsychological tests difference between the two groups was examined using analysis of variance (ANOVA) with age and educational level as covariates.
For comparisons of FCS maps, the one-sample t-test was performed to demonstrate the spatial distribution of FCS maps in BD and healthy controls. The two-sample t-test was performed to determine the significant differences in FCS maps between patients with BD and control participants. The statistical threshold was set at corrected p-value of less than 0.05 (combination of p < 0.005 for single voxel and a minimum cluster volume of >1080 mm3), which was determined by Monte Carlo simulations using the AlphaSim program. Age, sex and head motion parameters were included as nuisance covariates. Comparisons of the seed-based functional connectivity maps were as described above for the FCS maps. When statistically significant group differences were observed in any brain regions, we computed the partial correlation between neuroimaging results (FCS values and seed-based functional connectivity) and the neuropsychological measures, controlling for age, gender, years of education and duration of illness as confounding variables. In addition, we also computed the partial correlation between neuroimaging results and the clinical variables, controlling for age, gender and years of education as confounding variables. The clinical variables included the HAMD score, YMRS score, Hamilton Anxiety Scale (HAMA) score, number of episodes, onset age of illness and total duration of illness. The threshold for significance was adjusted for multiple comparisons using Bonferroni correction.
Results
Demographic information and neuropsychological performance
The demographic and neuropsychological data for all participants in this study are shown in Table 1. Five patients with BD and three control participants were excluded from further analyses because of excessive head motion or partial cerebellum coverage of their MRI scans. Finally, the participants were 25 patients with remitted BD II and 25 healthy control participants. There were no significant differences in gender distribution, age and educational level between the remitted BD II group and healthy control group (p > 0.05).
Demographic and neuropsychological data of the subjects.
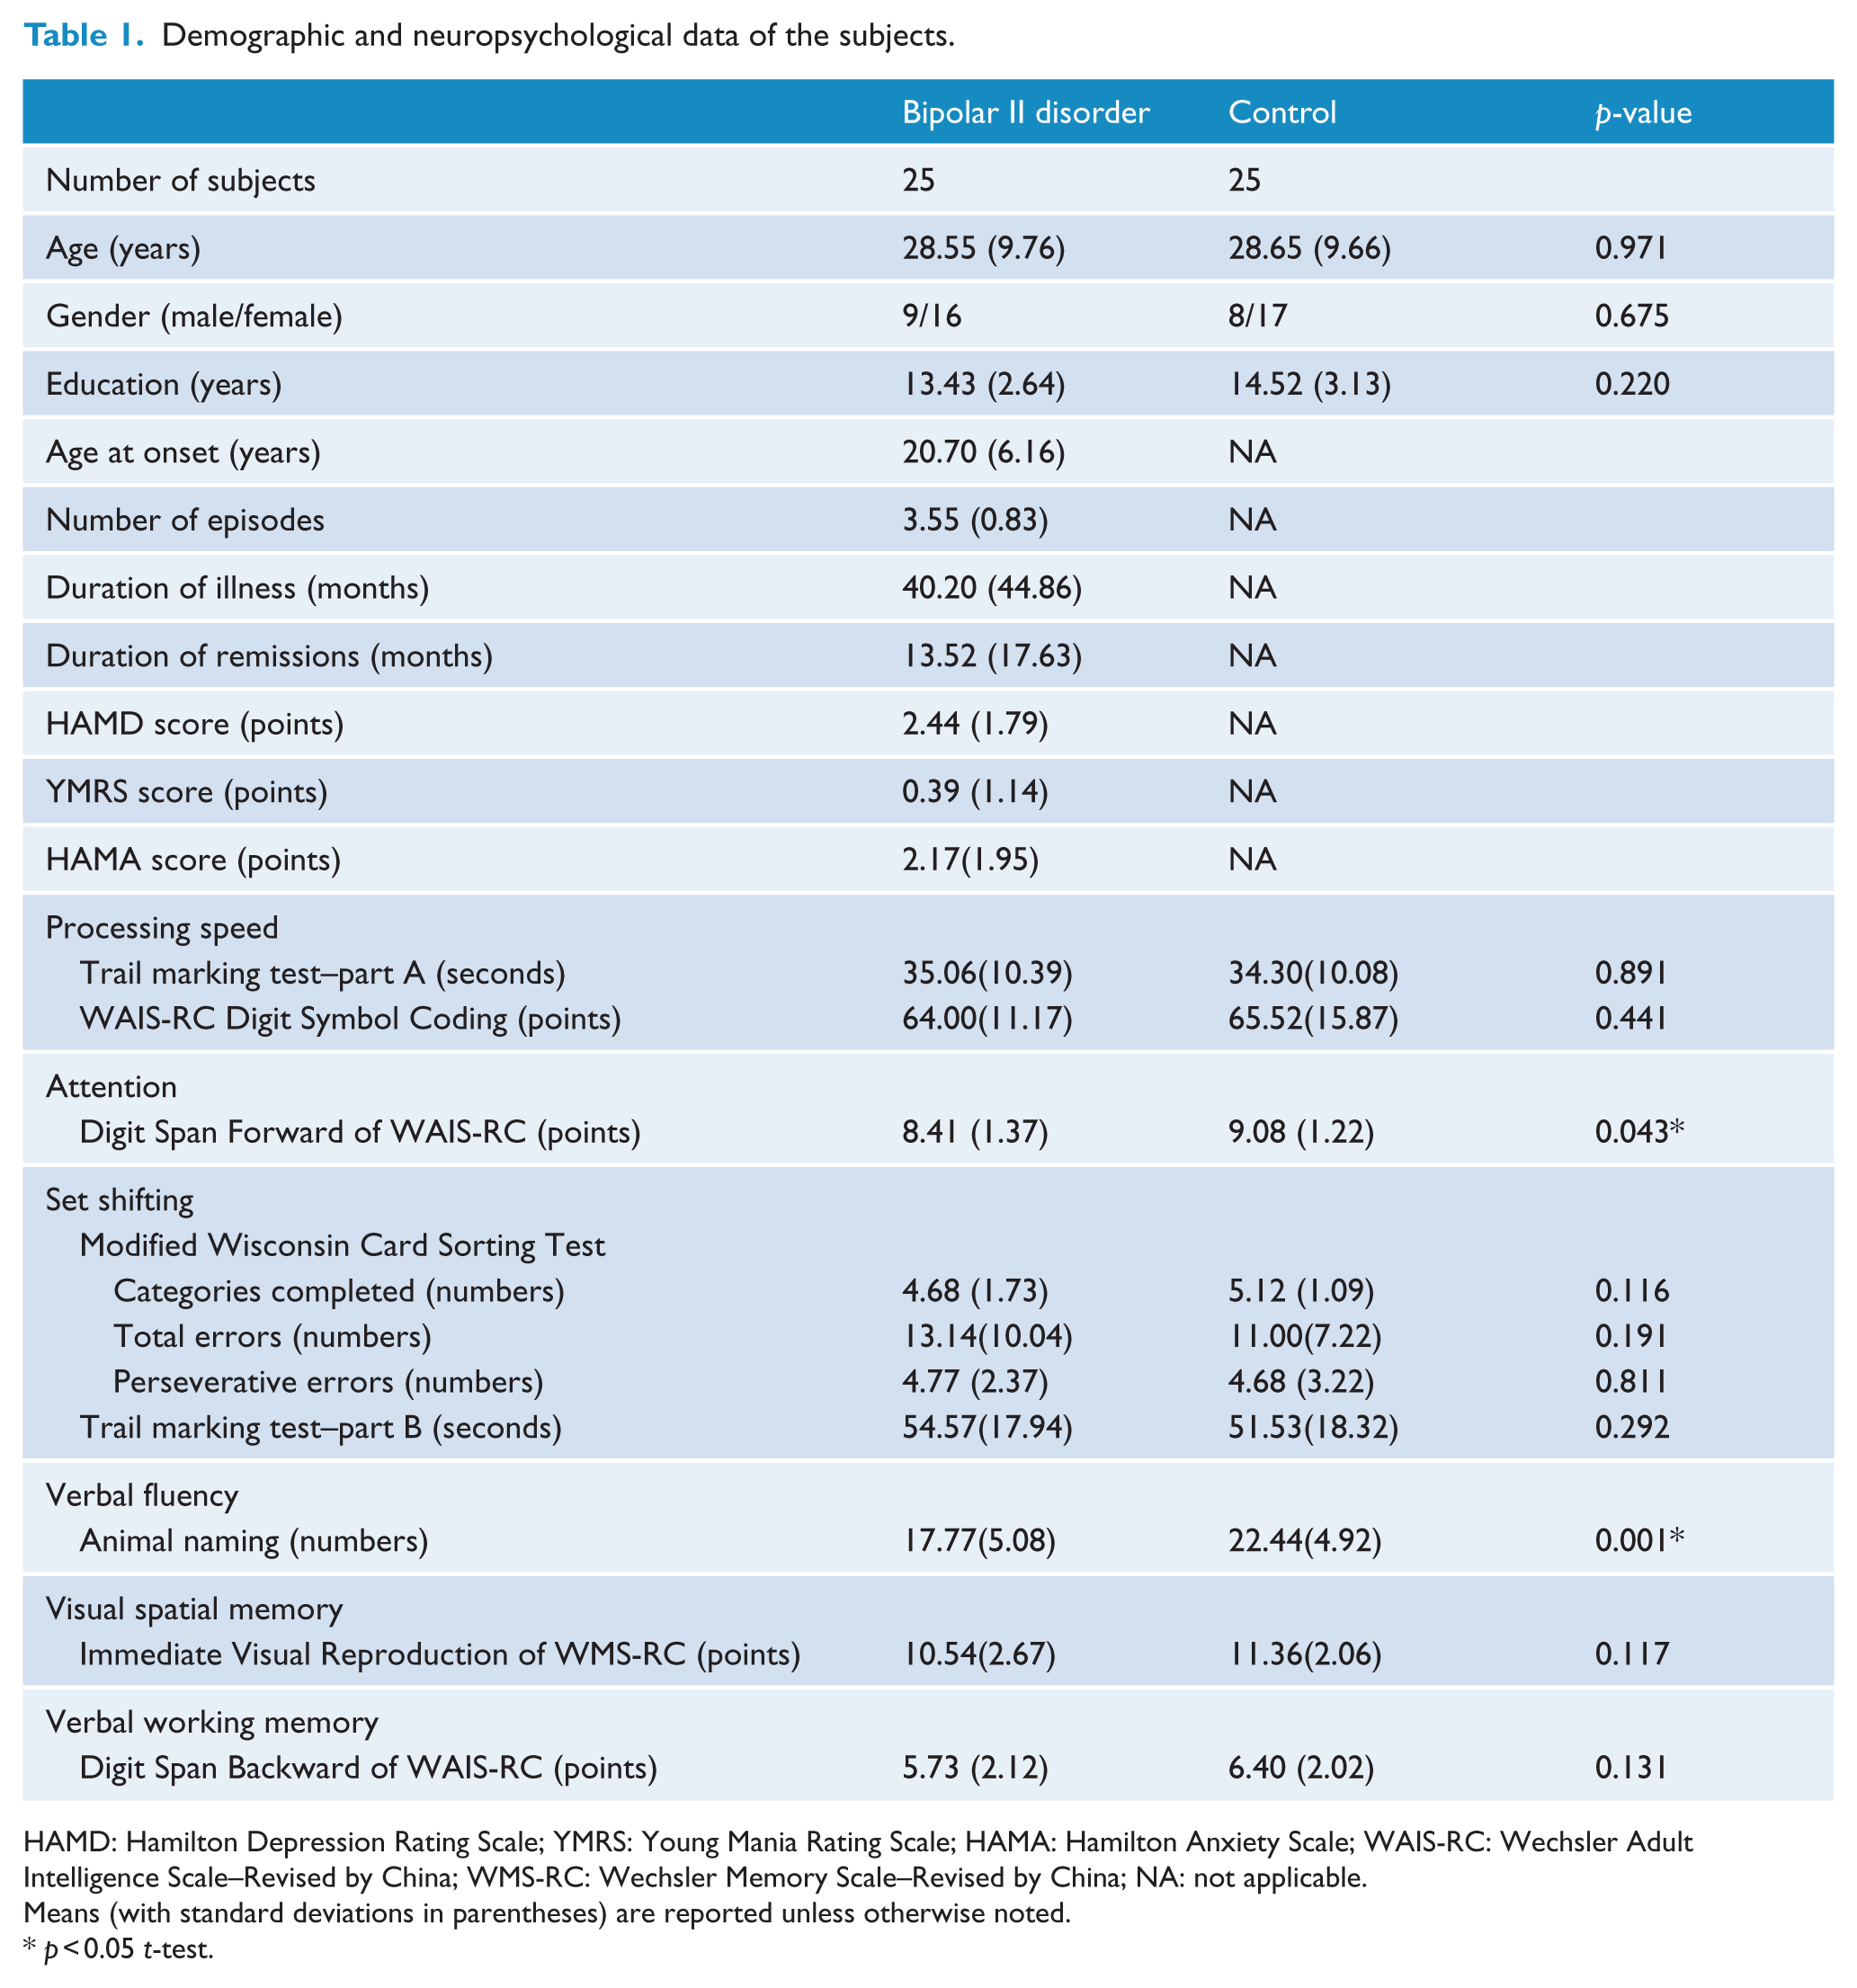
HAMD: Hamilton Depression Rating Scale; YMRS: Young Mania Rating Scale; HAMA: Hamilton Anxiety Scale; WAIS-RC: Wechsler Adult Intelligence Scale–Revised by China; WMS-RC: Wechsler Memory Scale–Revised by China; NA: not applicable.
Means (with standard deviations in parentheses) are reported unless otherwise noted.
p < 0.05 t-test.
The remitted BD II group performed significantly worse than the healthy control group in attention (p = 0.043) and verbal fluency (p = 0.001). There was no significant difference in processing speed, set shifting, verbal working memory and visual spatial memory between the remitted BD II group and healthy control group (p > 0.05).
Whole-brain functional connectivity analysis
The FCS maps of healthy control and remitted BD II groups are presented in Figure 1. For the healthy control group, regions with high FCS values were mainly located in the DMN (including posterior cingulate cortex/precuneus, medial prefrontal and parietal cortices and lateral temporal and parietal cortical regions), lateral prefrontal, temporal–parietal junction and occipital cortices and cerebellum. Visual examination indicated that the spatial distributions of brain regions with high FCS in the remitted BD II group were similar to those of the healthy control group. However, statistical analysis revealed that compared with the healthy control group, the remitted BD II group showed significantly decreased FCS values in the bilateral posterior lobes of cerebellum (mainly lobules VIIb/VIIIa; Figure 1 and Table 2). No region showed increased FCS values in the remitted BD II patient group (p < 0.05; AlphaSim corrected).
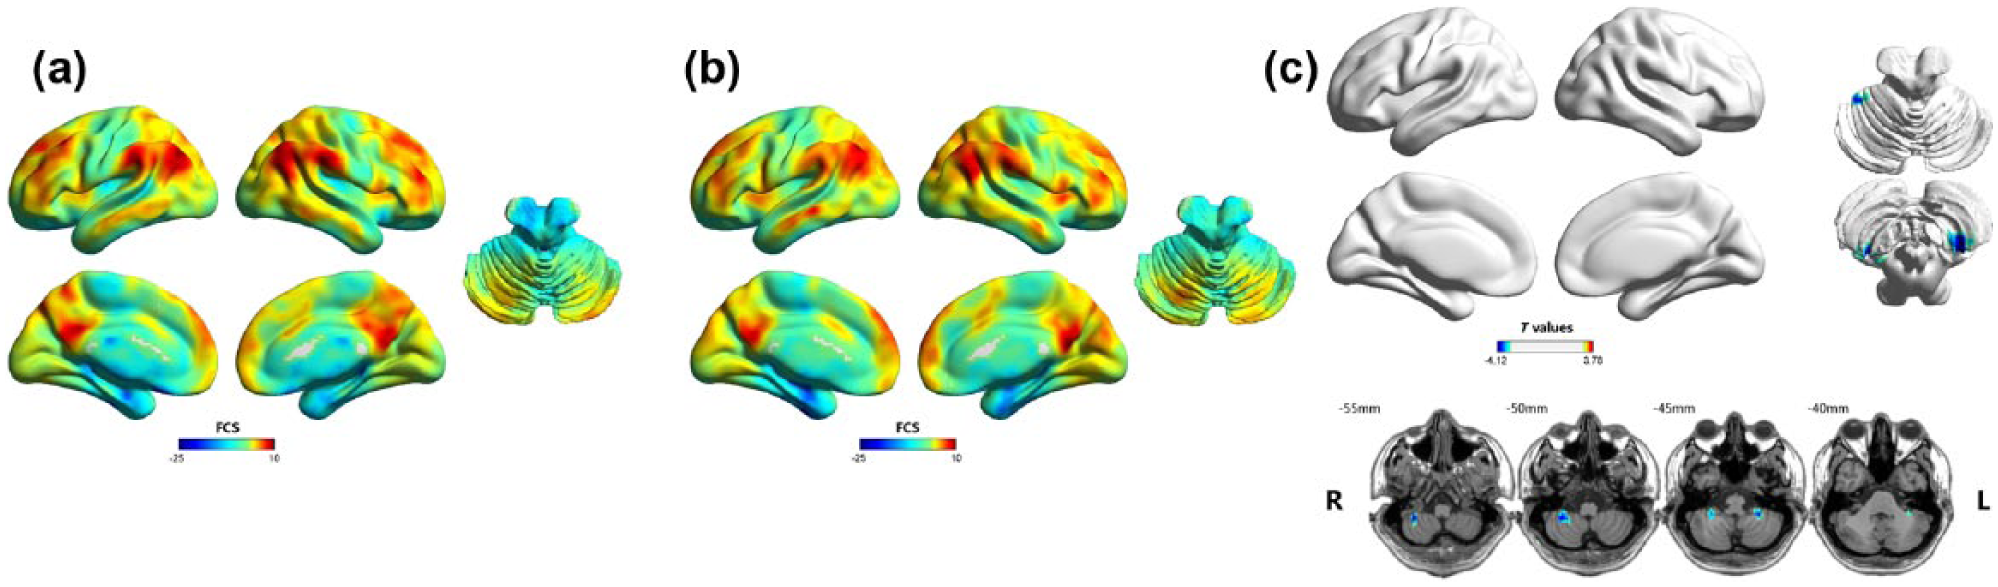
Results of the within/between-group analysis on functional connectivity strength (FCS): (a) mean FCS maps within the healthy control group, (b) mean FCS maps within the remitted BD II group and (c) between-group differences in the FCS. Shades of blue represent decreased FCS in the remitted BD group compared with healthy control group. Results are shown after correction for multiple comparisons using the AlphaSim correction at p-value of less than 0.05.
Regions showing FCS and seed-based functional connectivity differences between two groups.
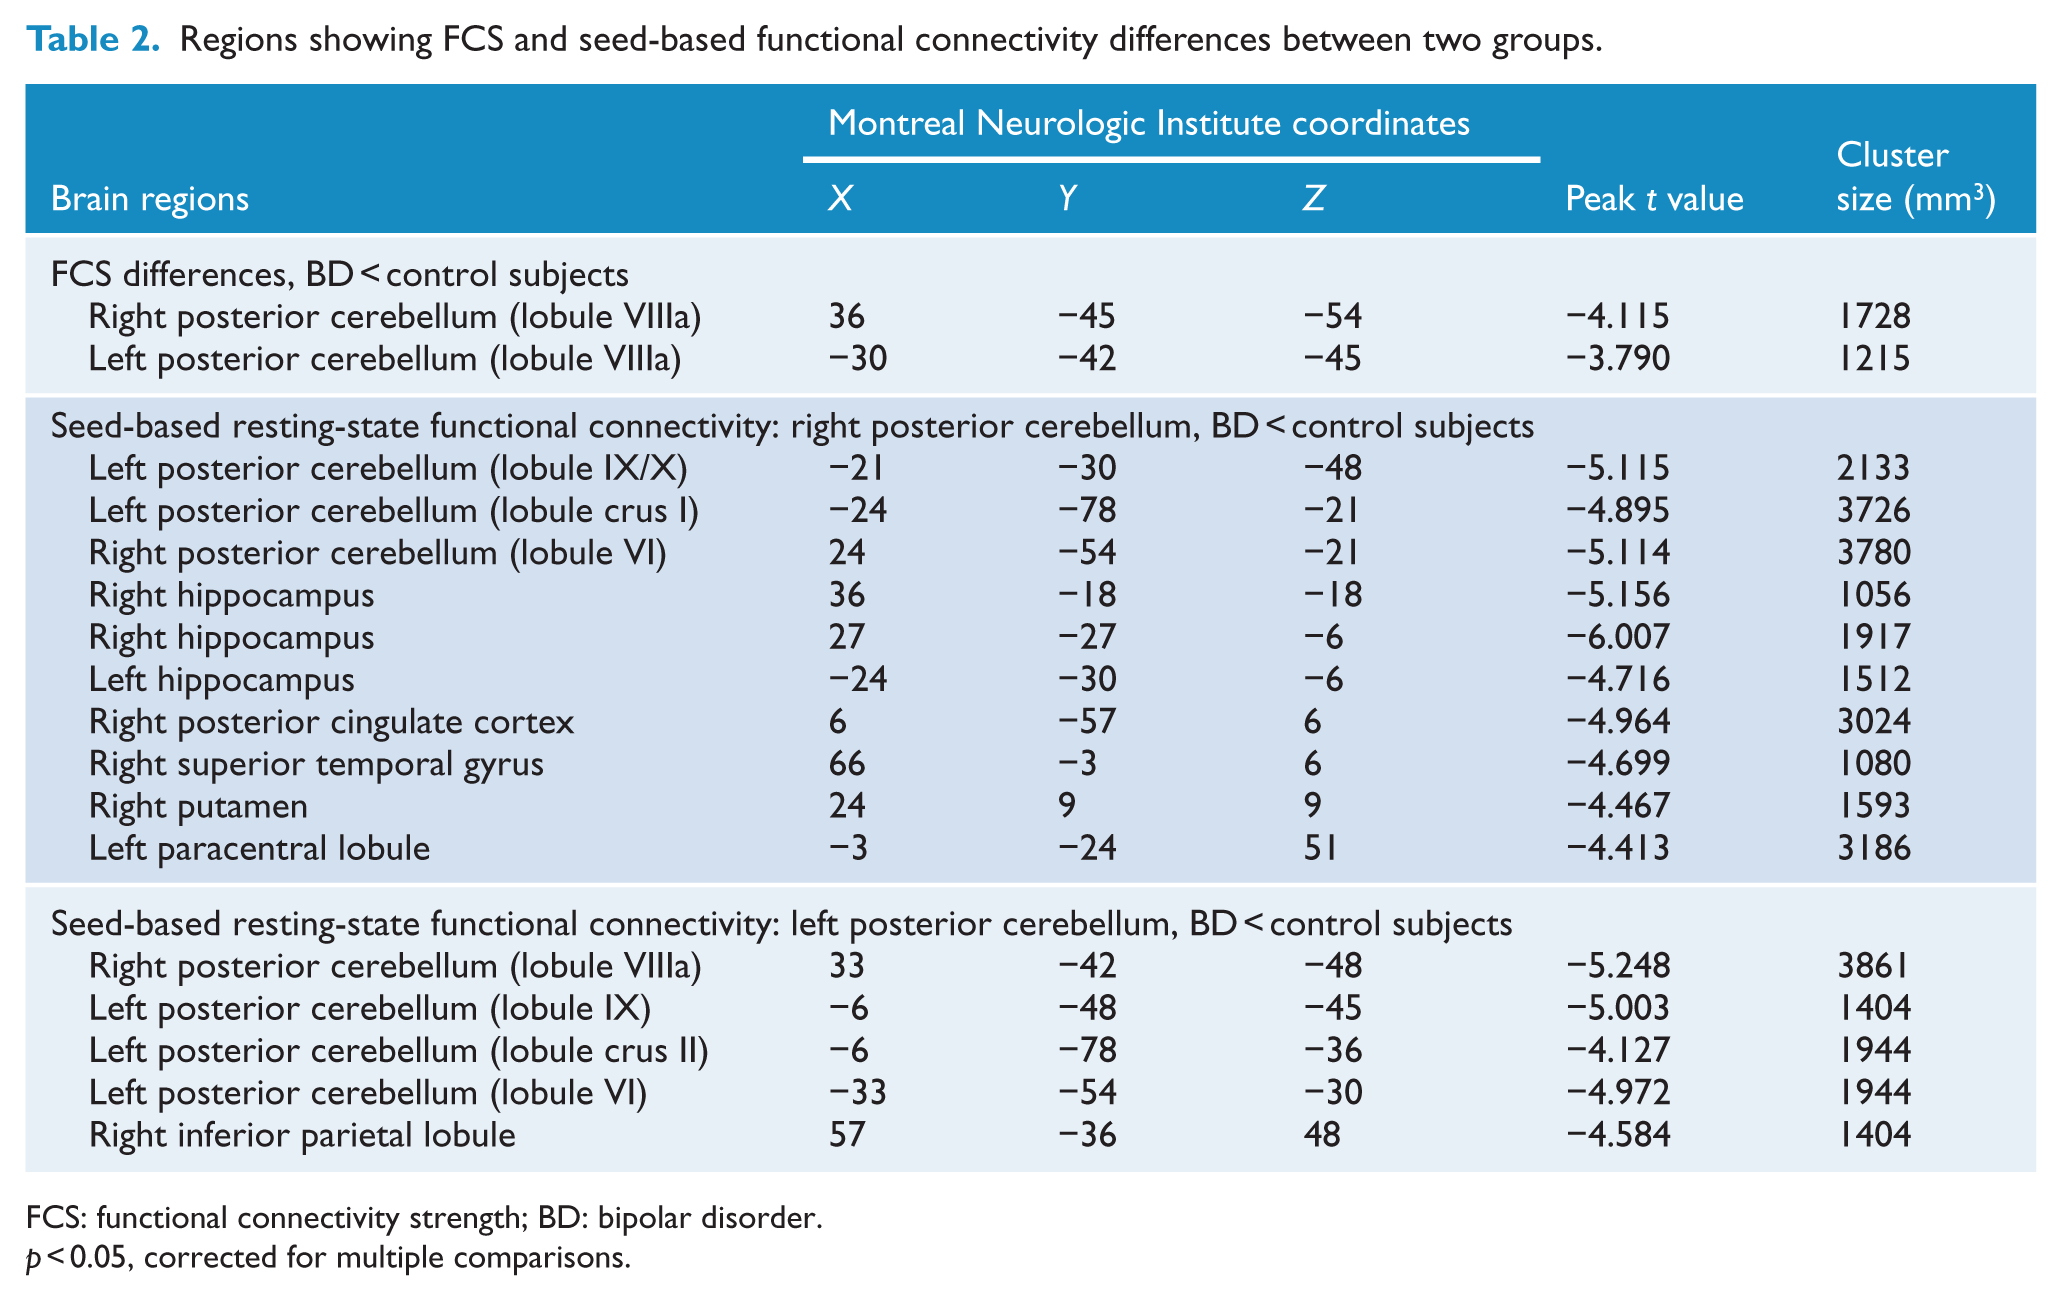
FCS: functional connectivity strength; BD: bipolar disorder.
p < 0.05, corrected for multiple comparisons.
Seed ROI-based functional connectivity analysis
To examine more detailed functional connectivity alterations, we performed a seed ROI-based functional connectivity analysis. We selected the right and left posterior lobes of cerebellum as seed ROIs because of the significantly decreased FCS values in patients with remitted BD II. Compared with the healthy control group, the remitted BD II group showed significantly decreased functional connectivity between seed 1 (the right posterior cerebellum) and the bilateral posterior cerebellum (mainly lobules IX/X, VI and crus I), bilateral hippocampus, right posterior cingulate cortex/precuneus, right superior temporal gyrus, right putamen and left paracentral lobule. Also, the decreased functional connectivity was found between seed 2 (the left posterior cerebellum) and the bilateral posterior cerebellum (mainly lobules VIIIa, IX, VI and crus II) and right inferior parietal lobule (Figure 2 and Table 2). No region showed increased functional connectivity in the remitted BD II group (p < 0.05; AlphaSim corrected).
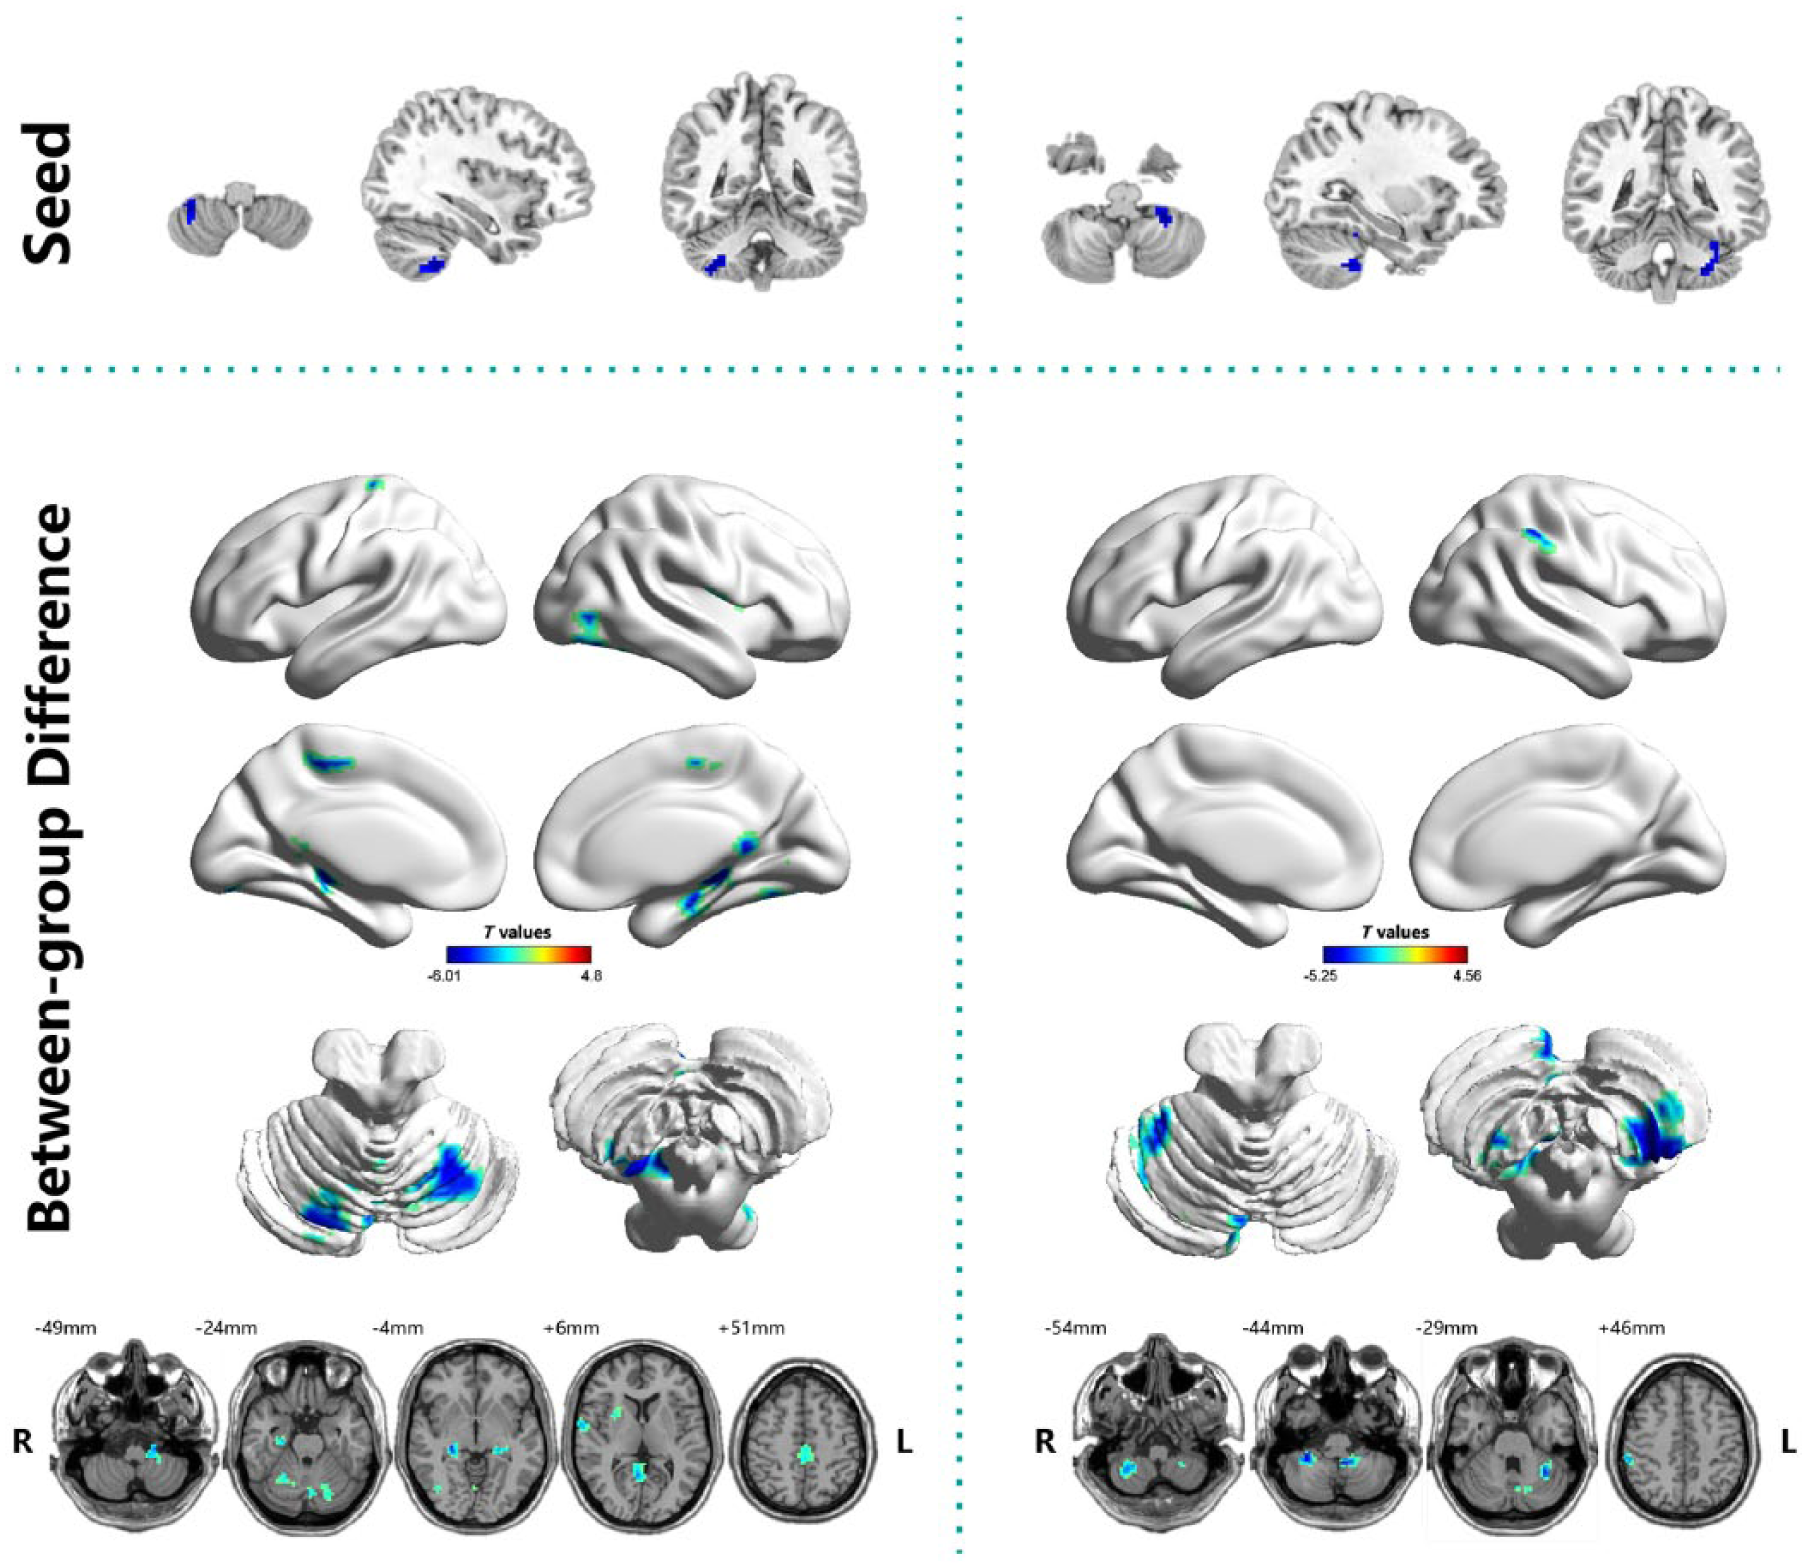
Between-group differences in seed-based functional connectivity. The seeds (top row) were defined as the right and left posterior cerebellum. Shades of blue represent decreased functional connectivity in the remitted BD II group compared with healthy control group. Results are shown after correction for multiple comparisons using the AlphaSim correction at p-value of less than 0.05.
Correlational analysis
Bonferroni correction was used for the multiple comparisons when partial correlation analysis was performed. There were no significant correlations between altered neuroimaging results (FCS values and seed-based functional connectivity) and any neuropsychological measures or clinical variables in patients with remitted BD II.
Discussion
In a substantial sample of clinically homogeneous patient with BD II during remission, we examined the topological properties of voxel-wise whole-brain functional networks by estimating FCS, thus bypassing a priori selection of circuits of interest. The patients with remitted BD II showed decreased FCS in the bilateral posterior lobe of cerebellum during the resting state. Furthermore, the BD patients showed decreased functional connectivity between the cerebellum and the cerebral cortex, mainly including the DMN, hippocampus, basal ganglia and sensorimotor regions. This was the first study, to our knowledge, to explore resting-state cerebellar–cerebral functional connectivity in patients with BD. These findings suggest that cerebellar dysconnectivity might underlie the pathogenesis of BD.
Many recent studies have reported a strong association between the cerebellar structural and functional abnormalities and psychiatric disorders (Phillips et al., 2015; Shakiba, 2014). In this study, remitted BD patients showed decreased FCS values in the bilateral posterior lobes of cerebellum. Our group previously reported altered FCS in the cerebellum in depressive BD type II patients compared with controls (Wang et al., 2016). Taken together, these findings suggest that disturbed functional connectivity of the cerebellum may be trait dependent rather than associated with mood state in BD. A growing body of evidence indicates that in addition to its classical motor coordination function, the cerebellum is also involved in psychological alterations and in the modulation of affective cognitive and perceptual functions (Phillips et al., 2015; Schmahmann, 2004). The posterior lobules VI, VII, VIII and crus were found to be linked to cognition, the posterior vermis to be associated with emotion and lobules I–V related to sensorimotor function (Stoodley and Schmahmann, 2010). The cerebellum abnormalities have been reported in BD patients, including reduced cerebellar gray matter volume (Redlich et al., 2014), decreased activity (Phillips et al., 2015; Wang et al., 2015b) and increased glucose metabolism (Altamura et al., 2013). For example, a structural MRI study found the reduction of cerebellar volume in BD was present from the beginning and remained stable during the course of the illness (Sani et al., 2016). In addition, a molecular study found altered expression of gamma-aminobutyric acid (GABA) receptors in the cerebellum in BD (Fatemi et al., 2013). GABA is the main inhibitory neurotransmitter in the brain and regulates multiple processes during the brain development. Therefore, our findings provide additional evidence for the involvement of cerebellar dysfunction in the pathophysiologic structure of BD.
In this study, we found reduced functional connectivity between the cerebellar seeds and the cerebral regions of the DMN in remitted BD, including the posterior cingulate cortex/precuneus, superior temporal gyrus and inferior parietal lobule. The DMN has been suggested to play an important role in the sustenance of self-referential processing, conscious awareness, mind wandering, episodic memory retrieval and emotion modulation (Greicius and Menon, 2004). Connectivity within the DMN was compromised in a variety of psychiatric disorders, including schizophrenia (Guo et al., 2015b; Meda et al., 2014), MDD (Guo et al., 2013) and BD (Vargas et al., 2013; Wang et al., 2016). For example, Meda et al. (2014) found reduced resting-state DMN connectivity in both BD and schizophrenia, and genes regulating specific neurodevelopment/transmission processes primarily mediated DMN disconnectivity. A seed-based functional connectivity study found decreased cerebellar functional connectivity with the DMN in MDD, including the superior, middle and inferior temporal gyrus, precuneus and inferior parietal lobule (Guo et al., 2013), which partially supports our findings of disturbed cerebellar-DMN functional connectivity in BD. In addition, a recent study reported altered cerebellar-DMN connectivity in unaffected siblings of schizophrenia patients, which may serve as candidate endophenotypes for schizophrenia (Guo et al., 2015b). Therefore, these studies combined with our results suggest that decreased cerebellar-DMN connectivity may be trait alterations for BD independent of mood state.
The hippocampus is a limbic structure located in the medial temporal lobe. Recent work has illustrated that the hippocampus and cerebellum are functionally connected in a bidirectional manner such that the cerebellum can influence hippocampal activity and vice versa (Yu and Krook-Magnuson, 2015). This functional connectivity has important implications for physiology, including spatial and temporal processing, as well as pathophysiology of neurological and psychiatric disorders (Phillips et al., 2015; Yu and Krook-Magnuson, 2015). In this study, we found that reduced functional connectivity between the right cerebellum posterior lobe and bilateral hippocampus in patients with remitted BD. Structural MRI studies found gray matter loss in the hippocampus and cerebellum in BD (Roda et al., 2015). A recent DTI study found decreased node strength in the hippocampus in both high risk of BD and BD groups (Roberts et al., 2016). Postmortem studies also found reduced pyramidal neuron cell bodies and interneuron number in the hippocampus of patients with BD (Konradi et al., 2011). An rs-fMRI study reported decreased hippocampal seeds functional connectivity with the cerebellum in psychotic BD I (Samudra et al., 2015). The other fMRI study found longitudinal changes of functional connectivity between the hippocampus and other regions in schizophrenia, including the cerebellum and DMN, indicating that sequential progression of the impairment of episodic memory in the clinical course of schizophrenia patients (Duan et al., 2015). Our findings, combined with these previous reports, suggest that disrupted cerebellar–hippocampal connectivity could be associated with cognitive function deficit in BD. Unfortunately, we failed to observe the correlation between cerebellar–hippocampal functional connectivity and neuropsychological measures. Further studies should, therefore, evaluate the relationship between cerebellar–hippocampal connectivity and the specific cognitive tasks (i.e. memory and navigation processing-related tasks) in BD to help clarify this issue.
We also found that the functional connectivity between the posterior cerebellum and putamen was reduced in remitted BD. Both the sensorimotor- and cognitive-related cerebellar subregions (lobules V, VII and VIII) were correlated with the basal ganglia in healthy controls (Sang et al., 2012), which is consistent with prior findings regarding the function of the basal ganglia in sensorimotor, cognitive and emotional processing (Groenewegen, 2003). Previous meta-analyses determined volumetric alterations of the basal ganglia in BD (Hallahan et al., 2011). Furthermore, a structural MRI study found shape changes of the right putamen associated with psychomotor performance in euthymic BD (Liberg et al., 2014). Although BD is classified as an affective disorder, psychomotor disturbances are classic clinical signs, present in different phases of the disease, and the focus of clinical, neuropsychological and neurobiological investigations. In addition, we also found that patients with BD showed reduced connectivity between the cerebellum and the paracentral lobule. Furthermore, several recent studies indicated that the DMN may be related to psychomotor behavior through its relationship with the sensorimotor network. Martino et al. (2016) found topographical abnormalities in frequency-specific resting-state variability in the balance between DMN and sensorimotor network with opposing patterns in depressed and manic patients. Taken together, these findings suggest that impairments of the cerebellar functional connectivity with the basal ganglia, sensorimotor and DMN regions could be related to psychomotor disturbances of BD.
Our investigation has several limitations. First, the sample size of this study was relatively small, and results will require replication in a larger study. Second, this study was a cross-sectional design, which is even more prone to bias, unable to substantiate the assumption of causation and can only be of value for forming hypotheses (Pfennig et al., 2017). Thus, further longitudinal studies with a long time window are needed. Third, all patients were naturalistically treated, and none of them was ‘medication naïve’ owing to the difficulty in finding BD patients in remission had never been medicated. In a review of structural and functional imaging studies in BD, Hafeman et al. (2012) reported a limited effect of medication on fMRI and DTI study. Additionally, an apparent independence of cerebellar volume from pharmacological treatments, such as lithium or antipsychotics, was found in a recent large international study (Laidi et al., 2015). Fourth, although many graph metrics could be used to identify the functional brain networks, we used FCS because it was difficult to calculate other graph metrics due to a highly computational load in a network of 60,000 nodes approximately.
Combining whole-brain FCS and seed-based functional connectivity analyses, this study demonstrated that cerebellar dysconnectivity in BD even during the remitted state. Moreover, BD patients showed disrupted functional connectivity between the posterior cerebellum and the cerebral cortex, mainly including the DMN, limbic system, basal ganglia and sensorimotor regions. These findings indicated that the cerebellum might be associated with the pathogenesis of BD. Whether the cerebellum has the potential to be an effective target for treatment of BD is worth future investigations.
Footnotes
Acknowledgements
Y.W., S.Z. and G.C. contributed equally to this work.
Declaration of Conflicting Interests
The author(s) declared no potential conflicts of interest with respect to the research, authorship and/or publication of this article.
Funding
This study was supported by grants from the National Natural Science Foundation of China (81671670, 81501456 and 81471650); Planned Science and Technology Project of Guangdong Province, China (2014B020212022); and Planned Science and Technology Project of Guangzhou, China (1563000653, 201508020004, 20160402007 and 201604020184). The funding organizations play no further role in study design, data collection, analysis and interpretation and paper writing.