
Abstract
Objective:
Bullying prevalence studies are limited by varied measurement methods and a lack of representative samples. This study estimated the national prevalence of bullying victimisation, perpetration and combined victim-perpetration experiences in a representative population-based sample of Australian youth. The relationships between the three types of bullying involvement with a range of mental health symptoms and diagnoses were also examined.
Methods:
A randomly selected nationally representative sample aged 11–17 years (N = 2967, Mage = 14.6 years; 51.6% male) completed the youth component of the Second Australian Child and Adolescent Survey of Mental Health and Wellbeing (Young Minds Matter). Parents or carers also completed a structured face-to-face interview that asked questions about a single randomly selected child in the household. The youth survey comprised self-reported bullying victimisation and perpetration (Olweus Bully–Victim Questionnaire–adapted), psychological distress (K10), emotional and behavioural problems (Strengths and Difficulties Questionnaire), as well as self-harm, suicide attempts and substance use. Modules from the Diagnostic Interview Schedule for Children Version IV were administered to all youth and parents to assess for mental disorder diagnoses (major depressive disorder, any anxiety disorder and any externalising disorder [attention-deficit hyperactivity disorder, oppositional defiant disorder and conduct disorder]).
Results:
The 12-month prevalence of bullying victimisation was 13.3%, perpetration 1.6% and victim-perpetration 1.9%. Logistic regression models showed all forms of involvement in bullying were associated with increased risk of psychological distress, emotional and behavioural problems, substance use, self-harm and attempted suicide. Victimisation and victim-perpetration were associated with youth-reported major depressive disorder. There were also significant associations between bullying involvement and parent-reported diagnoses of major depressive disorder, any anxiety disorder and any externalising disorder.
Conclusion:
Bullying continues to be frequently experienced by Australian adolescents. The current findings showed that involvement in any bullying behaviour was associated with increased risk of concurrent mental health problems. This evidence can be used to inform decisions concerning the allocation of resources to address this important health issue.
Bullying is an international public health problem for adolescents (Craig et al., 2009) and is defined as intentional and repeated harm of a less powerful individual (Olweus, 1996; Smith et al., 2016). Traditional bullying typically occurs face-to-face and includes physical, verbal and relational forms, and cyberbullying is an extension of this behaviour in online environments (Smith and Slonje, 2010). While they often co-occur, bullying in traditional ways is twice as common (Modecki et al., 2014), and cyberbullying is rarely experienced alone (Waasdorp and Bradshaw, 2015). Involvement in bullying is frequently identified using three classifications: victimisation, perpetration and victim-perpetration (Haynie et al., 2001).
Nansel et al. (2004) conducted a study of youth aged 11–15 years in nationally representative school-based samples from 25 countries. Around 5–20% (M = 11%) reported bullying victimisation, 5–20% (M = 10%) reported bullying perpetration and another 1–20% (M = 6%) indicated victim-perpetration, and each was associated with poor social and emotional adjustment (Nansel et al., 2004). Additional studies have shown bullying victimisation contributes to a range of mental health problems (Cook et al., 2010a; Hawker and Boulton, 2000), over and above premorbid adjustment problems (Bond et al., 2001), and demonstrates a dose–response effect (Evans et al., 2014). Bullying perpetration is associated with externalising problems (Cook et al., 2010a; Juvonen et al., 2003). Those who report experiences of both victimisation and perpetration represent a particularly high-risk group who show poorer functioning than victimisation or perpetration alone (Cook et al., 2010a; Haynie et al., 2001; Juvonen et al., 2003). Involvement in bullying is also prospectively associated with a range of risk behaviours, such as self-harm (Lereya et al., 2013), suicide behaviours (Holt et al., 2015) and substance use (Ttofi et al., 2016). However, few studies have investigated the relationship between bullying and mental health using cross-informed child and parent reports (Rønning et al., 2009).
Valid and reliable measurement of bullying is critical for prevalence comparisons over time and across data systems and for identifying targets for intervention (Cornell and Bandyopadhyay, 2010). Australian studies have estimated the prevalence of bullying in different school-based samples, though these have show considerable variation (Bond et al., 2001, 2007; Cross et al., 2009; Delfabbro et al., 2006; Forero et al., 1999; Hemphill et al., 2011; Rigby and Johnson, 2016). Wide-ranging prevalence estimates are explained by differences in measurement approach, age group and timeframe referenced (Cook et al., 2010b). Only one previous Australian study assessed bullying across a continuing age range among a nationally representative sample of students aged 9–14 years (N = 7418, Mage = 12 years; 52% female) (Cross et al., 2009). In this study, 26.7% of students reported being bullied every few weeks or more often, and 8.8% of students reported bullying others every few weeks or more often in the previous school term. Recognising the limitations of cross-sectional data from different student samples, Rigby and Smith (2011) and Cross et al. (2011) suggested self-reported rates of victimisation have declined in Australia between the 1990s through to 2007, though only modestly. This trend is largely consistent with international evidence (Rigby and Smith, 2011).
Researchers continue to monitor bullying trends and aggregate findings in systematic meta-studies; therefore, prevalence data are of interest internationally. To date, there is no study examining the prevalence of bullying among Australian youth in a nationally representative randomly selected population-based sample. A probability-based sampling design has the benefit of producing valid estimates of the target population (Frankfort-Nachmias and Leon-Guerrero, 2015). This study aimed to estimate the 12-month prevalence of bullying victimisation, perpetration and victim-perpetration among a randomly selected population-based sample of Australian youth. Establishing the relationship between bullying and individual-level factors requires a comprehensive assessment of both youth- and parent-informed mental health measures. In this study, co-morbid assessment of mental health was measured with parent–child informant pairs: youth self-report and parent assessments of their child’s mental health. The association between mental health and the three classes of bullying involvement was also examined.
Method
Participants and procedure
The sample was drawn from the Second Australian Child and Adolescent Survey of Mental Health and Wellbeing, known as the Young Minds Matter Survey (Lawrence et al., 2015). Data were collected between June 2013 and April 2014 from parents and carers through face-to-face interviews conducted by trained interviewers. In addition, young people aged 11–17 years completed a questionnaire on a tablet computer. The detailed survey methodology has been published (Hafekost et al., 2015). Briefly, area-based sampling was used to select a random sample of households with children and adolescents aged 4–17 years residing. A child was selected at random if there was more than one child in the household. In total, 6310 parents (55%) from the eligible households approached agreed to provide information about a selected child. All parents who agreed to take part were invited to complete all modules of the interview. Of the 3334 youth aged 11–17 years whose parents and carers were interviewed, 2967 youth (89%; Mage = 14.6 years; 51.6% male) also agreed to participate in the study and were asked to complete all modules of the youth self-report questionnaire.
Approval of the research protocol was provided by the Research Ethics Committees within the Australian Government Department of Health, The University of Western Australia and The University of Queensland. Written consent was sought from all parents, as well as from all young people who took part in the study. This sample was representative of Australian children and adolescents based on a range of demographic characteristics (Hafekost et al., 2015). Overall, 63% lived in an intact family (two parents living at home), 65% lived in major cities, 86% were born in Australia and 90% reported English was their main language. According to the Australian Bureau of Statistics Census standards for household income, 24.7% were classified in the lower band (less than AUD$52,000 per year), 44.2% in the middle band (AUD$52,000 to AUD$129,999 per year), 27.3% in the higher band (AUD$130,000 or more per year) and 3.9% did not respond.
Measures
Bullying experiences
Bullying was assessed using single global items and a multi-item scale adapted from the Olweus Bully–Victim Questionnaire and the Cyber Friendly Schools program (Cross et al., 2016). Questions were preceded by a definition of bullying (Olweus, 1996) and cyberbullying (Smith et al., 2006) (Supplementary Materials 1). The global victimisation item asked, ‘In the past 12 months, how often were you bullied or cyberbullied by another person or group of young people?’ Response options included (a) ‘not in the past 12 months’, (b) ‘once or twice in the past 12 months’, (c) ‘every few months’, (d) ‘every few weeks’, (e) ‘about once a week’ or (f) ‘most days’. This style of response scale has been widely applied to the measurement of bullying (Olweus, 1996; Shaw et al., 2013; Solberg and Olweus, 2003). Global perpetration was measured using the item ‘In the past 12 months, how often did you bully or cyberbully another person or group of young people?’ with the same response options (Supplementary Materials 2). The two measures were treated as dichotomous variables.
The common method applied to the prevalence estimation of bullying discounts behaviour that occurs ‘once or twice’ and applies the third response level as the lower cut-off point (Olweus, 1996; Solberg and Olweus, 2003). The traditional use of this cut-off point is based on the conceptual agreement that bullying has a repetitive quality. Experiences that occur ‘once or twice’ instead suggest a tendency of being bullied or bullying others. Researchers argue that ‘once or twice’ is not a clear measure of bullying victimisation or perpetration status (Solberg and Olweus, 2003). For this reason, participants were categorised as ‘uninvolved’ if they responded ‘not in the past 12 months’ or ‘once or twice in the past 12 months’. Otherwise, those who selected ‘every few months’ or more frequent were grouped as ‘victimised’, ‘perpetrated’ or ‘victim-perpetrated’, congruent with their reported experiences.
A 10-item bullying victimisation scale was presented if a young person reported ‘once or twice’ or more often to the global bullying victimisation item asking ‘In the last 12 months, were you bullied or cyberbullied in the following ways?’ The scale comprised seven items referring to traditional bullying (e.g. ‘Made fun of or teased in a mean and hurtful way’) and three items on cyberbullying (e.g. ‘Sent nasty messages by email, mobile phone or on the Internet’) to which they could respond ‘yes’ or ‘no’ (Supplementary Materials 2). If reported ‘yes’, they were asked to indicate the frequency of victimisation using the same response options used for global victimisation. Experiences of ‘once or twice’ were deemed ‘uninvolved’. The scale showed strong internal consistency (α = 0.94). Two follow-up questions were asked to determine participants’ emotional reaction to bullying victimisation experiences. First, ‘In the past 12 months when bullying was at its worst, did it make you feel sad or upset?’, ‘yes’ or ‘no’. If indicated ‘yes’, they were asked, ‘How sad or upset were you’? – ‘a little bit’, ‘somewhat’, ‘a lot’ or ‘extremely’. Second, ‘Did you seek help or talk to someone about bullying?’ – ‘yes’ or ‘no’.
Mental health
Psychological distress
Psychological distress was assessed using the Kessler 10 Psychological Distress Scale (K10), which consists of 10 items measuring anxiety and depression symptoms over the previous 4 weeks on a 5-point scale. The scale showed strong internal consistency (α = 0.90) in this study. Responses were summed and scores ranged from 10 to 50. The summed score was used to classify participants according to four levels of psychological distress – low (10–15), moderate (15–21), high (22–29) and very high (30–50) – a scoring methodology previously applied to Australian health surveys (Slade et al., 2009b).
Emotional and behavioural problems
Emotional and behavioural problems were assessed using the youth self-report version of the Strengths and Difficulties Questionnaire (SDQ) which measures positive and negative emotional and behavioural traits (Goodman et al., 1998). Items are scored on a 3-point scale, and five items require reverse scoring. Four of the five subscales (emotional problems, conduct problems, hyperactivity and peer problems) are combined to calculate a total difficulties score ranging from 0 to 40 (Cronbach’s alpha for current study, α = 0.86). Scores were classified using the established three-band categorisation system of ‘normal’, ‘borderline’ and ‘abnormal’. These bandings were defined to identify cut-off points such that 80% of the population scored ‘normal’, 10% ‘borderline’ and 10% ‘abnormal’. Total difficulties scores were categorised according to established cut-offs: normal (0–15), borderline (16–19) and abnormal (20–40) (Goodman et al., 1998).
Major depressive disorder
Major depressive disorder (MDD) was assessed using the Diagnostic Interview Schedule for Children, Version 4 (DISC-IV) which implements the criteria of the Diagnostic and Statistical Manual for Mental Disorders, 4th Edition (DSM-IV) (Shaffer et al., 2000). Youth were classified as meeting the diagnostic criteria for MDD if they met the required number of symptoms, duration and criteria for impairment in social or role functioning.
Parent-reported mental disorders
Parent-reported mental disorders were diagnosed by structured interviews with parents using the DISC-IV (Shaffer et al., 2000). Parent-reported DISC-IV disorders were categorised into any anxiety disorder (generalised anxiety disorder, social phobia, separation anxiety disorder or obsessive compulsive disorder), MDD or any externalising disorder (attention-deficit hyperactivity, oppositional defiant or conduct disorders). Parents were also asked whether their child had seen any professional service for an emotional or behavioural problem in the past 12 months – ‘yes’ or ‘no’.
Self-harm and suicidal behaviour
Participants 12 years or older were asked, ‘Have you deliberately harmed or injured yourself without intending to end your own life during the past 12 months?’ Responses were grouped into ‘never self-harmed or self-harmed over 12 months’, ‘self-harmed in the past 12 months’ or ‘prefer not to say’. Participants 12 years or older were also asked, ‘Did you attempt suicide during the past 12 months?’ Groups were established based on ‘never attempted suicide or attempted suicide over 12 months’ or ‘attempted suicide in the past 12 months’ or ‘prefer not to say’.
Substance use behaviours
Participants 13 years or older were asked about their use of different substances in the past 30 days. Young people were grouped according to whether they had ever used alcohol other than a few sips, and if ‘yes’, whether they had drunk alcohol in the past 30 days: ‘never used or not used in the past 30 days’ or ‘used in the past 30 days’. Binge alcohol use was classified as having drunk four standard drinks or more in a row at least once. To assess for binge alcohol use, participants were grouped as ‘no binge alcohol use in the past 30 days’ or ‘binge alcohol use in the past 30 days’. For tobacco, cannabis and other drugs, participants were grouped based on whether they had ever tried a substance and the timeframe of use: ‘never used or not used in the past 30 days’ or ‘used in the past 30 days’. Other drug use included ecstasy, methamphetamines/amphetamines, cocaine, hallucinogens, inhalants, heroin, steroids and any other illegal drugs or prescription drugs used illegally.
Data analysis
Analyses were performed using IBM SPSS Statistics, Version 23. Data were weighted to represent the population aged 11–17 years in Australia, accounting for sex, age, family size and household income (Hafekost et al., 2015). Less than 0.5% of cases had missing data on the variables of interest, and all variables had less than 0.5% missing data. Analysis of missing data showed Little’s Missing Completely at Random test was not statistically significant. This result indicated that the probability a data point was missing was unrelated to the value of any other variable. For these reasons, complete-case data were analysed and reported (Tabachnick and Fidell, 2013).
The central analysis was to estimate the prevalence of bullying victimisation, perpetration and victim-perpetration according to reported involvement that occurred ‘every few months’ or more often in the past 12 months. An alternative coding scheme was applied to the data to examine the effect of estimating prevalence using a lower cut-off (i.e. inclusive of experiences that occurred ‘once or twice’ or more often). The application of a lower cut-off heavily inflated prevalence estimates and likely incorrectly classified less severe forms of peer aggression that do not represent bullying (Solberg and Olweus, 2003). This result suggested that the original cut-off criterion of ‘every few months’, which applies the conceptual requirement of repetition, was more appropriate.
The multi-item victimisation scale was examined to determine the most common form of victimisation experienced. Logistic regression models were used to assess the relationship between involvement in bullying and mental health outcomes. Models were adjusted for age and sex and the reference group was always ‘uninvolved’. The results of the analyses are summarised in text and refer to the statistical parameters reported in tables. Reported percentages are weighted and sample counts are unweighted.
Results
Prevalence of self-reported bullying experiences
In the previous 12 months, most youth were not involved in bullying (83.2%, N = 2491); 13.3% experienced victimisation only (N = 374), 1.6% reported perpetration only (N = 45) and 1.9% reported both victimisation and perpetration (N = 54). Table 1 presents the prevalence and confidence intervals for males, females, younger and older age groups and the complete sample. A higher proportion of victimised youth were female (odds ratio [OR] = 1.38, 95% confidence interval [CI] = [1.09, 1.76], p = 0.008). There was no relationship between perpetration and victim-perpetration and sex (OR = 0.50, 95% CI = [0.25, 1.03], p = 0.059 and OR = 1.17, 95% CI = [0.66, 2.09], respectively). The victimisation and victim-perpetration groups showed increased odds of being younger (OR = 1.11, 95% CI = [1.05, 1.18], p ⩽ 0.001, and OR = 1.25, 95% CI = [1.09, 1.18], p = 0.001). There was no relationship between perpetration and age.
Twelve-month population prevalence of victimisation, perpetration and victim-perpetration.
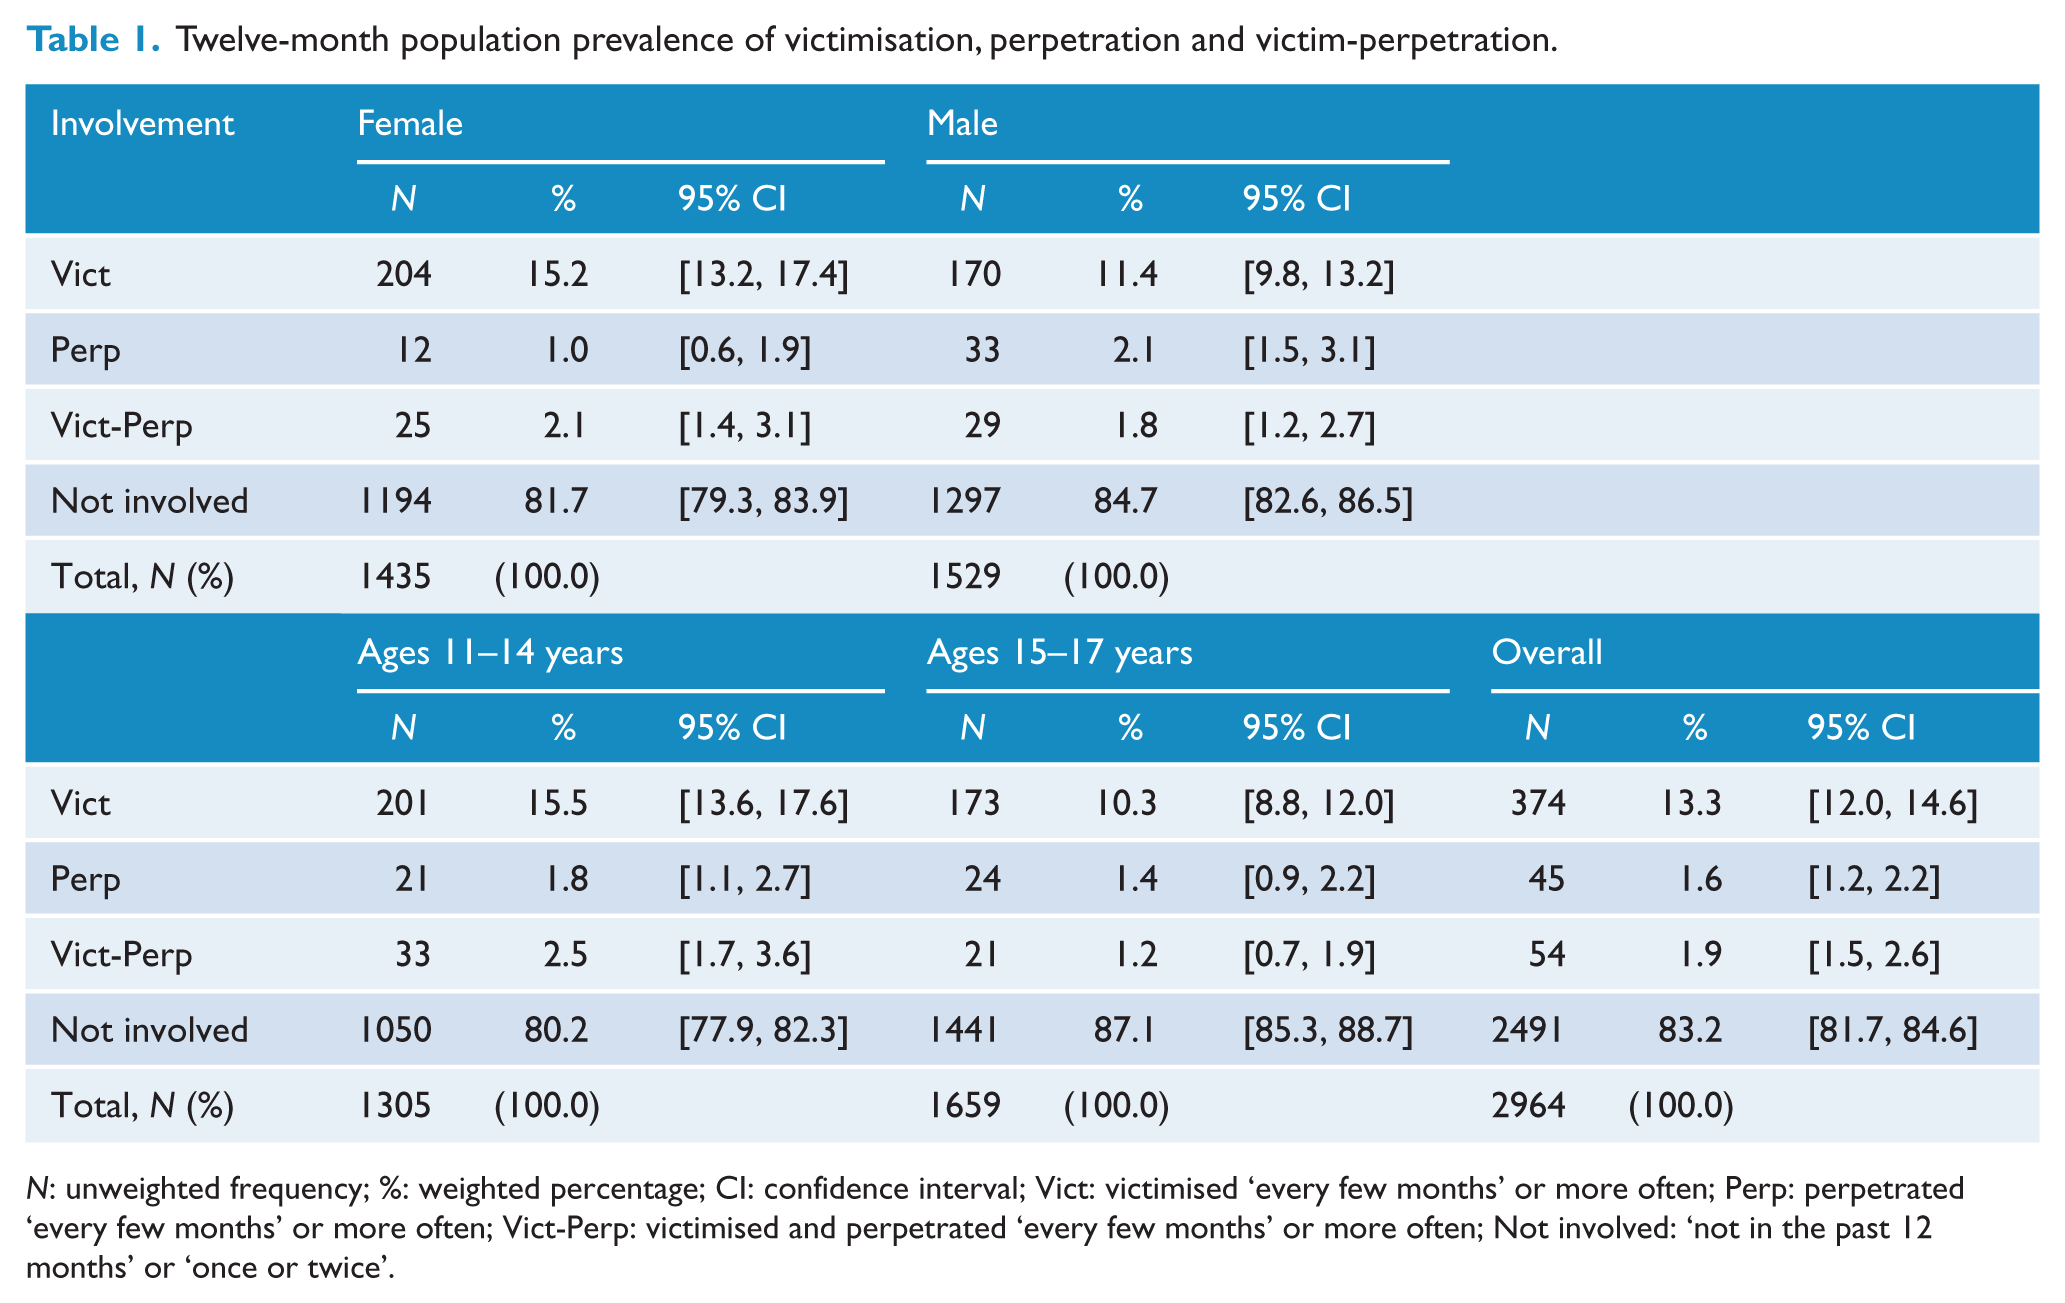
N: unweighted frequency; %: weighted percentage; CI: confidence interval; Vict: victimised ‘every few months’ or more often; Perp: perpetrated ‘every few months’ or more often; Vict-Perp: victimised and perpetrated ‘every few months’ or more often; Not involved: ‘not in the past 12 months’ or ‘once or twice’.
Reported experiences of different forms of bullying victimisation in the past 12 months are presented in Table 2. ‘Being made fun of or teased in mean or hurtful ways’ was the most common form of victimisation reported. Items were further examined to analyse patterns of victimisation. Of the participants who reported being bullied ‘every few weeks’ or more often, 71.4% reported victimisation in only traditional ways (95% CI = [67.5, 75.1]; N = 454), 27.4% experienced traditional and cyberbullying (95% CI = [23.8, 31.3]; N = 188) and 1.1% experienced cyberbullying only (95% CI = [0.6, 2.2]; N = 10). Overall, 82.2% reported that their experiences of bullying made them feel sad or upset (N = 352), 9.8% ‘a little bit’, 21.2% ‘somewhat’, 30.6% ‘a lot’ and 20.6% ‘extremely’. Of the young people who indicated they were sad or upset, 55.9% did not seek help by talking to someone.
Experiences of different forms of bullying victimisation in the past 12 months.
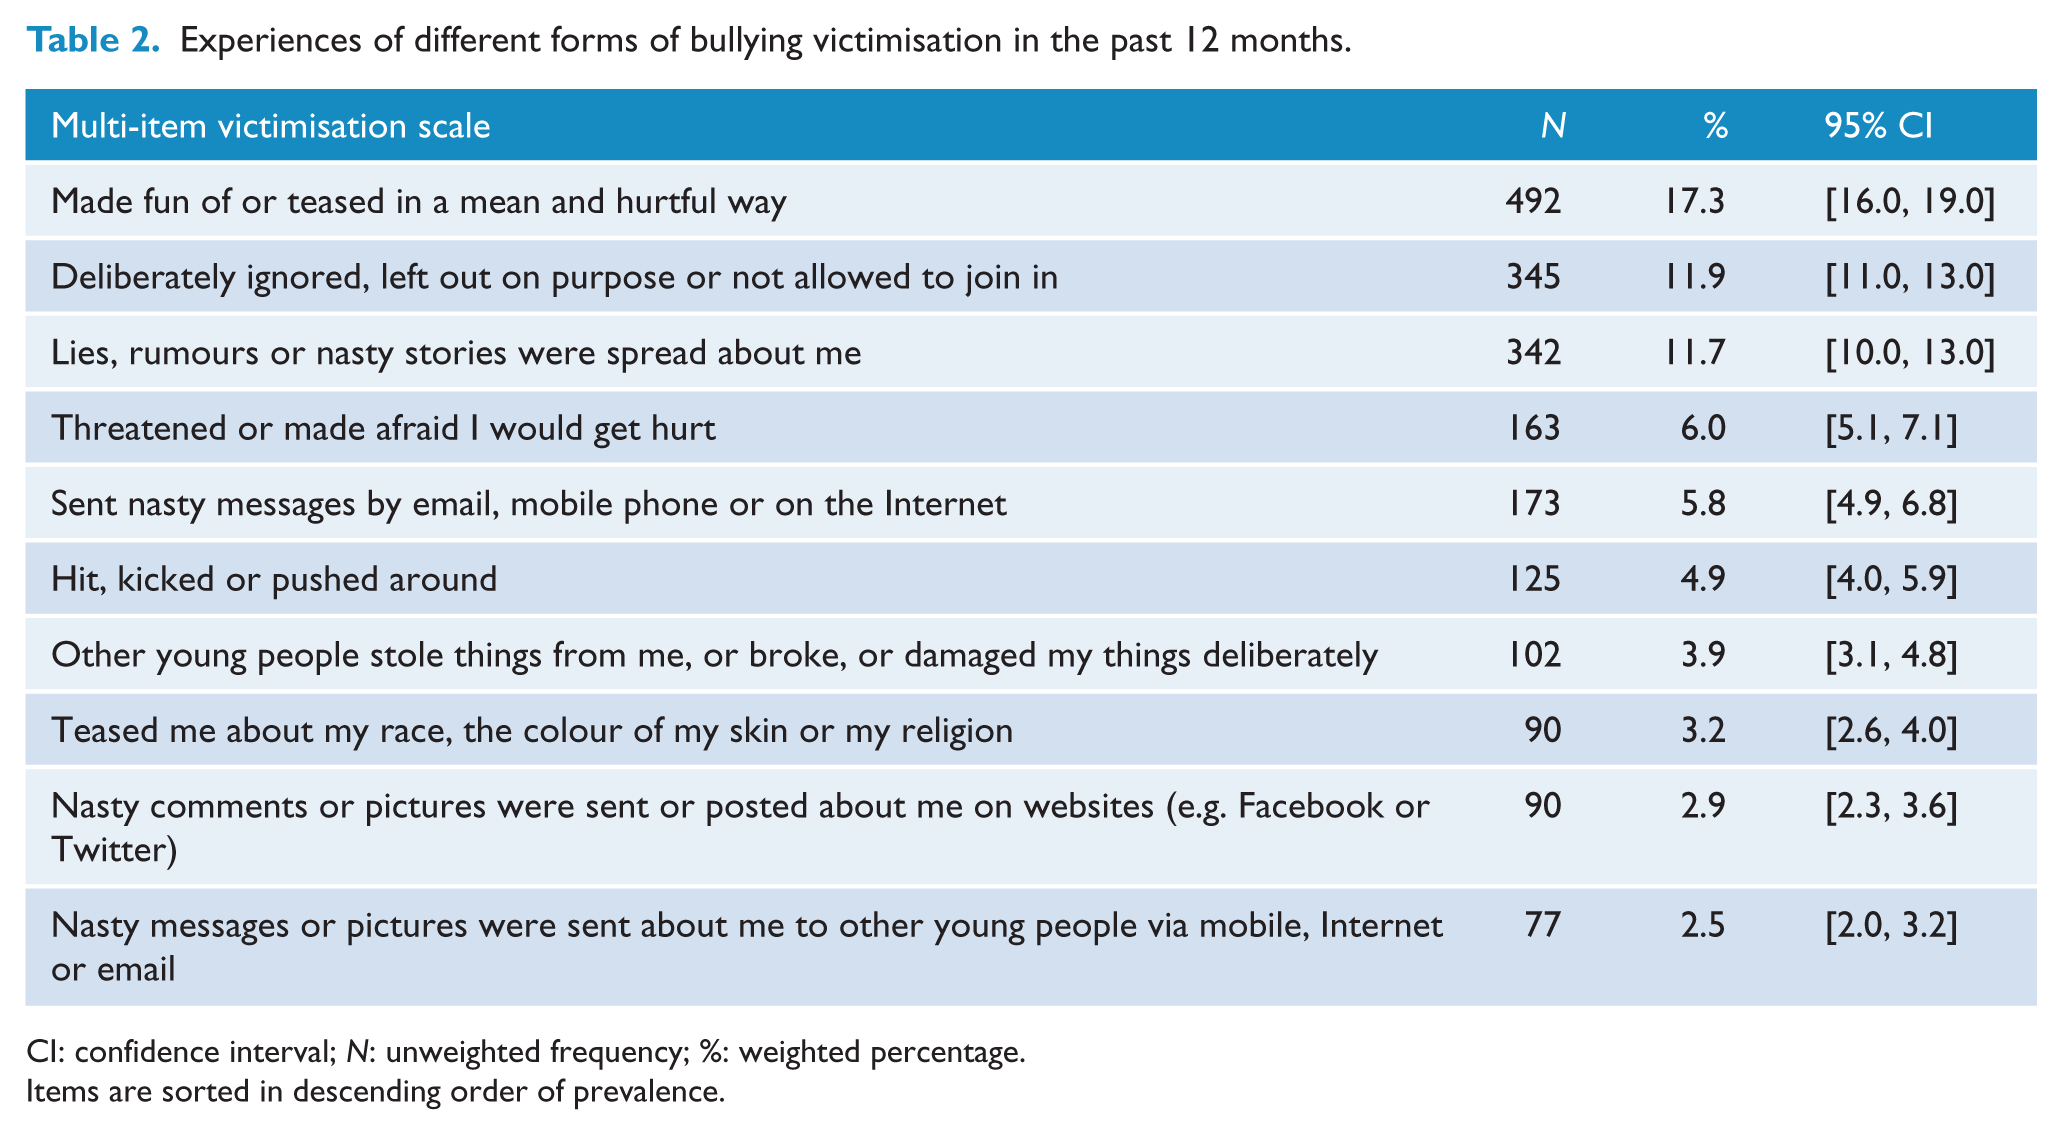
CI: confidence interval; N: unweighted frequency; %: weighted percentage.
Items are sorted in descending order of prevalence.
Self-reported bullying and mental health
All three bullying groups had higher odds of reporting moderate, high or very high levels of psychological distress (K10) (Table 3). A higher proportion of youth who reported bullying victimisation, perpetration or victim-perpetration also experienced emotional and behavioural problems, at or above borderline levels, as measured by SDQ total difficulties (Table 3). The results of binomial logistic regressions showed the victimisation and victim-perpetration groups had increased odds of MDD in the past year. There was no significant relationship between perpetration and MDD (Table 3).
Bullying in the past year and youth-reported mental health difficulties.
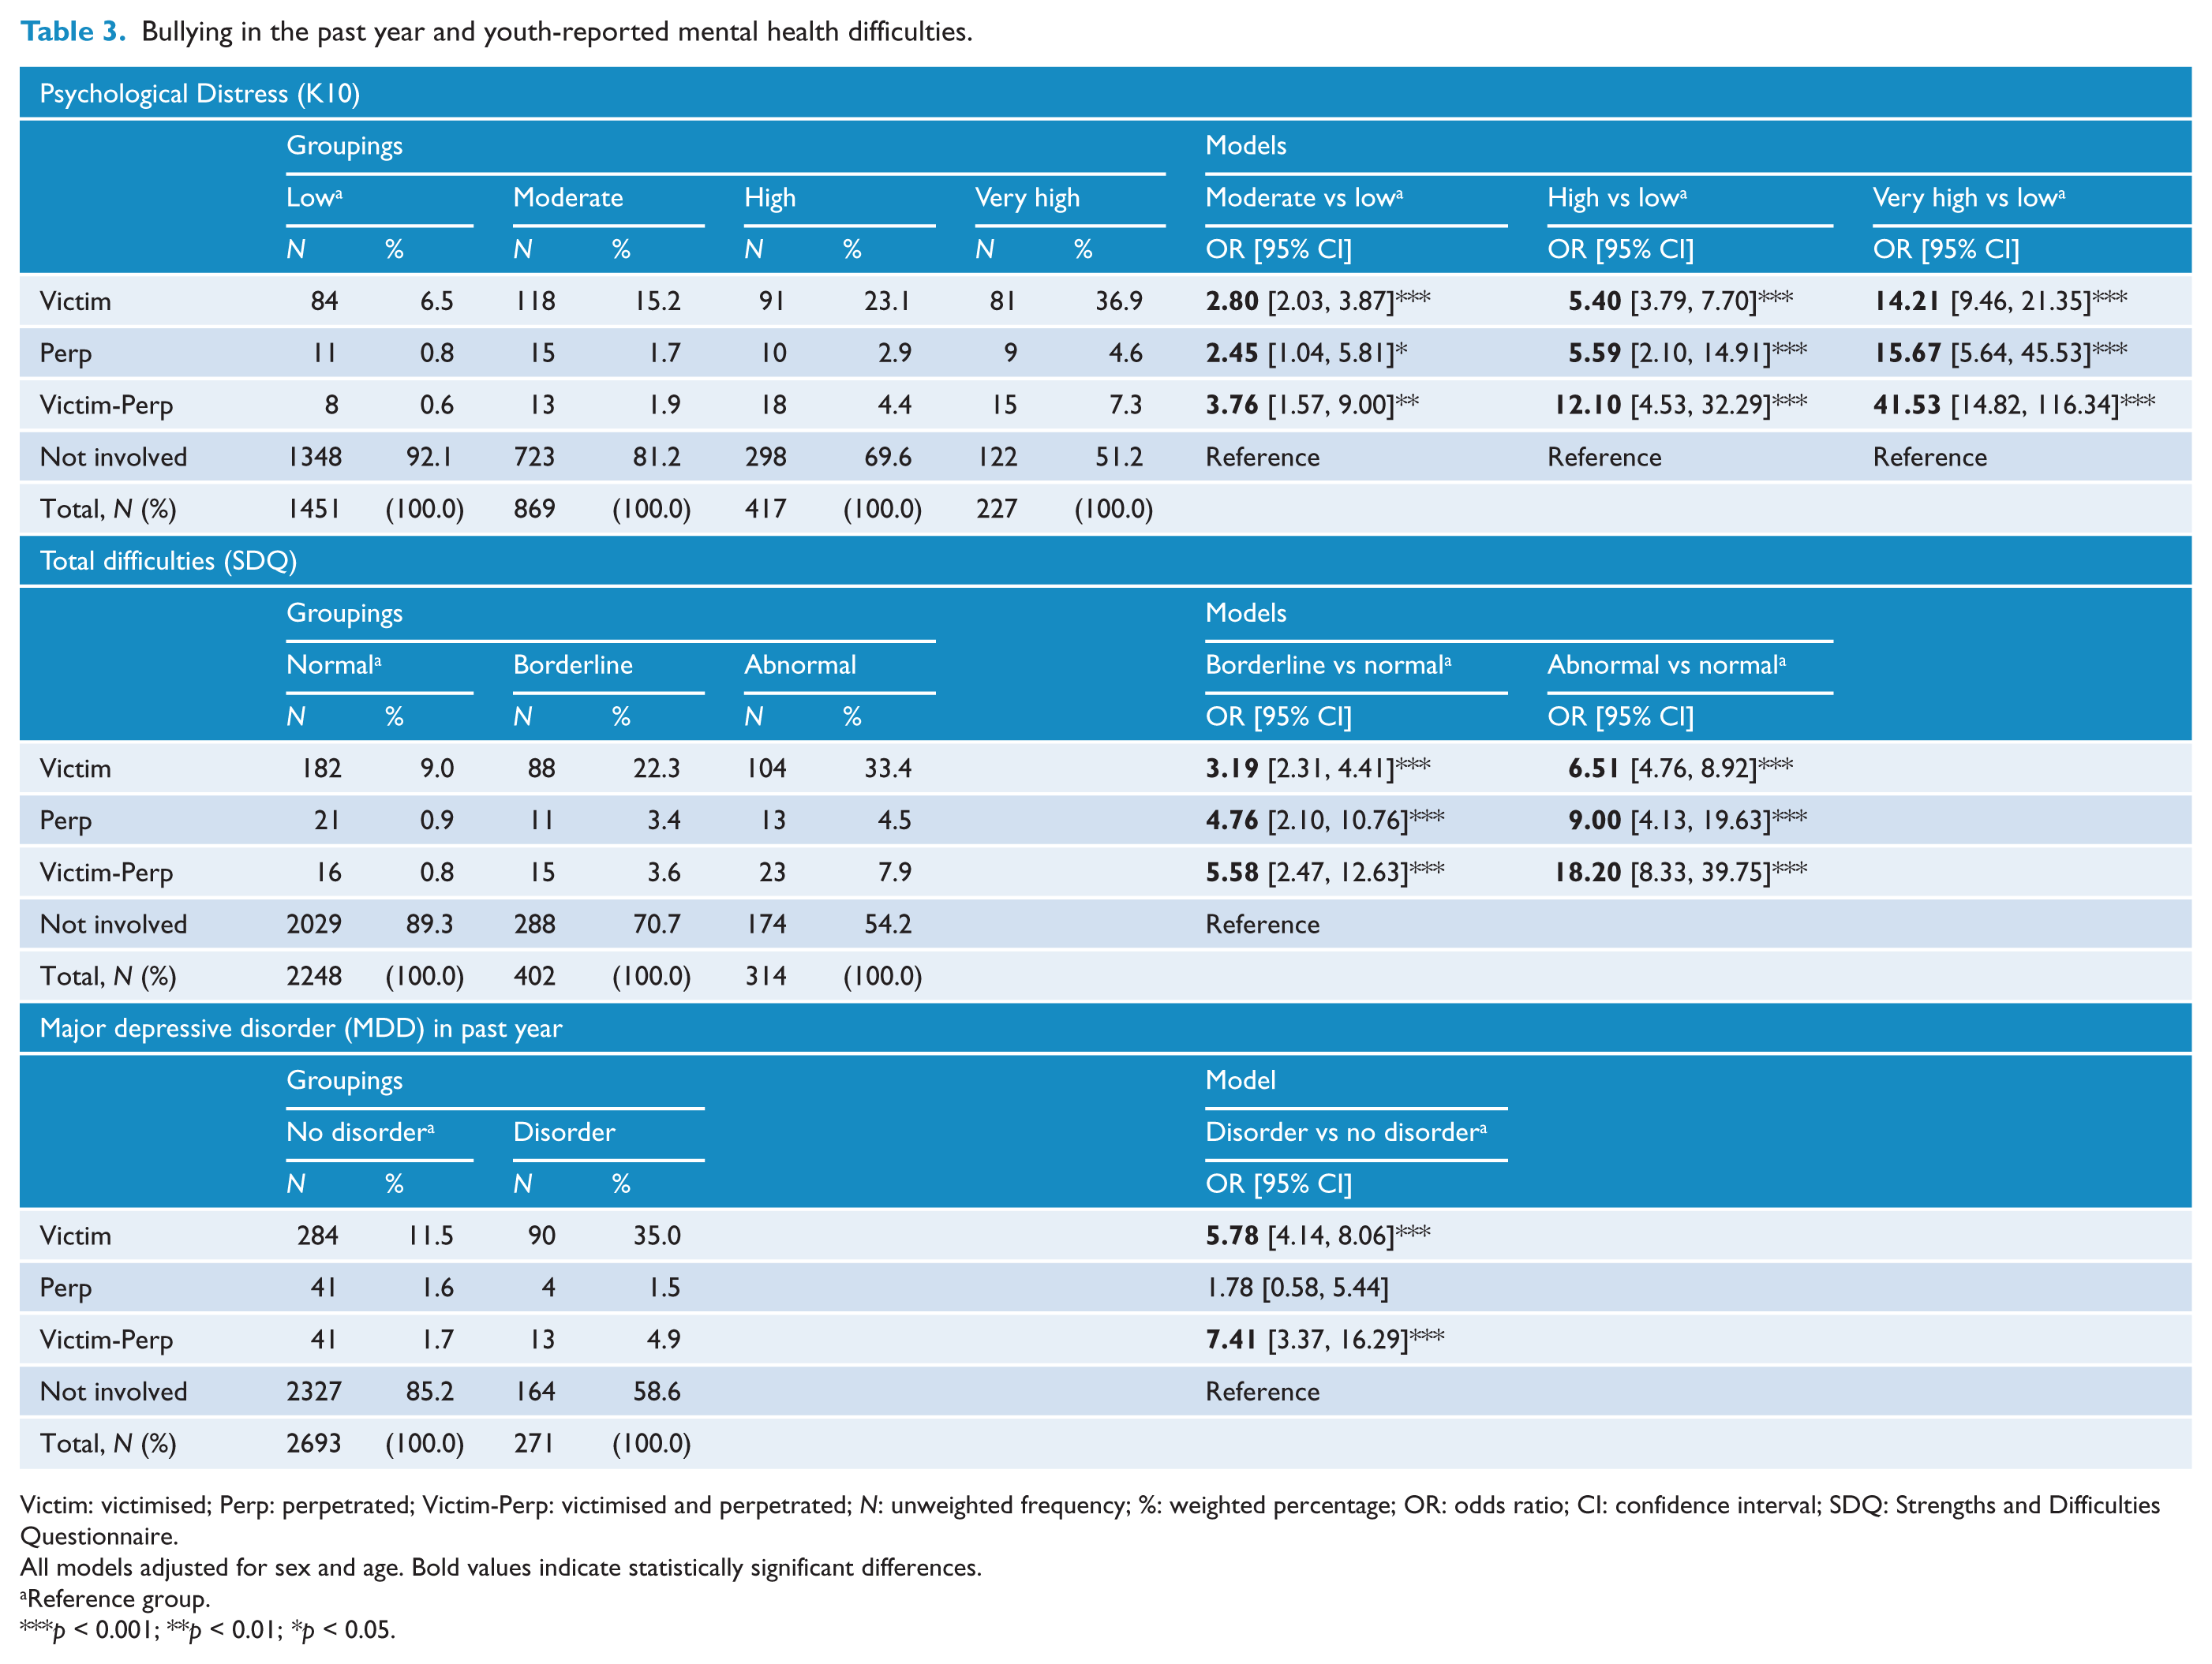
Victim: victimised; Perp: perpetrated; Victim-Perp: victimised and perpetrated; N: unweighted frequency; %: weighted percentage; OR: odds ratio; CI: confidence interval; SDQ: Strengths and Difficulties Questionnaire.
All models adjusted for sex and age. Bold values indicate statistically significant differences.
Reference group.
p < 0.001; **p < 0.01; *p < 0.05.
Self-reported bullying and parent-reported mental health
The results of binomial logistic regressions presented in Table 4 showed that compared to uninvolved youth, those who reported victimisation had increased odds of any parent-reported anxiety disorder, MDD and any externalising disorder in the past year. There was a higher proportion of youth who experienced victim-perpetration and perpetration who also met the criteria for any externalising disorder. There was no significant association between victim-perpetration and perpetration, and any anxiety disorder or MDD (Table 4). All three groups involved in bullying had higher odds of accessing a service for emotional or behavioural problems in the past 12 months (Table 4).
Bullying in the past year and parent-reported DISC conditions and service access.
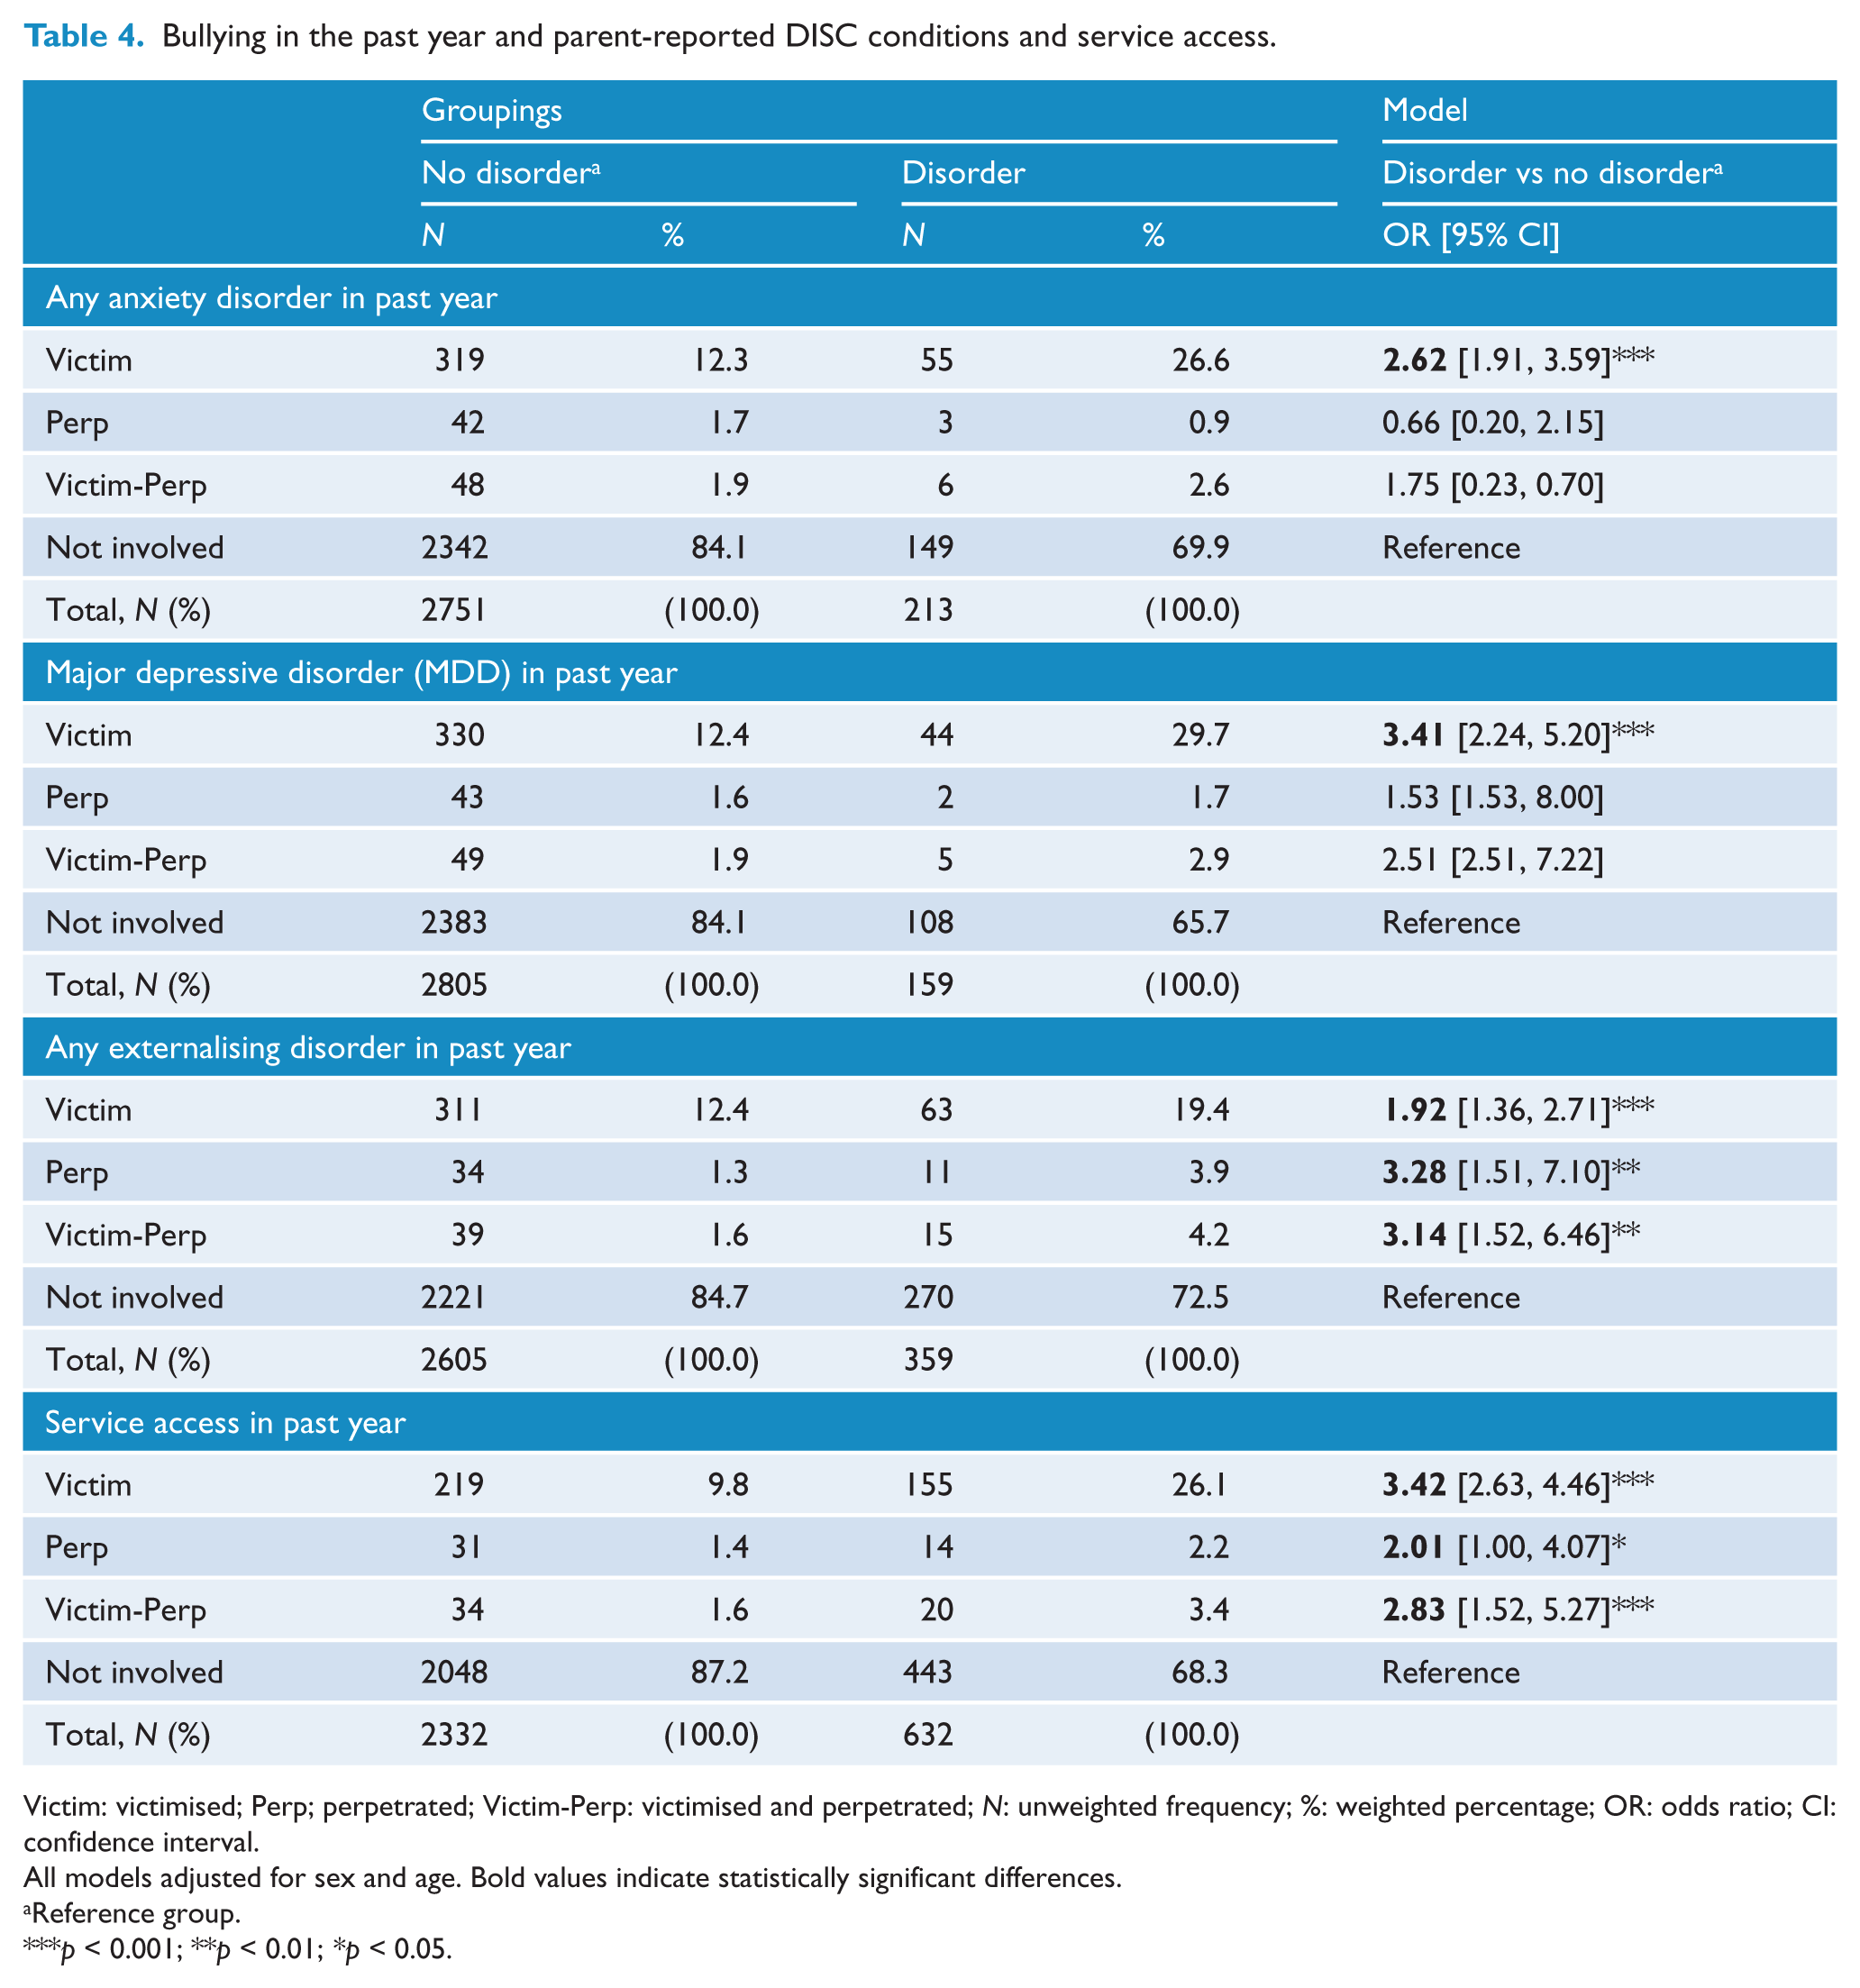
Victim: victimised; Perp; perpetrated; Victim-Perp: victimised and perpetrated; N: unweighted frequency; %: weighted percentage; OR: odds ratio; CI: confidence interval.
All models adjusted for sex and age. Bold values indicate statistically significant differences.
Reference group.
p < 0.001; **p < 0.01; *p < 0.05.
Self-reported bullying, self-harm and attempted suicide
Multinomial logistic regression indicated a higher proportion of youth who reported victimisation, perpetration or victim-perpetration also reported engaging in self-harm in the past 12 months (Table 5). The results also showed a higher proportion of those who experienced victimisation or perpetration answered ‘prefer not to say’ when asked about self-harm. Those who reported bullying victimisation, perpetration or victim-perpetration had increased odds of a suicide attempt in the past 12 months (Table 5). Again, a higher proportion of youth who reported victim-perpetration experiences also indicated ‘prefer not to say’ to the suicide attempt question.
Bullying in the past year and youth-reported self-harm and suicide behaviour in the past year.
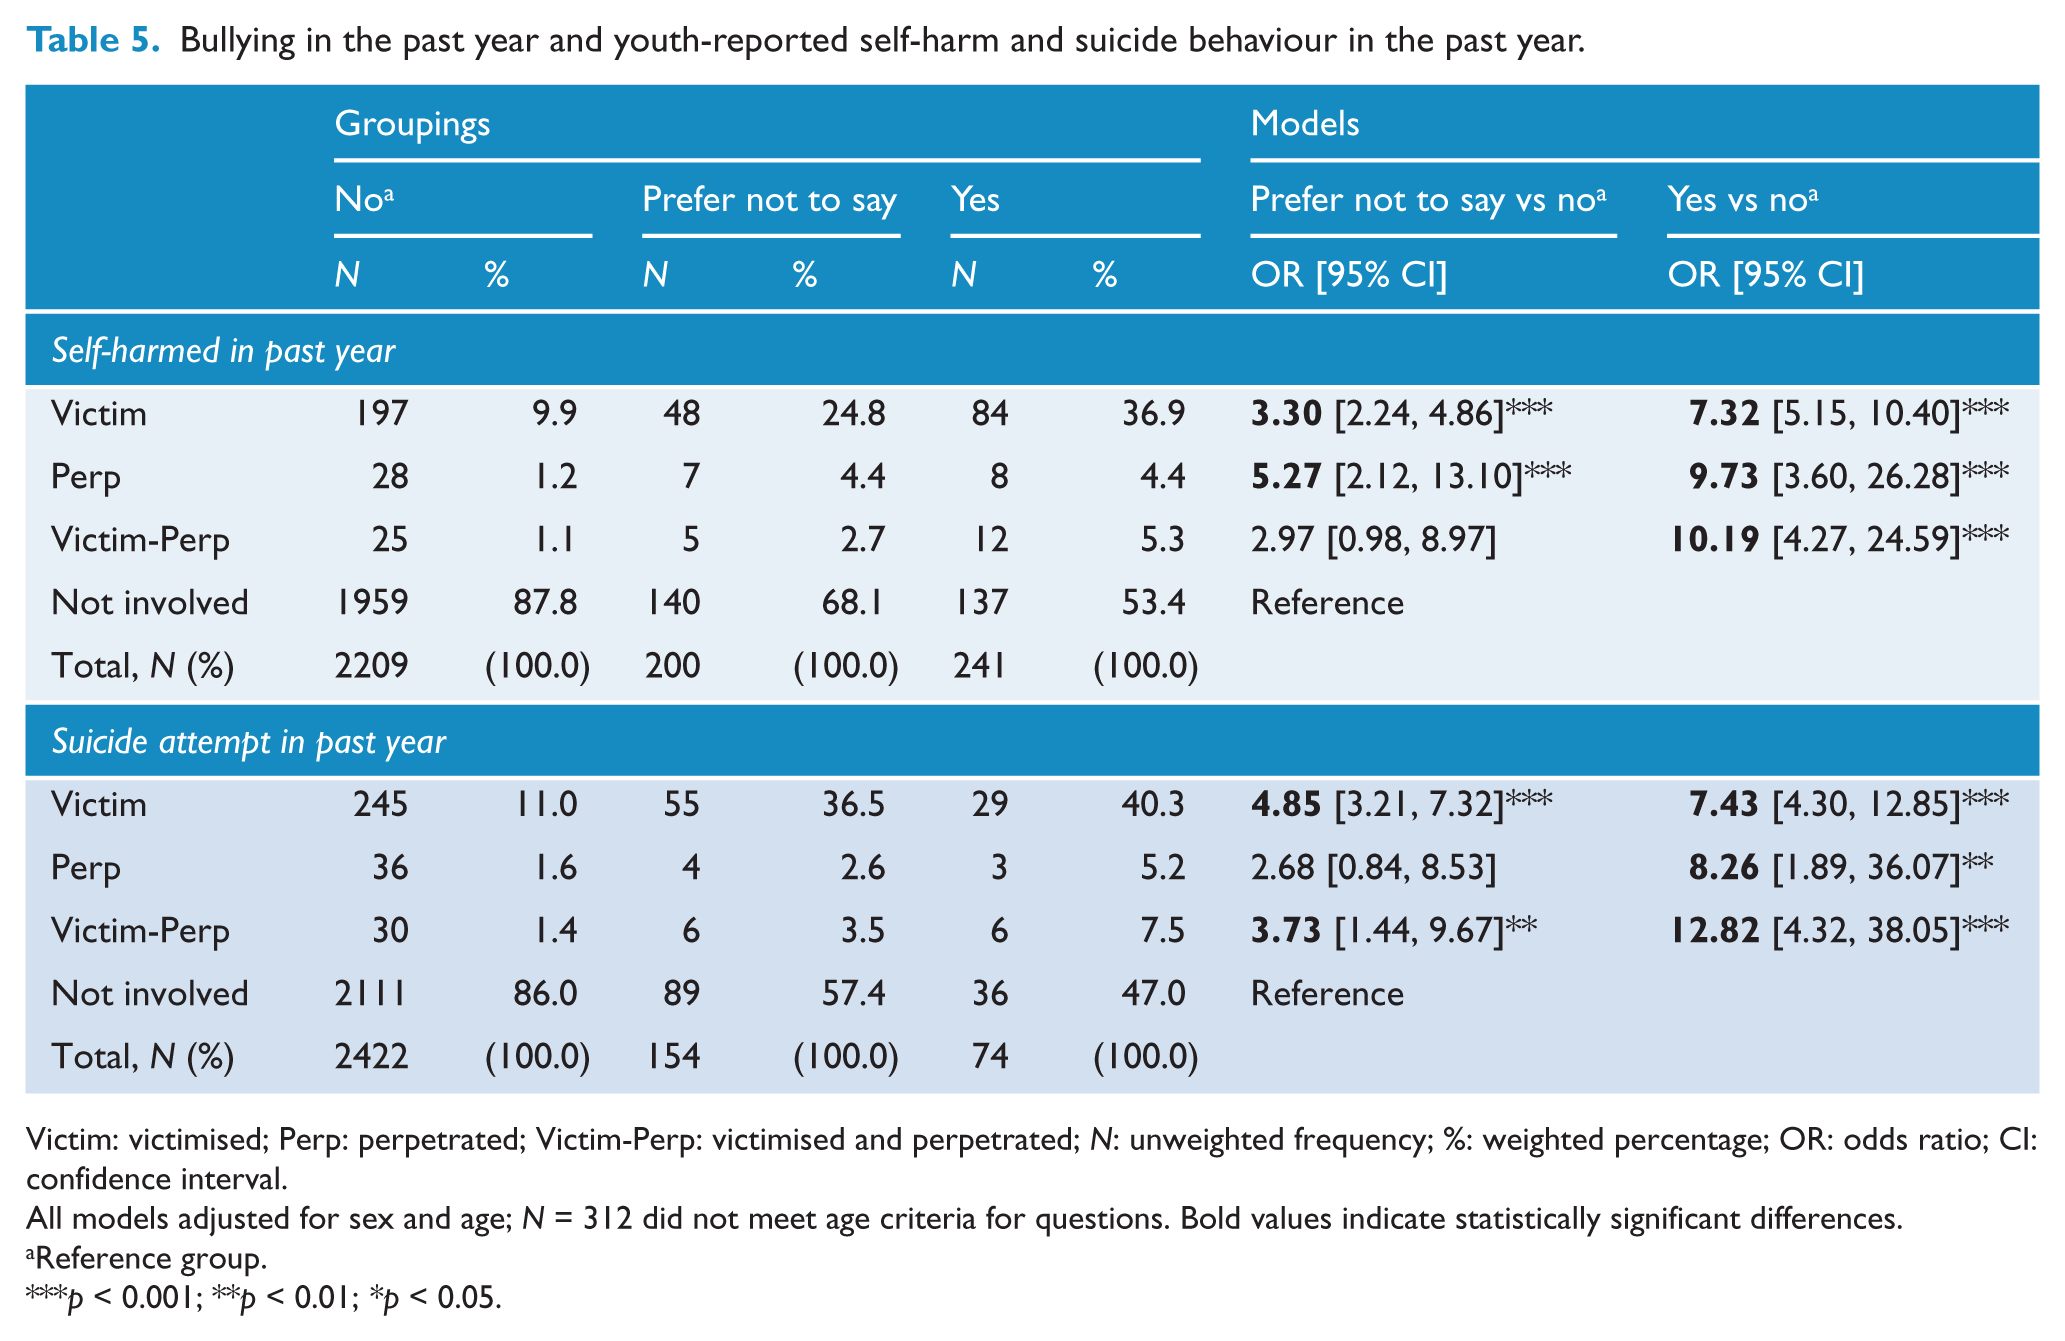
Victim: victimised; Perp: perpetrated; Victim-Perp: victimised and perpetrated; N: unweighted frequency; %: weighted percentage; OR: odds ratio; CI: confidence interval.
All models adjusted for sex and age; N = 312 did not meet age criteria for questions. Bold values indicate statistically significant differences.
Reference group.
p < 0.001; **p < 0.01; *p < 0.05.
Self-reported bullying and substance use
The complete results examining the relationship between bullying involvement in the past 12 months and 30-day substance use are reported in Table 6. Compared to uninvolved and victimised youth, those who perpetrated bullying had increased odds of having used alcohol. Victims of bullying had higher odds of also engaging in alcohol use, but not binge alcohol use. Those who experienced victim-perpetration had increased odds of binge alcohol use, but not any alcohol use. Those who were victimised or perpetrated bullying had increased odds of tobacco use. A significantly higher proportion of youth who reported any type of bullying involvement also used cannabis. Furthermore, there were increased odds of cannabis use among youth who perpetrated bullying, compared to those who were victimised. Regarding other drug use, youth who reported perpetration or victim-perpetration had significantly higher odds of using other drugs. There was no relationship between bullying victimisation and other reported drug use.
Bullying in past year and substance use in past 30 days.
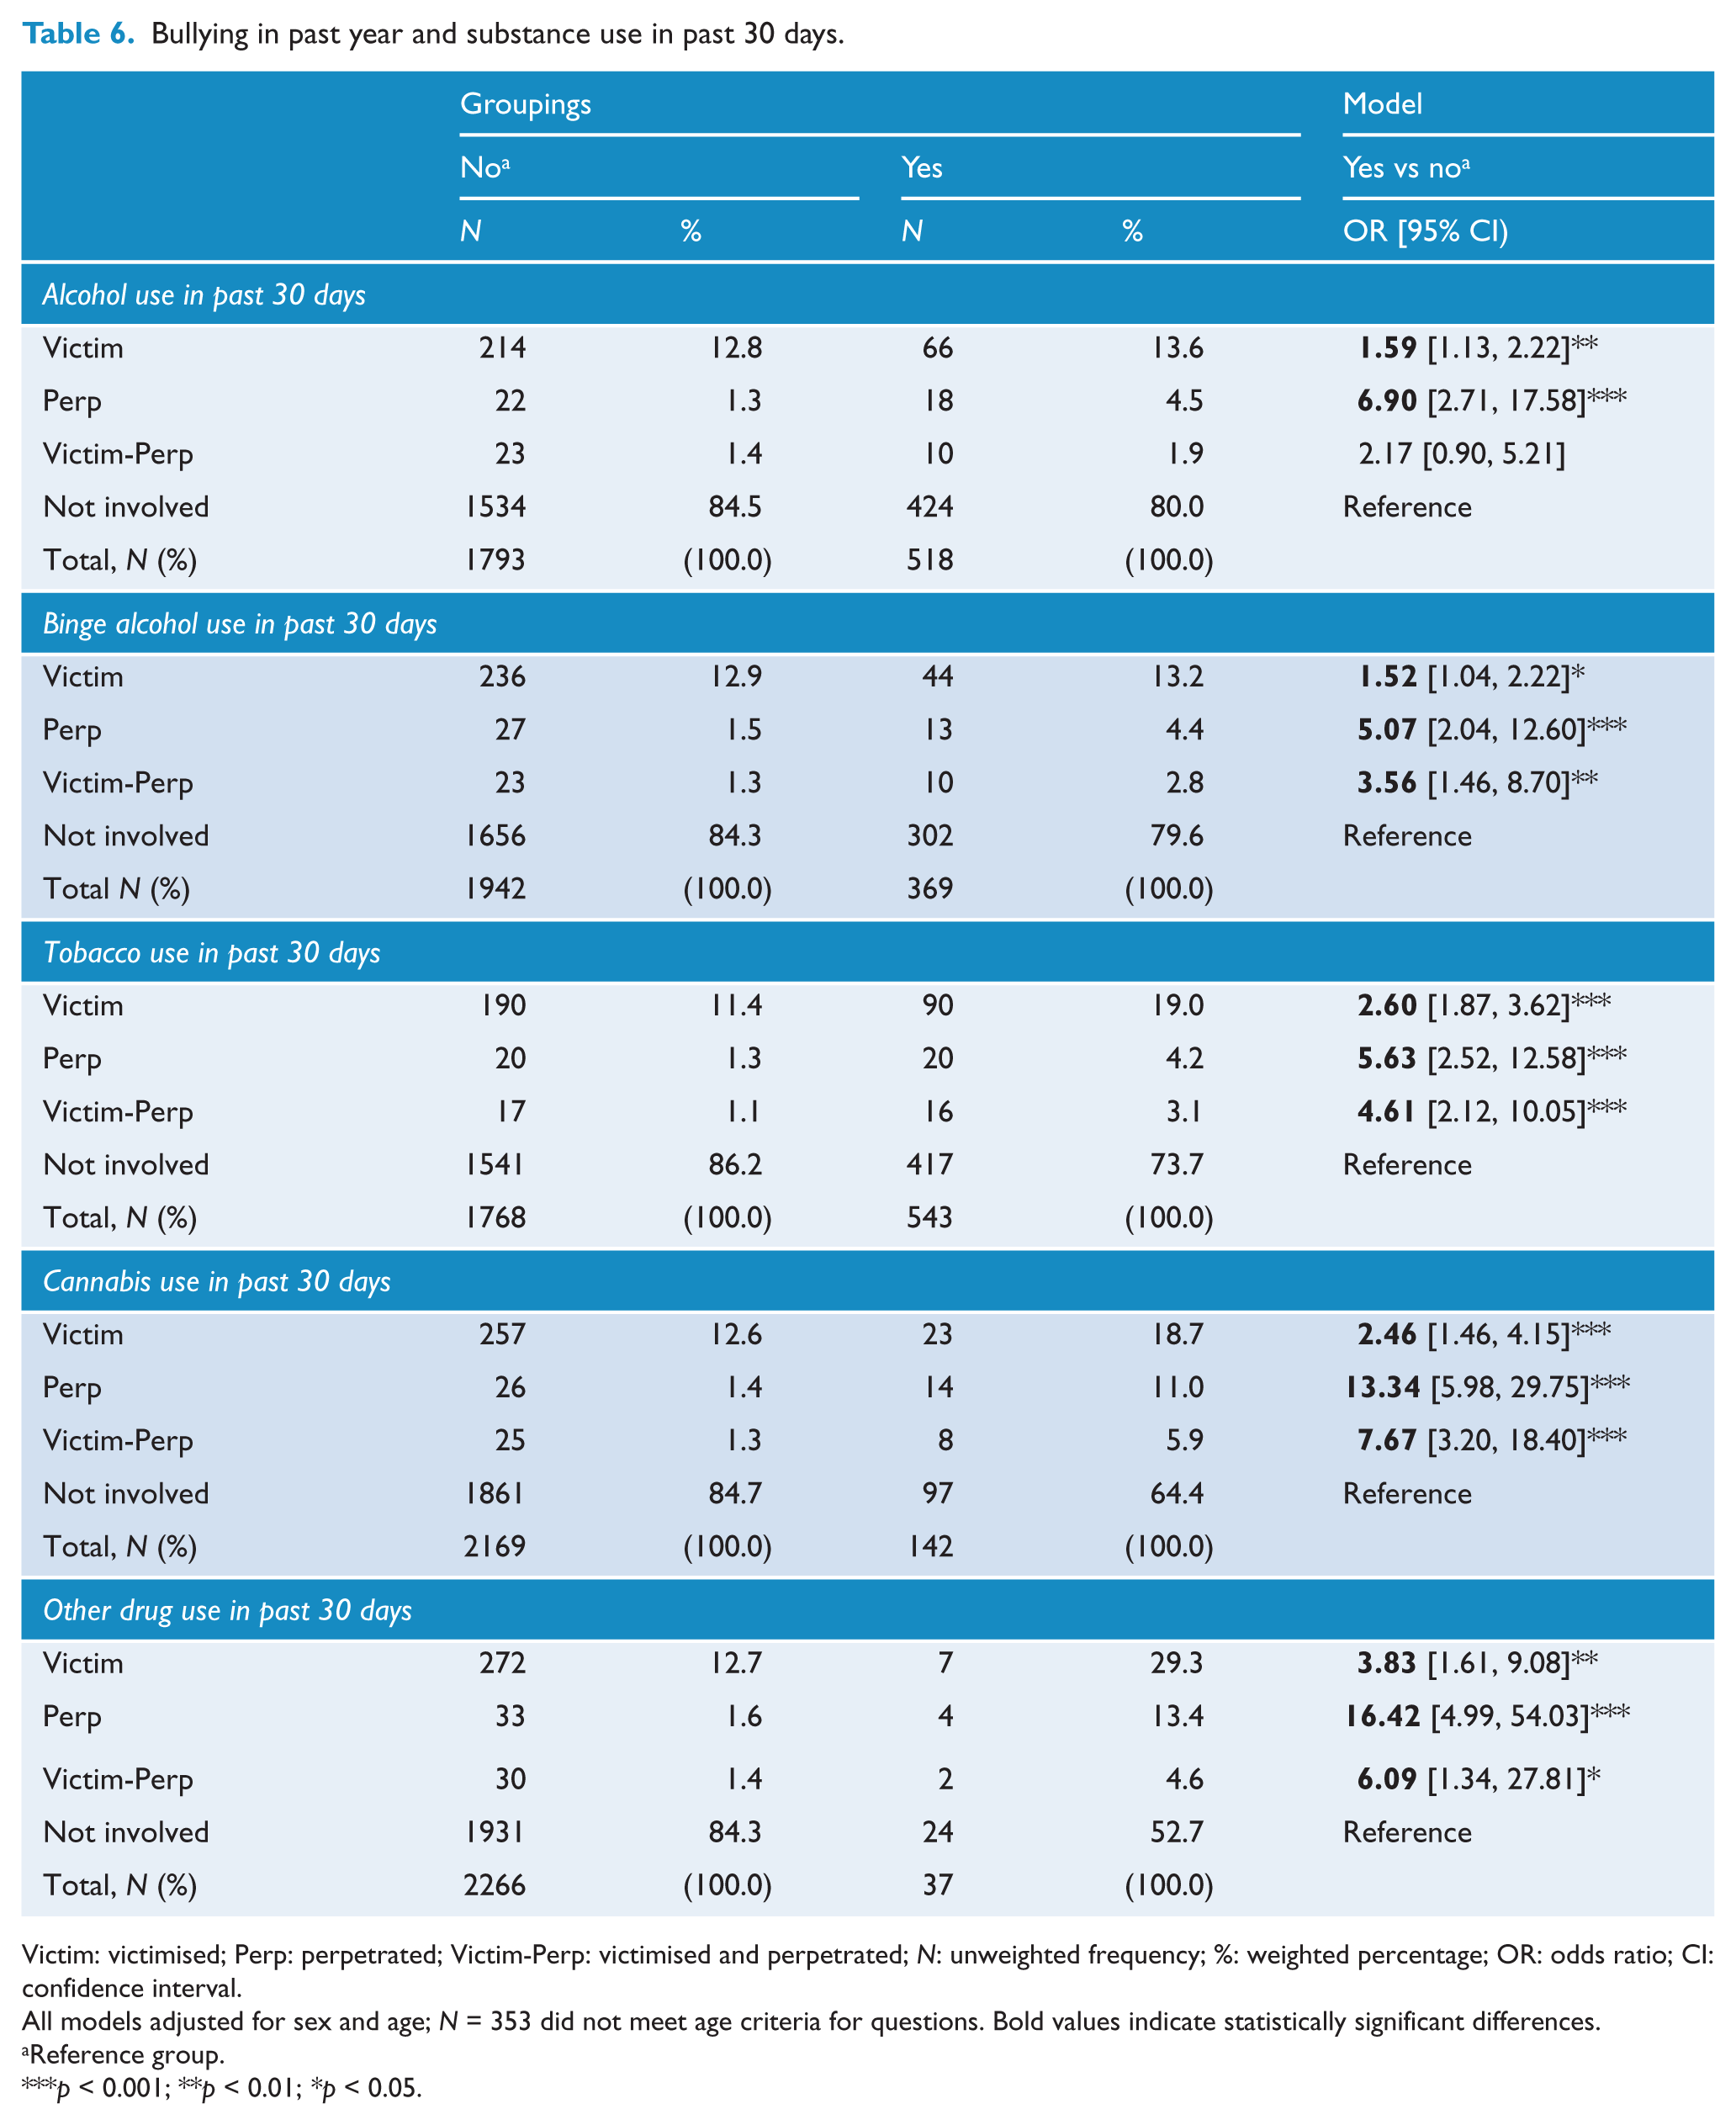
Victim: victimised; Perp: perpetrated; Victim-Perp: victimised and perpetrated; N: unweighted frequency; %: weighted percentage; OR: odds ratio; CI: confidence interval.
All models adjusted for sex and age; N = 353 did not meet age criteria for questions. Bold values indicate statistically significant differences.
Reference group.
p < 0.001; **p < 0.01; *p < 0.05.
Discussion
The prevalence of bullying in this nationally representative sample of Australians aged 11–17 years was 13.3% for victimisation, 1.6% for perpetration and 1.9% for victim-perpetration. These are the first population-based Australian estimates and only the second to report prevalence in a nationally representative sample. Previously, Cross et al. (2009) reported 26.7% of students aged 9–14 years were bullied every few weeks or more, and 8.8% perpetrated bullying every few weeks or more, although the two surveys are not directly comparable. While both studies used randomised probability sampling, the study by Cross et al. (2009) was a school-based survey, whereas this study was a population-based household survey. There were also differences in the timeframe referenced, response options, categorisations and age groups involved. In the current survey, perpetration and victim-perpetration may have been prone to social desirability bias which may have underestimated prevalence (Cornell and Bandyopadhyay, 2010).
This study highlighted the coexistence of traditional and cyber victimisation (27.4%) and that traditional victimisation alone was most common (71.4%) and cyber victimisation alone was rare (1.1%) – a result consistent with a recent meta-analysis (Modecki et al., 2014). As the field moves towards more consistent definition and measurement, more direct comparisons will be possible. This study also found a large majority of victimised youth reported their experiences were sad or upsetting (82.2%), yet over half did not seek help (55.9%). A better understanding of the individual and environmental factors that encourage help-seeking and reporting is strongly needed.
Overall, the current findings are supported by cross-sectional meta-analyses of the international evidence (Hawker and Boulton, 2000). Compared to their uninvolved peers, youth involved in bullying displayed significantly higher levels of psychological distress and emotional and behavioural problems. In addition, youth who experienced victimisation or victim-perpetration had significantly increased odds of meeting the diagnostic criteria for self-reported MDD. All forms of involvement in bullying were also associated with significantly elevated risk of self-harm and attempted suicide in the past year. While victim-perpetration was not associated with alcohol use in the past 30 days, all other relationships examined produced statistically significant associations, indicating a robust positive relationship between all forms of bullying involvement and the use of substances (alcohol, binge levels of alcohol, tobacco, cannabis and other drugs). While victimisation was associated with parent-reported internalising diagnoses (i.e. any anxiety disorder and MDD) and externalising diagnoses (i.e. attention-deficit hyperactivity disorder, oppositional defiant disorder and conduct disorder), victim-perpetration and perpetration were also associated with externalising diagnoses. This study extends previous Australian work by showing that bullying victimisation among youth is strongly correlated with poor mental health status, in terms of self-reported symptomatology as well as cross-informed diagnostic measures (self-report and parent-report).
National prevalence and mental health associations are relevant to cross-national investigations and in conducting meta-analyses related to bullying among children and adolescents (Smith et al., 2016). These results have important implications for public health planning, including the systematic uptake and sustainability of bullying prevention programmes in Australia. It is important for school communities to have a coordinated response to addressing bullying among youth and for families to be involved. Bullying behaviour is not limited to specific types of schools (Shaw and Cross, 2012), which underlines the importance of increased support and implementation of evidence-based intervention programmes in all schools targeting both traditional and cyber behaviour. An Australian randomised control trial of a school-based intervention demonstrated a small but significant effect in reducing cyberbullying at 1-year follow-up (Cross et al., 2016). It is recognised that better integrating programmes within schools and improving the skills of teachers to deliver programmes with high fidelity are critical to improving the efficacy of prevention strategies (Cross et al., 2016). In conjunction with schools, addressing the issue of bullying also requires a coordinated community approach. Effective decision-making by legislators, policy-makers, community agencies, school administrators and families to address this issue relies on the research evidence. The next wave of research should be centred on (a) documenting the protective factors that can assist in reducing the prevalence of bullying and its associated harms, and (b) building evidence for systems intervention in school settings that effectively prevent and address bullying when it occurs.
Limitations
Due to the cross-sectional nature of the study, the causal relationship between bullying and mental health measures cannot be determined. While it is likely to be bi-directional, previous work has shown that bullying victimisation impacts functioning over and above premorbid adjustment problems (Bond et al., 2001). There is general agreement that self-report is a valid indicator of bullying behaviour, although it may be influenced by social desirability bias (Cornell and Bandyopadhyay, 2010). The survey covered a number of mental health topics and where possible aimed to minimise response burden. While desirable, a parallel multi-item bullying perpetration scale could not be included. However, global questions on bullying have adequate psychometric properties and therefore are common in population-based surveys (Solberg and Olweus, 2003). Participant response rate was modest, despite efforts to improve approaches to households and provide incentives for participation. It was similar to the response rate of a previous Australian household survey (Slade et al., 2009a). The sample analytics suggest the cohort is statistically representative of Australian adolescents (Hafekost et al., 2015).
Conclusion
Current population estimates show bullying experiences are present among Australian youth and are associated with mental health problems. This highlights that the implementation of systematic evidence-based interventions at the population level is critically needed. There is also scope for future research to examine strategies for improving the capacities and pathways for young people to seek help for bullying. This evidence can be used in decision-making that concerns the allocation of resources for addressing bullying in the Australian context.
Footnotes
Acknowledgements
The authors wish to thank Roy Morgan Research and the team of interviewers who undertook the fieldwork for the survey, as well as the 6310 families who took part in the survey.
Declaration of Conflicting Interests
The author(s) declared the following potential conflicts of interest with respect to the research, authorship, and/or publication of this article: H.J.T. is supported by a scholarship from the Bryan Foundation and Clear Thinking, Australia. J.P.C. is supported by a National Health and Medical Research Council of Australia Career Development Fellowship (1031909). J.G.S. is supported by a National Health and Medical Research Council Practitioner Fellowship (1105807). S.R.Z. is supported by a Centre of Excellence grant from the Australian Research Council (CE140100027).
Funding
The author(s) disclosed receipt of the following financial support for the research, authorship, and/or publication of this article: The Young Minds Matter Survey was funded by the Australian Government Department of Health.
References
Supplementary Material
Please find the following supplemental material available below.
For Open Access articles published under a Creative Commons License, all supplemental material carries the same license as the article it is associated with.
For non-Open Access articles published, all supplemental material carries a non-exclusive license, and permission requests for re-use of supplemental material or any part of supplemental material shall be sent directly to the copyright owner as specified in the copyright notice associated with the article.