
Abstract
Objectives:
Australian policy-making needs better information on socio-geographical associations with needs for mental health care. We explored two national surveys for information on disparities in rates of mental disorders and psychological distress.
Methods:
Secondary data analysis using the 2011/2012 National Health Survey and 2007 National Survey of Mental Health and Wellbeing. Key data were the Kessler 10 scores in adults in the National Health Survey (n = 12,332) and the National Survey of Mental Health and Wellbeing (n = 6558) and interview-assessed disorder rates in the National Survey of Mental Health and Wellbeing. Estimation of prevalence of distress and disorders for sub-populations defined by geographic and socioeconomic status of area was followed by investigation of area effects adjusting for age and gender.
Results:
Overall, approximately one person in 10 reported recent psychological distress at high/very-high level, this finding varying more than twofold depending on socioeconomic status of area with 16.1%, 13.3%, 12.0%, 8.4% and 6.9% affected in the most to least disadvantaged quintiles, respectively, across Australia in 2011/2012. In the most disadvantaged quintile, the percentage (24.4%) with mental disorders was 50% higher than that in the least disadvantaged quintile (16.9%) in 2007, so this trend was less strong than for Kessler10 distress.
Conclusion:
These results suggest that disparities in mental health status in Australia based on socioeconomic characteristics of area are substantial and persisting. Whether considering 1-year mental disorders or 30-day psychological distress, these occur more commonly in areas with socioeconomic disadvantage. The association is stronger for Kessler10 scores suggesting that Kessler10 scores behaved more like a complex composite indicator of the presence of mental and subthreshold disorders, inadequate treatment and other responses to stressors linked to socioeconomic disadvantage. To reduce the observed disparities, what might be characterised as a ‘Whole of Government’ approach is needed, addressing elements of socioeconomic disadvantage and the demonstrable and significant inequities in treatment provision.
Introduction
The need for area specific information and recent national surveys
There is now Australian information on population and sub-population prevalence levels for mental disorders and associated needs for care (Burgess et al., 2002; Butterworth et al., 2006, 2011; Henderson et al., 2000; Kiely and Butterworth, 2013; Meadows and Burgess, 2009; Meadows et al., 2002; Slade et al., 2009). The findings, though, are from surveys that were not designed to reveal disparities in need considered by areas of residence; yet such information is important for service planners who need to consider location and concentration of mental health services. Individual survey power for such comparisons may, accordingly, be surprisingly limited (Meadows et al., 2002). To decide where to locate and concentrate services, planners need information on how socio-demographic disparities in mental healthcare needs of individuals or households (Butterworth et al., 2011; Kiely and Butterworth, 2013; Lawrence et al., 2013; MacKinnon et al., 2004; Roy and Schurer, 2013; Taylor et al., 2004) collectively have impact on variability of indicators of need for mental health care as associated with, for instance, socioeconomic features of area and degree of remoteness. Such information may be important whether the scope of that planning is primary mental health care, regional, state or national levels. Hence, our understandings may be advanced by examining multiple available recent national surveys.
The two National Surveys of Mental Health and Wellbeing (NSMHWB) have provided our best information so far about Australia-wide prevalence of mental disorders, demographic and socioeconomic status associations (Henderson et al., 2000; Slade et al., 2009). Another more recent national data set, approximately twice as large as either NSMHWB and with a higher response rate, was the 2011/2012 National Health Survey (NHS). While this did not assess mental disorders with the level of detail used in the NSMHWB surveys, it did include a measure of ‘psychological distress’, the Kessler 10 (K10) (Kessler et al., 2002; Slade et al., 2011).
Instrumentation: the NSMHWB programme and the NHS
The 2007 NSMHWB incorporated structured and comprehensive instrumentation to diagnose selected lifetime and 12-month mental disorders based on symptom recall, with modules adapted from the World Health Organization (WHO) Composite International Diagnostic Interview version 3.0 (CIDI 3.0) (Wittchen, 1994). The CIDI, as developed by the WHO through several versions, has been widely used internationally and the CIDI 3.0 has been the mainstay instrument of the World Mental Health Survey Programme (Kessler and Ustun, 2004). A 2007 NSMHWB CIDI 3.0 interview component ascertaining lifetime prevalence and an estimate of 1-year prevalence, took typically over 60 minutes.
In contrast to the CIDI, the K10 was developed as a brief instrument and is a 10-item Likert scale that asks about symptoms in the previous 30 days. The K10 has been included in several Australian national surveys, including the 2011/2012 NHS and the two major mental health surveys (NSMHWB 1997 and 2007). It has entered into common use by Australian General Practitioners and other clinicians as a continuous measure both to identify and to monitor mental health issues. While the K10 is commonly characterised as measuring a construct of ‘psychological distress’ experienced by a person, and does not generate diagnostic classifications, for the purpose of considering the analyses carried out here, we should consider how this construct of psychological distress is made up. Psychological distress as measured by the K10 has features of common diagnostic pictures, including important symptoms of Affective Disorders (text including ‘feeling depressed’, ‘worthless’, ‘hopeless’ or ‘so sad that nothing could cheer you up’) and other content that often may relate to Anxiety Disorders (feeling ‘nervous’, ‘restless or fidgety’ at varying levels).
Relationship between psychological distress and diagnosis
The K10 has established associations of increasing score levels with increased prevalence of mental disorders (Slade et al., 2011). In the 2007 NSMHWB and across Australia, 79.6% of people with a K10 score in the very-high distress range (scores of 30 and above) had a 12-month CIDI-assessed mental disorder; only 10.9% of those in the low category (scores of 15 or less) had such a disorder (Slade et al., 2011). So, while in diagnostic terms elevated K10 scores are associated with higher current rates of Anxiety and Affective Disorders, it certainly does not perform ideally as a screening test for such disorders. Where a mental disorder within the last year has been detected and effectively treated, we might expect that K10 scores will reduce from the higher ranges while inadequate treatment of an established disorder may be associated with persistent symptoms apparent as elevated K10 scores. Other conditions not assessed in the NSMHWB such as adjustment disorders may also give rise to elevated levels. Hence, the relationship between K10 scores, social and environmental conditions and stressors, subthreshold disorders, recent prevalence of mental disorders and symptoms, and provision of effective treatment may be complex. Nevertheless, the design and availability of the K10 in both the NHS and the NSMHWB may provide an important opportunity to better inform planning for mental healthcare services. We note here that interpretation of the K10 for those aged over 65 years needs special consideration (Trollor et al., 2007), so this work constrains its focus to working-aged adults aged 18–64 years.
Aim
To explore existing national survey data for information on disparities in rates of disorders and distress, examining three hypotheses:
That we will find increased rates of mental disorders and of K10 rates associated with increased socioeconomic disadvantage of area.
While acknowledging potential complexity in the relationship between K10 scores and 1-year diagnosis, we expect reasonably consistent relationships between characteristics of area, elevated K10 scores and 1-year diagnosis;
Based on previous literature (Meadows et al., 2002), we anticipate reasonable stability of disorder rates and elevated K10 scores as associated with section-of-state classification.
Methods
Design
Secondary data analysis using the 2011/2012 NHS and the 2007 NSMHWB.
National surveys
Data were collected for each survey by trained interviewers from the Australian Bureau of Statistics (ABS). The 2011/2012 NHS involved a sample of 20,426 Australians; the K10 was applied with n = 15,381 of which n = 12,332 were aged 18–64 years. The response rate was 84.8%. The 2007 NSMHWB involved a sample of n = 8841, with n = 6557 having a K10 score and aged 18–64 years. Diagnosis of mental disorders from the CIDI 3.0 interview was available in n = 6558 people aged 18–64 years. Overall survey response rate was 60%.
As comprehensively described elsewhere, sampling strategies for each survey were designed to provide representative estimates for Australia and some sub-populations including State/Territory, urban (major and other urban)/non-urban, and major cities/inner regional/other (ABS, 2013a, 2013b; Slade et al., 2009). Derived estimates from either survey are not applicable for those living in very-remote areas of Australia or living in non-private dwellings because these were out of scope of both surveys.
Measures: CIDI and K10
The 2007 NSMHWB survey incorporated sections from the CIDI 3.0 (Wittchen, 1994) providing assessment of mental disorders based on the definitions and criteria of the Diagnostic and Statistical Manual of Mental Disorders, Fourth Edition (DSM-IV) and the WHO International Classification of Diseases, 10th Revision (ICD-10). We examined all individuals who were assessed as having one of these common disorders: anxiety, affective and substance use disorders.
The K10, a self-administered 10-item Likert format scale, measures current psychological distress, particularly symptoms of anxiety and depression (ABS, 2009; Slade et al., 2011). Used in ordinal form, band scores are known to be associated with increasing prevalence of mental disorders. K10 scores ranged between 10 and 50, and we used score bands of low (10–15), moderate (16–21), high (22–29) and very-high (30–50). We created a combined high/very-high category, which consisted of scores 22 and higher.
Geographical and socioeconomic index of areas variables
The broad geographic classification examined was the ‘Section-of-State’ with categories of Major Urban, Other Urban and Other (ABS, 2011, 2013a).
The Index of Relative Socioeconomic Disadvantage (IRSD) for areas was examined. As one of the Socioeconomic Indicators for Areas (SEIFA) produced by the ABS, it is a composite index based on census information regarding socioeconomic factors and resources within an area, including weighted contributions from income, education, employment, type of housing and other variables. The 2006 IRSD was used with the 2007 NSMHWB and the 2011 IRSD with the 2011/2012 NHS (Pink, 2011). Both IRSDs were mapped to the smallest statistical area in the relevant census: census collection districts in 2006 and census statistical area levels in 2011. The IRSD definition did not change between 2006 and 2011, so comparisons between estimates based on both surveys are possible (ABS, 2013a). IRSD data were provided as deciles in the survey Confidentialised Unit Record Files (CURFs) provided by the ABS; however, we used IRSD quintiles in analyses because cell counts within deciles were sometimes small (e.g. the count in the very-high K10 band in the top decile was only 17). Quintiles provided adequate cell counts (>60), also making results of this work directly comparable with other research (Slade et al., 2011).
Statistical analyses
We calculated national representative estimates using data from adults aged 18–64 years in each survey. For regressions using IRSD as a predictor, the least disadvantaged (fifth) quintile was the reference category. For regressions using section-of-state, the reference category was ‘major urban’. All regressions adjusted for sex and age group (years) using age categories: 18–24, 25–34, 35–44, 45–54 and 55–64 years. Replicate weighting variables in the ABS-provided CURFs, used throughout, provided for accurate estimation of statistics including calculation of design error. Analyses used Stata version 11.0 (StataCorp LP, College Station, TX) with the survey CURFs. The ABS Remote Access Data Laboratory (RADL) system was used as necessary (ABS, 2013b).
Level of psychological distress in the previous 30 days was determined by K10 band scores in each survey. We reported national representative percentages of people with very-high and high/very-high distress in the previous 30 days, subsequently stratified by sex, age group, section-of-state and IRSD quintile.
We used logistic regressions to adjust for age group and sex to determine odds ratios (ORs) for high/very-high distress by investigating two area-based variables: IRSD quintile and section-of-state. This was done twice, once for each survey, since K10 and location data were available in both surveys. We again used logistic regressions to determine the OR for having a mental disorder (anxiety, affective and substance use disorders) but this time only using the NSMHWB since the NHS did not contain these data. The area-based variables of IRSD quintile and section-of-state were examined for associations with mental disorders after adjusting for age and sex. To shed light on the consistency or otherwise of the association between CIDI diagnosis and K10 scores, in the 2007 NSMHWB, we also examined the frequency of K10 high/very-high distress among those with and without a CIDI-diagnosed mental disorder in the last year.
Logistic regressions were used to compare differences in the ORs of distress and the ORs of mental disorder. Standard statistical tests on the logarithms of the ORs using the sum of the variances of the logarithms of the ORs as the variance of the difference in logarithms of the ORs were used to determine significant differences.
Information on socioeconomic and demographic factors was also examined, in particular for any relationships with K10 scores. These included weighted contributions from age, income, education, employment, type of housing and main language spoken at home. This used the 2011/2012 NHS only as it was the more recent survey. Gender-specific information was reported as gender is a known covariate of many of these variables.
Ethics approval
Monash University Human Research Ethics Committee granted an exemption from ethics review because the non-identifiable data satisfied the National Statement on Ethical Conduct in Human Research.
Results
In advantaged regions totalling to one-fifth of Australia with the least disadvantage (IRSD quintile 5), the prevalence of psychological distress in past month and 1-year mental disorders were significantly lower than more disadvantaged areas (IRSD quintiles 3, 2 or 1; see Table 1). The difference for mental disorders followed a gradual downward pattern between the most disadvantaged quintile to the fourth quintile (i.e. from quintiles 1 to 4, there was slightly decreasing prevalence of mental disorders) and then steeply dropped in prevalence at the least disadvantaged quintile (quintile 5). For distress, there was more evidence of a steadily progressive gradient, with decreasing prevalence of distress from most to least disadvantaged area quintiles. Percentages of very-high distress and combined high/very-high distress appeared similar in both surveys – combined high/very-high distress prevalence was 10.0% (95% CI = [9.3, 11.2]) in 2007 and 11.1% (95% CI = [10.5, 11.8]) in 2011–2012.
Prevalence of psychological distress and disorder across Australia.
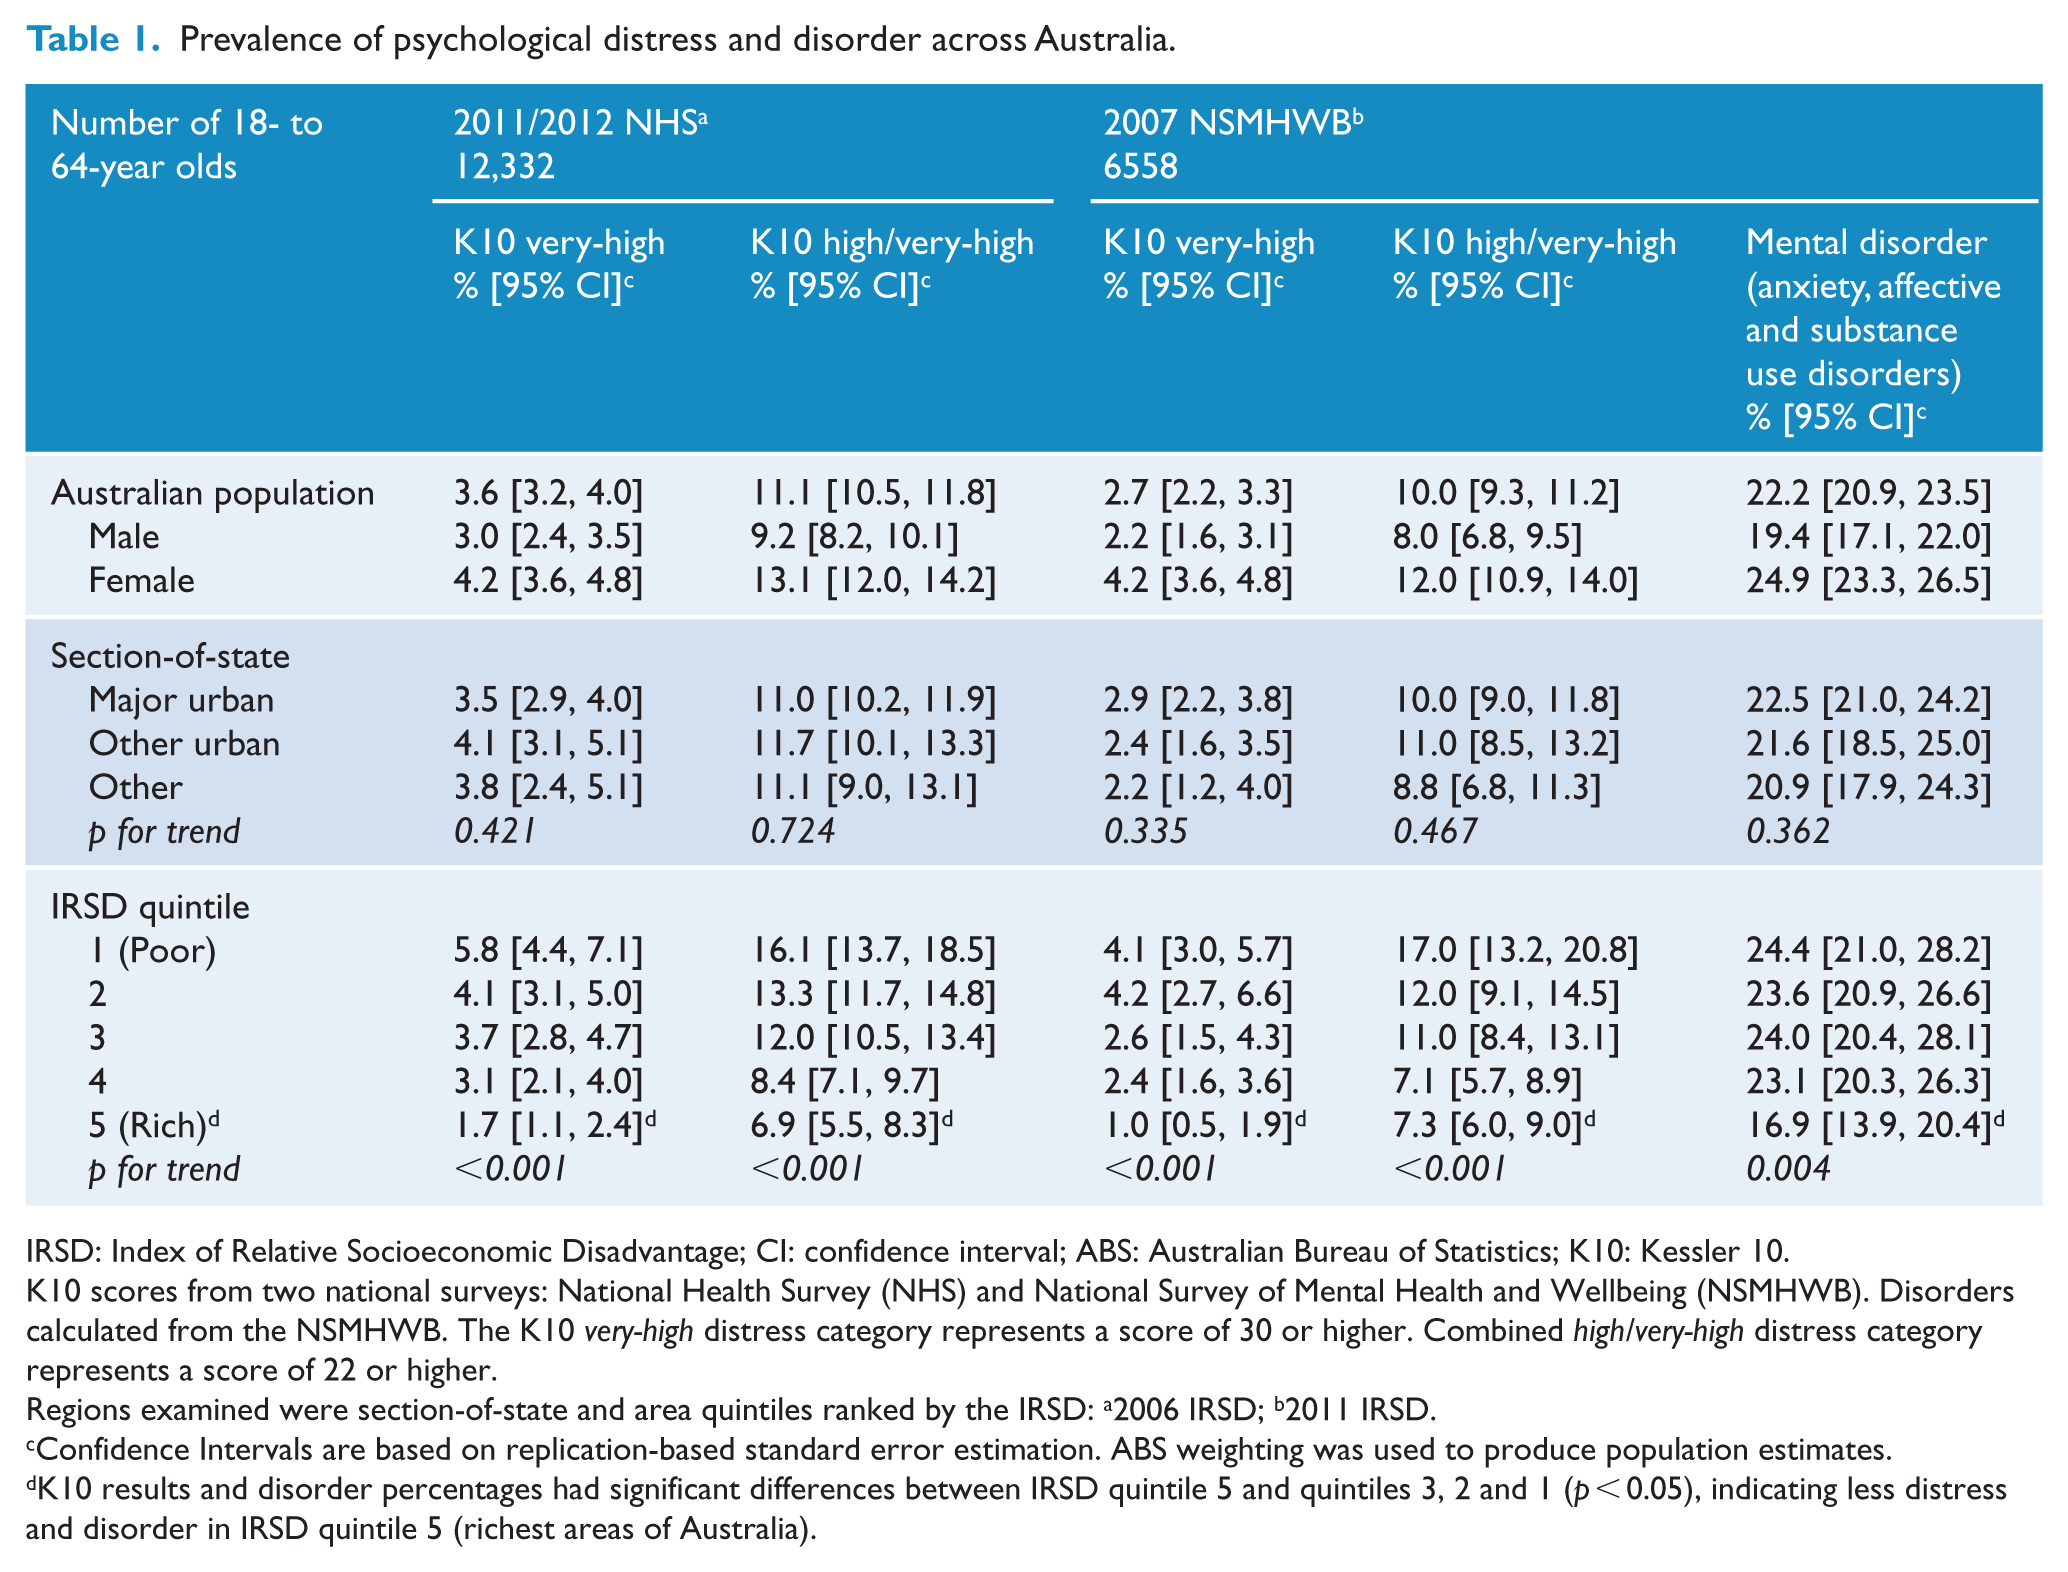
IRSD: Index of Relative Socioeconomic Disadvantage; CI: confidence interval; ABS: Australian Bureau of Statistics; K10: Kessler 10.
K10 scores from two national surveys: National Health Survey (NHS) and National Survey of Mental Health and Wellbeing (NSMHWB). Disorders calculated from the NSMHWB. The K10 very-high distress category represents a score of 30 or higher. Combined high/very-high distress category represents a score of 22 or higher.
Regions examined were section-of-state and area quintiles ranked by the IRSD: a2006 IRSD; b2011 IRSD.
Confidence Intervals are based on replication-based standard error estimation. ABS weighting was used to produce population estimates.
K10 results and disorder percentages had significant differences between IRSD quintile 5 and quintiles 3, 2 and 1 (p < 0.05), indicating less distress and disorder in IRSD quintile 5 (richest areas of Australia).
Viewing section-of-state geographical information in Table 1, we see the sub-population percentage reporting high/very-high distress levels in either survey did not differ across the broad geographical regions, remaining around 10–11% throughout Australia. Mental disorder percentages also did not substantially change, ranging between 20.9% and 22.5%.
The differential relationship between distress and regions is shown in Table 2. Compared to the least disadvantaged (richest) IRSD areas, in the most disadvantaged (poorest) areas, the relative odds of having high/very-high K10 distress in past month was 2.6 (95% CI = [1.9, 3.6]) in 2011/2012 and similar at 2.5 (95% CI = [1.8, 3.6]) in 2007.
High psychological distress and mental disorder and relationships with Australian regions.
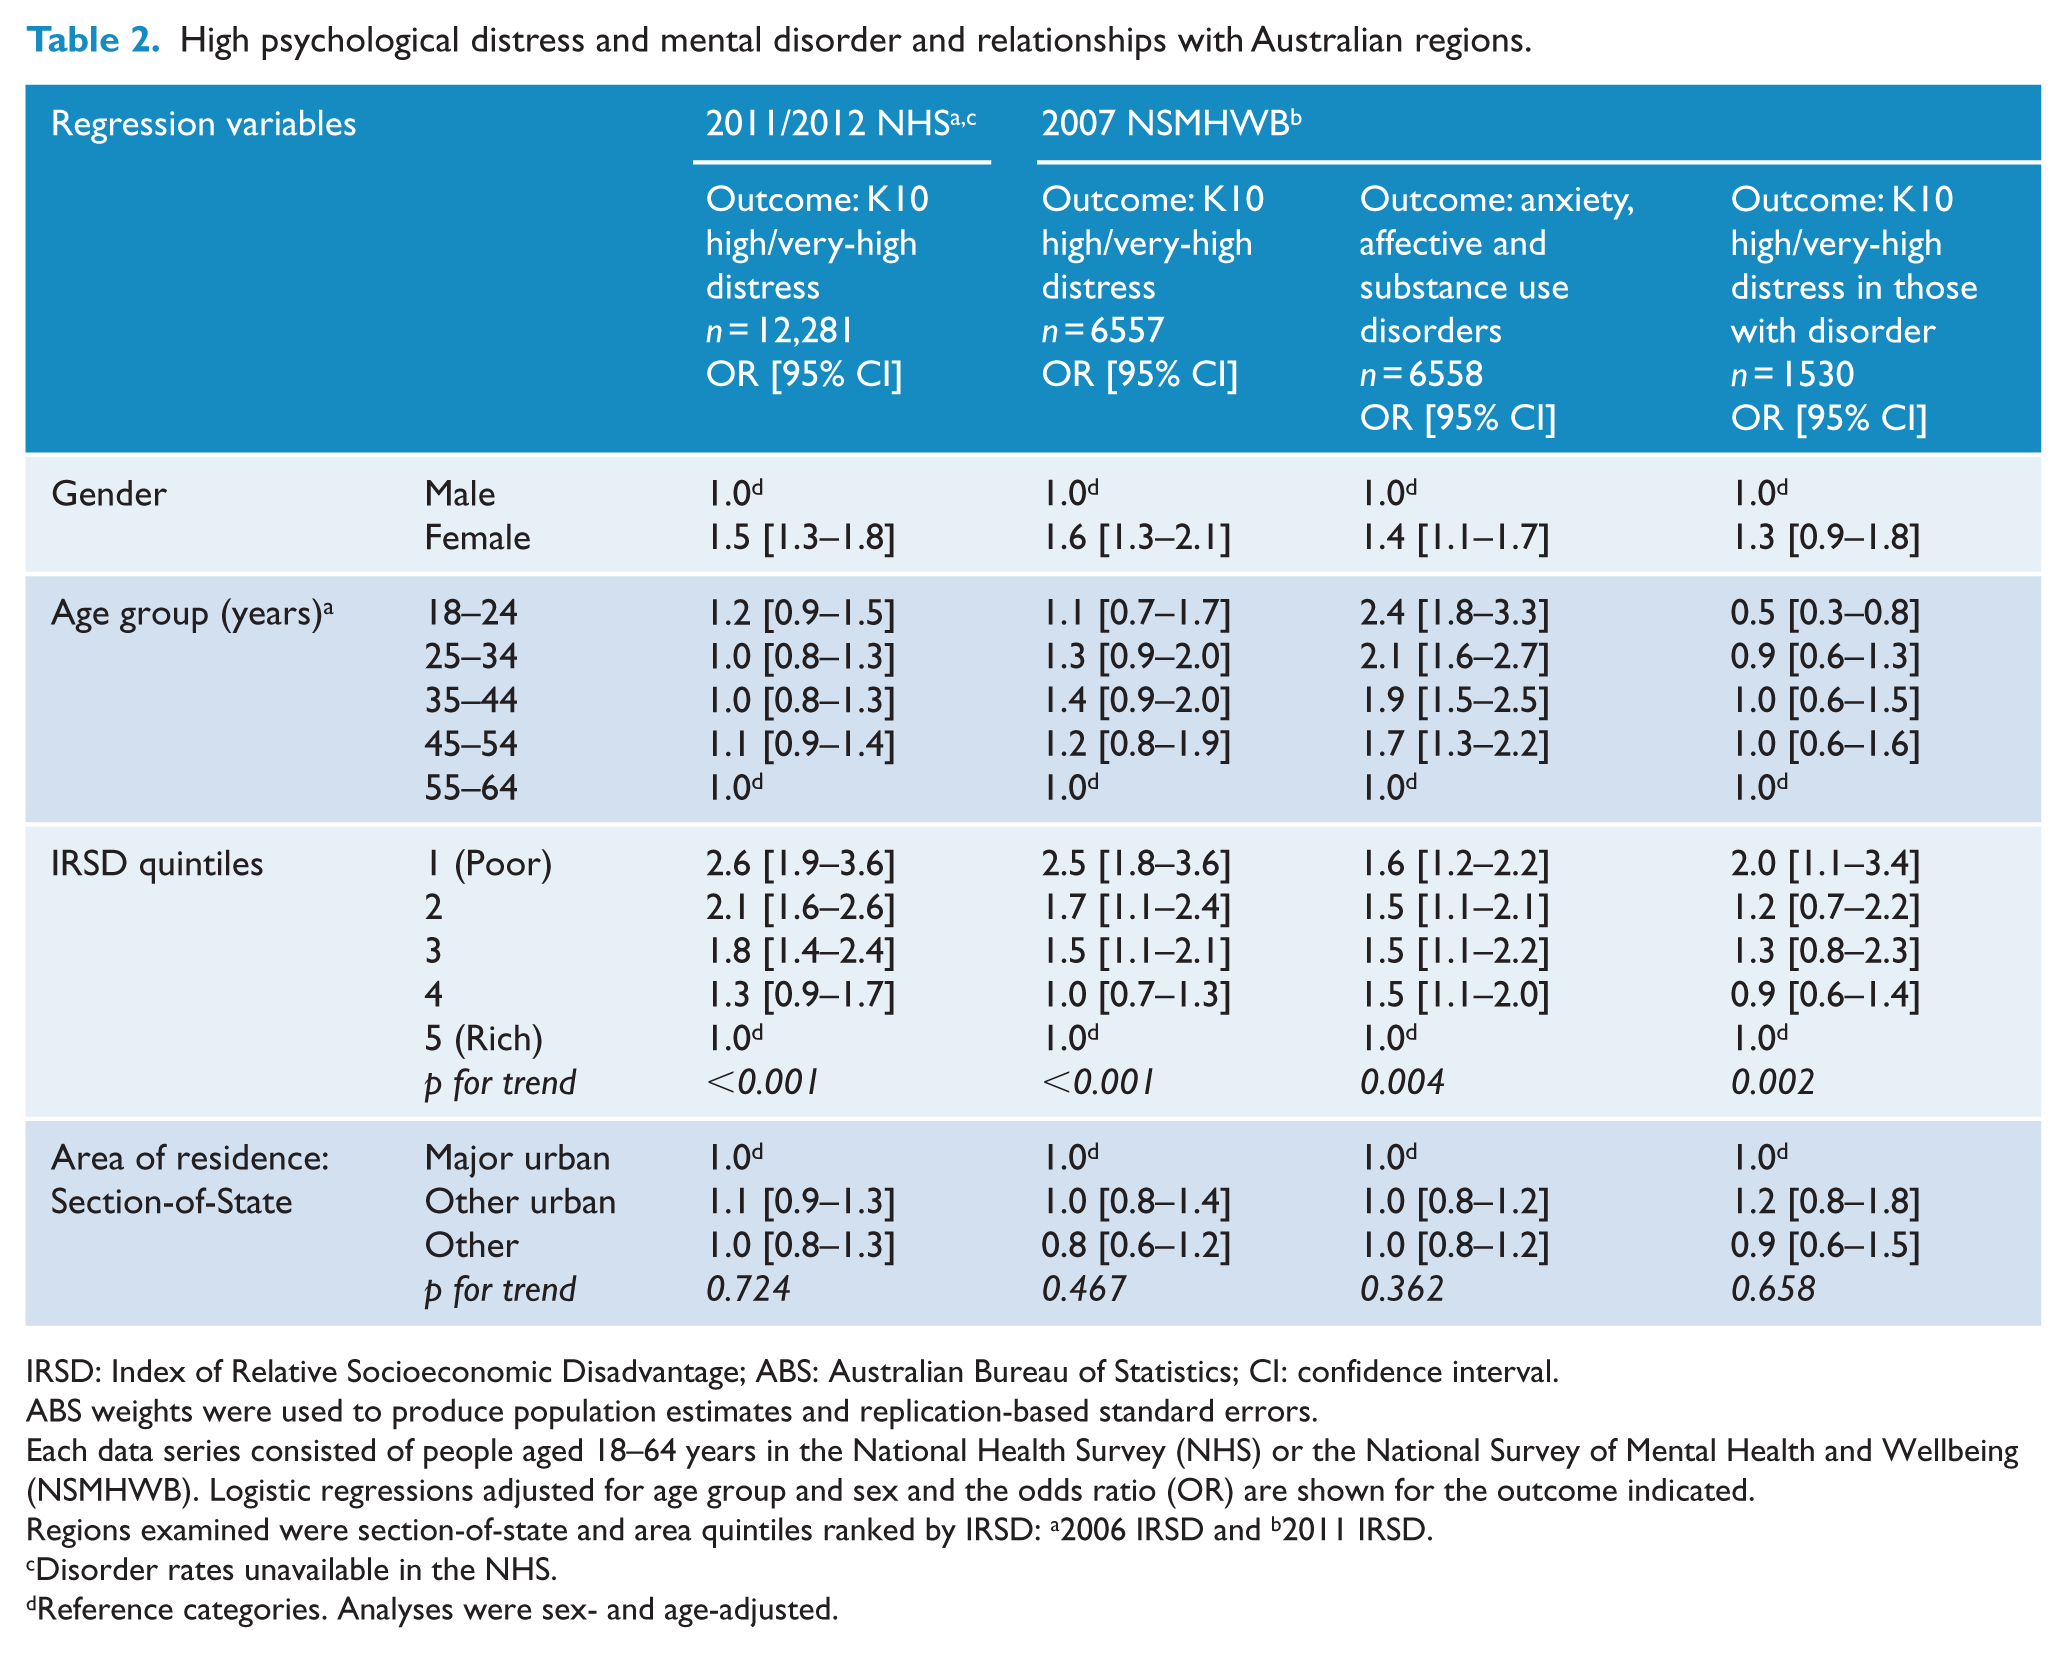
IRSD: Index of Relative Socioeconomic Disadvantage; ABS: Australian Bureau of Statistics; CI: confidence interval.
ABS weights were used to produce population estimates and replication-based standard errors.
Each data series consisted of people aged 18–64 years in the National Health Survey (NHS) or the National Survey of Mental Health and Wellbeing (NSMHWB). Logistic regressions adjusted for age group and sex and the odds ratio (OR) are shown for the outcome indicated.
Regions examined were section-of-state and area quintiles ranked by IRSD: a2006 IRSD and b2011 IRSD.
Disorder rates unavailable in the NHS.
Reference categories. Analyses were sex- and age-adjusted.
The CIDI disorder rates showed a gradient for socioeconomic disadvantage of areas (p for trend 0.004), as did K10 distress rates which had a marked gradient for socioeconomic disadvantage that was steeper than the disorder gradient (p for trend <0.001; see Table 2). For example, compared to the least disadvantaged (richest) IRSD areas, the most disadvantaged (poorest) areas had a relative odds for a CIDI mental disorder at 1.6 (95% CI = [1.2, 2.2]), whereas for high/very-high K10 distress was greater at 2.5 (95% CI = [1.8, 3.6]) in 2007.
A supplementary analysis further explored the association of 1-year mental disorder in the 2007 NSMHW and K10 band-score rates. IRSD-specific quintile rates for high/very-high K10 among those with a 1-year CIDI mental disorder were, from IRSD most disadvantaged to least, 41.9% [95% CI = 33.3–51.0%], 30.4% [22.7–39.3%], 32.1% [25.2–39.9%], 23.6% [19.1–28.7%] and 25.3% [19.7–32.9%]. Considering the rate among those without a 1-year mental disorder, the results here again from most to least disadvantaged were 8.5% [5.3–13.4%], 5.7% [4.1–7.9%], 3.7% [2.6–5.1%], 2.1% [1.5–3.1%] and 3.6% [2.6–4.9%]. Based on the conservative significance criterion of non-overlapping confidence intervals, several of these comparisons are statistically significant. Table 2 also shows that compared to the least disadvantaged (richest) IRSD areas, the most disadvantaged (poorest) areas had a relative odds for high/very-high distress at 2.0 (95% CI = [1.1, 3.4]).
Age-adjusted relative odds of high/very-high K10 distress by individual socio-demographic variables are shown in Table 3. After adjusting for age, the relative odds of high/very-high distress in the most disadvantaged quintile compared to the least disadvantaged were 2.3 for males and 2.8 for females. Key variables influencing the distress outcome were gender, age, employment status, IRSD quintile, education and income. Additional multivariate analyses are shown in a Supplementary file and demonstrated that even after taking account of gender, age, employment status, education and income, there still appeared to be an attenuated yet significant spatial difference associated with IRSD quintile.
Separate analyses for each gender showing age-adjusted relative odds of high/very-high K10 psychological distress by socioeconomic variables.
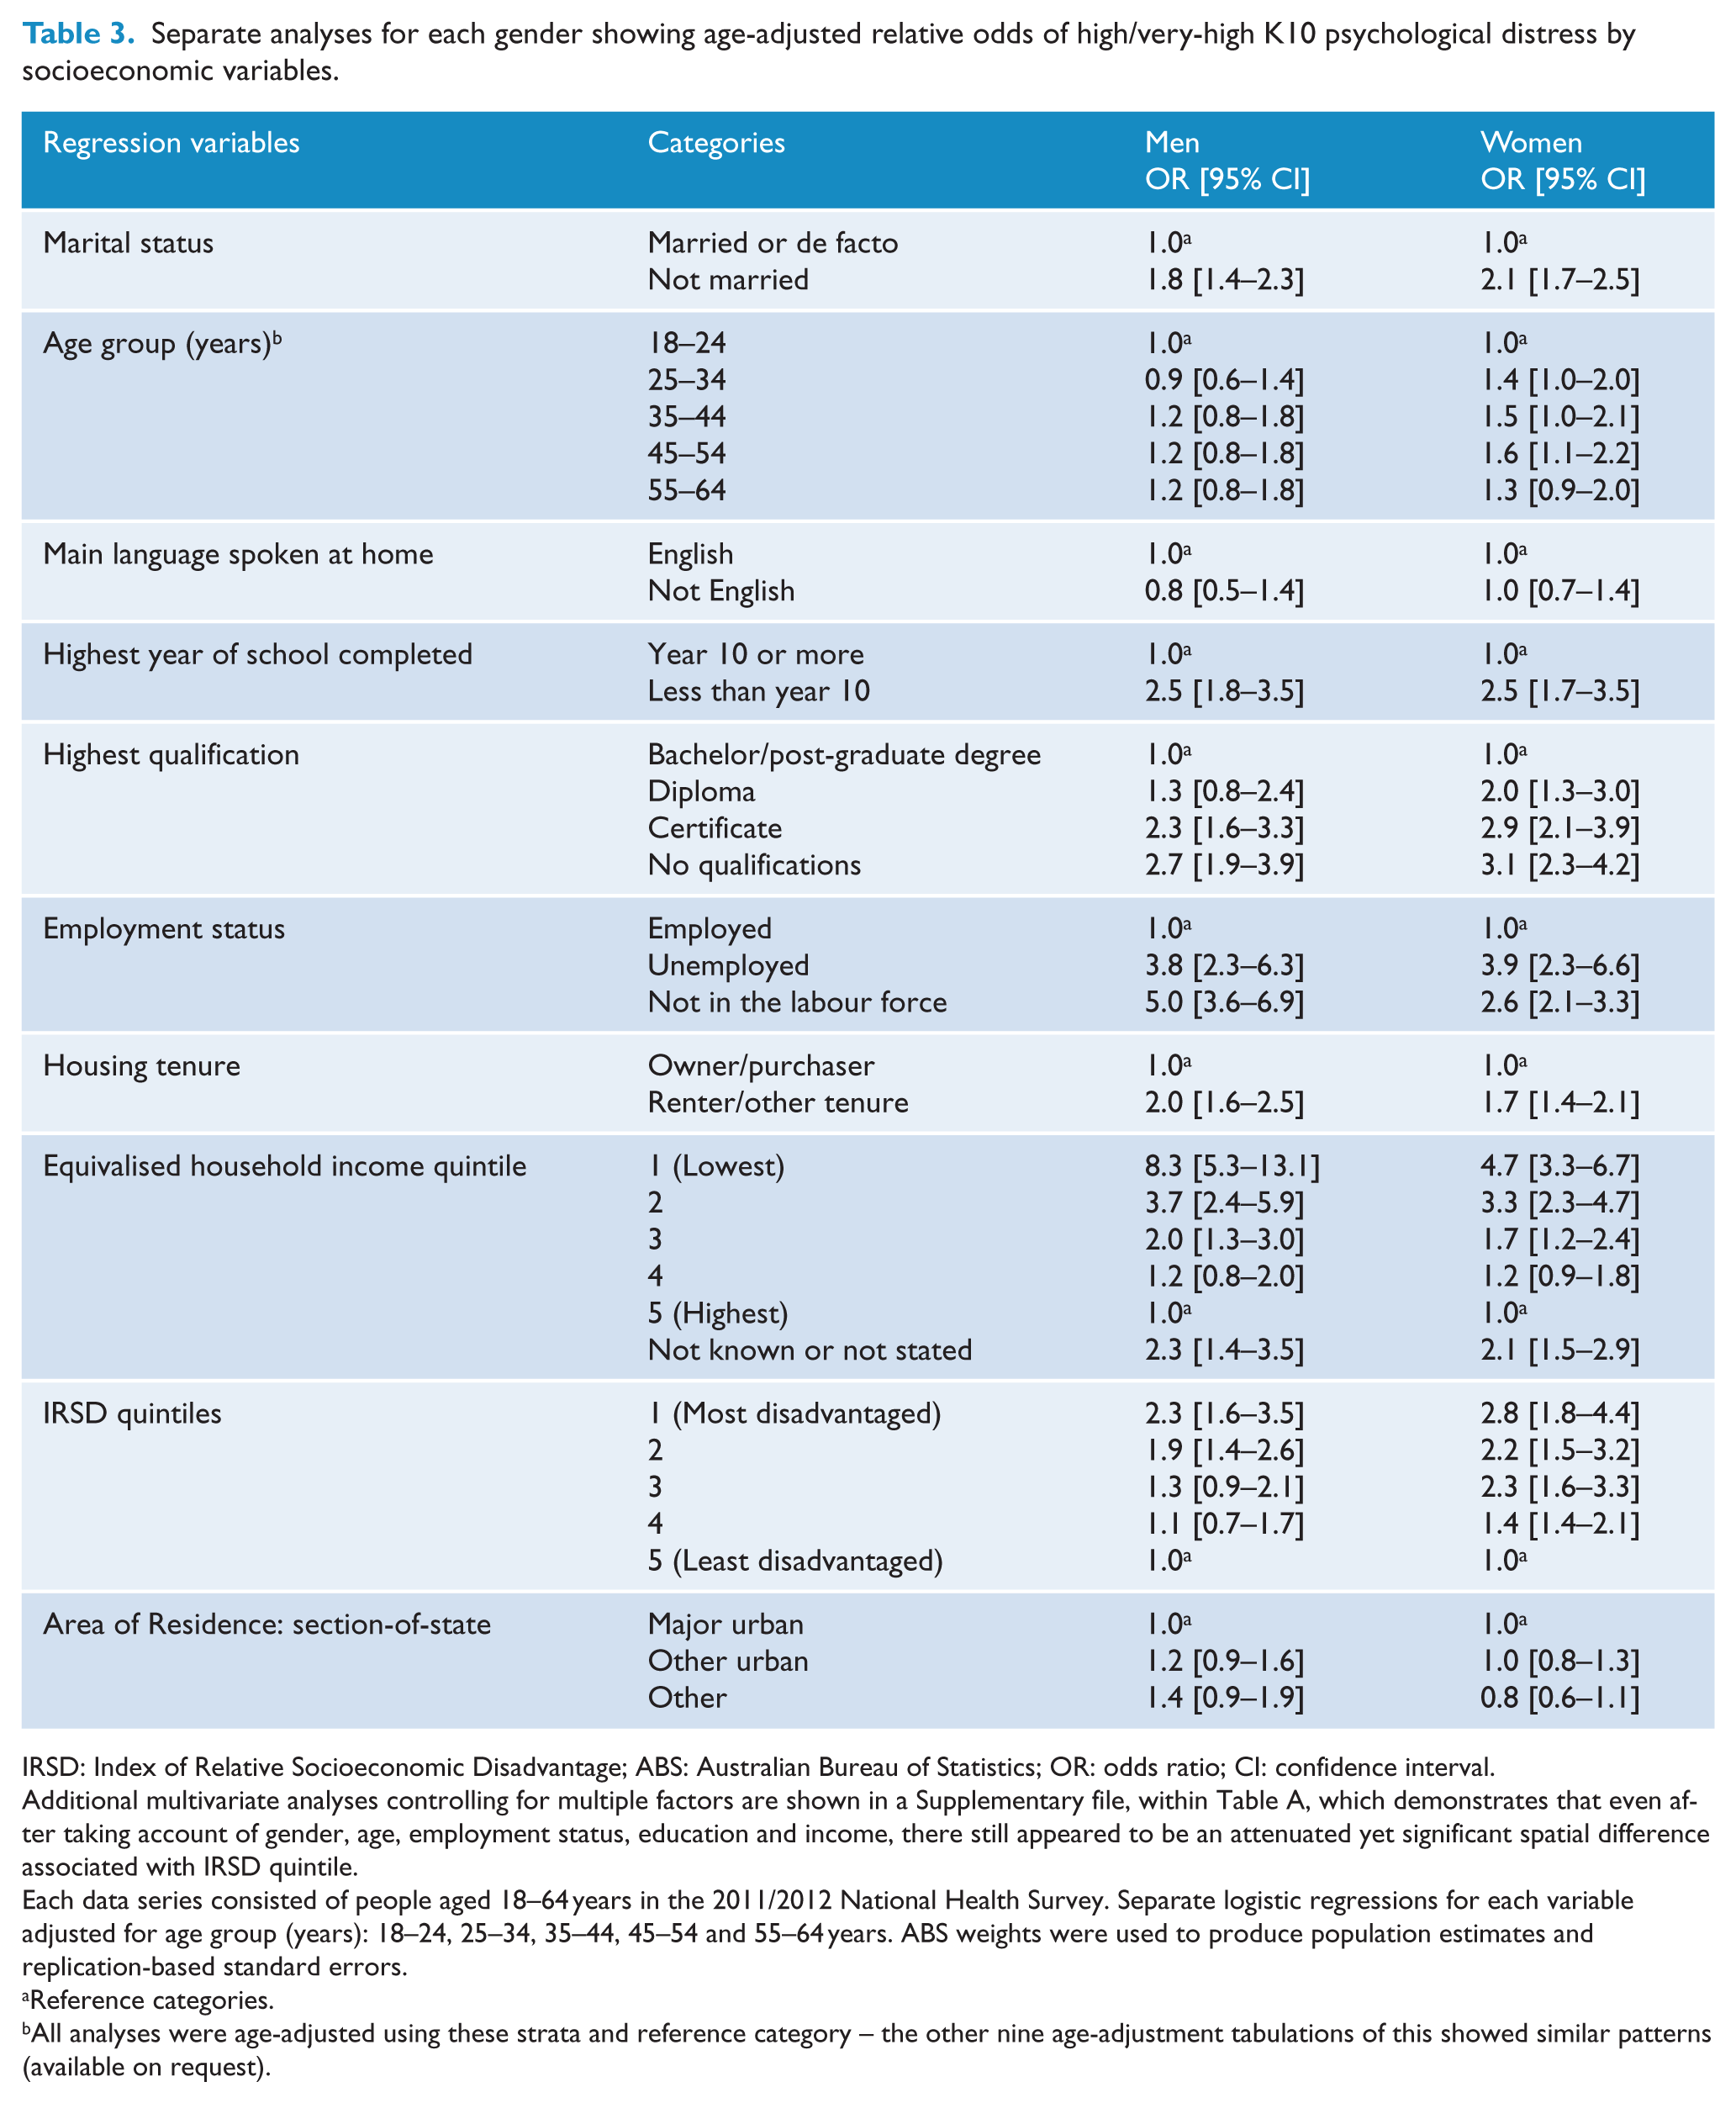
IRSD: Index of Relative Socioeconomic Disadvantage; ABS: Australian Bureau of Statistics; OR: odds ratio; CI: confidence interval.
Additional multivariate analyses controlling for multiple factors are shown in a Supplementary file, within Table A, which demonstrates that even after taking account of gender, age, employment status, education and income, there still appeared to be an attenuated yet significant spatial difference associated with IRSD quintile.
Each data series consisted of people aged 18–64 years in the 2011/2012 National Health Survey. Separate logistic regressions for each variable adjusted for age group (years): 18–24, 25–34, 35–44, 45–54 and 55–64 years. ABS weights were used to produce population estimates and replication-based standard errors.
Reference categories.
All analyses were age-adjusted using these strata and reference category – the other nine age-adjustment tabulations of this showed similar patterns (available on request).
The percentages of K10 distress in each gender are shown in Table 1 and Figure 1. Females reported significantly higher distress scores than males; in females, the high/very-high distress band included 13.1% of the population, significantly higher than among males (9.2%). Effects of age on distress for each gender are shown in Figure 1: in all age groups, females reported more distress than males. The percentage of the population reporting very-high distress levels hovered mostly around 3–4% with overlapping confidence intervals regardless of age group.
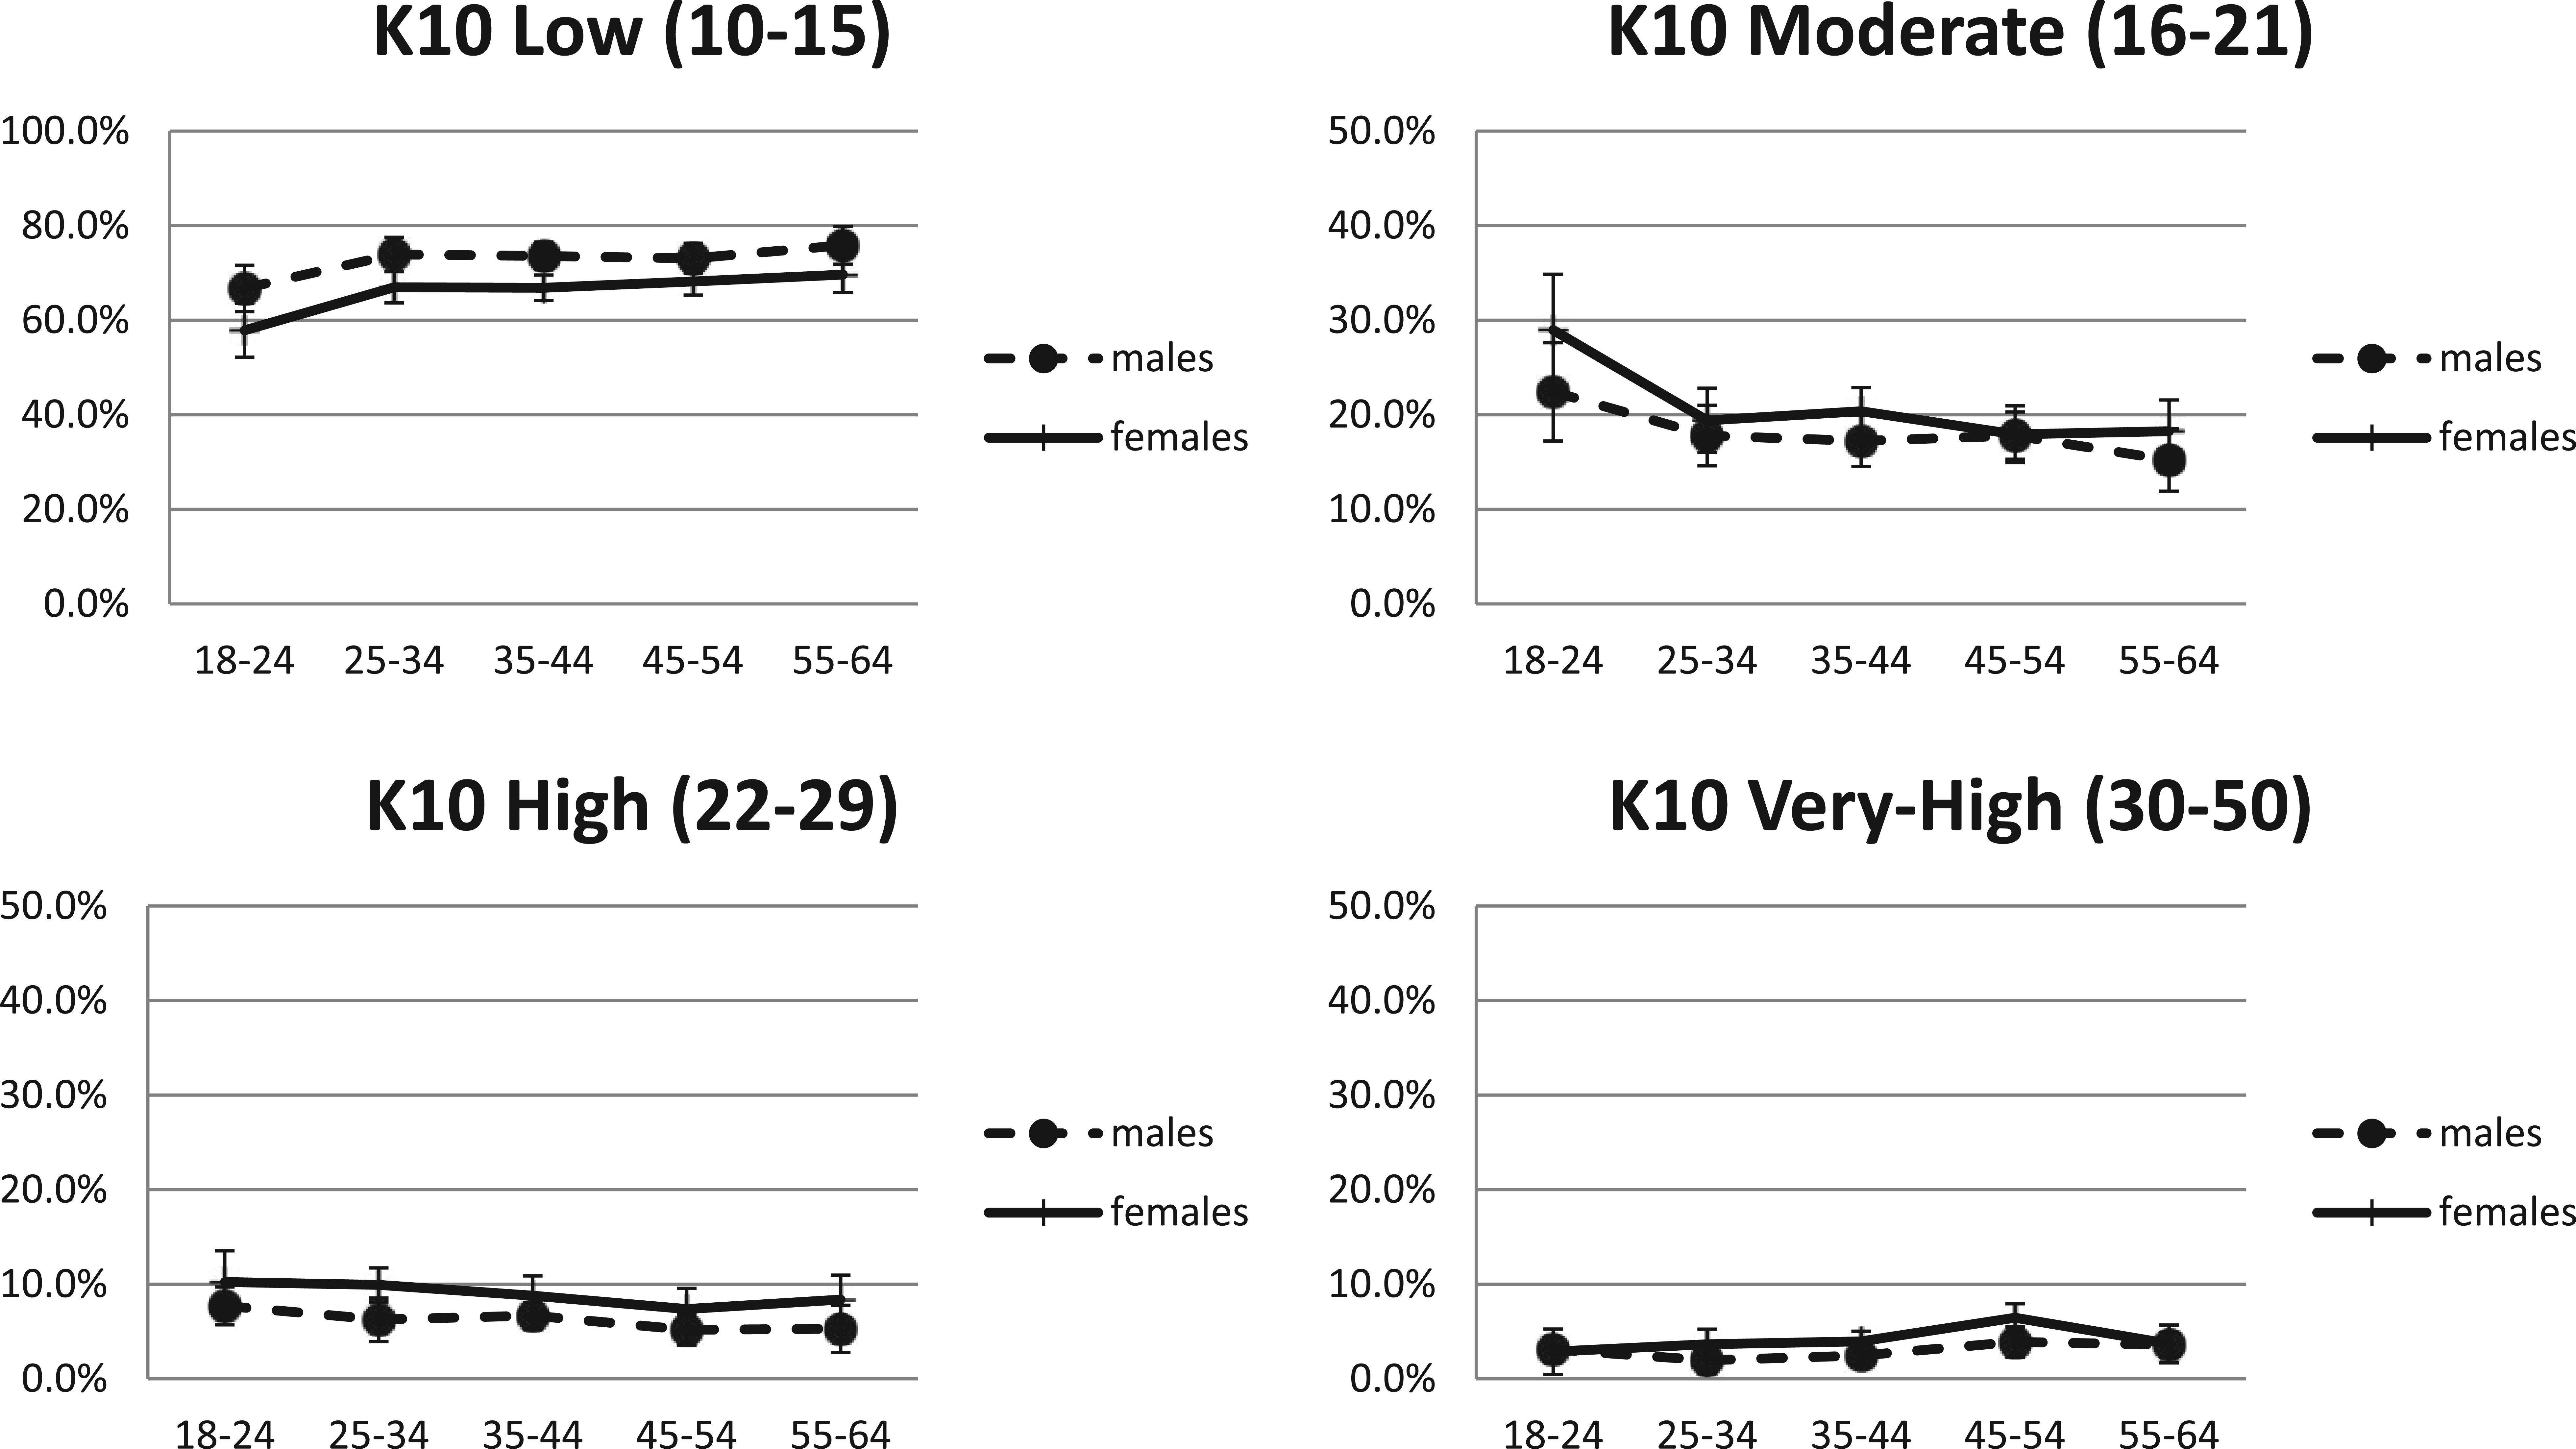
Percentage with psychological distress by age group and gender.
Considering the major disorder groups (Substance, Affective and Anxiety) separately and examining rates of these consistently showed relative risks in the combined richer quintiles (IRSD quintiles 4 and 5) versus poorer quintiles (IRSD quintiles 1–3) of 50–60% indicating greater prevalence of disorder in the poorer IRSD areas (results available by request to the authors).
Discussion
Summary of results in relation to stated hypotheses
This work addresses a gap regarding information on mental health problems in Australia (Allen et al., 2014; Doran, 2013) by exploring two available national surveys for area-based information on prevalence of psychological distress in the past month and mental disorders in the last year.
The two surveys described similar rates of psychological distress across Australia despite the 4- to 5-year time difference between data collection points, with approximately one person in 10 reporting recent distress at high or very-high levels. The percentage of the population reporting very-high distress levels hovered mostly around 3–4% with overlapping confidence intervals regardless of age group.
In line with our first hypothesis, socioeconomic disadvantage in areas was influential on both distress and mental disorder rates, with increased rates in more disadvantaged areas. Going against our second hypothesis, the gradient between least and most disadvantaged areas was steeper for distress as measured by the K10 than for mental disorders. In the most disadvantaged quintile region, the percentage (17.0% in 2007 and 16.1% in 2011/12) with high/very-high distress was more than double that in the least disadvantaged quintile (7.3% in 2007 and 6.9% in 2011/2012). To contrast this with findings from the CIDI in 2007, in the most disadvantaged quintile region, the percentage (24.4%) with mental disorders was only 50% higher than that in the least disadvantaged quintile (16.9%).
In line with our third hypothesis, broad sections-of-state areas did not show substantial prevalence differences: high/very-high K10 rates were quite stable across these area classifications at around 10–11%, while mental disorder percentages lay between 20.9 and 22.5%.
Possible explanations for the disparity in the findings for disorder rates and the K10 measure
As introduced earlier, the relationship between K10 scores and 1-year prevalence is likely to be complex. Social causes such as greater occupational and environmental adversity leading to adjustment disorders, subthreshold disorders and similar problems may lead to higher K10 scores in more disadvantaged areas in cases not associated with a 1-year mental disorder as diagnosed by the CIDI. Also, relative under-treatment of 1-year disorder in more disadvantaged areas might contribute to persistence of symptoms and result in persistently elevated K10 scores. We know from other work that there is substantial variability in the usage of mental health services across sectors (Burgess et al., 2002; Meadows, 1997; Meadows et al., 2015). To the extent that mental health service delivery succeeds in translating the evidence base regarding efficacy of many interventions into effectiveness in the real world, the identified disparities in service delivery might account for some of the patterns seen. The supplementary analyses reported here suggest that something of both these explanations is in operation.
Addressing aspects of disadvantage through social policy
These results do suggest that multiple factors are at work with excess rates of elevated K10 scores in more disadvantaged areas being explained by people with and without a recent history of mental disorder. So these results may suggest that the steeper disadvantage-distress gradient may be a challenge for a range of both healthcare and social policy. Improving environmental conditions in areas may have the effect of reducing distress and reducing subthreshold disorders since factors associated with area deprivation are associated with a greater probability of both mental disorders and distress such as unemployment, low income and education level (Butterworth et al., 2006; Page et al., 2009). A public health approach to reduce high rates of psychological distress in Australians, particularly those in less affluent areas, is therefore likely to be most effective if it involves social policy initiatives to reduce alterable elements of deprivation as well as increasing access to psychological treatments in these areas.
Planning for future mental health care
The disparities in treatment of 1-year disorders may be contributing to the raised levels of distress in more disadvantaged areas – it may also be the case that lower treatment levels in terms of maintenance therapies might also be a feature in the higher rates among those without 1-year disorders. Nationally, improving equitable access to appropriate mental health care is a key focus of Australia’s National Healthcare reform (Australian Government, 2011); estimating needs in specific populations is thus important if progress in improving equity is to be achieved. These findings add to the relevant available information but can they inform planning for equitable service provision?
Considering first the services funded under the Medicare Benefit Schedule (MBS), it has been found that key mental health services were used through 2007–2010 by people residing in the most advantaged quintiles at almost three times the rate of those in the least advantaged quintile (Meadows et al., 2015). Alongside this, we can now place the finding from this paper that in 2011/2012, rates of psychological distress in the most disadvantaged quintile were more than double those in the least disadvantaged quintile, while rates of disorder in the last year were 50% higher. Full exploration of this would require further analyses, and the SEIFA indicators in the two studies used were slightly different – but we can consider a simple suggestive calculation based on these two observations: together, these findings suggest that someone living in the more disadvantaged areas compared to less disadvantaged areas with comparable levels of distress may well be six times less likely to receive such key services. Based on disorder rates, the difference may be less but still around four to five times. The results then suggest that inequities of utilisation to many MBS-funded specialist mental healthcare services, given comparable levels of distress or occurrence of disorders, are probably even greater than previously demonstrated based on raw population figures (Meadows et al., 2015). As postulated above, lower service activity in more disadvantaged areas might be indicating reduced opportunities to receive effective treatment, and this may be one contributory cause to the higher levels of psychological distress.
It may be that supply-side variables including location of private providers are important in generating and maintaining such levels of inequity. Private medical practitioners with a commitment to equitable care delivery can choose to take this information into account when they decide where and how to conduct some or all of their practice, but possibly at some personal financial cost compared with practising in more affluent areas. Correction of such inequities also might be achieved through major reform of the MBS, but reforms that compelled practitioners to work in specific areas might be highly contentious while also potentially running afoul of the constitutional prohibition on medical civil conscription (‘Commonwealth of Australia Consolidated Acts - SECT 51: xxiiia’, 1946).
Public mental health services, delivered by public mental health care or the Community Managed Sector, commonly adhere to the principle of defined catchment areas, whereby services such as assertive outreach can be reliably delivered where needed (Thornicroft and Tansella, 2009). This means these services operate within a capacity constraint determined by the funding available for designated area services. Knowledge of community prevalence and associated need is critical for determining funding distribution in a way that improves equitable access (Thornicroft and Tansella, 2009). While more activity-based funding for mental health care is likely to be introduced in Australia at some point (Independent Hospital Pricing Authority, 2015), it would still leave important challenges for how equitable access may be improved. Such issues may be addressed in Resource Distribution Formulae such as have been used from time to time in some Australian States (Meadows, 1997). The findings here of substantial variation in mental health status with characteristics of area reinforce the need for systematic population needs assessment and resource distribution and give some guidance as to the degree of variability that funding models should aim for if equity is to be achieved.
In Australia, mental illness is most commonly diagnosed and treated by primary care practitioners (Burgess et al., 2009), and 12 % of all General Practitioners’ (GPs) visits are mental health–related, with depression cited as the most common illness (Britt et al., 2011). Australian GPs work with and through various coordinating organisations, and through time, these have included the Divisions of General Practice, then Medicare Locals, which in turn from mid-2015 were replaced by Primary Health Networks. These organisations, with responsibility for primary mental healthcare planning and commissioning, seek area-based estimates of mental healthcare needs to help guide development of primary mental health care within geographical areas of responsibility (Australian Government Department of Health and Aging, 2011). GPs and Primary Health Networks may find these estimates useful in assessing absolute and relative needs in practice populations, and so guiding service response and designing special provision where communities have higher needs.
The K10 as a proxy measure for area-based need
The K10 is more feasible for collection in routine health surveys, but the results suggested that 30-day distress as measured by the K10 would not be a reliable indicator of 1-year mental disorder rates. The K10 30-day distress scores behaved more like a composite indicator of mental disorders and other mental health or psychological responses to social, environmental or other problems. There does appear to be a contribution of the disparities in K10 scores from inadequate treatment of mental disorders linked to the way that Australian Healthcare resources are inequitably distributed against considerations of socioeconomic disadvantage (Meadows et al., 2015). The K10 then seems to be reflecting in some measure underlying mental disorders, particularly where such disorders do not receive adequate treatment, and this is not constant between areas. A component of the elevation in K10 scores also seems to be associated with people without recent mental disorders, perhaps partly this being a matter of under-provision of maintenance therapy along with other psychological manifestations of and responses to social and environmental disadvantage.
Limitations
None of the examined surveys enumerates psychotic disorders with high validity. The available surveys of psychotic disorders (Gureje et al., 2001; Waterreus et al., 2012) were not conducted with comparable sampling strategies, so they do not provide for such comparisons. The distribution of lower prevalence and other disorders may be different to that described here.
Information on those who do not speak English and indigenous populations is relatively lacking. Findings regarding very-remote regions need to be treated with caution as none of the used surveys was designed to cover this in detail. Furthermore, the area-based differences reported are not to be interpreted as reliably indicative of the properties of individuals.
The IRSD index was only available as grouped into deciles, and we aggregated to quintiles to increase power. Greater precision achievable through bringing together continuous K10 scores and the raw IRSD measure would be highly desirable, as would comparisons within states and territories. Such work is not possible with released ABS data sets and would press against power constraints of the existing surveys.
Other SEIFA variables were not available in either the CURF or the RADL and in an earlier investigation of MBS data for inequity (Meadows et al., 2015), a different one of these variables performed better than the IRSD.
Suggestions for further work
This analysis has explored two national data sets in line with some specific prior hypotheses, and this exploration itself has generated some possibilities for further work beyond the current scope. More advanced modelling using these data sets might shed light on the relationships between lifetime and recent disorder rates, subthreshold disorders, treatment rates and other social, environmental and household factors, and distress as assessed by the K10. This modelling could also individuate major disorder groups (Substance, Affective and Anxiety) and highlight any differential patterns. It is clear that inclusion of the K10 in routine surveys such as the NHS, while definitely of value, does not provide us with a direct and robust indicator of mental disorder or needs for mental health care. Further information that could be collected within such surveys that could better inform the questions posed here needs considering. Perhaps what is needed is a survey that captures histories of mental health problems along with the more recent indications of distress or symptoms estimated by the K10, but also with better information on social factors, household and other variables and the role of treatment. All of this could usefully be linked with detailed information on local areas and with adequate power for the needed discrimination built into the design. To our knowledge, the most comprehensive attempt to address these issues to date remains the Colorado Social Health Survey of Mental-Health-Service Needs, which used stratified probability sampling from 48 randomly selected small areas of the state (Ciarlo et al., 1992). Certainly nothing comparable has been attempted in Australia, and we suggest that the time for this has come. While the contribution of the ABS to the NSMHWB programme has been enormous and probably to date essential, the ABS works under significant constraints in regard to release of data to researchers, and an investigator-driven study might deliver more precision. If a third NSMHWB were to be planned, then perhaps it should be structured along such lines.
Conclusion
In summary, useful data for the best available information on disparities in rates of mental disorders and distress were available in the two national surveys examined here. The results suggested first that disparities in mental health status in Australia based on socioeconomic characteristics of area are substantial and persisting. Whether considering 1-year mental disorders or 30-day psychological distress, these occurred more commonly in areas with socioeconomic disadvantage. The association was stronger for the K10 distress scores suggesting that the K10 scores behaved more like a composite indicator of the presence of mental disorders, inadequate treatment linked to socioeconomic disadvantage and other responses to stressors or subthreshold conditions. This suggests that to reduce the observed disparities, what might be characterised as a ‘Whole of Government’ approach is needed, with attention to the elements of socioeconomic disadvantage and addressing the demonstrable and significant inequities in treatment provision.
Footnotes
Acknowledgements
This work was undertaken at Southern Synergy, Department of Psychiatry, Faculty of Nursing, Medicine & Health Sciences, Monash University, Australia. We thank Prof Grant Russell, School of Primary Health Care, Monash University, for advice on primary care aspects within this manuscript.
Declaration of interest
The author(s) declared no potential conflicts of interest with respect to the research, authorship and/or publication of this article.
Funding
Data from the 2011/2012 National Health Survey and 2007 Survey of Mental Health and Wellbeing were provided by the Australian Bureau of Statistics. The survey was funded by the Australian Government Department. The views expressed in this paper are those of the authors and not those of the Australian Bureau of Statistics or the Australian Government. These agencies are responsible for the initial data only and are not responsible for the analyses, interpretations or conclusions reached by the authors.