
Abstract
Measurement of psychological distress is vital to monitor the mental health of both individuals and populations at a given point in time and in determining the extent and determinants of trends in mental health over time. The Kessler Psychological Distress Scale (K10) was developed by Kessler and others [1–3] for use in the annual US National Health Interview Survey to measure the non-specific aspects of psychological distress (see http://www.hcp.med.harvard.edu/ncs/k6_scales.php for more detail). The range of research that has subsequently utilized the K10 and its shortened version, the K6, is broad and includes studies in both general population and clinical samples for both health monitoring and intervention outcome measurement. For example, the K10 has been used in samples of injecting drug users [4], individuals with epilepsy [5], individuals with HIV [6] as well as in indigenous [7] and rural communities [8–14]. This measure has also been translated into eleven different languages [15,16] and used as a screening tool for mental disorders in a variety of situations [7,17–24]. More recently, studies have emerged establishing the reliability and validity of the K10 across a number of diverse settings [4,6,15,16,25–28].
In Australia the K10 has also been used in state-based population surveys including the annual New South Wales Health Survey [29], the 2000 South Australian Health and Wellbeing Survey [30], the 2000 Health and Wellbeing Survey in Western Australia [31] and the annual Victorian Population Health Survey [32]. Nationally, the K10 has been included in the 2001, 2004–2005 and 2007–2008 National Health Surveys [33–35] and the 2001 Indigenous Health Survey (Australian Bureau of Statistics, 2002). The K10 currently plays an important role in the assessment of the outcomes of services provided to people with mental disorders and as such has been included as a data item in the Mental Health National Outcomes and Casemix Collection [36]. The K10 is also integral to the evaluation of the Better Outcomes in Mental Health Care programme, an initiative funded by the Australian Government designed to address the observed under-treatment of people with mental disorders [37].
Of particular interest to the current study is the use of the K10 in the 1997 and 2007 Australian National Surveys of Mental Health and Wellbeing (NSMHWB). Data from the 1997 NSMHWB on the correspondence between K10 scores and Composite International Diagnostic Interview-defined ICD-10 diagnoses of anxiety, affective and substance use disorders have been previously presented [38]. While these data provided the first published Australian norms for the K10 and have been a valuable source of information, a number of factors point to the need for updated normative data. Firstly, the results reported in Andrews and Slade [38] divide the K10 into equally spaced five-point bands that do not consistently overlap with now fairly well-established and validated cut-points on the K10. Secondly, the results presented in Andrews and Slade [38] do not report data split by sex and age, two important demographic factors known to be associated with psychological distress [39]. Thirdly, Andrews and Slade [38] report the prevalence of mental disorders separately for each K10 band yet provide no estimates of relative risk or likelihood of having a mental disorder given a score in a particular K10 band. While information of this kind from the 1997 NSMHWB has been published elsewhere [40] the utility of the K10 as a screening instrument would benefit from having all this information in a single source publication. Underlying these methodological issues is the assumption that the most effective research endeavours, government policy initiatives and clinical service models should be informed and shaped by the most up-to-date data available.
Given the widespread use of the K10 in Australia and the shortcomings of previous reports of normative data on the K10 the aim of the current paper is to report the most current normative data on the K10 from the 2007 Australian NSMHWB. Specifically, we aim to:
Report normative data on the K10 both in the total Australian population and split by sex and age.
Report the prevalence of mental disorders in those scoring in previously established and validated K10 strata.
Report the likelihood of having a mental disorder given a score in each K10 strata and demonstrate how this information can aid in diagnostic decisions.
Method
Sample and measures
The 2007 Australian National Survey of Mental Health and Wellbeing (NSMHWB) is a nationally representative epidemiological survey of the Australian adult population. Data were collected via face-to-face interviews by the Australian Bureau of Statistics (ABS). The response rate was 60%, the total sample containing 8841 individuals aged 16 and above. A more detailed discussion of the sampling frame and procedures is available elsewhere [41,42].
The survey employed a multistage sampling design and utilized a modification of Version 3.0 (also known as the World Mental Health version) of the World Health Organization Composite International Diagnostic Interview (CIDI) [43]. The CIDI assesses all diagnostic criteria for the major lifetime mental disorders including affective disorders (major depressive disorder, bipolar disorders, dysthymia), anxiety disorders (agoraphobia, generalized anxiety disorder, obsessive–compulsive disorder, panic disorder, post-traumatic stress disorder, social phobia) and substance use disorders (alcohol and drug harmful use and dependence). Disorders were assessed using the definitions and criteria of the
Any 12-month physical condition was defined as the presence of at least one of the six physical conditions recognized as Australian National Health Priority Areas (NHPAs). These were diabetes, asthma, coronary heart disease (CHD), stroke, cancer and arthritis. Respondents were first asked if they had ever been told by a doctor or nurse that they had one of these chronic physical conditions. If they said yes they were then asked whether they had that condition or received treatment for that condition in the twelve months prior to the survey. Answers to these latter questions were used to define any 12-month physical condition.
The K10 assessed indicators of psychological distress in the 30 days prior to interview using a five-value response option for each item ranging from one (none of the time) through to five (all of the time). The maximum score, indicating high psychological distress is 50. Absence of psychological distress is indicated by a minimum score of 10. Two respondents were not included in all analyses due to answers of ‘don't know’ to the K10 items. The K6 is made up of a subset of six items from the K10 with total scores ranging from six to 30. The exact wording of the 2007 NSMHWB version of the K10 (and K6) questions and the coding and scoring of the response categories can be found in the Appendix. (available online at http://informahealthcare.com/doi/abs/10.3109/00048674.2010.543653).
Statistical analysis
SAS 9.2 [48] and STATA 10.0 [49] were used to analyse the data. Data were weighted to match the composition of the Australian general population. Standard errors and 95% confidence intervals were calculated using jack-knife repeated replication [50] which provides unbiased estimates of the sampling error arising from complex sample selection procedures. Preliminary analyses revealed statistically significant differences in mean K10 scores across sex and age bands. In a multivariate linear regression analysis both sex (F(1, 59) = 39.07, p < 0.0001) and age band (F(6, 54) = 23.07, p < 0.0001) were significantly associated with scores on the K10. Therefore, mean K10 scores, associated standard errors and percentiles of the K10 score distribution were calculated by sex and age bands. Mean K10 scores, associated standard errors and percentiles of the K10 score distribution were also calculated for groups defined by the presence of 12-month mental disorder groups (any affective disorder, any anxiety disorder, any substance use disorder and any mental disorder), the number of mental disorder groups, the presence versus absence of any physical condition and groups defined by the comorbidity between mental disorders and physical conditions. Given the negative or right-skewed nature of the K10 score distribution the percentiles chosen for presentation were the 10th, 25th, 50th (median), 75th, 90th, 95th and 99th percentiles. The K10 scores were then categorized into four strata according to standard cut-points representing low (10–15), moderate (16–21), high (22–30) and very high (31–50) psychological distress [51]. The probability of having 12-month mental disorder groups was calculated within each K10 stratum. This was carried out in the total sample as well as separately for men and women.
Stratum-specific likelihood ratios (SSLRs) [52] were then calculated. These indicate by how much the odds of having the target disorder increase or decrease given a score in a particular stratum of the K10 and are calculated by dividing the percentage of people with mental disorder in a given stratum by the percentage of people without mental disorder in that stratum. SSLRs greater than 1 indicate that a score in a particular stratum is associated with a greater likelihood of mental disorder while scores less than 1 indicate that a score is associated with a lesser likelihood of mental disorder. In general, likelihood ratios above 10 provide sufficient evidence of the presence of the disease of interest while those below 0.1 provide sufficient evidence of its absence [53]. SSLRs are arguably more informative than traditional screening test indices such as sensitivity and specificity for two reasons. Firstly, SSLRs are more flexible in that they can be adapted to tests with more than two strata, while sensitivity and specificity can only be calculated from dichotomous tests. Secondly, unlike sensitivity and specificity, SSLRs can be used to predict the probability of mental disorder in an individual, information which is vital for clinicians and researchers. As described in [40] SSLRs and their 95% confidence intervals were calculated using spreadsheets available from http://www.ebpcenter.com.
Results
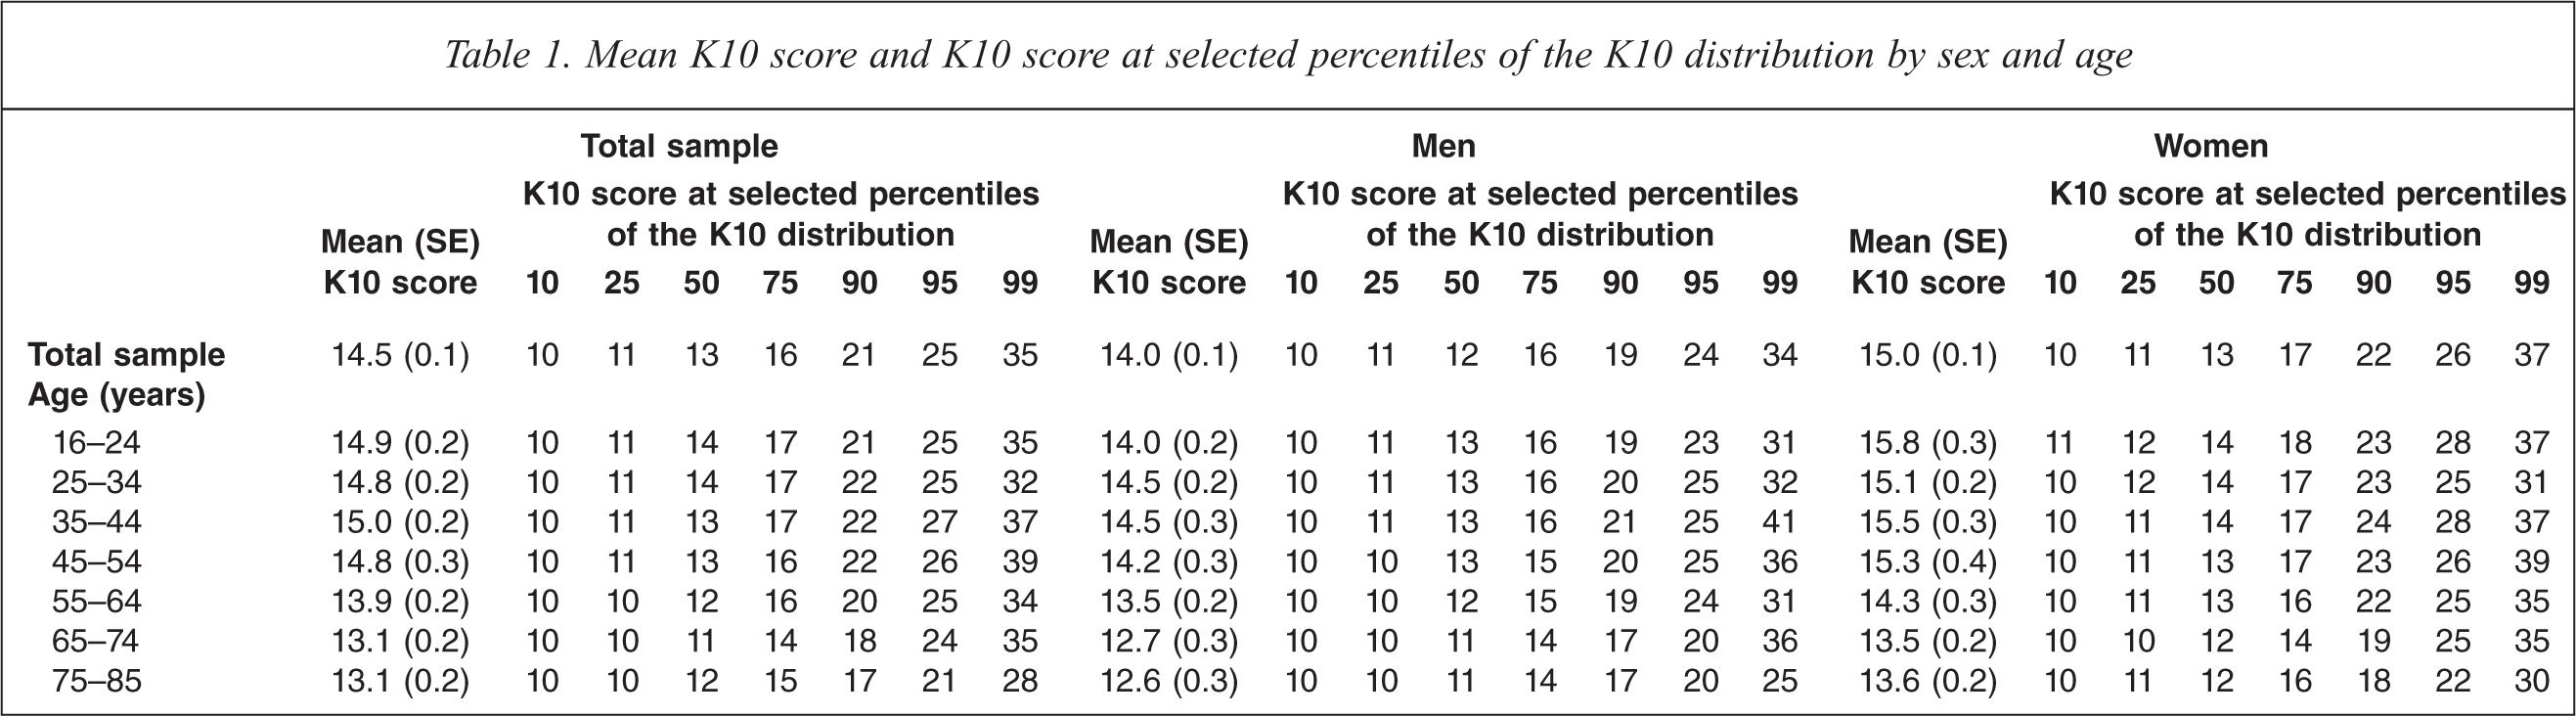
The mean and standard error of the K10 score as well as the chosen percentiles of the K10 score distribution are presented by sex and age in Table 1. In the total sample the mean K10 score was 14.5 (SE = 0.1) and the median K10 score was 13 with an interquartile range (IQR) (the range of scores between the 25th and the 75th percentiles of the K10 score distribution) of 11–16. In the total sample and across all age groups women had higher mean K10 scores than men. Mean K10 scores and percentiles of the K10 score distribution are presented by sex and major classes of ICD-10 mental disorder as well as by physical condition and groups defined by mental/physical comorbidity in Table 2. As expected, mean K10 scores were higher in people with a mental disorder (19.1, SE = 0.2) compared to people without a mental disorder (13.3, SE = 0.1). In general, people with an affective disorder had the highest mean K10 score (23.2, SE = 0.5), followed by people with an anxiety disorder (19.8, SE = 0.3), then people with a substance use disorder (18.0, SE = 0.5). Scores on the K10 increased as people experienced more classes of 12-month mental disorder; however, this increase was more pronounced for men than it was for women. In general, K10 scores were more strongly related to the presence of mental disorders than they were to the presence of physical conditions.
Mean K10 score and K10 score at selected percentiles of the K10 distribution by sex and age
Mean K10 score and K10 score at selected percentiles of the K10 distribution by 12-month ICD-10 mental disorder classes, 12-month physical conditions and physical/mental comorbidity groups
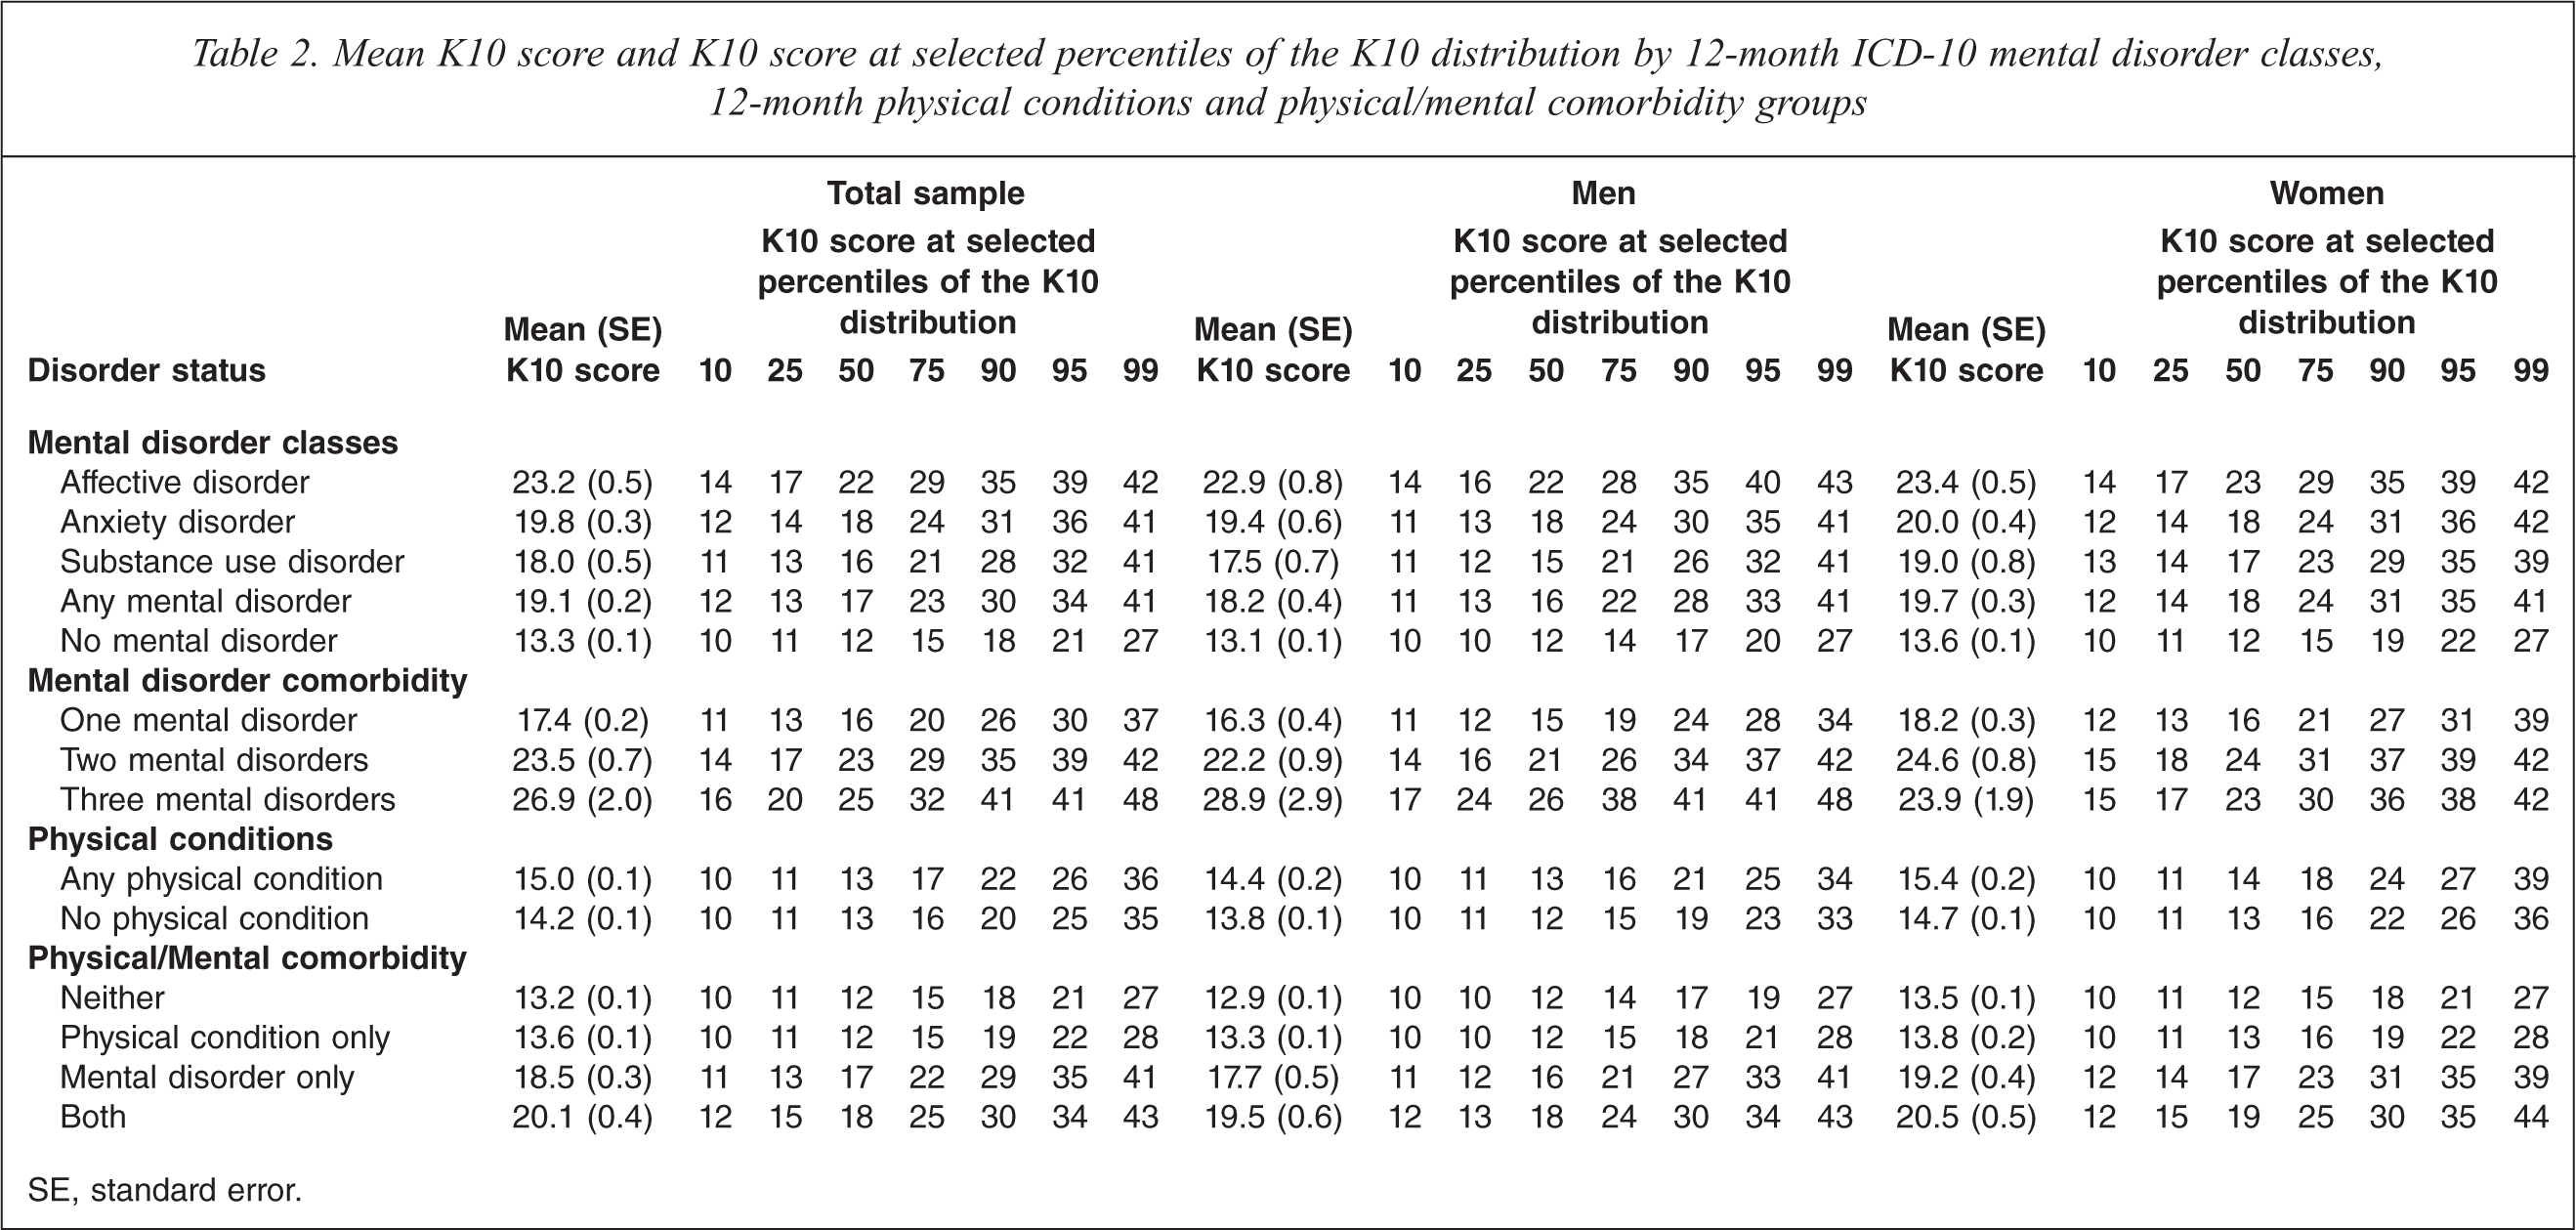
SE, standard error.
The prevalence of mental disorder by sex and K10 strata is shown in Table 3. Across all mental disorder groups the prevalence increased as the K10 score increased, with close to four out of five respondents (79.6%, SE = 3.6) in the very high strata experiencing a mental disorder in the twelve months prior to the survey. This information should be interpreted in light of the total sample distribution of K10 scores. Just over 70% of the total sample had a K10 score in the low range. A further 20% had a score in the moderate range, 7% in the high range and 3% in the very high range.
Prevalence of 12-month ICD-10 mental disorders and associated stratum specific likelihood ratios amongst individuals scoring from low to very high on the K10
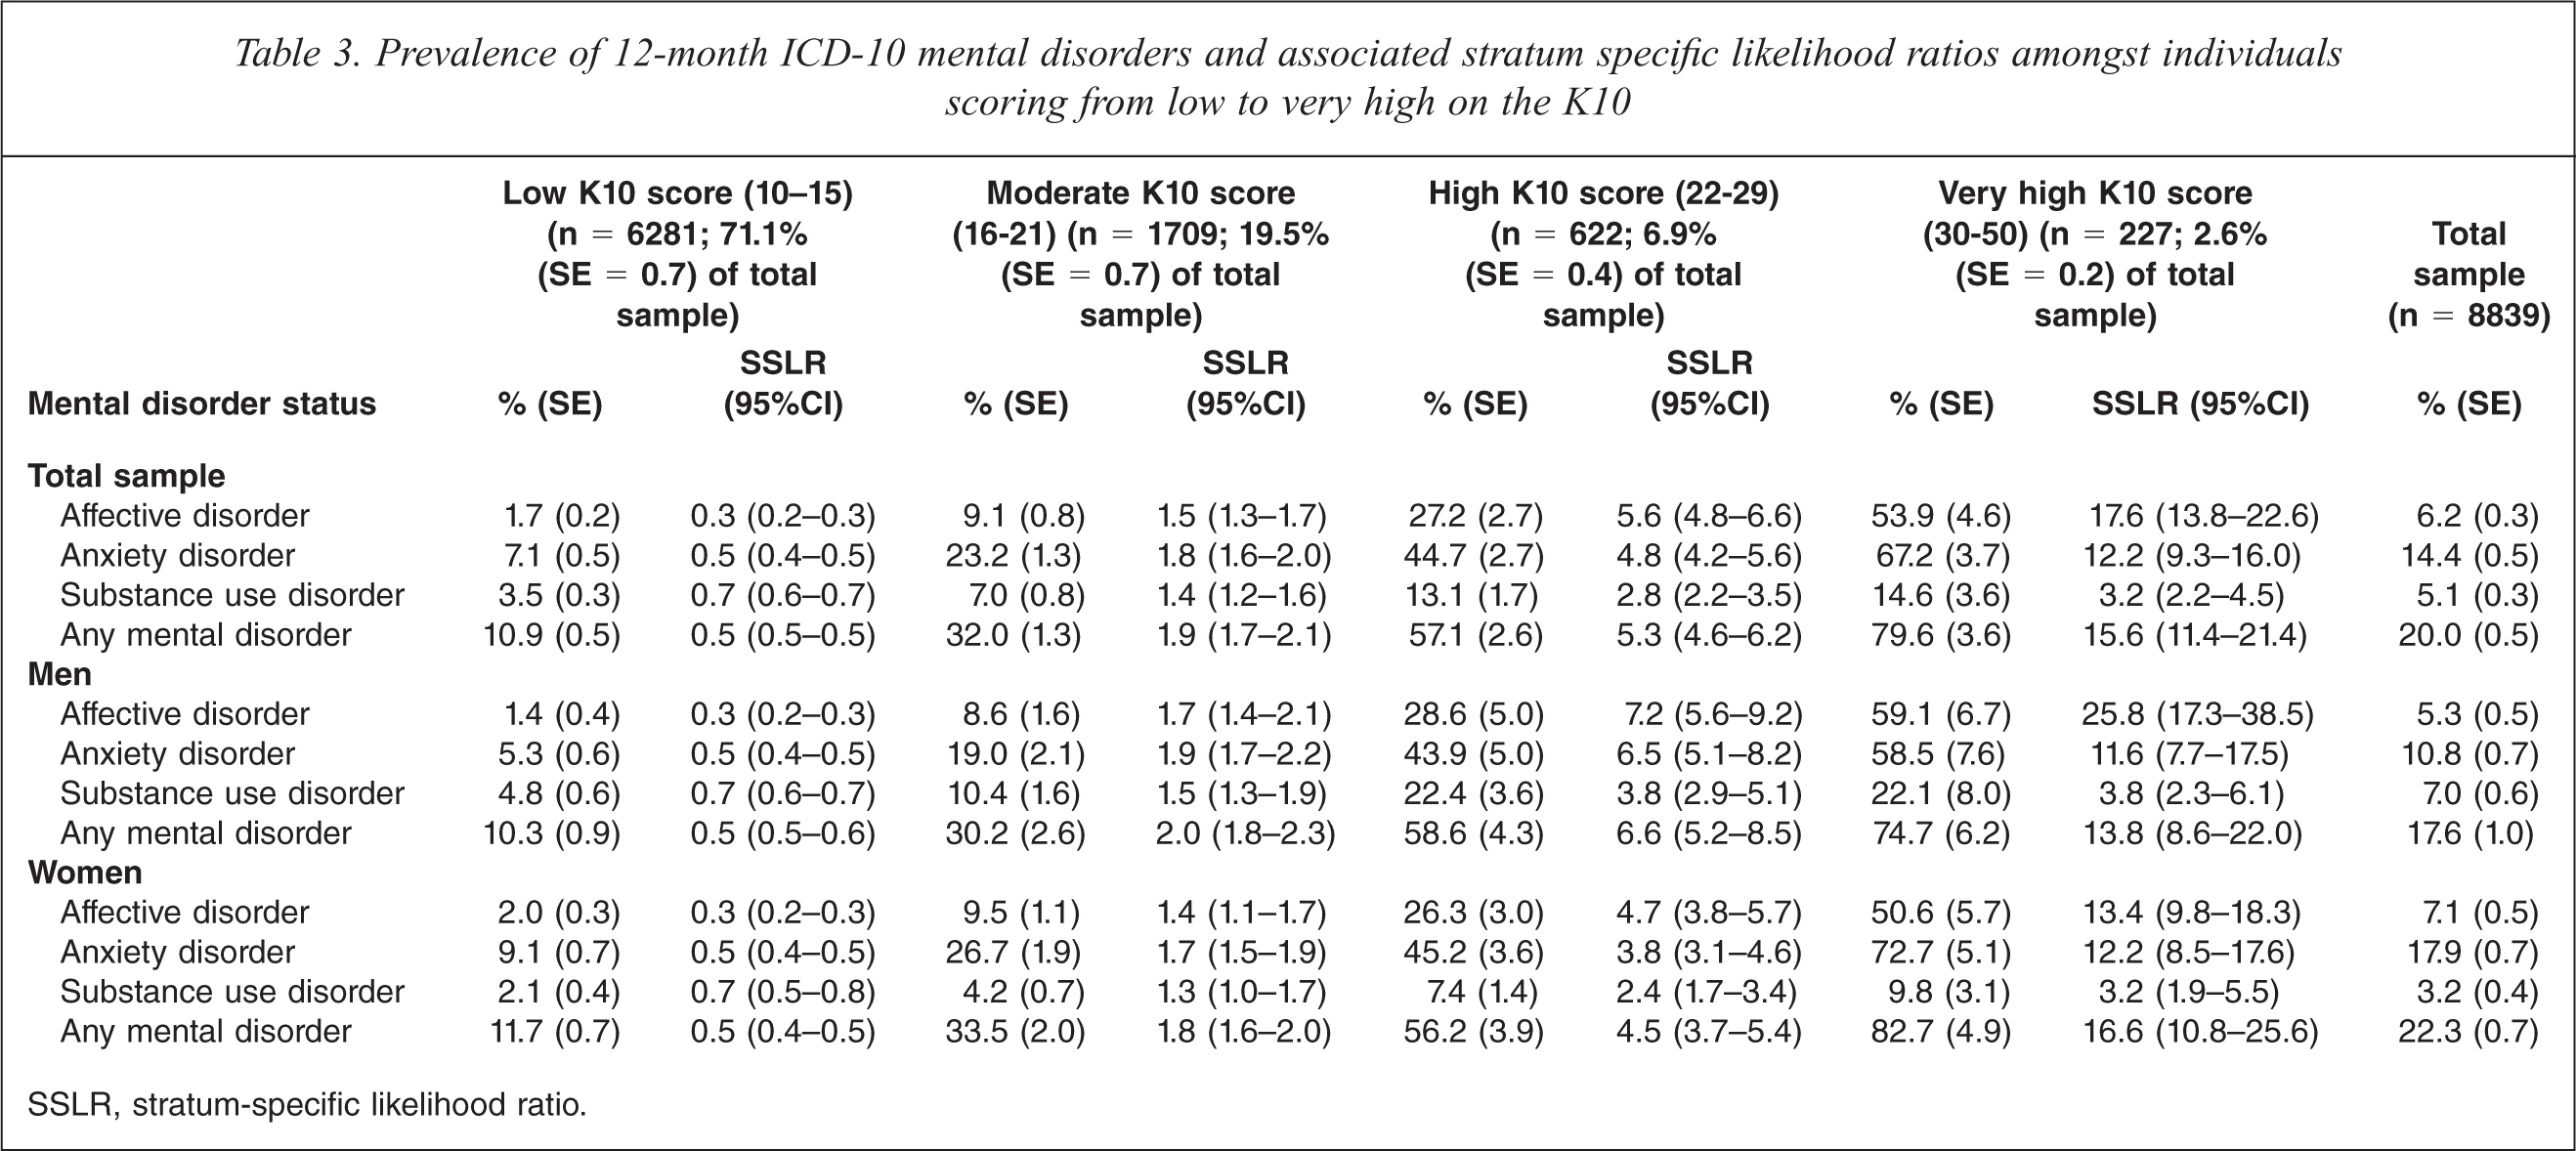
SSLR, stratum-specific likelihood ratio.
Stratum-specific likelihood ratios are also presented in Table 3. The magnitudes of the SSLRs indicate that the odds of having each mental disorder class as well as any mental disorder increased across K10 strata. Most noticeably the odds of having all disorder groups except any substance use disorder and any mental disorder were greater than 10 for people in the very high K10 strata. This can be interpreted as meaning that there is sufficient evidence of the presence of any affective, any anxiety or any mental disorder in those with very high K10 scores. At the other end of the extreme none of the SSLRs were less than 0.1 indicating that the K10 does not provide sufficient evidence to rule out mental disorder. Comparing across the mental disorder classes within each K10 stratum the SSLRs are generally highest for any affective disorder, slightly lower for any anxiety disorder and lowest for any substance use disorder.
It should be noted that equivalent versions of all tables presenting data on the K6 are available as supplementary material. (available online at http://informahealthcare.com/doi/abs/10.3109/00048674.2010.543653).
Discussion
The findings of the current study represent the most up-to-date Australian normative data on the K10, a measure of psychological distress commonly used in large general population surveys. These data can now be used by clinicians and researchers alike to provide a general population benchmark against which to compare the levels of psychological distress in their individuals or samples of interest.
The current study confirms the often observed finding that psychological distress is higher in women than men. It has been suggested that cultural norms relating to the expression of distress may in part be driving observed differences in rates of psychological distress between women and men. However, a recent methodological study on the construct validity of the K6 (a shortened form of the K10 made up of six of the original ten items) concluded that the K6 is both a sex- and age-neutral scale [54]. This means that any observed differences in K6 scores between women and men or between people at different ages reflect true differences in psychological distress and are not the result of bias brought about by differential interpretation or understanding of the K6 questions.
The finding that K10 scores were higher in those with mental disorders, compared to those without, is entirely consistent with expectations and provides further evidence of the validity of the K10 as a screener for mental disorders. Moreover, scores on the K10 were more affected by the presence of a mental disorder than the presence of a physical condition. The SSLRs provide evidence of the increased or decreased likelihood of having a mental disorder given a score on the K10, and substantiate the strong link between K10 scores at the upper end of the range (i.e. in the very high strata) and the presence of mental disorders. This finding is again not unexpected, given that the K10 was specifically designed to provide maximum precision and discrimination at the 90th percentile of the general population [1].
The SSLRs presented in Table 3 are particularly useful as they provide information necessary to determine how the K10 score of a given individual is related to the probability of having a mental disorder. In order to see how this works it is necessary to define some terminology. In the absence of a K10 score a given individual's probability of having a mental disorder can be reasonably assumed to be the same as the population prevalence of a mental disorder. This is often referred to as the pre-test probability. With knowledge of an individual's K10 score the probability of having a mental disorder often changes (it may increase or it may decrease) and this new probability can be referred to as the post-test probability. This post-test probability is what researchers, clinicians and consumers themselves are most interested in as it can help in deciding whether to rule in or rule out a diagnosis.
Using the mathematical relationship of Bayes’ theorem [55] it can be shown:
Post-test odds of mental disorder = Pre-test odds of mental disorder × SSLR
where
Odds of mental disorder = Probability of mental disorder/(1 − Probability of mental disorder)
Based on this relationship, SSLRs generated in a benchmark sample such as a general population sample can be used to easily compute predicted probabilities of mental disorder from K10 scores obtained from other samples with prevalences different from those of the general population. This is perhaps best understood by example. Consider a research study in which the K10 is administered to a sample of people which has a known or assumed prevalence of any affective disorder of 40%. The question becomes how this pre-test probability of 40% is changed with knowledge that an individual's K10 score is in the very high range. Using the SSLRs reported in Table 3 and Bayes’ theorem we can calculate an individual's post-test probability of having an affective disorder in the following way:
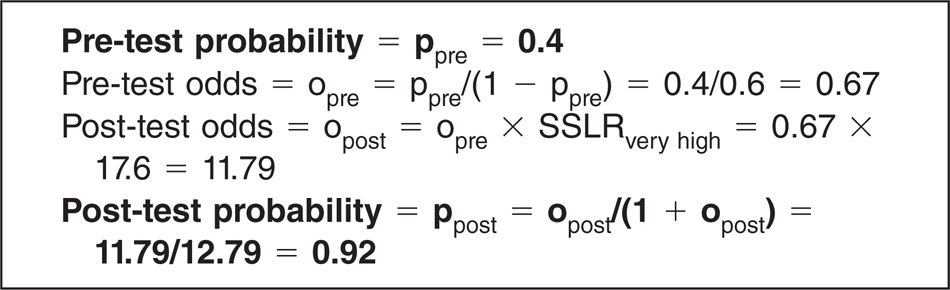
The calculations shown above illustrate how a prior probability of mental disorder of 0.4 is updated to a probability of 0.92 with knowledge that an individual has scored in the very high range on the K10. While it is possible to carry out the above calculations to determine a post-test probability for any exact pre-test probability, Figure 1 provides the pattern of post-test probabilities of mental disorder by K10 strata across nine pre-test probabilities ranging from 0.1 to 0.9. Arrows are shown in the top left graph (any affective disorder) to illustrate how to determine the post-test probability directly from the graph. The pattern of results presented in Figure 1 confirms the superior performance of the K10 as a screener for mental disorder, particularly for any affective disorder. However, perhaps its main benefit is to provide easily calculable clinical information regarding the extent of psychological distress in a given individual or research sample.
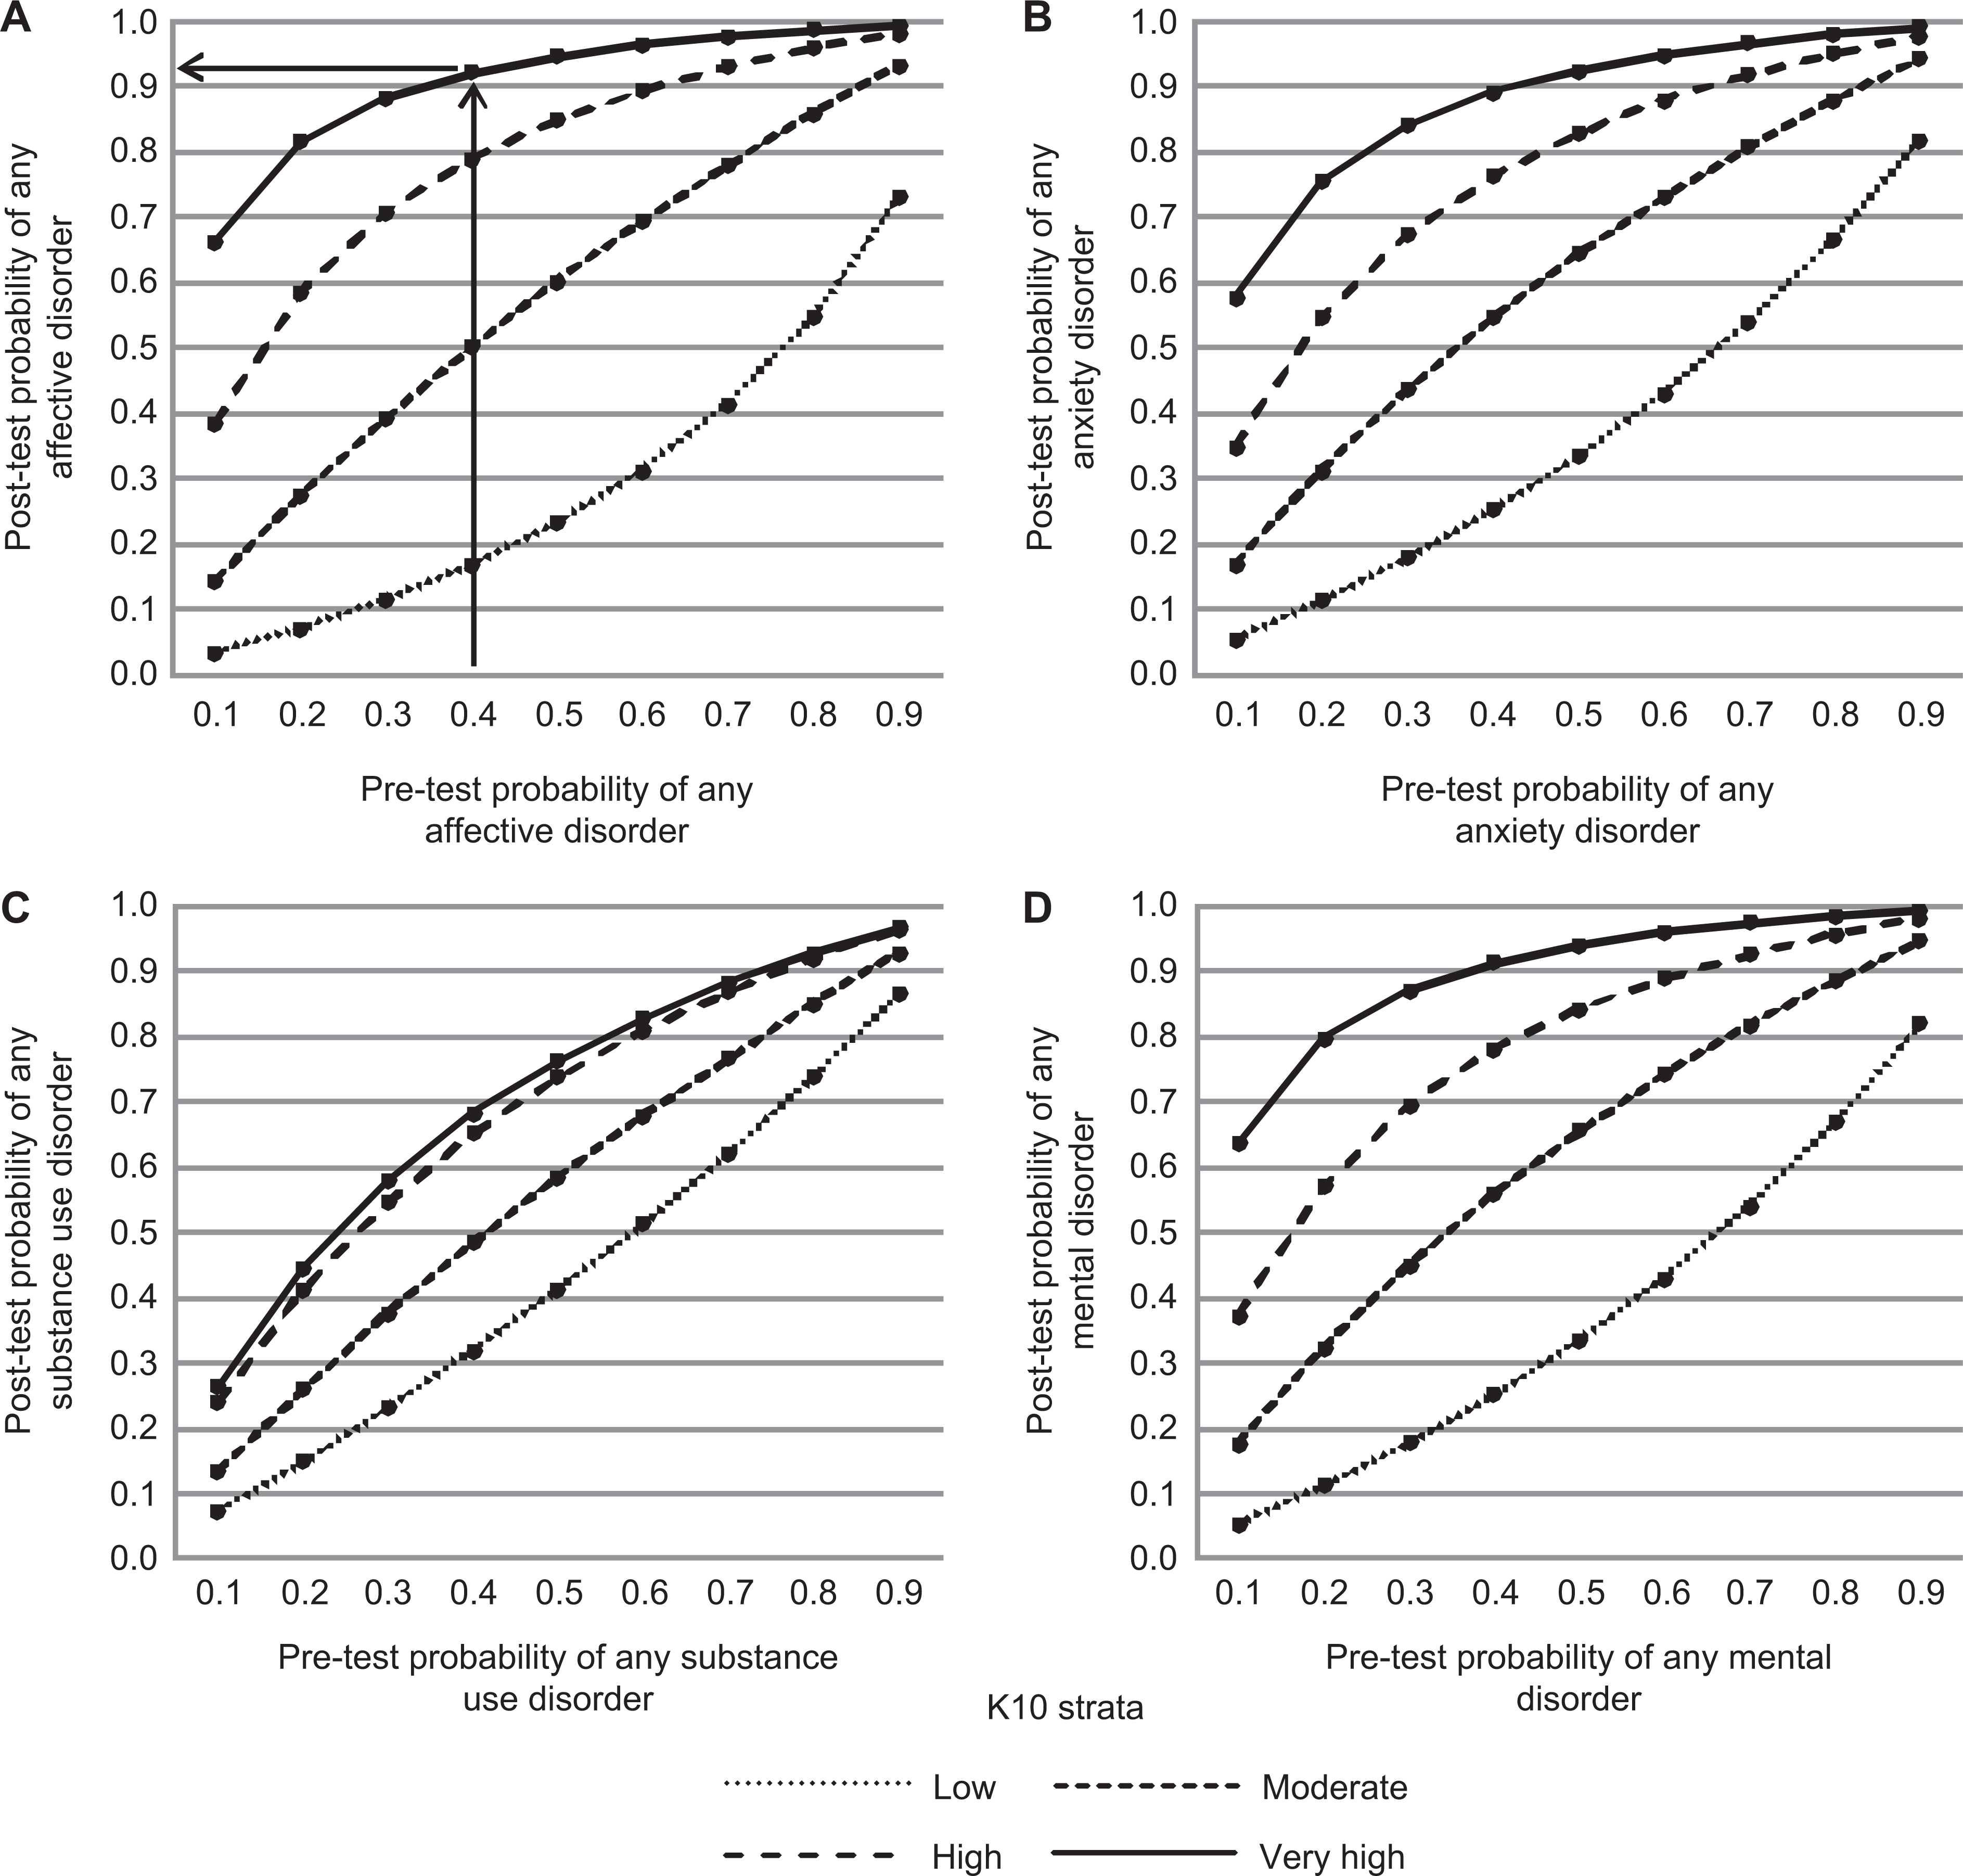
Post-test probabilities of any affective disorder (A), any anxiety disorder (B), any substance use disorder (C) and any mental disorder (D) by K10 strata across nine pre-test probabilities ranging from 0.1 to 0.9.
In conclusion, we have presented the latest normative data on the K10 in an Australian community sample. The K10 is a scale widely used not only as an indicator of mental health in the general population but also as a screening tool to detect the presence of mental disorder in individuals. We hope these data will be useful across a broad range of applications.