
Abstract
Objective:
To compare equivalent population-level mental health indicators in Canada and Australia, and articulate recommendations to support equitable mental health services. These are two somewhat similar resource-rich countries characterized by extensive non-metropolitan and rural regions as well as significant areas of socioeconomic deprivation.
Methods:
A cross-national epidemiology and equity study: primary outcome was Kessler Psychological Distress Scale (K10) in recent national surveys. A secondary outcome was mental disorders rate since these surveys were 5-years apart.
Results:
Elevated distress, defined by K10 scores (0–40 range) of 12 and over, affected 11.1% Australians and 12.0% Canadians. Elevated distress in both countries affected more people in the lowest income quintile (21–27%) compared to the richest (6%). In the lowest income quintile, 1-in-4 Australians and 1-in-5 Canadians reported elevated distress – twice the national average in both countries. Australians in the lowest income quintile (over 5 million people) have a significantly higher risk by over a 5% for elevated distress compared to their low-income Canadian counterparts. After adjusting for effects of age and gender, the relative odds in the lowest quintile compared to richest was 6.4 for Australians and 3.5 for Canadians, which remained significantly different thus confirming greater inequity in Australia. Mental disorders affected approximately 1-in-10 people in both countries.
Conclusions:
This adds to the mental health prevalence monitoring in these two countries by supporting an overall prevalence of elevated distress in approximately 1-in-10 people. It supports large-scale public health interventions that target elevated distress in people with low incomes to order to achieve the biggest impact, and, to reduce the greater inequity in mental health indicators in Australians, policy-makers should consider eliminating gap-fees as they are illegal in Canada. As encouraged by World Health Organization, we highlight the importance of such population-level studies so that cross-national results can be reliably compared.
Introduction
Although Australia and Canada are both high-income countries with well-developed mental healthcare systems, population studies of mental healthcare delivery have identified substantial treatment gaps. In both countries, 35–50% of people affected by mental illness receive no treatment for their disorder (Kohn et al., 2004; Sashidharan et al., 2016; World Health Organization (WHO), 2016a). Both countries have implemented national strategies that aim to improve the delivery and funding of mental health–related services (Commonwealth of Australia, 2015b; Mental Health Commission of Canada, 2012). Population-level data, including survey findings (Caron and Liu, 2010; Kessler et al., 2002; Slade et al., 2009), can assist policy-makers to achieve these objectives by providing valuable surveillance data for large-scale public health innovations and targeted interventions (Australian Healthcare and Hospital Association, 2015; Commonwealth of Australia, 2015b; Wahlbeck, 2015). The importance of this information is highlighted by the WHO (2013) in the global Mental Health Action Plan 2013–2020. This paper reports a cross-national study comparing equivalent population-level mental health indicators in Canada and Australia, and by using these findings, we articulate recommendations to support the provision of more equitable mental health services.
Australia and Canada share remarkably similar historic, social, economic, demographic and geographic profiles. For example, both are geographically large, high-income countries with a history of colonization by the United Kingdom and continued membership of the Commonwealth since federation. Population-wise, Australians and Canadians have a similar median age of approximately 40 years, life expectancy of 82 years and average adult education level of 12–13 years. In both countries, population density is 3–4 people per square kilometre, population growth is stable at 1%, net migration rate is 5.7 per 1000 population and gross domestic product (GDP) is approximately USD42,000 per capita (Central Intelligence Agency, 2012b; Central Intelligence Agency, 2012a). There are of course differences; climates, for example, range from temperate to tundra (Canada) and temperate to tropical (Australia). There are lifestyle differences that impact on health risk factors – for instance, Australian alcohol consumption per capita is over 20% higher than that in Canada (WHO, 2016b).
In terms of income distribution, the World Bank Gini index reflecting income inequality is somewhat higher in Australia (34.9) than Canada (33.7) – in Australia the ratio of the average income of the richest quintile to the poorest quintile is 7.0, while in Canada it is 5.5 (United Nations Development Programme, 2007). Economic indicators reflect slightly higher funding of the health system in Canada compared to Australia; during 2011–2015, total health expenditure (public and private expenditures) as percent of total GDP was 9.4% in Australia and 10.4% in Canada. At the same time, the public government health costs – as opposed to the individual or private insurer costs – as percent of total health expenditure was 70.9% in Canada and 67.0% in Australia (Central Intelligence Agency, 2012b; Central Intelligence Agency, 2012a). Overall total health expenditure was 1% higher and public health costs were 3.9% higher in Canada. As there is evidence that the mental health of the population is likely to be poorer where inequality is greater (Wilkinson, 2005; Wilkinson and Pickett, 2009), the differential rates of income inequality and the slightly lower health expenditure in Australia suggest that there may be greater levels of ill-health in Australia as compared to Canada.
Turning to mental healthcare service delivery, both the Australian and Canadian systems are referred to as universal schemes that aim to ensure equitable healthcare access for all citizens (Government of Canada, 2003; Parliament of Australia, 2003). The majority of mental healthcare is delivered by general medical practitioners/family physicians (GP/FP), with around 15% of all GP/FP consultations being mental health-related in major cities in both Australia and Ontario (Canada’s most populous province) (Britt et al., 2015; Lin et al., 1996; Steele et al., 2004). However, where the Canadian system operates as a prototypical province/territory-run health insurance scheme, in which health services are predominantly financed by the public sector and delivered in the private sector, Australia has a hybrid system with elements of both a national health insurance scheme and state/territory-run health services that are subsidized by the public sector, as well as considerable participation from private health insurers (Meadows et al., 2012). The Australian system provides a broader range of treatment services for mental health with government subsidies included for psychological treatments and medications that are not available in Canada. Unlike Australia, however, the Canadian health system places prohibitions on co-payments (often referred to as ‘gap-fees’ in Australia), offering more safeguards against out-of-pocket expenses that might contribute to inequity (Government of Canada, 2003).
Both countries face similar challenges posed by geography to the delivery of mental health services. Recent research conducted separately in Australia and Canada demonstrates that inequitable access to mental health services is compounded by factors associated with geographic remoteness, including a lack of infrastructure and services and socioeconomic deprivation (Caron and Liu, 2010; Enticott et al., 2016; Kurdyak et al., 2014; Meadows et al., 2015; Slade et al., 2009). In recognition of these challenges, understanding the relationship between mental health and either socioeconomic factors or characteristics of areas have been identified as significant national and provincial mental health policy priorities in both Australia and Canada (Commonwealth of Australia, 2015b; Mental Health Commission of Canada, 2012).
Recent population-level studies examining these relationships in both countries have shown that relatively socioeconomically disadvantaged populations have elevated rates of psychiatric symptoms and psychological distress (Kurdyak et al., 2014; Slade et al., 2009). An Australian study using National Health Survey (NHS) data on psychological distress, as measured by the Kessler 10 Psychological Distress Scale (K10), and prevalence of mental disorders found that approximately 1 person in 10 reported recent psychological distress at High/Very-high level with scores 12 and over in the scale score of up to 40 (range defined by 0–40). Notably, this finding varied more than twofold depending on socioeconomic status of area with 16.1%, 13.3%, 12.0%, 8.4% and 6.9% affected in the most to least economically disadvantaged quintiles across Australia in 2011/12. In the most disadvantaged quintile, the percentage with mental disorders (24.4%; defined as common anxiety, affective and substance use disorders) was 50% higher than that in the least disadvantaged quintile (16.9%) in 2007 (Enticott et al., 2016). A Canadian national-level study using the Canadian Community Health Survey (CCHS) on mental health in 2012 (Caron and Liu, 2010) examined psychological distress in the lowest income quintile of the population compared with the remainder of the population. Like the Australian study, this work examined K10 scores (range 0–40); however, unlike the Australian study, elevated distress was defined at a slightly lower cut-off score of 9, so the identified rates of elevated distress were higher. Overall, approximately one person in five reported recent elevated distress (scores 9 and over) with 50% higher prevalence in the low-income quintile (28.5%) compared to all other Canadians (19.0%). In the lowest income quintile, the percentage with mental disorders (13.5%; defined as major depression, mania, panic attacks, social phobia, agoraphobia, alcohol dependence and illicit drug dependence) was almost 40% higher than for all other Canadians (10.0%).
Based on these findings, together with the considerable similarities between Australia and Canada and the distinguishing features of their respective healthcare systems, we proposed that comparing equivalent mental health indicators from these two countries might lead to meaningful insights regarding optimal mental healthcare delivery, with implications for national and provincial health policy. The mental health indicators used include rates of psychological distress and prevalence of mental disorder. The determinants of these indicators are complex, including potentially the overall impact of inequality, as introduced above, along with other environmental, social and service access factors. For example and as introduced above, while Australia’s gap-fee (co-payment) system for mental health consultations might work against equitable distribution of care when compared to Canada, the fact that medications are subsidized in Australia and not in Canada might have an opposing effect. Primary hypotheses were tested by investigating equivalent national data on rates of psychological distress in two recent surveys conducted in 2011 or 2012 in Canada (Statistics Canada, 2013) and Australia (Australian Bureau of Statistics (ABS), 2013). A secondary hypothesis was tested using national data on prevalence of mental disorders, based on The World Mental Health Composite International Diagnostic Interview (CIDI 3.0), from the 2012 Canadian survey (Statistics Canada, 2013) and in another national survey conducted in Australia in 2007 (Slade et al., 2009). The hypothesis was regarded as secondary because it was tested using non-contemporaneous survey data separated by five years. Hypotheses are set as statements of expectations of equivalence.
Primary hypotheses were as follows:
1. In both Canada and Australia, the overall rate of high and High/Very-high psychological distress in adults will be similar.
2. In both countries, rates of High/Very-high psychological distress will be similar within sub-groups of household income quintiles, broad geographic areas, levels of education and employment status.
3. In both countries, equity analyses will show higher prevalence of High/Very-high psychological distress in low-income populations.
The secondary hypothesis was as follows:
4. In both countries, overall rates of mental disorders (defined as affective, substance use and generalized anxiety disorders in the previous 12 months) in adults will be similar.
Methods
Overview
We created multivariate models to investigate the outcome of elevated distress and adjusted for age and gender to examine effects of income, education, employment and region. To further compare the prevalence of elevated distress between quintiles of household income, we included an equity analysis approach commonly used in economics, which involved the calculation of concentration indices (Asgeirsdottir and Ragnarsdottir, 2013; Clarke and Smith, 2000).
Data sources
Population-level information on psychological distress was obtained by examining K10 data (Kessler et al., 2002) from the Australian NHS in 2011–2012 (ABS, 2013) and the CCHS on mental health in 2012 (Statistics Canada, 2013).
Since diagnostic information on mental disorders was not in the NHS, we obtained this information from another Australian national survey: the National Survey of Mental Health and Wellbeing (NSMHWB) in 2007 (Slade et al., 2009).
See the Online Supplementary Material for survey information.
Survey respondents
The respondents included adults aged 20–64 in Australia and Canada. Australian survey respondents were from the NHS in 2011–2012 or the NSMHWB in 2007. Unlike a previous analysis with adults aged 18–64 years (Enticott et al., 2016), we filtered the NHS to those aged 20–64 years, resulting in a sample of n = 12,011. The lower age limit was set to 20 years to be consistent with the Canadian comparison group. The upper age limit was set to 64 years since the interpretation of the K10 for those aged over 65 requires special consideration (Trollor et al., 2007). The NSMHWB was filtered to those aged between 18 and 64 years, producing a sample of n = 6557.
Canadian survey respondents were from the CCHS-mental health in 2012. These data were obtained using the Public Use Microdata File platform, which restricted age bands in 5 years blocks beginning at 15 years, so we set the lower limit to be 20 years. The upper age limit was set to 64 years to be comparable with the Australian data. We filtered to those aged 20–64 years, which produced, n = 16,972.
Outcome measures
The main outcomes were elevated distress: (1) high or greater distress and (2) very-high distress only, as measured by the K10. The K-10 measures current psychological distress, particularly symptoms of anxiety and depression (ABS, 2009; Slade et al., 2011). Both the Australian and Canadian surveys used the same scoring algorithm but a different starting point (the Australian survey coded none as 1 whereas the Canadian survey coded it as 0). We used the Canadian survey starting point of 0 because this is a common method reported worldwide (Kessler et al., 2002). We created a High/Very-high category by combining the high (scores 12–19) and very-high (scores 20–40) distress categories as informed by the ABS (ABS, 2009). For the multivariate analyses, a bivariate outcome representing ‘High/Very-high’ psychological distress was defined by K10 scores of 12 and over.
A secondary outcome was the prevalence of mental and substance use disorders in the previous 12 months from the CCHS-mental health (2012) and NSMHWB. See the Table 4 caption and Online Supplementary Material for the disorder groups.
Independent variables
The independent variables were chosen as common demographic/socio-economic factors known to influence mental health and were available within the study surveys. These were gender; age categorized by the bands 20–24, 25–34, 35–44, 45–54 and 55–64 years; region; income; employment and education. See Online Supplementary Material.
Ethics
Australian ethical clearance was not required because all survey data were in non-identifiable format, and satisfied section 5.1.22 of the National Statement on Ethical Conduct in Human Research. Institute for Clinical Evaluative Sciences (ICES) ethical clearances, through the Sunnybrook Hospital Research Ethics Board in Toronto, Ontario, were obtained as this study was part of another project at ICES.
Statistical analyses
We compared the prevalence of elevated distress across Canada and Australia as measured by a comparative measure (K10) available in national surveys. We used descriptive frequencies applying population weights to report the prevalence of elevated distress in each country, and within sub-groups of household income, education level, work status and region. Elevated K10 scores are known to be associated with mental disorder; we supplemented the distress results by reporting mental disorder prevalence.
The equality of proportions for elevated distress in the two countries was tested using two-sample z-tests for independent samples and large-sample statistics (Shafer and Zhang, 2012). Country differences with an alpha of p < 0.05 are reported.
Multivariate logistic regression with outcome of elevated distress were adjusted for age and gender and examined the effects of income, education, employment and region; odds ratios (ORs) for the outcome of High/Very-high distress (yes/no) were reported.
To measure inequity, we determined concentration indices which lie between −1 and + 1. Negative indices represented greater prevalence in lower income households. Positive concentration indices represented greater prevalence in higher income households. We followed a convention of using an index threshold of ± 0.2 as indicating a high level of inequality (Asgeirsdottir and Ragnarsdottir, 2013; Mangham, 2009; Meadows et al., 2015); an index of −0.2 would result from the poorest half of the population having 50% higher prevalence of distress than the richest half. Analyses used Stata version 11.0 (StataCorp LP, College Station, TX).
Results
The rates of people having High/Very-high distress in the month prior were 11.1% (95% confidence interval [CI]: [10.5, 11.8]) in Australia, and 12.0% (95% CI: [11.5, 12.5]) in Canada. Canada had higher overall prevalence compared to Australia with difference of 0.9% (95% CI: [0.2, 1.6]). Table 1 shows distress prevalence in both countries was higher in women and declined with age.
Prevalence of psychological distress in Canada and Australia, as measured by the Kessler 10 (K10) in adults aged 20–64 years. Australian survey respondents from the National Health Survey in 2011. Canadian survey respondents from the 2012 Canadian Community Health Survey. K10 ranged from 0–40: very-high distress category is a score of 20 or higher. Combined High/Very-high distress category is a score of 12 or higher.
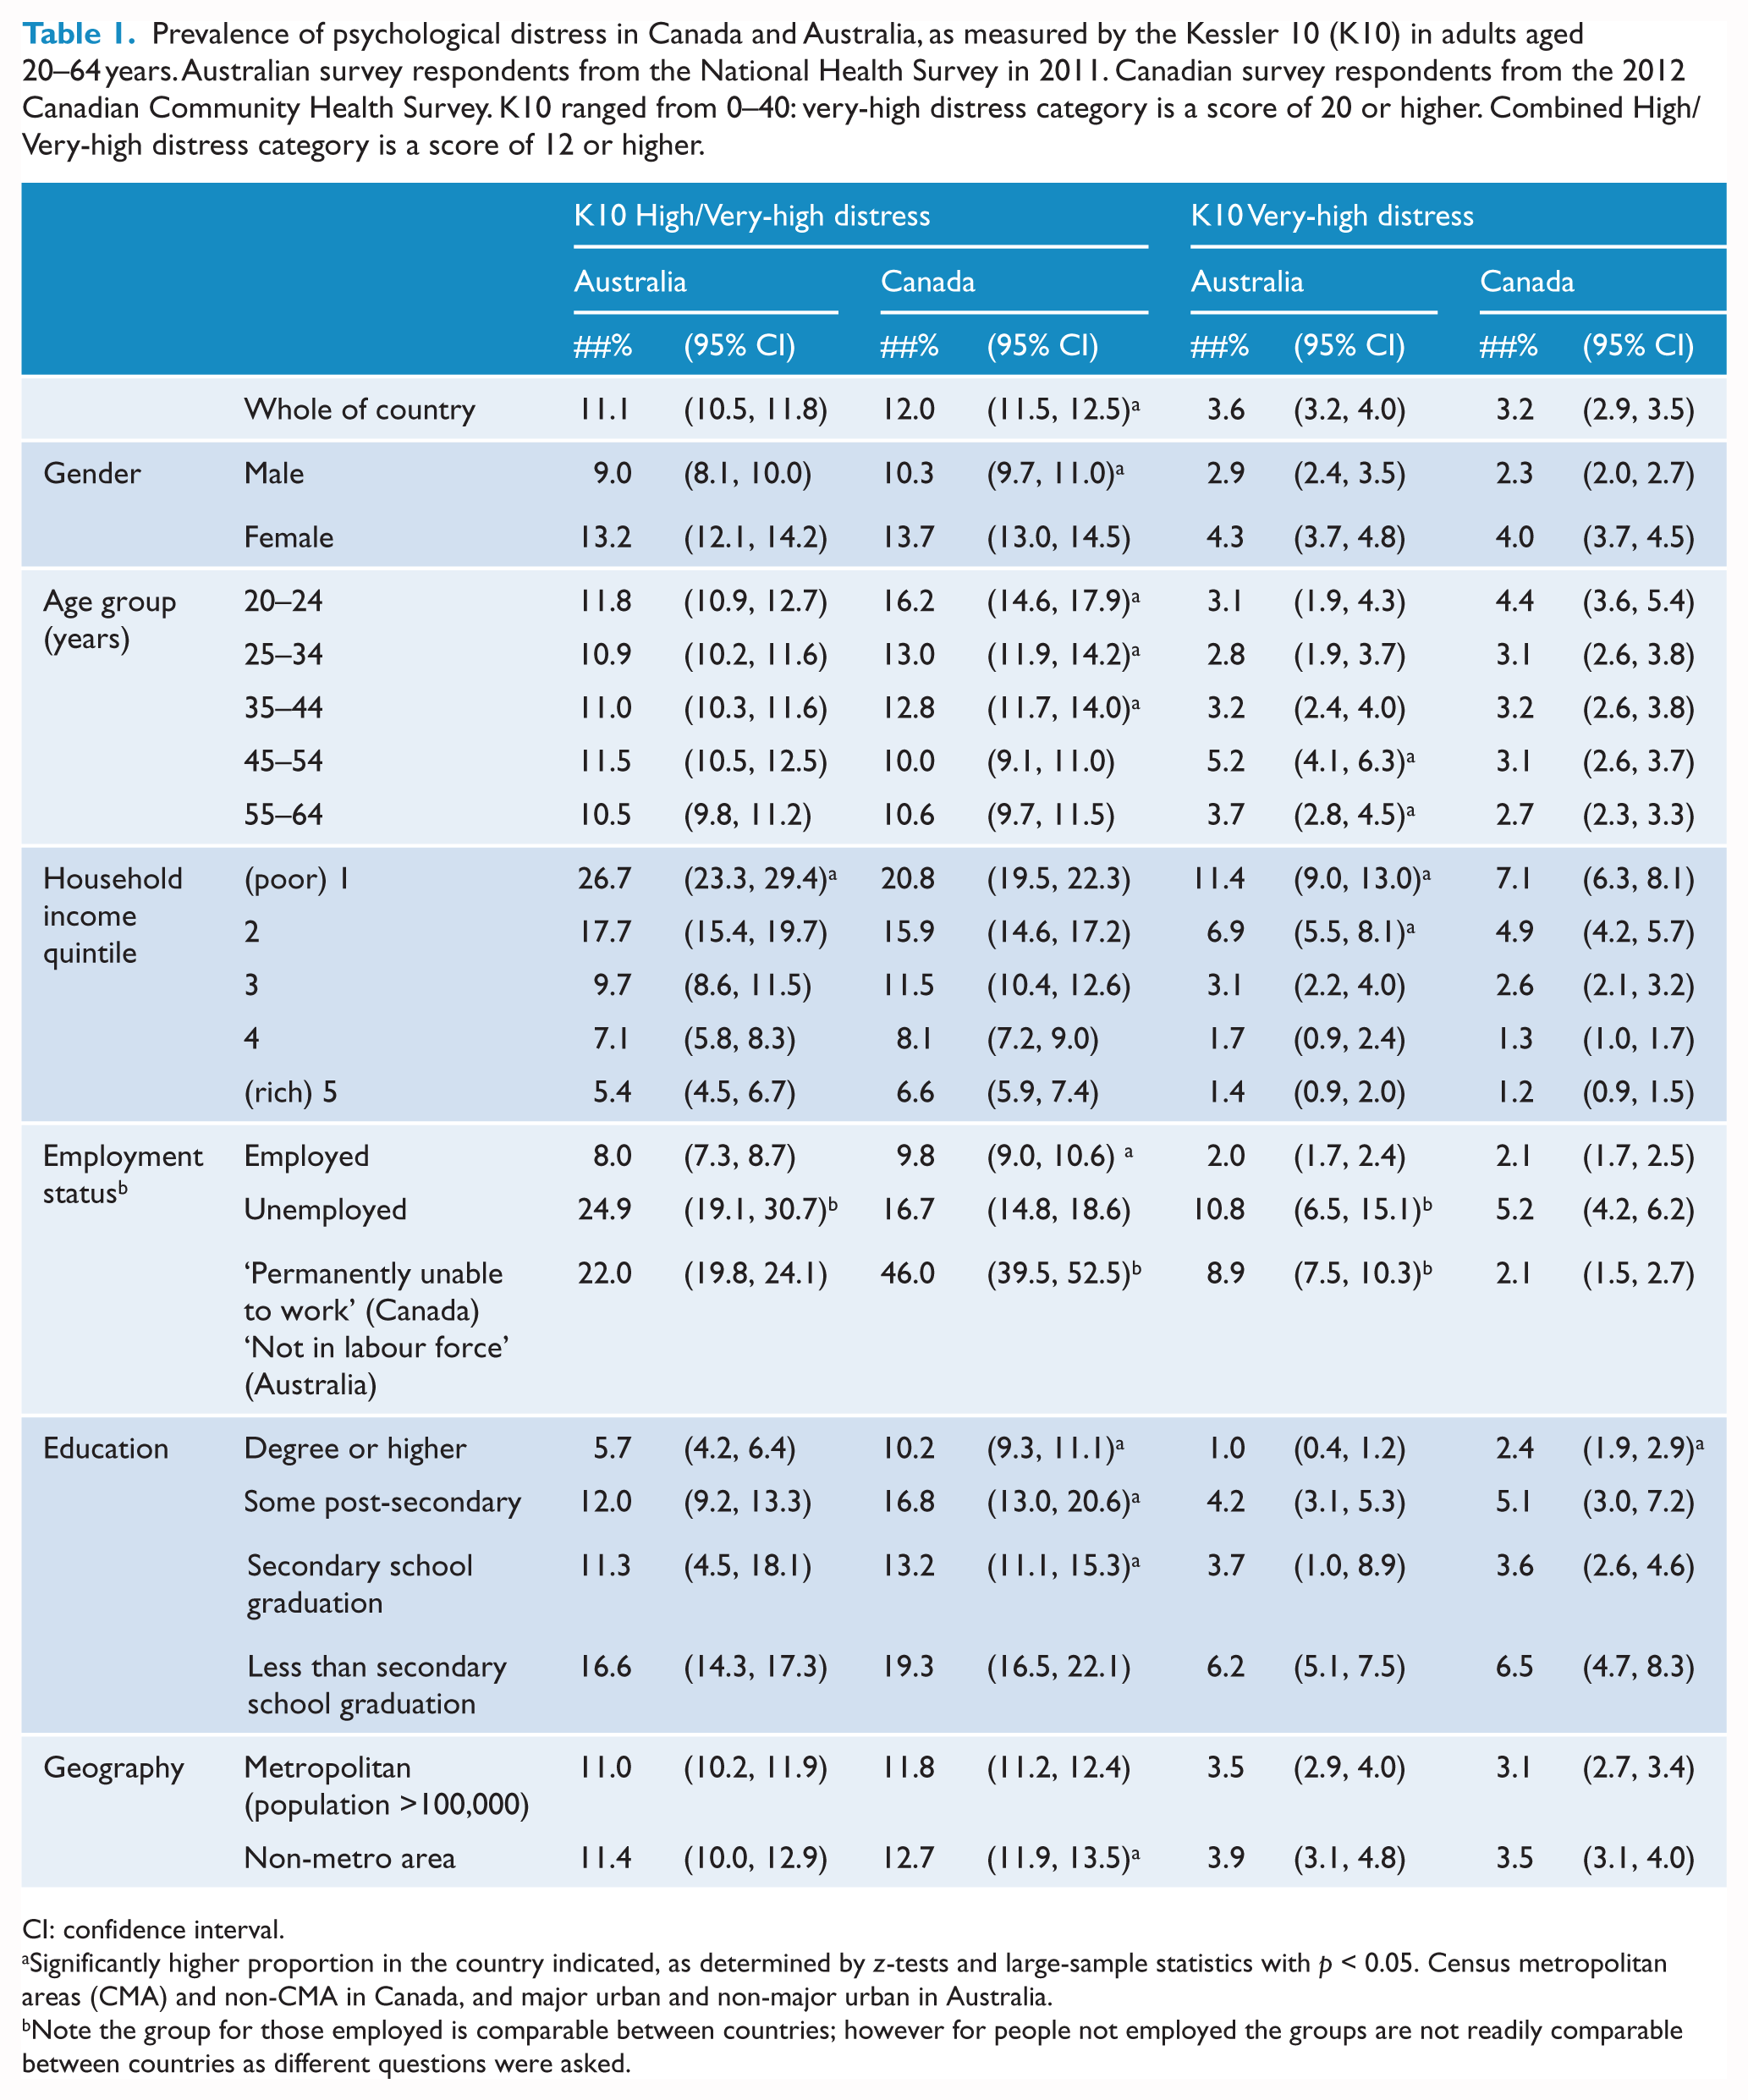
CI: confidence interval.
Significantly higher proportion in the country indicated, as determined by z-tests and large-sample statistics with p < 0.05. Census metropolitan areas (CMA) and non-CMA in Canada, and major urban and non-major urban in Australia.
Note the group for those employed is comparable between countries; however for people not employed the groups are not readily comparable between countries as different questions were asked.
High/Very-high distress was associated with income in both countries, significantly affecting more people in the poorest household income quintile (21–27%) compared to richest (5–6%); see Figure 1. After adjusting for effects of age and gender, OR for High/Very-high distress in the poorest household income quintile compared to richest were 6.4 (95% CI: [5.0, 8.4]) for Australians and 3.5 (95% CI: [3.0, 4.1]) for Canadians. Adjusting for working status and education appeared to narrow the Australian/Canadian gap, see Table 1.
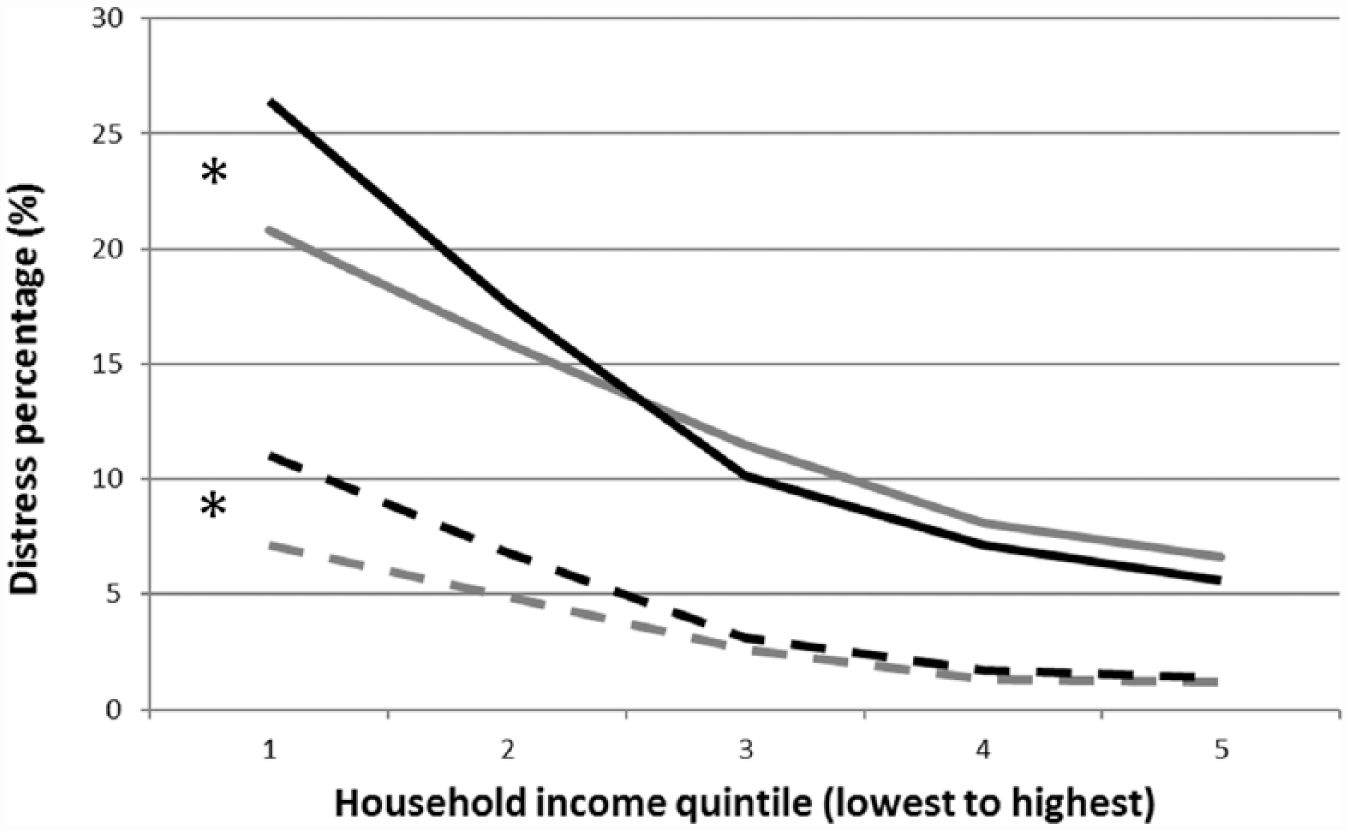
Percentage of psychological distress by household income in Australia (black) and Canada (grey). Combined high and very-high distress are represented by solid lines. Very-high distress is represented by dashed lines. The 95% confidence intervals are given in Table 1.
High/Very-high distress rates were similar in urban and rural areas in both countries: 11.0% (95% CI: [10.2, 11.9]) in urban and 11.4% (95% CI: [10.0, 12.9]) in rural Australia. Similarly, 11.8% (95% CI: [11.2, 12.4]) in urban and 12.7% (95% CI: [11.9, 13.5]) in rural Canada. In rural areas, there was higher High/Very-high distress in Canada compared to Australia with difference of 1.3% (95% CI: [0.1, 2.5]).
In those with the highest level of education, prevalence of High/Very-high distress was 5.7% (95% CI: [4.2, 6.4]) in Australia and a higher 10.2% (95% CI: [9.3, 11.1]) in Canada; see Figure 2 and Table 1.
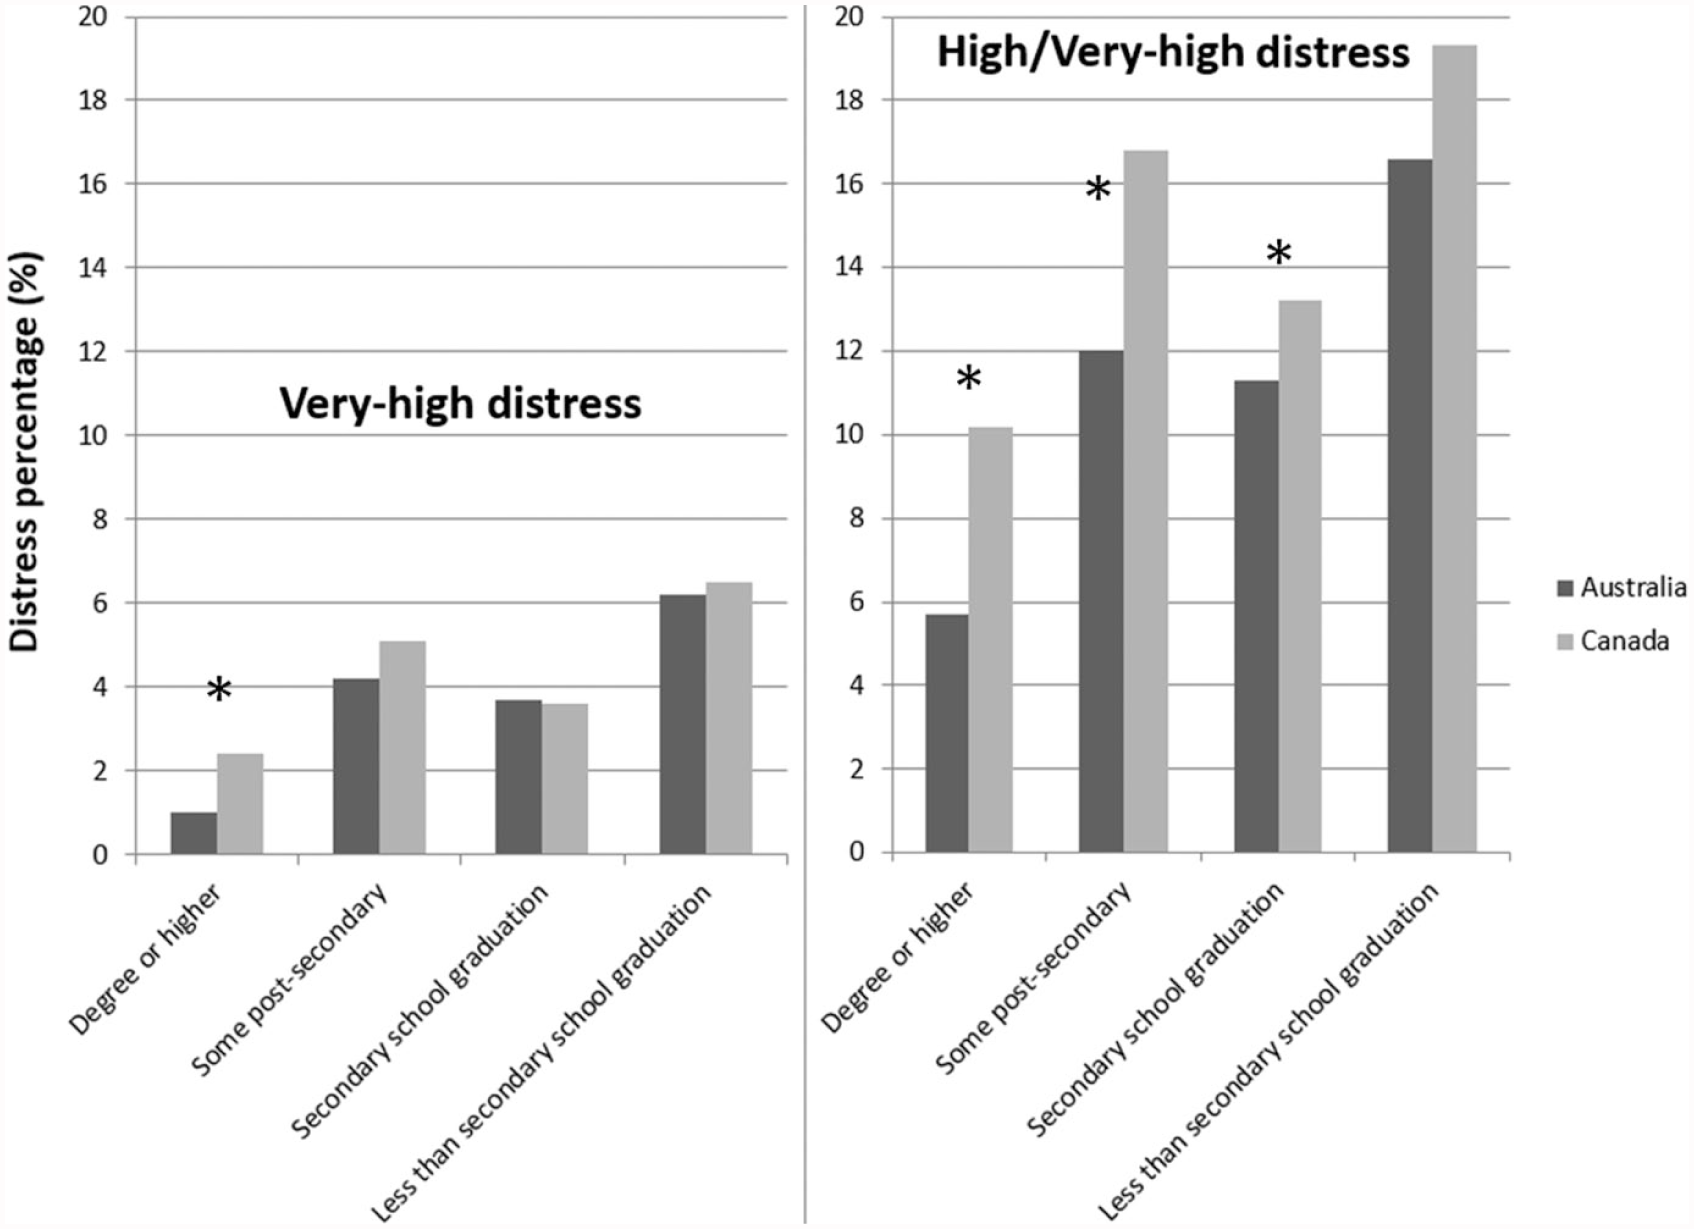
Percentage of psychological distress by education level in Canada and Australia (ages 20–64 years). Very-high distress (left-hand panel) and combined high and very-high distress (right-hand panel) are shown. The 95% confidence intervals are given in Table 1.
After adjusting for effects of age, gender, income quintile and work status, the ORs for Australians having High/Very-high distress in the least-educated group (less than secondary school) compared to those in the highest educated group were 2.2 (95% CI: [1.7, 2.9]), and for Canadians were 1.5 (95% CI: [1.3, 1.7]); see Table 2.
Relative odds of High/Very-high K10 psychological distress in adults aged 20–64 years after adjusting for multiple factors. Both Canadian and Australian results are shown for comparison.
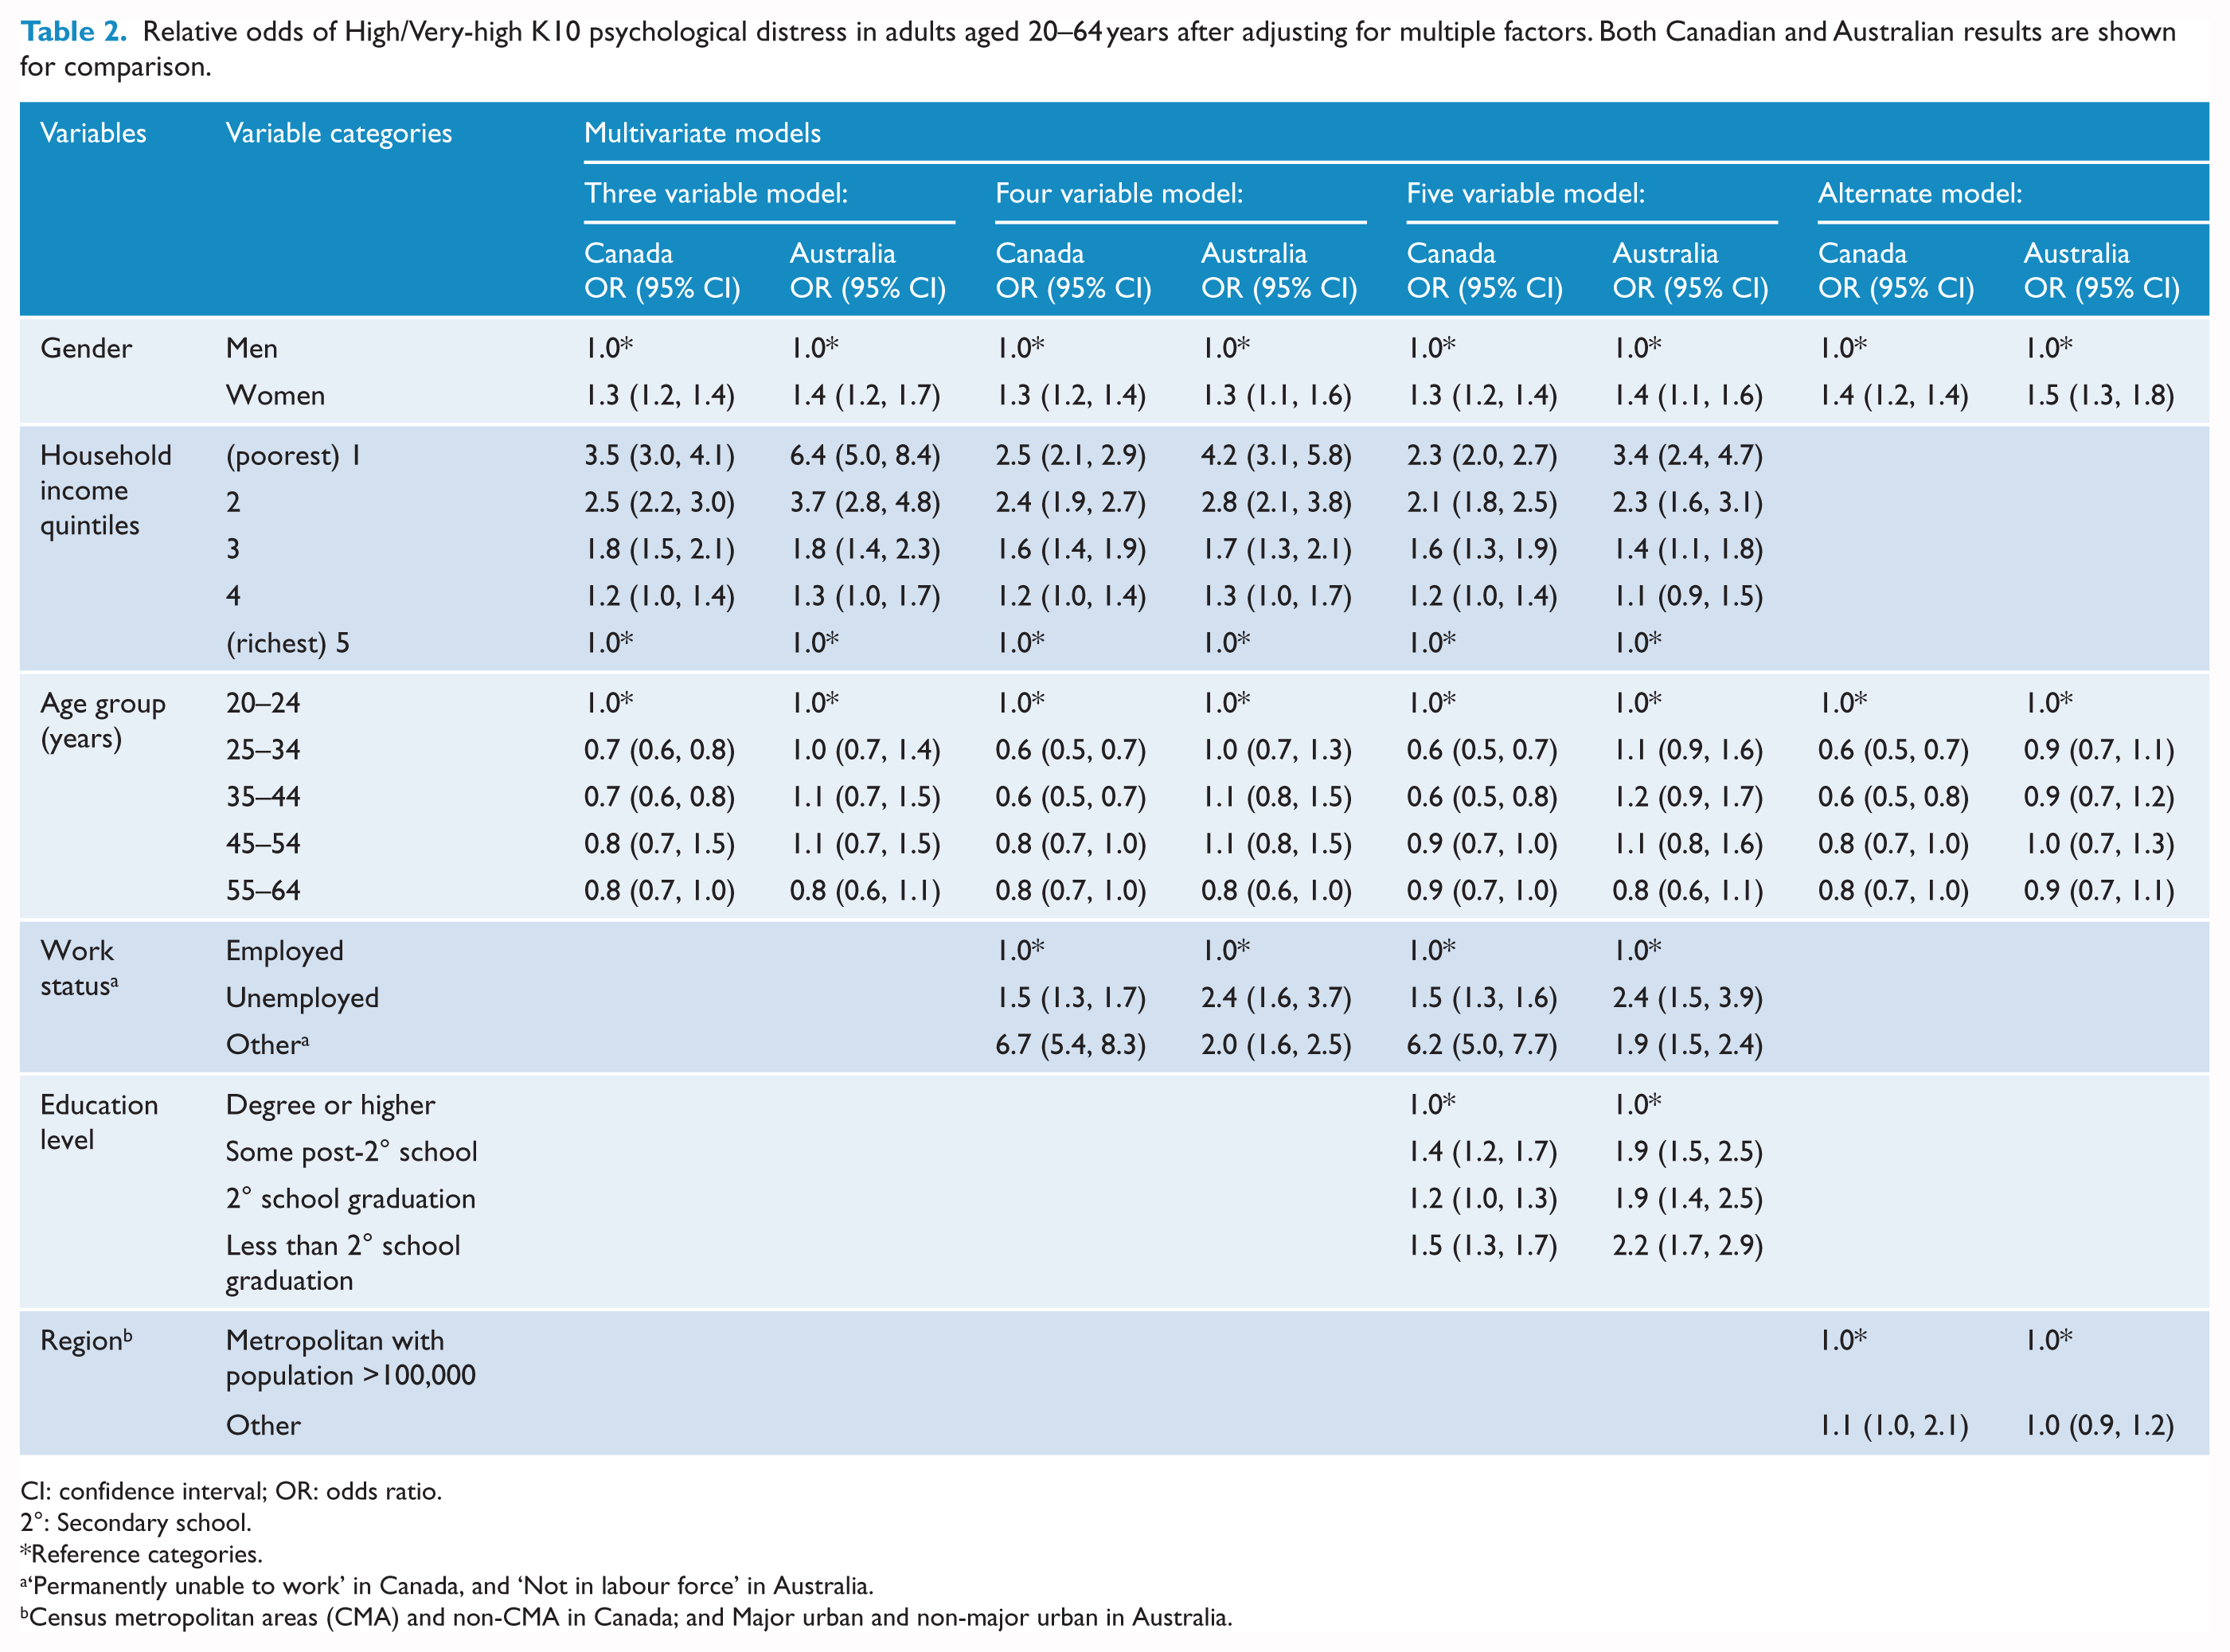
CI: confidence interval; OR: odds ratio.
2°: Secondary school.
Reference categories.
‘Permanently unable to work’ in Canada, and ‘Not in labour force’ in Australia.
Census metropolitan areas (CMA) and non-CMA in Canada; and Major urban and non-major urban in Australia.
The percentage of employed Canadians with High/Very-high distress was 9.8% (95% CI: [9.0, 10.6]), while this figure was lower in Australians at 8.0% (95% CI: [7.3, 8.7]) with the country difference at 1.8% (95% CI: [0.9, 2.7]).
After adjusting for effects of age, gender and income quintile, the relative odds for Australians having High/Very-high distress in the not-employed group (everyone who was not employed) compared to employed individuals were 2.0 (95% CI: [1.6, 2.5]), and for Canadians were 2.2 (95% CI: [2.1, 2.4]).
Lower income was associated with elevated distress in both countries, more strongly so in Australia with concentration indices of −0.32 (−0.41, −0.23) compared to −0.23 (−0.28, −0.18) for Canada; see Table 3. Figure 1 shows that distress prevalence declines rapidly with income and it is more pronounced for Australia than Canada. Inequity was evident for mental disorders in both countries, but this was not as marked as that for elevated distress, see Table 3.
Equity analyses showing the concentration indexes for High/Very-high distress and mental disorder in Canada and Australia. Concentration indexes were calculated using the ranking for household income quintile.
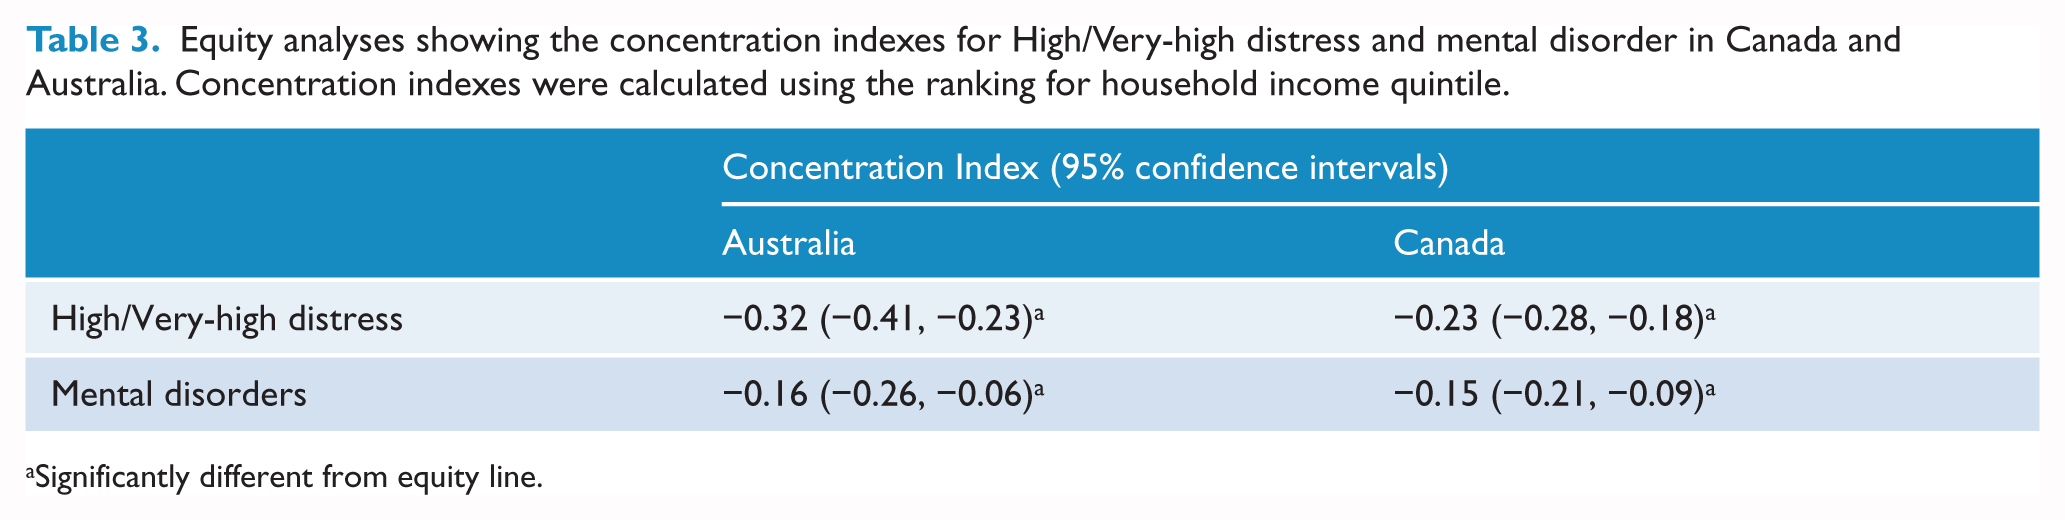
Significantly different from equity line.
There appeared to be greater inequity in the distress findings as related to socioeconomic status in Australia compared to Canada, see Figure 1. In the lowest household income quintile, Australians showed an in increase by 5.9% (95% CI: [3.7, 8.1]) in High/Very-high distress compared to Canadians, which could not be explained by sampling variation.
Multivariate regression analysis revealed more distress in Australians within the poorest household quintile compared to Canadians. After adjusting for effects of age and gender, the OR of High/Very-high distress in poorest income quintile compared to richest in Australians was 6.4 (95% CI: [5.0, 8.4]), which was higher than in Canadians with 3.5 (95% CI: [3.0, 4.1]).
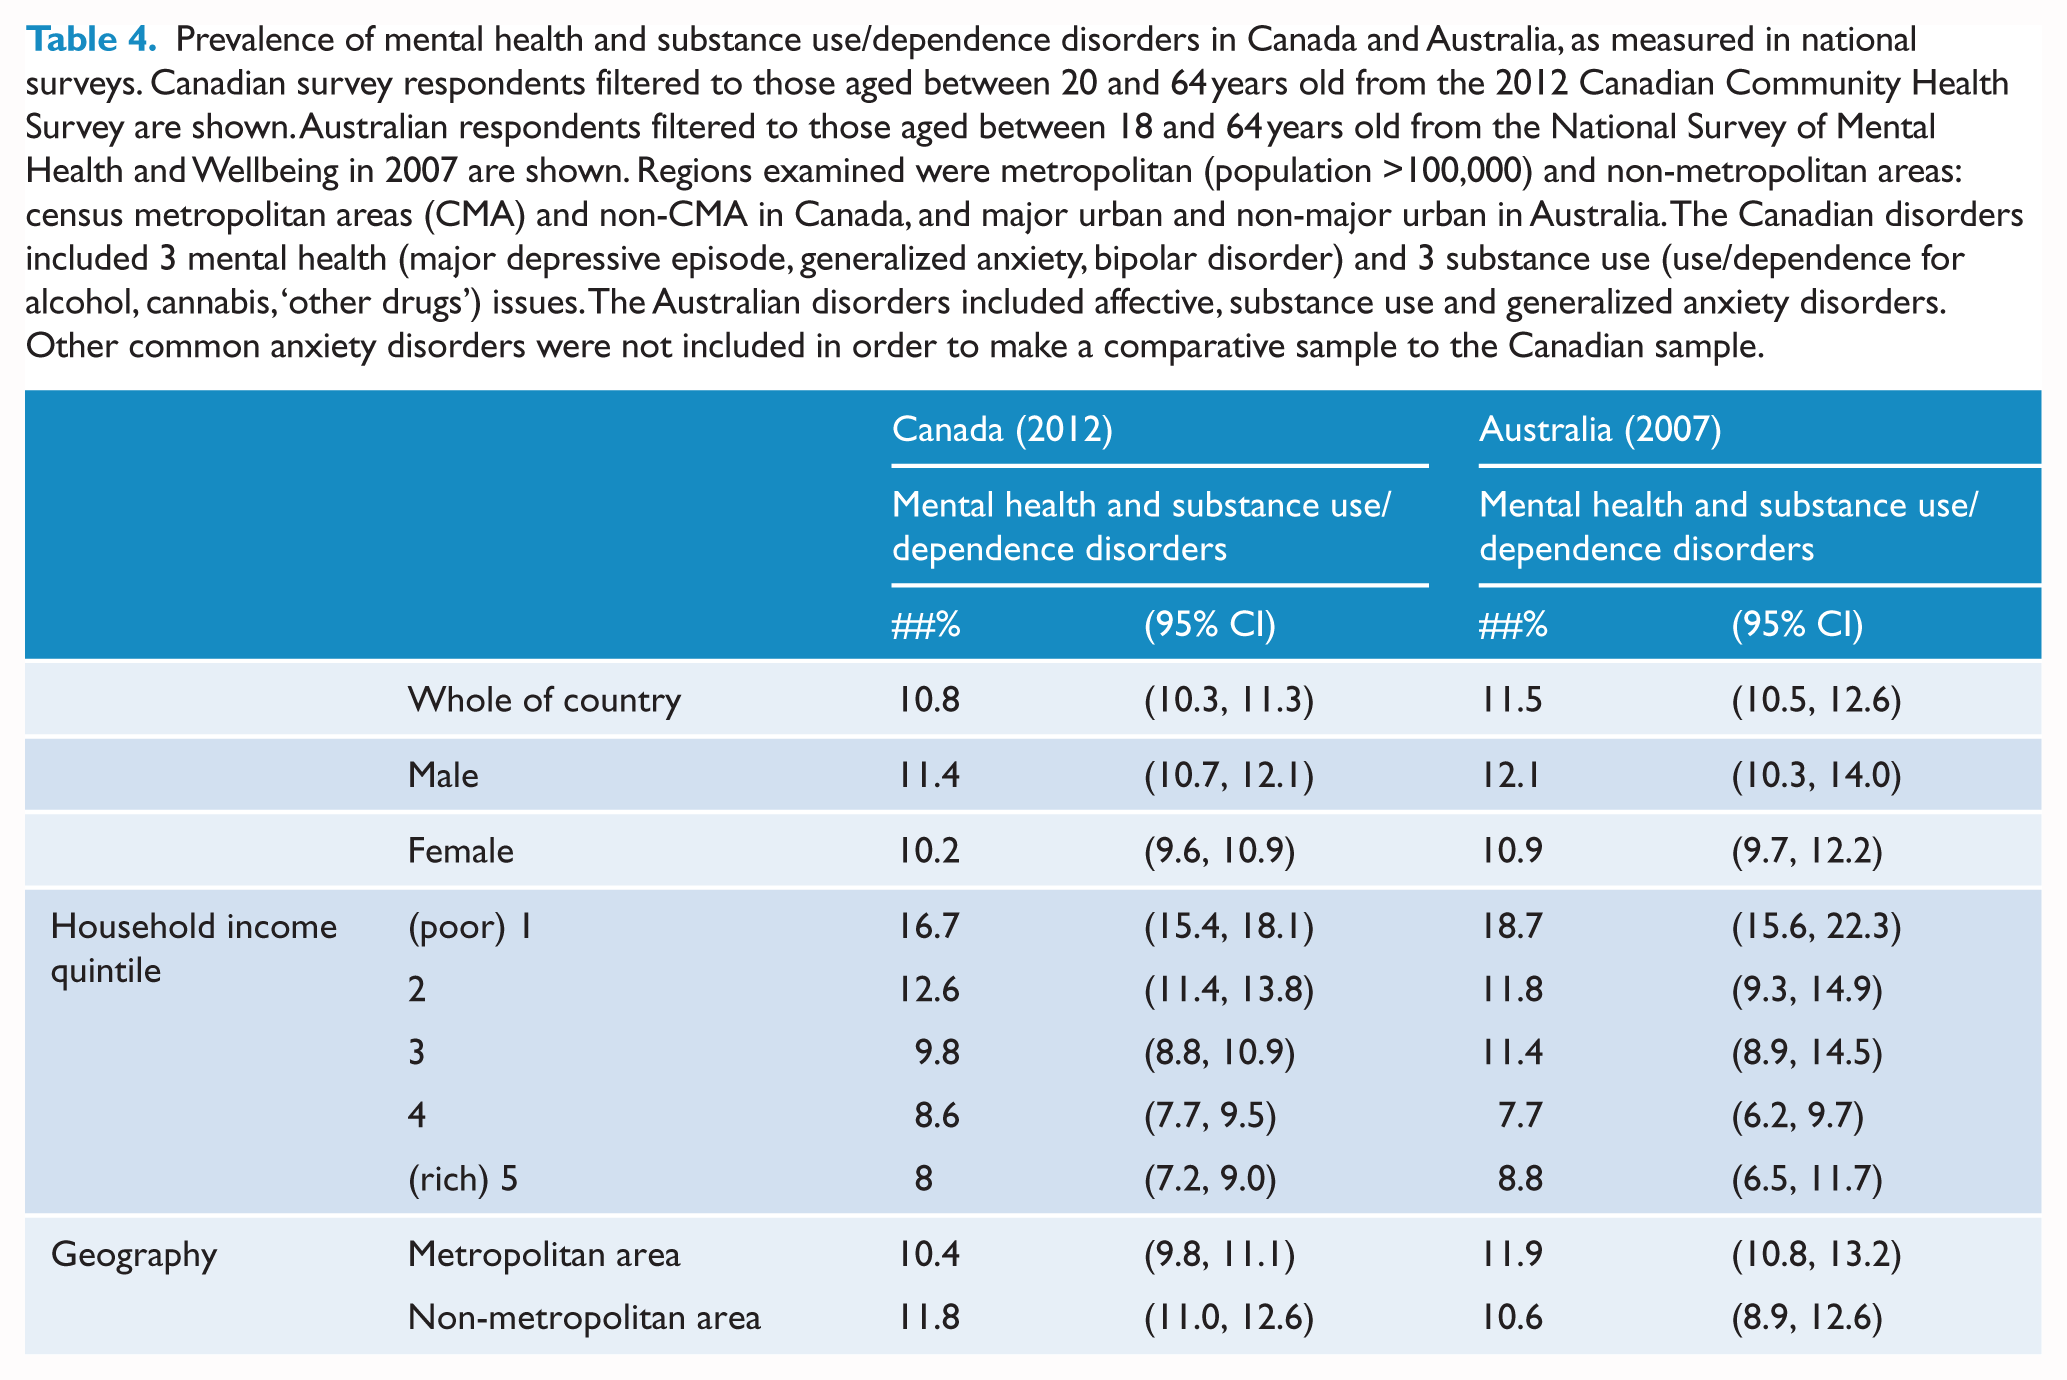
Mental disorder rates were 11.6% (95% CI: [10.5, 12.6]) in Australia and 10.8% (95% CI: [10.3, 11.3]) in Canada. Table 4 shows disorder prevalence was higher in men and those in the lowest household income quintile, which was similar inside and outside metropolitan areas. It may be noted that the confidence intervals for estimates in these Australian analyses are wider than those typically reported from NHS data, and this arises since the NSMHWB was a smaller survey.
Prevalence of mental health and substance use/dependence disorders in Canada and Australia, as measured in national surveys. Canadian survey respondents filtered to those aged between 20 and 64 years old from the 2012 Canadian Community Health Survey are shown. Australian respondents filtered to those aged between 18 and 64 years old from the National Survey of Mental Health and Wellbeing in 2007 are shown. Regions examined were metropolitan (population >100,000) and non-metropolitan areas: census metropolitan areas (CMA) and non-CMA in Canada, and major urban and non-major urban in Australia. The Canadian disorders included 3 mental health (major depressive episode, generalized anxiety, bipolar disorder) and 3 substance use (use/dependence for alcohol, cannabis, ‘other drugs’) issues. The Australian disorders included affective, substance use and generalized anxiety disorders. Other common anxiety disorders were not included in order to make a comparative sample to the Canadian sample.
Discussion
Overall, the rate of population-based elevated psychological distress as measured by a population administered K10 instrument was higher in Canada than in Australia by a small, but significant proportion close to 1%. When we consider inequities characterized by income, employment or education, judged both by relative rates of distress or in regression analyses, there is inequity apparent in both countries, and this inequity operates more powerfully in Australia. Those in poorer income quintiles in both countries have very high rates of distress, but in Australia, more than one in four individuals with low-income experience elevated distress in the last month – a rate that is more than 5% higher than the comparative Canadian finding. The trend for those in low-income quintiles to report greater distress in both countries is consistent with the extensive literature on the Income Gradient for health, where increases in income are associated with reduced incidence of mortality and morbidity (Deaton, 2002). The observation that Canadians have higher distress overall than Australians is somewhat contrary to the general expectation that countries with greater income differentials (here, Australia) might have overall poorer mental health. This suggests that influences other than income inequity may greatly impact distress outcomes. In regards to disorder rates in both countries, there is some indication that Australia may have slightly higher rates overall. However, unlike the distress results, caution is warranted in interpreting the disorder findings because surveys were conducted 5 years apart and there were other differences (discussed below) that limit the precision of these disorder estimates.
Relationship between distress and disorders
For both countries, distress and disorder findings both demonstrated an Income Gradient, since rates of distress/disorder were the highest in the poorest quintile that then progressively reduced to the lowest rates in the richest quintile. As noted in the introduction, elevated distress indicate non-specific, psychosocial distress and not the presence of mental disorders in individuals, and this is apparent in our findings as the distress and disorder rates were not exactly the same. However, at the population level, distress and disorder rates exhibit a similar pattern of results, and behave in similar ways for the same covariates. Because of this, distress rates are used globally as a reliable mental health indictor for a country (Enticott et al., 2016; Kessler et al, 2002; Slade et al., 2011).
Policy implications for countries
The information presented in this study does not represent any kind of pure experiment, not even a natural one. Its focused comparisons can be seen to complement the extensive internationally comparative work conducted by organizations such as the Organisation for Economic Co-operation and Development (OECD) and WHO. Given the similarities in income level and other features between Australia and Canada, the two countries might reasonably be seen as facing similar challenges in healthcare delivery, and they are as close a pair of comparators as can be found internationally. Hence, the findings may be used to pose reasonable questions and make suggestions to policy-makers and planners in each country. Other developed countries are facing similar challenges from the rising burden of disease attributable to mental health issues, including high demands on healthcare delivery and may also benefit from these findings and policy suggestions. Low- and middle-income countries may benefit by learning how the health systems in these two high resource countries may affect population mental health particularly in regard to equity, which may influence visions for the future in their country (Saraceno et al., 2007).
Planning and national strategy considerations
This population-level evidence supports the convincing evidence base that is calling for greater translation of evidence into mental health practice (Caldas De Almeida, 2015; Wahlbeck, 2015). At the population-level, among people in the poorest income quintile in both countries, about one-in-five people have a mental disorder – twice the national average in both countries. Also among people in the poorest quintiles, one-in-four Australians and one-in-five Canadians report High/Very-high distress – twice the national average in both countries. Key messages for policy-makers are therefore as follows:
Partial Universal Health (note that both Canadian and Australian universal health systems provide incomplete coverage) is not a complete leveller for the impact of social determinants of mental health such as low income.
Interventions targeting elevated distress and mental disorders may achieve the biggest impact for people with low incomes. Although evidence-based interventions are known to help people with mental disorders, recent research shows that provision of services is biased towards the least disadvantaged (richest) areas in Ontario, Canada (Kurdyak et al., 2014), and Australia (Meadows et al., 2015), despite a higher need in poorer areas. This supports the need to improve access to mental health services for people on lower incomes. To achieve greater equity, service planners may consider distributing mental health services according to a needs scale, with areas of greater need (i.e. lower socioeconomic populations) receiving greater access to appropriate services.
The partial universal health systems in Canada and Australia have key differences; therefore, how might policy-makers respond in countries with findings similar to Australia with inequities in mental health that are large and more dramatic than in Canada? To give emphasis to the point, if we consider the relatively elevated risk of distress to be avoidable, then approximately 200,000 more Australians experience high levels of distress every month compared to Canadians of similar demo-socioeconomic status. Conversely, approximately 300,000 additional Canadians would experience high levels of distress every month if rates for those with low incomes matched those in Australia. In Australia, a question may be posed as to whether existing services effectively make themselves available to people with lower incomes. There is substantial evidence that this is not the case (Meadows et al., 2015) and that rather such services are concentrated in wealthier areas despite being funded through a mechanism that was designed with the intent of universality. The message for policy-makers is as follows:
More mental health services are required in low-income areas.
In countries with significant income inequality like the United States, a known barrier to accessing healthcare is cost (Devoe et al., 2007; Kullgren et al., 2012). In Canada, the effects of income inequality might be mitigated by the prohibition of gap-fees. Unlike the Canadian system, gap-fees are unrestricted for federally funded healthcare services in Australia (Johar et al., 2017). In the 2014–2015 financial year, less than a quarter (22.4%) of consultations for all services subsidized by the national universal insurer (called Medicare) incurred a gap-fee in Australia (Commonwealth of Australia, 2015a). However, when incurred, the average gap payment in Australia during this time period was AUD54.60 (or 67.6% higher than the universal insurance amount) (Commonwealth of Australia, 2015a). Although further examination will help to clarify the impact of unrestricted gap-fees on access to health services in Australia (Johar et al., 2017), it is possible that these payments contribute to the greater inequity in mental health indicators in Australians in the lowest income quintile compared to Canada.
Although access to mental healthcare provided by physicians in Canada is not impeded by gap-fees, it should be noted that this universal insurance does not extend to other healthcare professionals such as psychologists. As such, access to psychotherapy and other professions is limited by cost barriers, especially for Canadians without workplace health benefits (Gratzer and Goldbloom, 2016; Patten et al., 2016). The population-level mental health indicators reported here may provide only a suggestion that the universal subsidized access to psychologists for Australians has perhaps some effect by contributing to the overall national rate of less elevated distress by 1%, although it is noted that other factors may also be involved in ameliorating these differences.
Limitations
The study compares data that were collected differently, with the Canadian data taken from a survey focused specifically on mental health (CCHS) and the Australian data drawn from a more general health survey (the NHS). It is possible that these different emphases and survey formats led respondents to approach the K10 component of the surveys from a different point of preparation. This differential cueing may have introduced a source of bias, for example, the emphasis on mental health in the CCHS may have introduced a priming effect, whereby respondents were cued towards greater recall of emotional or psychological experience, which may in turn have led to the greater reporting of psychological distress, as measured by the K10. If this was the case, we might have expected a similar effect in our comparison of Australian mental health survey (NSMHWB) data and general health survey (NHS) data, however, no such pattern was observed (Enticott et al., 2016). While such bias might affect the overall figures reported in the study, it seems likely that, if present, the effect would operate consistently across surveys. We therefore do not expect this potential source of bias to invalidate the findings regarding differences in association between the two surveys.
While both countries have well-conducted national survey data to draw upon, the Canadian data on mental disorders used here was of better quality than the Australian data. The Australian NSMHWB had a smaller sample size with greater non-response than its predecessor in 1997, and the NSMHWB in 2007 is much smaller than the CCHS. A key reason why comparisons of disorder rates between the NSMHWB and the CCHS can only be viewed as tentative is that the confidence intervals of estimates from the NSMHWB are relatively broad, limiting the precision of comparisons. Also, unlike the CCHS, the NSMHWB is not a routinely implemented national survey; at present, there is no indication of when another such survey might occur in Australia. Australian planners and policy-makers should be aware that in this respect, the country is falling well behind Canada at the time of writing. We would argue that the commissioning of another Australian mental health survey, with features included to enable the examination of disparities such as those highlighted here, should be a national priority.
Conclusion
This cross-national study examined rates of elevated psychological distress and mental disorders in Canada and Australia in order to gain insight into the mental health of people living in these two somewhat similar resource-rich countries characterized by extensive non-metropolitan and rural regions, as well as significant areas of socioeconomic deprivation. By comparing equivalent population-level mental health indicators, we were able to demonstrate for the first time that Australians in the lowest income quintile (over 5 million people) have over a 5% higher risk of elevated psychological distress compared to their low-income Canadian counterparts. This highlights the importance of conducting routine population-level data studies so that cross-national results can be reliably compared, as encouraged by the WHO in previous decades. Based on the findings of this study, we have articulated a range of recommendations for Canadian and Australian policy-makers that we anticipate will support the provision of more equitable mental healthcare services for all citizens. Lessons learnt are of relevance globally as most governments are recognizing the growing burden resulting from mental health issues.
Footnotes
Acknowledgements
This work was made possible by members of ICES in Toronto, including Alex Kopp as Chief Data Analyst, Julie Amato as Program Administrator, Paul Kurdyak as Senior Scientist and Program Lead of Mental Health & Addictions and Rick Glazier as Senior Core Scientist and Program Lead of Primary Care & Population Health Research.
Declaration of Conflicting Interests
The author(s) declared no potential conflicts of interest with respect to the research, authorship and/or publication of this article.
Funding
The author(s) disclosed receipt of the following financial support for the research, authorship, and/or publication of this article: In order to undertake this study, the first author was awarded an Overseas Scholar Fellowship from the Australian Primary Health Care Research Institute (Grant/Award Number: ‘Overseas Scholar Fellowship – 2014’) which is supported by a grant from the Australian Government Department of Health. This Fellowship study was also supported by the Institute for Clinical Evaluative Sciences (ICES), which is funded by an annual grant from the Ontario Ministry of Health and Long-Term Care (MOHLTC). This paper uses unit record data from the Australian National Health Survey (NHS) in 2011–2012 and the National Survey of Mental Health and Wellbeing (NSMHWB) in 2007, which were both funded by the Australian Government and undertaken by the Australian Bureau of Statistics (ABS). This paper also reports data from the Canadian Community Health Survey (CCHS) on mental health in 2012, which was available using the Public Use Microdata File platform. The CCHS-mental health (2012) was funded by the Canadian Government and undertaken by Statistics Canada. The opinions, results and conclusions reported in this paper are those of the authors and are independent from the ABS, StatsCan and supporting and funding sources. No endorsement by ICES, the Ontario MOHLTC or the Australian Government is intended or should be inferred.
References
Supplementary Material
Please find the following supplemental material available below.
For Open Access articles published under a Creative Commons License, all supplemental material carries the same license as the article it is associated with.
For non-Open Access articles published, all supplemental material carries a non-exclusive license, and permission requests for re-use of supplemental material or any part of supplemental material shall be sent directly to the copyright owner as specified in the copyright notice associated with the article.