
Abstract
Background:
Evidence of brain structural and functional alterations have been implicated in patients with somatization disorder (SD). However, little is known about brain functional connectivity in SD. In the present study, resting-state functional magnetic resonance imaging (fMRI) and graph theory were used to obtain a comprehensive view of whole-brain functional connectivity and to investigate the changes of voxel-wise functional networks in patients with SD.
Methods:
Twenty-five first-episode, medication-naive patients with SD and 28 age-, sex- and education-matched healthy controls (HCs) underwent resting-state fMRI. The graph theory approach was employed to analyze the data.
Results:
Compared to the HCs, patients with SD showed significantly increased functional connectivity strength in the right inferior temporal gyrus (ITG). There is a significant positive correlation between the z-values of the cluster in the right ITG and Hamilton Anxiety Scale scores.
Conclusions:
Our findings indicate that there is a disruption of the functional connectivity pattern in the right ITG in first-episode, treatment-naive patients with SD, which bears clinical significance.
Introduction
Somatization disorder (SD) is an illness of multiple somatic complaints in multiple organ systems and leads to significant lesions or the seeking of treatment. The organ systems typically referred to are the gastrointestinal, cardiorespiratory, urogenital, other internal systems, or the musculoskeletal system. The disorder has a prevalence rate of 4–7% in the general population and occurs more often in females; some investigations have shown sex differences of about 1:5 (male to female) (Rief et al., 2001; Sadock et al., 2007). Patients with SD suffer significant psychosocial disability and functional impairment, which lead to a high rate of health care burdens that are comparable with those of some severe mental illnesses, such as schizophrenia and depression (Barsky et al., 2005; Krishnan et al., 2013).
Despite progress made in studies of SD patients, the pathophysiology of SD still remains unclear. Brain structural and functional alterations related to SD have been explored with neuroimaging techniques. For example, a single photon emission computed tomography study of patients with SD described hypoperfusion, primarily in the frontal, prefrontal, temporoparietal, and cerebellar areas (Garcia-Campayo et al., 2001). Also, in a positron emission tomography scanning study, somatization accompanied by anxiety was shown to be associated with decreased metabolism in brain regions, such as the ventrolateral prefrontal cortex, ventral anterior cingulate cortex (ACC), and anterior insular gyrus (Brody et al., 2001). In addition, a structural magnetic resonance imaging (MRI) study revealed smaller mean volumes of the amygdala in patients with SD compared to healthy subjects (Atmaca et al., 2011). Also, a previous study with nuclear magnetic resonance spectroscopy showed enhanced activity in the posterior cingulate cortex (PCC) in SD patients relative to healthy subjects (Fayed et al., 2012). Moreover, using functional MRI (fMRI), Lemche et al. found that SD patients had alterations of anterior ventral precuneus, PCC and anteromedial thalamus when they were in different emotional states (happy or sad) (Lemche et al., 2013). These findings provide evidence for brain structural and functional alterations in SD patients, but the changes in brain functional connectivity (FC) in SD patients remain unclear.
Previously, seed-based analysis and independent component analysis (ICA) have often been used to analyze resting-state fMRI data. Seed-based analysis estimates the strength and significance of pairwise relationships between the seed and all other regions, but it only provides a series of relationships between any given region and all other regions without taking into account the full pattern of connectome. The ICA approach identifies sets of brain regions that are separable on the basis of statistical patterns in their dynamic time series; it separates the human brain into many independent components, but does not consider the patterns of connectivity between these components. Neither seed-based analysis nor the ICA approach can fully characterize the brain functional connectome (Hyvärinen et al., 2004; Joel et al., 2011), which is necessarily dynamic as it underpins a multitude of brain states involving emotion, cognition, behavior, perception, and sensation (Carhart-Harris and Friston, 2010; Deco et al., 2011). Therefore, it is meaningful to investigate possible changes in the functional connectome.
Graph theoretical analysis is an unbiased approach that could provide a powerful framework for characterizing the functional connectome within the whole-brain network (Stam and Reijneveld, 2007; Xia and He, 2011). In particular, functional connectivity strength (FCS), which is based on the graph theory method to identify functional hubs of human brain networks, has attracted substantial attention (Liang et al., 2013). Unlike seed-based analysis or the ICA approach, FCS measures the relationship of a given region with the entire functional connectome, and not its relationship to individual regions or to separate larger components. Thus, FCS allows us to characterize the functional connectome. Furthermore, the FCS has shown a striking spatial correlation with regional cerebral blood flow, and this correlation was stronger in the default mode network (DMN) (Liang et al., 2013).
In the present study, we applied graph theoretical analysis to explore the altered FCS in the voxel-wise functional networks between patients with first-episode, drug-naive SD and healthy controls (HCs). Based on previous studies (Atmaca et al., 2011; Brody et al., 2001; Fayed et al., 2012; Garcia-Campayo et al., 2001; Lemche et al., 2013), we hypothesized that the patients with SD would have significantly altered FCS in certain brain regions, especially in the brain regions of the DMN. We also expected that the alterations of FCS could be correlated with clinical variables.
Materials and methods
Subjects
Twenty-six right-handed patients with SD were recruited from the Mental Health Center, The First Affiliated Hospital of Guangxi Medical University, China. The patients were recruited consecutively and diagnosed by using the Structured Clinical Interview of the DSM-IV (SCID) (First et al., 1997). All patients were at their first episode and medication-naive. Exclusion criteria for patients included: (1) other Axis I psychiatric disorders such as schizophrenia, schizoaffective disorder, bipolar disorders, anxiety disorders, or severe Axis II personality disorders or mental retardation; (2) a history of organic brain disorders, neurological disorders, cardiovascular diseases or other serious physical illness provided by personal history or laboratory analysis; and (3) any contradictions to undertake an MRI scan. However, co-morbidity with major depressive disorder (MDD) was allowed.
Thirty right-handed healthy subjects were recruited from the community in the same period. None of them had a history of serious medical or neuropsychiatric illness, craniocerebral operations, or a family history of major psychiatric or neurological illness in first-degree relatives.
All subjects were evaluated by the Hamilton Depression Scale (HAMD) (Hamilton, 1960), the Hamilton Anxiety Scale (HAMA) (Hamilton, 1959), and the somatization subscale of the Symptom Check List 90 (SCL-90) (Derogatis et al., 1976) at the scan day. The 17-item HAMD and 14-item HAMA were used to measure the severity of depression and anxiety symptoms, respectively. The somatization subscale of SCL-90 was used to assess somatic symptom severity.
All subjects were given information about the procedures and gave written informed consent. The study was approved by the Ethics Committee of The First Affiliated Hospital, Guangxi Medical University.
Data acquisition
Imaging was obtained by a 3.0 T Siemens scanner (Siemens, Erlangen, Germany) located in The First Affiliated Hospital, Guangxi Medical University. To minimize head movement and reduce scanner noise, foam padding and earplugs were used. During the scanning, subjects were instructed to lie still with their eyes closed but not fall asleep. Functional images were obtained with an echo-planar imaging (EPI) sequence. The following parameters were used for functional imaging: repetition time/echo time = 2000/30 ms, slices = 30, thickness = 4 mm, gap = 0.4 mm, field of view = 24 cm, flip angle = 90°, and data matrix = 64×64. For each subject, the fMRI scan lasted for 500 s and 250 volumes were obtained.
Data preprocessing
Functional images were preprocessed using the statistical parametric mapping software package SPM8 (www.fil.ion.ucl.ac.uk/spm). First, the fMRI time-series were corrected for slice timing and realigned to the first functional scan to correct for head motion. The subjects with head movement exceeding 2.0 mm maximum displacement in x, y, or z and 2° of angular motion in any direction were excluded from this study. The mean motion, the root mean squares of both overall head motion displacement and rotation, was calculated to determine the comparability of head movement across groups (Van Dijk et al., 2012). By combining affine transformation and non-linear deformations, all realigned functional images were normalized to the Montreal Neurological Institute (MNI) template in SPM8 and each voxel was resampled to 3×3×3 mm3. The images were not smoothed to avoid introducing artificial local spatial correlations. Afterwards, the resulting data were further temporally band-pass filtered (0.01–0.08 Hz) and linear detrended to reduce the effects of low-frequency drift and high-frequency physiological noises. Finally, several sources of spurious covariates, including six head motion parameters obtained by rigid body correction, signals from a region centered in the white matter and the ventricular region of interest (ROI), were removed by linear regression.
Whole-brain voxel-wise functional connectivity analysis
Recently, studies have demonstrated that different results are generated by different spatial scales or different brain parcellation schemes (Hayasaka and Laurienti, 2010; Wang et al., 2009; Zalesky et al., 2010). Additionally, Hayasaka suggested that it is preferable to use high spatial resolution in graph analysis (Hayasaka and Laurienti, 2010). Therefore, whole-brain voxel-wise functional networks were applied in this study. To obtain a whole-brain functional connectivity matrix for each subject, Pearson’s correlations between the time series of pairs of brain voxels were calculated. A binary gray matter mask created by SPM8’s gray matter probability template was applied to the computations, and yielded a total volume in the mask of 67,541 voxels. Negative correlations in the resulting correlation matrix were set to zero for each subject. The mean value of functional connectivity between each voxel and all other voxels in the gray matter mask was defined as the FCS value for this given voxel. To average and compare the FCS maps across subjects, the maps were then standardized to z-scores as described in a previous study (Buckner et al., 2009). Such a FCS measure is regarded as degree centrality of weighted networks (Buckner et al., 2009; Zuo et al., 2012). In the present study, FCS was employed because of its high test-retest reliability, although there were other network metrics which could characterize regional centrality (Wang et al., 2011). It is especially worth noting that regions with high FCS play important roles in brain networks, namely hubs. The mean FCS maps of the patient group and control group are presented in Figure 1.
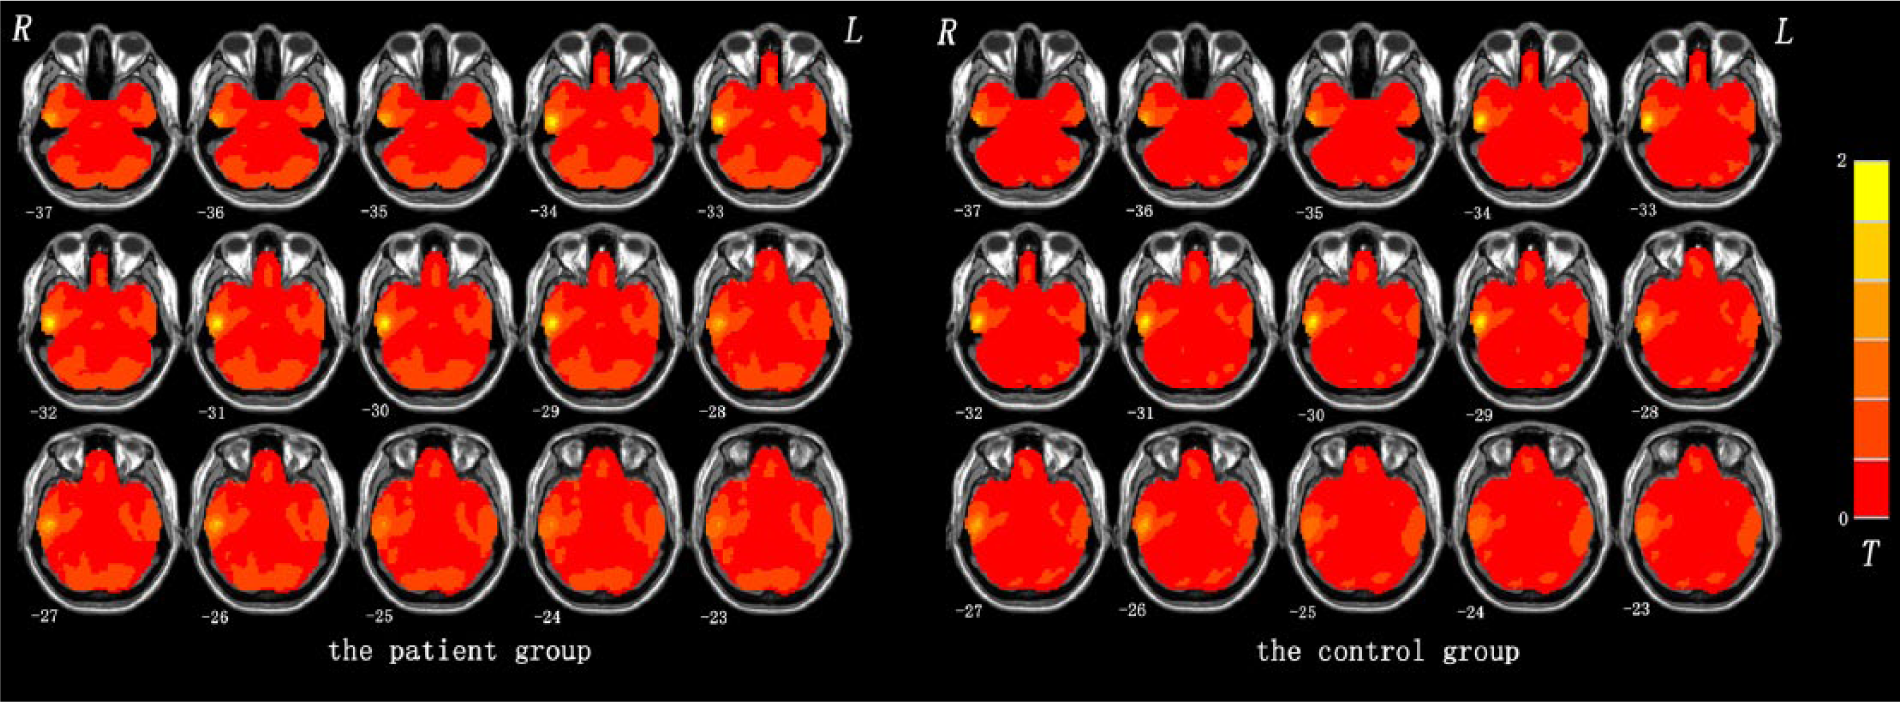
Mean functional connectivity strength (FCS) maps within the patient group and control group. The color bar represents the strength of FCS.
Statistical analysis
All FCS maps were spatially smoothed with an isotropic Gaussian kernel (full-width at half-maximum = 6 mm) before statistical analysis. Afterwards, a voxel-based two-sample t-test was used to compare the differences in FCS maps between the SD patients and HCs. The resulting statistical map was corrected for multiple comparisons to a significance level of p < 0.05 by combining an individual voxel p < 0.05 and cluster size > 324 mm3, using the AlphaSim program in the Resting-State fMRI Data Analysis Toolkit (REST) (Song et al., 2011). Considering both the individual voxel probability threshold and the cluster size, this correction was performed by using Monte Carlo simulations to calculate the probability of false-positive detection (Forman et al., 1995). Given that resting-state FCS could be affected by micromotions from volume to volume (Power et al., 2012), we computed the framewise displacement (FD) values for each subject, and the mean FD was applied as a covariate in the statistical models.
After testing normality, the relationship of the FCS values in regions with significant group differences and clinical symptom severity (the severity of anxiety, depression or somatic symptoms) was identified using whole-brain voxel-based correlation analyses. The statistical results were corrected using the AlphaSim program in the REST software (Song et al., 2011), and the significance levels were set at p < 0.05 (AlphaSim corrected, combined height threshold p < 0.01 and a minimum cluster size > 270 mm3). The two-sample t-test and chi-squared test were used to compare the demographic and clinical data (p < 0.05).
Results
Demographics and clinical characteristics of the participants
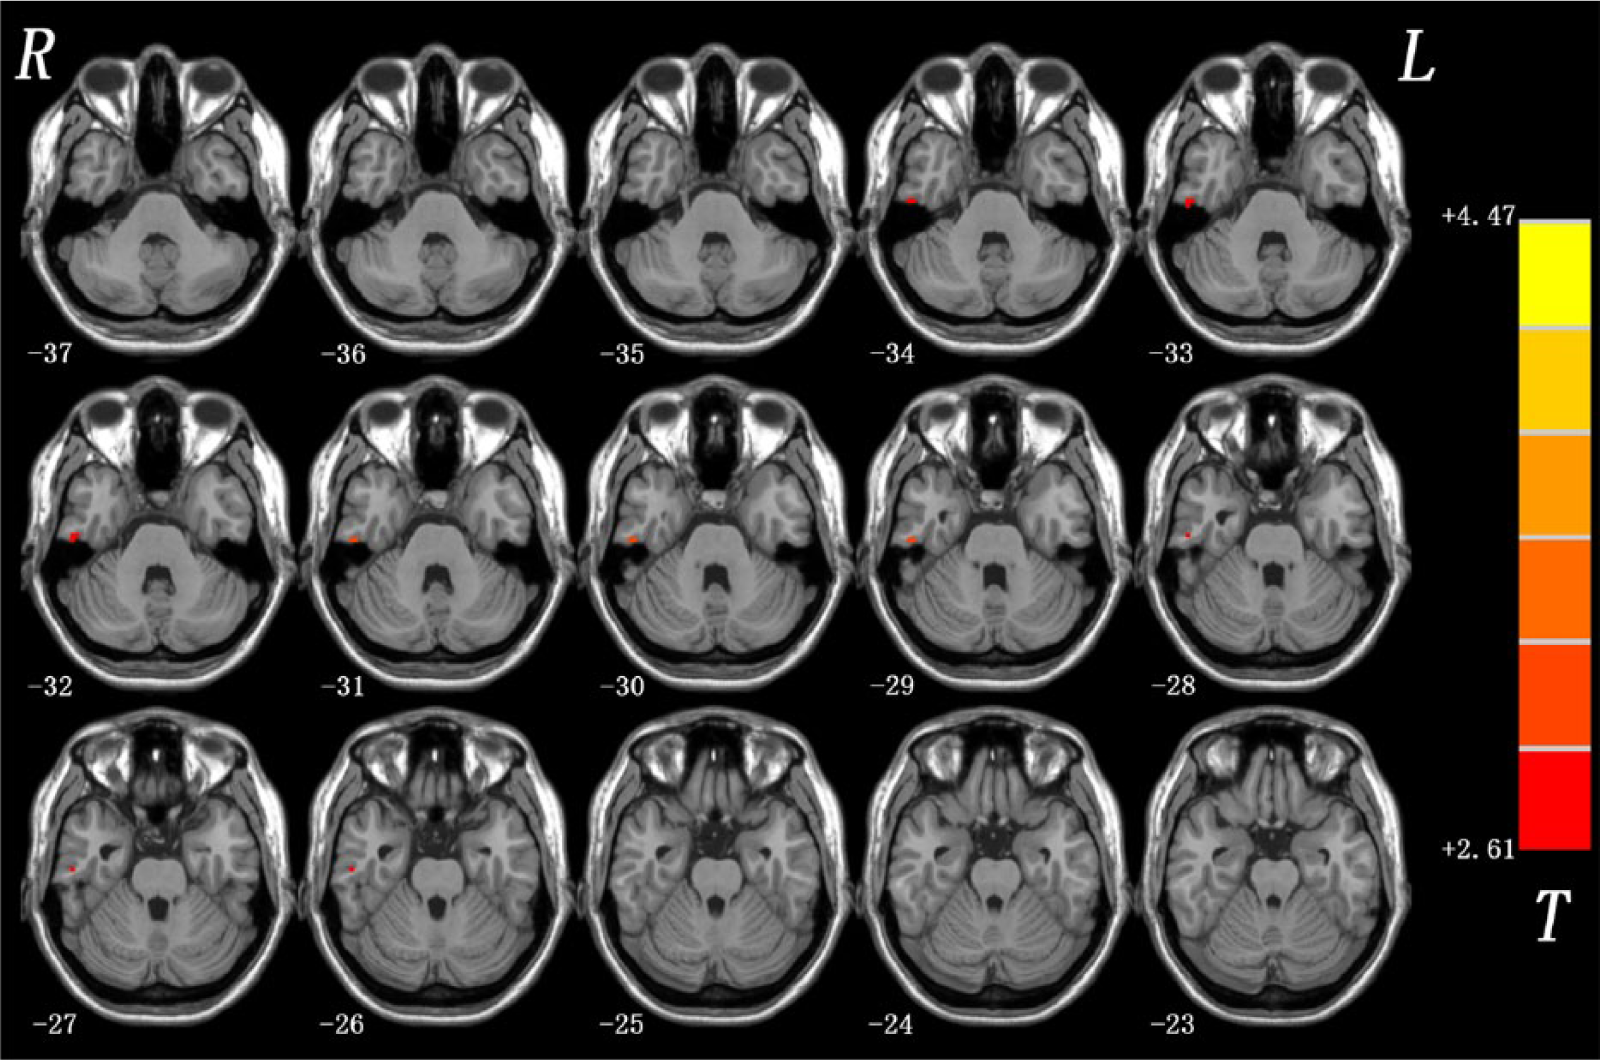
The demographic and clinical data of the two groups are listed in Table 1. One SD patient and two HCs were excluded from further analysis because of excessive head movement. The two groups did not differ significantly in sex, age and years of education. The FD values were significantly different between the two groups (p = 0.016). Compared with the HC group, patients with SD showed higher levels of anxiety, depression and somatic symptoms (p < 0.001).
Characteristics of somatization disorder (SD) patients and the controls.
HAMD: Hamilton Depression Scale; HAMA: Hamilton Anxiety Scale; SCL-90: the Symptom Check List 90.
The p-value for sex distribution in the two groups was obtained by chi-squared test.
The p-values were obtained by two-sample t-tests.
Differences in FCS between patients with SD and HCs
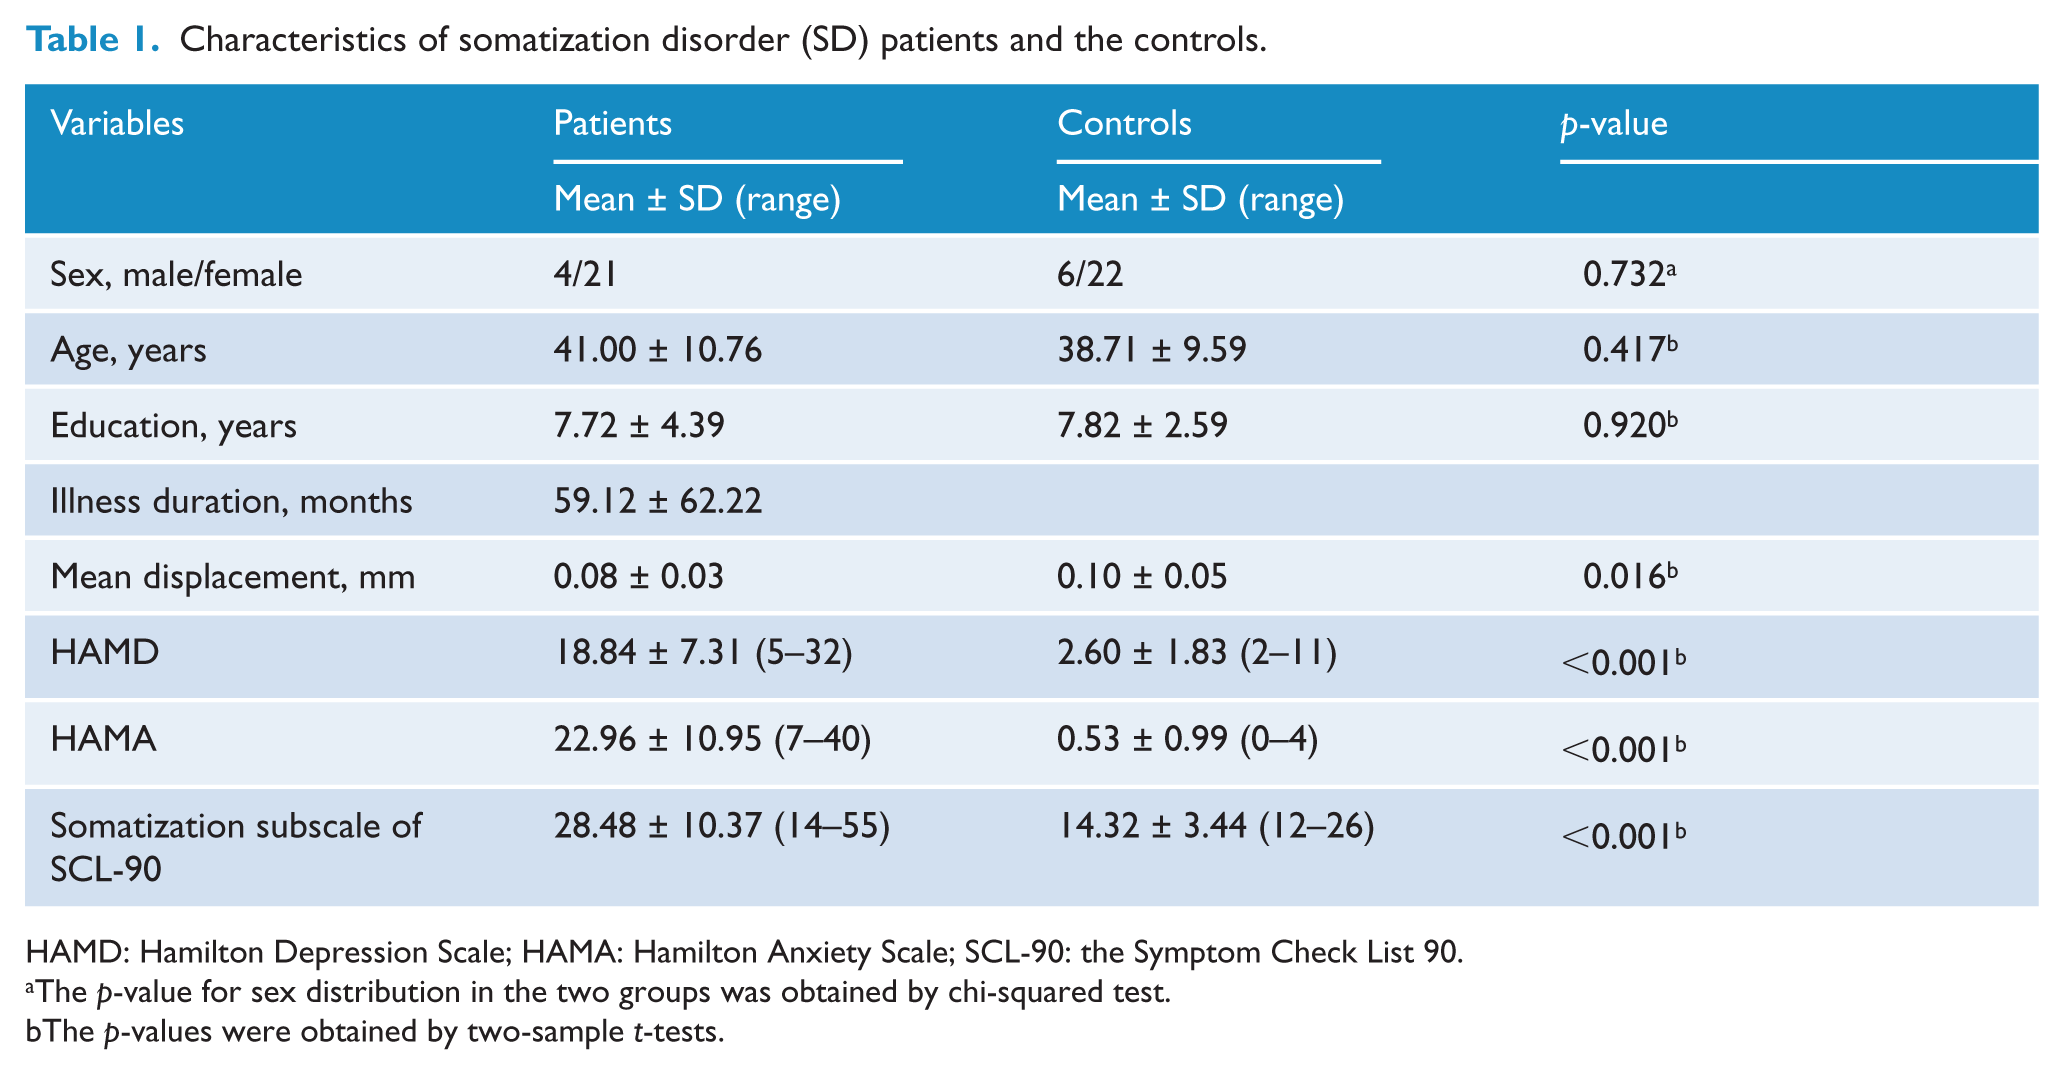
As shown in Figure 2, compared to HCs, the patient group exhibited significantly increased FCS in the right inferior temporal gyrus (ITG) (t-value = 3.719). The MNI coordinate (x, y, z) of the right ITG is (54, –21, −33), and the cluster size is 324 mm3. No other difference was observed in the patients.
Functional connectivity strength (FCS) differences between patients with somatization disorder (SD) and controls. Red denotes higher FCS and the color bar represents the t-value of the group analysis.
Correlation analysis
In the whole-brain voxel-based correlation, the z-values of the cluster in the right ITG were significantly positively correlated with HAMA scores at the p < 0.05 level (AlphaSim corrected, combined height threshold p < 0.01 and a minimum cluster size > 270 mm3) in the patient group (Figure 3). Based on the results of the whole-brain voxel-based correlation, the mean FCS value in the cluster of the right ITG was extracted and observed to be significantly positively correlated to the HAMA scores in the scatter plot (r = 0.413, p = 0.040; Figure 3) in the patient group. No significant correlation was found between the z-values of other brain regions and the scores of HAMD and somatization subscale of SCL-90.
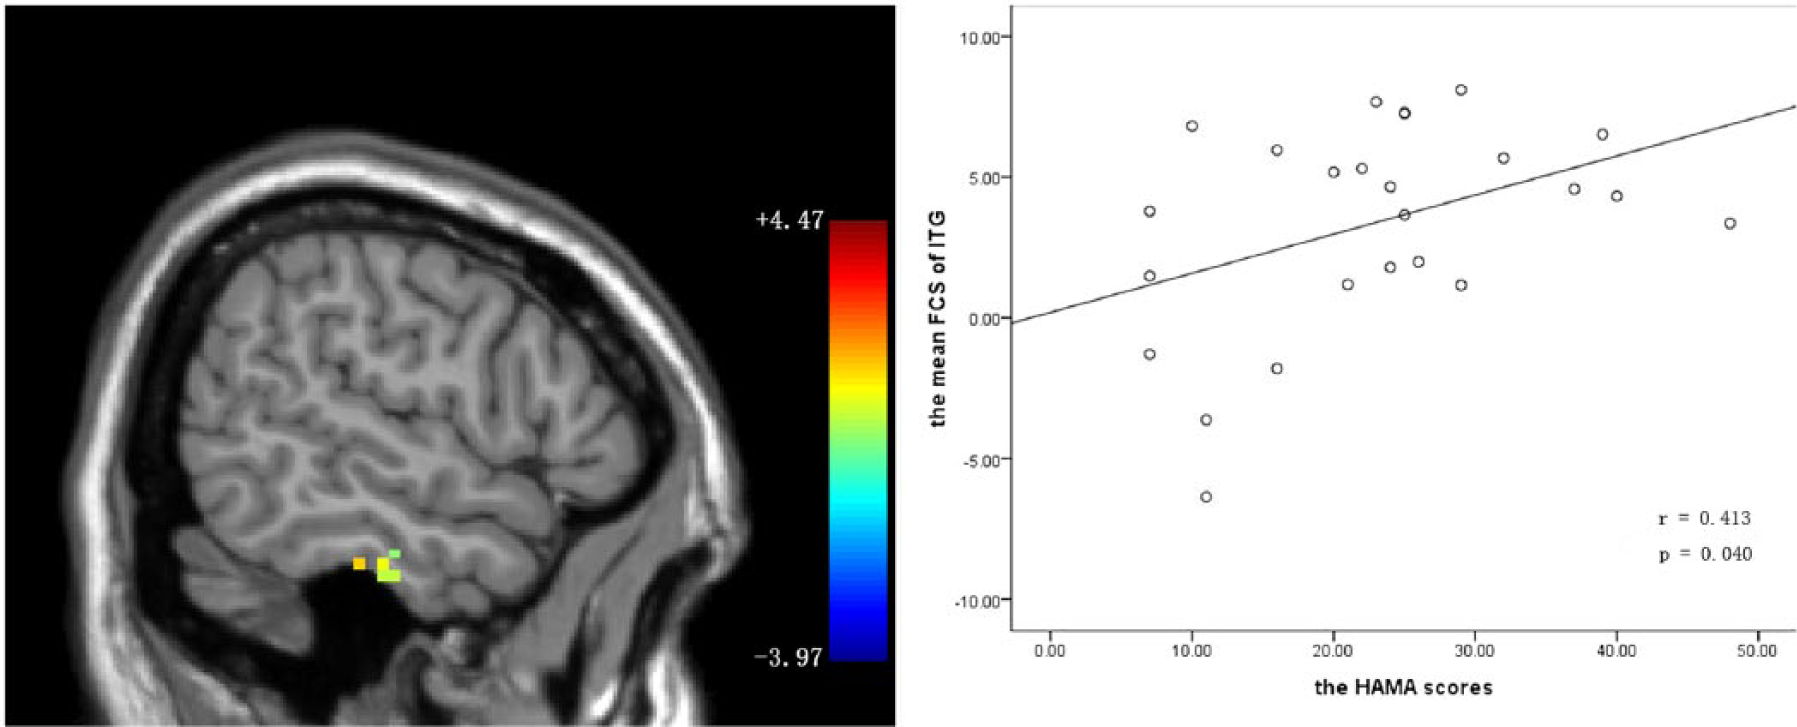
Correlation between functional connectivity strength (FCS) in the inferior temporal gyrus (ITG) and Hamilton Anxiety Scale (HAMA) scores in the patient group. Left panel: sagittal view of the whole-brain voxel-wise correlation analysis between z-values of the cluster in the right ITG (Montreal Neurological Institute coordinates: x = 56, y = −19, z = −31) and HAMA scores at the p < 0.05 level (AlphaSim corrected, combined height threshold p < 0.01 and a minimum cluster size > 270 mm3) in the patient group. Right panel: scatter plot of the positive correlation between the mean FCS in the cluster of the right ITG and the HAMA scores in the patient group.
Discussion
To our knowledge, this is the first study to investigate resting-state whole-brain FCS with graph theory in medication-naive, first-episode patients with SD. The results showed that the SD patients had increased FCS in the right ITG, which belonged to the DMN. Importantly, the z-values of the cluster in the right ITG significantly correlated with HAMA scores.
ITG, located on the lateral and inferior surface of the temporal neocortex, can be considered as a tertiary visual association cortex and the central portion of the language formulation area region (Dien et al., 2013; Ungerleider and Pasternak, 2004), involving cognitive functions such as language, visual perception, and memory (Noppeney and Price, 2002; Ojemann et al., 2001). Some studies have linked regions of the ITG to the amygdala and nucleus accumbens, suggesting the addition of an emotional tone to the learning of cognitive tasks (Cheng et al., 1997; Kalivas and Nakamura, 1999). The strategic location and widespread connections suggest that ITG is a major association area that subserves cognition processing and emotion regulation. Besides, using fMRI, somatoform pain disorder patients demonstrated increased activation of the temporal region in the pain condition compared to healthy subjects, suggesting that dysfunction of the temporal region may be correlated to somatic pain (Stoeter et al., 2007). Consistent with the findings from somatoform pain disorder patients (Stoeter et al., 2007), the present study showed that increased FCS was in the right ITG in the patient group compared to the control group. More specifically, neuroimaging data support the linking of the temporal lobe to alexithymia (Aust et al., 2014; Deng et al., 2013). Alexithymia is defined as difficulty in describing subjective feelings, and distinguishing between feelings and bodily sensations of emotional arousal. It also refers to a deficit in regulating emotions associated with somatization (Bailey and Henry, 2007). Hence, the present result of increased FCS in this region may indicate involvement in the pathophysiology of SD.
Furthermore, the z-values of the cluster in the right ITG were positively correlated to HAMA scores in the patient group. HAMA was used to assess the severity of anxiety symptoms, and the significantly positive correlation suggests that FCS measurement in the right ITG may be applied as an indicator for the anxiety symptom severity. Furthermore, a recent study reported that the disability of SD patients was positively correlated with HAMA scores (Kushwaha et al., 2014), which suggests that FCS measurement in the right ITG may be useful for understanding the disease state.
To date, limited neuroimaging data related to abnormalities in the brain regions, such as the prefrontal cortex, cerebellum, ACC, amygdala, PCC, and precuneus have been documented for SD patients (Atmaca et al., 2011; Brody et al., 2001; Fayed et al., 2012; Garcia-Campayo et al., 2001; Lemche et al., 2013). These brain regions are recognized as the components of the DMN, and these studies provided useful clues for DMN alterations in SD patients. The DMN has been shown to be involved in cognition, emotion and executive functioning, such as motor function, visual processing, auditory processing, memory, motivation, and self-referential activity (Damoiseaux et al., 2006; Greicius et al., 2003; Raichle et al., 2001). A recent review of neuroimaging studies suggested that the DMN may play an important role in the pathophysiology of SD (Browning et al., 2011). Furthermore, a recent fMRI study has shown that there was a dissociation pattern of the anterior and posterior DMN in SD (Su et al., 2014). Our findings of increased FCS in the right ITG regarded as a core region of DMN is of particular interest (Bullmore and Sporns, 2009; Greicius et al., 2003). The present study thus extends the previous findings and suggests that the DMN may play an important role in the pathophysiology of SD.
In addition to a relatively small sample size, other limitations should be stated. First, with a 5:1 female to male ratio for SD in the general population, a high proportion of females were recruited in the current study; this may limit the generality of the present results. Second, the patients showed high levels of anxiety and depression symptom severity. Previous studies have reported that somatization is comorbid with depression and anxiety at a high ratio (Lowe et al., 2008; Simon et al., 1999). Since anxiety and depression may be inherent characteristics of SD patients, they cannot be removed in the analysis. Third, although many graph metrics can be used to characterize the topological properties of brain networks, the FCS was difficult to calculate using other graph metrics (e.g. small-world or betweenness) on account of a high computational load in a network of more than 60,000 nodes. Further research is expected to calculate other graph metrics of voxel-based brain networks using high-performance computing systems. Lastly, FCS was calculated as the average of all the connections in spite of short- and long-range connections. It would be interesting to calculate FCS with short- and long-range connections separately in a future study.
In conclusion, the present study indicates that there is a disruption of the functional connectivity pattern in the right ITG in patients with first-episode, treatment-naive SD, which bears clinical significance.
Footnotes
Acknowledgements
The manuscript was revised, copyedited and proofread by Prof. Dr Bernard Goodman (Guangxi University, China) and Dr Shaogang Liu (Guangxi University for Nationalities, China). The authors also thank all individuals who served as the research participants.
Declaration of interest
The authors report no conflicts of interest. The authors alone are responsible for the content and writing of the paper.
Funding
The study was supported by grants from the National Natural Science Foundations of China (grant nos 81260210 and 30900483), the Natural Science Foundations of Guangxi (grant no. 2013GXNSFAA019107), and special funding by the Ministry of Health of the Peoples’ Republic of China (grant no. 201002003).