
Abstract
Objectives:
To estimate the annual costs of psychosis in Australia from societal and government perspectives and assess whether average costs per person differ by principal service provider at time of census.
Methods:
Costs of psychosis encompassing health sector costs, other sector costs, and productivity losses were assessed for 2010 using a prevalence-based, bottom-up approach. Resource use data were obtained from the second Australian National Survey of Psychosis and unit costs were from government and non-government organization (NGO) sources. Costs to society were assessed by principal service provider at census: public specialized mental health services (PSMHS) and NGOs during the census month (current clients), and PSMHS in the 11 months preceding census (recent clients), and any differences were ascertained.
Results:
The average annual costs of psychosis to society are estimated at $77,297 per affected individual, comprising $40,941 in lost productivity, $21,714 in health sector costs, and $14,642 in other sector costs. Health sector costs are 3.9-times higher than those for the average Australian. Psychosis costs Australian society $4.91 billion per annum, and the Australian government almost $3.52 billion per annum. There are significant differences between principal service providers for each cost category. Current PSMHS clients had the highest health sector costs overall, and the highest mental health ambulatory, inpatient, and antipsychotic medication costs specifically. NGO clients had the highest other sector costs overall and the highest NGO assistance, supported employment, and supported accommodation costs. Recent PSMHS clients had the lowest productivity losses for reduced participation and the highest costs for absenteeism and presenteeism.
Conclusions:
The costs of psychosis are broad ranging and very high. Development and implementation of cost-effective prevention, treatment, and support strategies is critical to maximizing the efficiency of service delivery. A needs-based framework based on principal service provider and recency of contact may facilitate this process.
Introduction
Historically, the economic burden of psychotic disorders has been accepted as far-reaching and very high, driven by the costs of lost productivity and inpatient care (Andrews et al., 1985; Carr et al., 2003; Knapp et al., 2004). Intangible costs, the pain and suffering arising from an individual’s psychosis, are also substantial, as reflected in elevated levels of substance abuse, depression, suicidal ideation, and suicide (Blanchard et al., 2000; Kavanagh et al., 2004; Morgan et al., 2012). The negative impact on informal carers, usually family members not specifically employed to care for affected individuals, can also be considerable (Foldemo et al., 2005; Caqueo-Urizar et al., 2009).
Assessment of economic burden of an illness is undertaken through cost-of-illness (COI) analysis. COI analyses estimate the resources that are used to treat or support an individual or population with a specified illness, or are otherwise incurred in consequence of that illness (traditionally called direct costs), and the value of the production that they and their informal carers are unable to produce because of morbidity and/or early mortality arising from the illness (traditionally called indirect costs). The actual resources included and unit costs employed in an analysis depend upon its perspective (e.g. societal, government, patient and family). From the perspectives of society and patient and family, intangible costs, such as pain and suffering, are also of relevance, but difficult to value meaningfully in monetary terms.
For less common conditions such as psychosis, a bottom-up COI analysis employing disorder-specific datasets has been considered most useful, particularly when informal care is a major consideration (Segal, 2006). Bottom-up COI analysis using observational data has also been considered the preferred COI method to inform health-care decision-making and policy development (Tarricone, 2006). When assessed using individual patient level data, detailed subgroup analyses and the identification of predictors of costs are also possible (see for example Carr et al., 2004).
Within Australia, the costs of psychosis and, more frequently, the costs of schizophrenia, have been assessed previously (Andrews et al., 1985; Hall et al., 1985; Andrews, 1991; Langley-Hawthorn, 1997; Access Economics, 2002; Carr et al., 2002; Fitzgerald et al., 2007). However, only the Carr and the Fitzgerald papers employed individual patient level data.
Carr et al. (2002) assessed the disorder-specific costs of psychosis in Australia based on data from the first Australian National Survey of Psychosis (Jablensky et al., 2000). Fitzgerald et al. (2007) assessed the average total costs of schizophrenia based on individual and aggregate healthcare resource utilization and productivity data derived from the Australian Schizophrenia Care and Assessment Programme (SCAP). Both analyses employed societal and government perspectives. Average costs per patient were lower in Fitzgerald and colleagues (2007). This was considered partly due to differences in resource items included, service use and costing assumptions employed. Disparities in sampling frames may also be a factor.
Sample ascertainment through current contact with healthcare providers has been postulated to give rise to higher costs than sample ascertainment over a longer period of service use (Gustavsson et al., 2011). While Carr and colleagues (2002) primarily included people with psychosis currently receiving treatment, Fitzgerald and colleagues (2007) included people in long-term follow-up care.
This paper uses a bottom-up COI approach, employing disorder-specific, individual-patient-level, observational data to estimate the average costs per person with psychosis and total costs of psychosis to Australia in 2010. The analysis is based on data collected in the context of the second Australian National Survey of Psychosis (Morgan et al., 2011, 2012). This survey assessed the prevalence, demographic, and clinical characteristics of Australians living with psychotic illness in contact with public specialized mental health services (PSMHS) within the census month or the previous 11 months, and/or in contact with mental health-specific non-government organizations (NGOs) within the census month. Costs are estimated from societal and government perspectives with detailed breakdowns presented by cost category: health sector, other sector, and time-loss or productivity costs. Recently, different service use profiles were identified for people with psychosis in the 2010 psychosis survey, based on their principal service provider (Raudino et al., 2014). Consequently, this paper also includes breakdowns of average cost per affected individual by their principal service provider, PSMHS or NGOs and, for PSMHS, whether the individual was recruited during the census month (current clients) or through PSMHS contact in the previous 11 months (recent clients).
Methods
Second Australian National Survey of Psychosis
This survey covered a population of 1.5 million people aged 18–64 years, approximately 10% of the Australian population in this age group. A two-phase design was used and conducted within seven catchment areas across five Australian states. In phase 1, screening for psychosis took place in PSMHS and through NGOs supporting people with a mental illness. In phase 2, people who were screen positive for psychosis in phase 1 were randomly selected, stratified by age group (18–34 and 35–64 years), for interview.
The census month was March 2010. Of 7955 people who were screen positive for psychosis and eligible, 1825 were interviewed in phase 2. Data were collected on symptomatology, substance use, disability, physical health, mental and physical health service utilization, medication use, education, employment, housing, and community sector support. Full details of the methodology are described elsewhere (Morgan et al., 2011, 2012).
The study was approved by institutional human research ethics committees at all study sites. All participants provided written, informed consent.
The mean age of participants was 39.5 years, with 59.2% male. There were 5074 (63.8%) people using PSMHS services during the census month (current PSMHS clients) and a further 1820 (22.9%) people who had used PSMHS services in the 11 months prior to census (recent PSMHS clients). In addition, 1061 (13.3%) people were solely in contact with NGO services supporting people with mental illness during the census month. At the time of census, participants were primarily accommodated in rented housing, with 2084 (26.2%) in public housing and 1790 (22.5%) in private housing. A further 1438 (18.1%) people were living in the family home and 1069 (13.4%) in their own home/unit. Supported group accommodation housed 944 individuals (11.9%) and 145 (1.8%) resided in hospital or institutions. There were 397 homeless individuals (5.0%) and a further 88 (1.1%) lived in caravans and elsewhere.
Costs of psychosis
The annual costs of psychosis have been estimated for the year 2010 in a bottom-up, prevalence-based analysis from the perspectives of society and government. The costing methodology is based on that employed in the cost analysis of the first Australian National Survey of Psychosis (Carr et al., 2002, 2003). A comparison of the costing methodologies is overviewed in the companion article (Neil et al., 2014).
Psychosis-related data on resources used, morbidity-related impairments in productivity, and financial support received over the preceding 12 months were extracted from the survey database. In a limited number of instances, when the assessment period was less than 12 months, extrapolation was employed. An overview of the methodology is outlined below, with a detailed description provided in Appendix 1.
Health sector costs encompassed primary, secondary, and tertiary care services and pharmaceutical and supplement use (Figure 1). Psychosis-attributed general practitioner (GP) consultations and physical health admissions were assessed as visits over and above the general population level of five visits per year (Britt et al., 2010). Pharmaceuticals were assumed to be taken at their defined daily dose (Department of Health and Ageing, 2009; WHO Collaborating Centre for Drug Statistics Methodology, 2010) for the period specified by the respondent. Supplements taken in the 4 weeks prior to interview were assumed to have been taken for a total of 6 months at supplier recommended dosages.
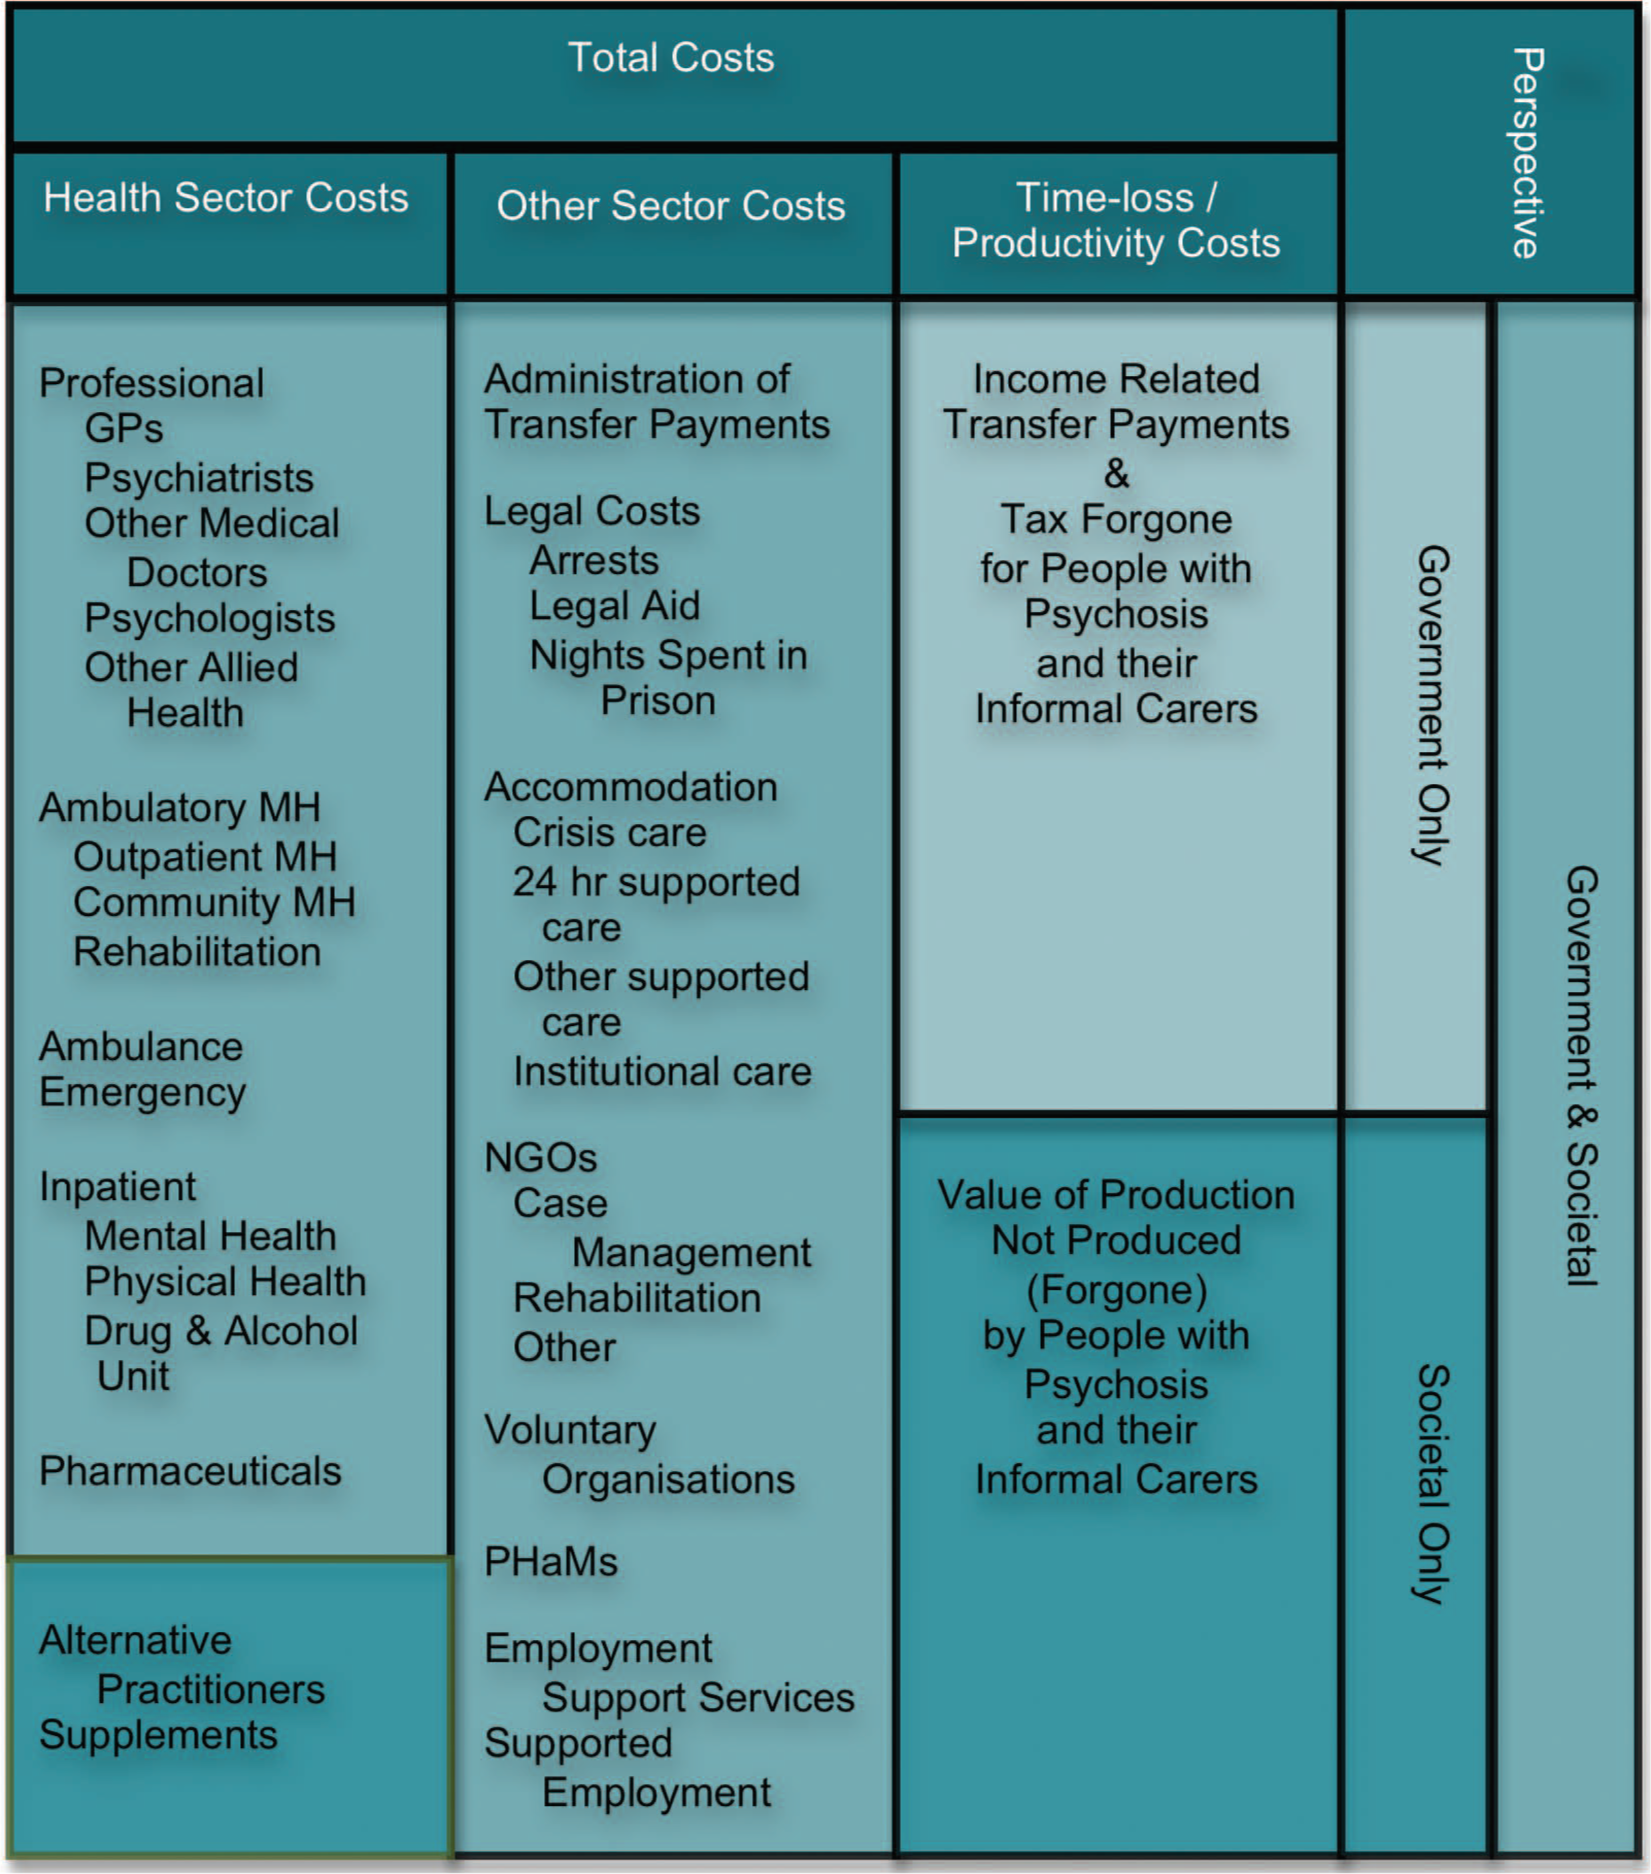
Resources captured within costing analysis.
Other sector costs were defined as direct costs incurred outside the formal health sector in the support and care of people with psychosis or incurred as a consequence of that illness (Figure 1). Psychosis-attributed victim of crime incidents (e.g. break-ins) were assessed as events over and above general Australian population levels reported to police. Of the type of incidents captured within the survey (break-ins, robberies with assault, and other assaults), unlawful entry with intent (break-ins) has the highest rate of occurrence in Australia at 0.0097 events per person per annum reported to police (Australian Institute of Criminology, 2012). For each type of victimization incident, the costs of second and subsequent events have been incorporated, adjusted for the proportion of that type of incident reported to police across the entire sample: 53.5% for break-ins, 49.8% for robberies with assault, and 30.1% for other assaults.
From the societal perspective, time-loss costs comprised productivity losses for individuals designated as within the labour force (i.e. if not retired, studying, or performing home duties). Losses were assessed for the period of time that these individuals were not working in either a competitive or non-competitive job using a modified human capital approach. Specifically, lost production was valued as expected earnings forgone, calculated as the product of the average weekly earnings by age and gender adjusted for the prevailing employment rate. The underlying assumption was that, but for their psychotic disorder, an affected individual should expect to enjoy the same level of employment and at the same wage rates as the population in general by age and gender (see also Tarricone, 2006). An equivalent assumption was applied to informal carers in receipt of a Carer Payment, a Government income support payment; that is, but for their caring responsibilities, an informal carer should expect to enjoy the same level of employment and at the same wage rates as the population in general by age and gender. A sensitivity analysis estimates productivity losses for carers on either a Carer Payment or Carer Allowance (an income supplement that has fewer requirements than the Carer Payment, including no income or asset tests).
Costs associated with absenteeism and presenteeism (reduced productivity while at work) were also estimated. The costs of each were calculated as the product of the equivalent number of days not worked for mental health reasons or reduced productivity in the last month, extrapolated to weeks not worked over 12 months, and age- and gender-specific weekly earnings (Australian Bureau of Statistics, 2010a: Table 4). Equivalent number of days not worked due to reduced productivity was assessed assuming productivity losses of 15% per day (Goetzel et al., 2004).
From the government perspective, time-loss costs comprised tax forgone due to lost productivity, and the cost of transfer payments (pensions and other income support) designated as psychosis-related. These payments comprised Sickness Allowance or Benefit, Disability Support Pension (DSP), Mobility Allowance, Youth Disability Supplement, Carer Payment, Carer Allowance, and Carer Supplement.
For each perspective, costs per respondent were calculated by multiplying the specified or estimated resource usage or losses over the preceding 12-month period by a set of standard unit costs. Where information was missing, resource usage was conservatively assumed to be nil. Unit costs were expressed in constant 2010 Australian dollars and were specific to the perspective employed (see Appendix 2). For a number of items (e.g. employment support services and legal costs), the same unit cost was employed across perspectives leading to equivalent costs for these items. Unit costs for GP visits were also dependent upon whether the respondent had a GP mental healthcare plan and whether they were bulk-billed.
Adjustment for inflation was undertaken using the Government Final Consumption Expenditure (GFCE) for hospitals and nursing homes (Australian Institute of Health and Welfare, 2011) within the health sector, and the non-farm GDP implicit price deflator (Australian Bureau of Statistics, 2011) otherwise. This is consistent with the approach adopted in the National Mental Health Report (Department of Health and Ageing, 2010).
Costs per person were estimated using sampling weights reflecting site and age strata of the interviewed sample. Average cost per person was extrapolated to the estimated Australian population of people treated for psychosis in 2010 (63,533 people; Morgan et al., 2011, 2012).
Productivity losses due to suicide and excess all-cause mortality were estimated separately and incorporated into the total cost calculations. Losses were assessed as the present value of expected lifetime earnings forgone until age 65, discounted at 5%. Annual expected earnings forgone were calculated as the product of the average weekly earnings by age and gender adjusted by the male employment to population ratio for that age group (Carr et al., 2002, 2003). To prevent double counting of morbidity-related productivity losses, mortality losses in the first year were limited to the proportion of the population with psychosis in employment in the last 4 weeks.
Numbers of deaths due to suicide were estimated employing the approach of Goeree and colleagues (1999), but assuming a lifetime suicide risk of 5% (Hor and Taylor, 2010). Deaths due to all-cause mortality were estimated by applying schizophrenia-specific standard mortality ratios by age and gender (Mortensen and Juel, 1993) to the estimated Australian population with psychosis by gender and age (Morgan et al., 2011).
Statistical analysis
The analysis was undertaken using Statistical Package for Social Sciences version 20 (SPSS, Chicago, USA) Complex Samples, and Excel mac 2008. Analyses of differences between groups were based on analysis of variance and a comparison of group confidence intervals using the SPSS Complex Samples General Linear Model and Descriptives procedures, respectively.
Bootstrap estimation with weighted data is very complex and no particular method is widely accepted or implemented (see Kolenikov, 2011). Preference was therefore given to weighting the interviewed sample data to produce accurate cost estimates across the entire screen positive sample. The normal theory confidence intervals reported (±1.96SEM) are likely to be conservative. Comparisons are considered statistically significant where 95% confidence intervals do not overlap. This is a conservative approach as some overlapping confidence intervals may also be significant (Julious, 2004).
Results
The estimated annual costs of psychosis for the Australian population in 2010 were approximately $4.91 billion from the societal perspective and $3.52 billion from a government perspective (Table 1). Costs increase by $64 million to $4.97 billion assuming a 5% lifetime suicide risk and a further $571 million to $5.48 billion with the inclusion of all-cause excess mortality (Appendix 3).
Annual total costs of psychosis in Australia 2010, by sector, government and societal perspectives.
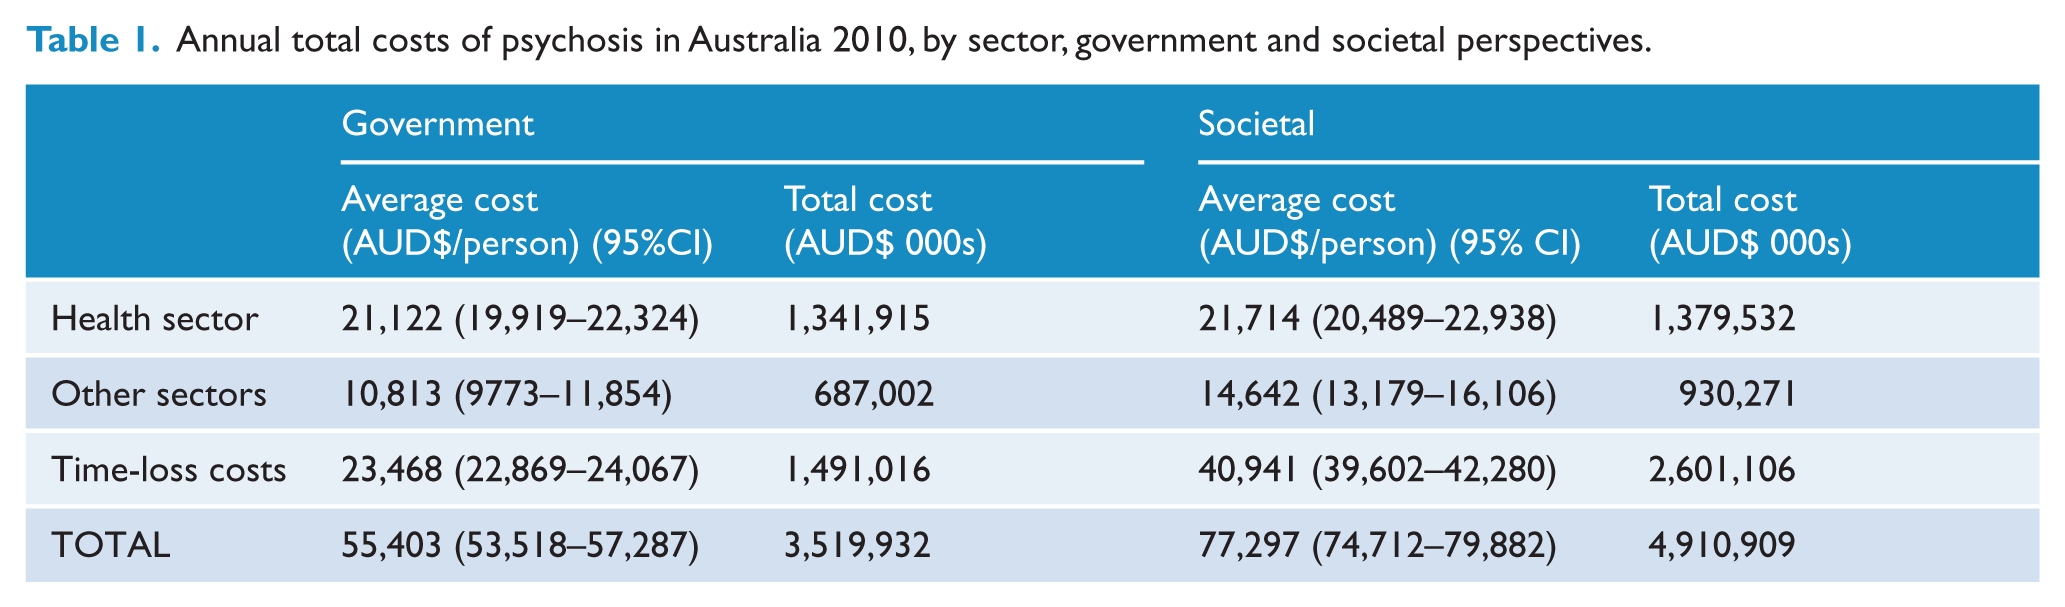
As shown in Table 1, time-loss/productivity costs were the primary contributor to total costs from both societal and government perspectives and estimated at $2.60 billion (53%) and $1.49 billion (42%), respectively. Health sector costs, at $1.38 billion, accounted for 28% of total costs from the societal perspective and 38% of costs ($1.34 billion) from the government perspective. Together, productivity losses and health sector costs accounted for at least 80% of estimated total costs of psychosis from both government and societal perspectives.
Health sector costs
Health sector costs by perspective are itemized in Table 2 with confidence intervals provided in Appendix 4. Given the comparability of the results across perspectives, discussion and analysis will pertain to the results from the societal perspective. Nearly half (46%) of the health sector’s costs were generated by inpatient care, with psychiatric admissions generating 96% of these costs ($609 million). Ambulatory care, used by 70.5% of the sample, generated 40.5% of health sector costs. Of these costs, community mental health contributed 47.0%, public mental health outpatients 32.5%, and rehabilitation services 20.5%. Psychotropic medications gave rise to 10.8% of health sector costs, atypical antipsychotics generating 88.5% of this expenditure. Clozapine alone was responsible for almost 21.6% of medication expenditure or $32 million (data not shown). Private healthcare professionals were assessed as contributing a minimal amount to health sector costs ($21 million or 1.5%), with general practitioner (GP) services giving rise to just over half (51%) of this amount. It was estimated that people with psychosis spent over $1 million dollars on alternative care over a 12-month period: approximately 60% ($598,000) on alternative practitioners, the remainder on supplements for mental health such as fish oil and St John’s Wort.
Annual health sector costs for psychosis in Australia 2010: government and societal perspectives.
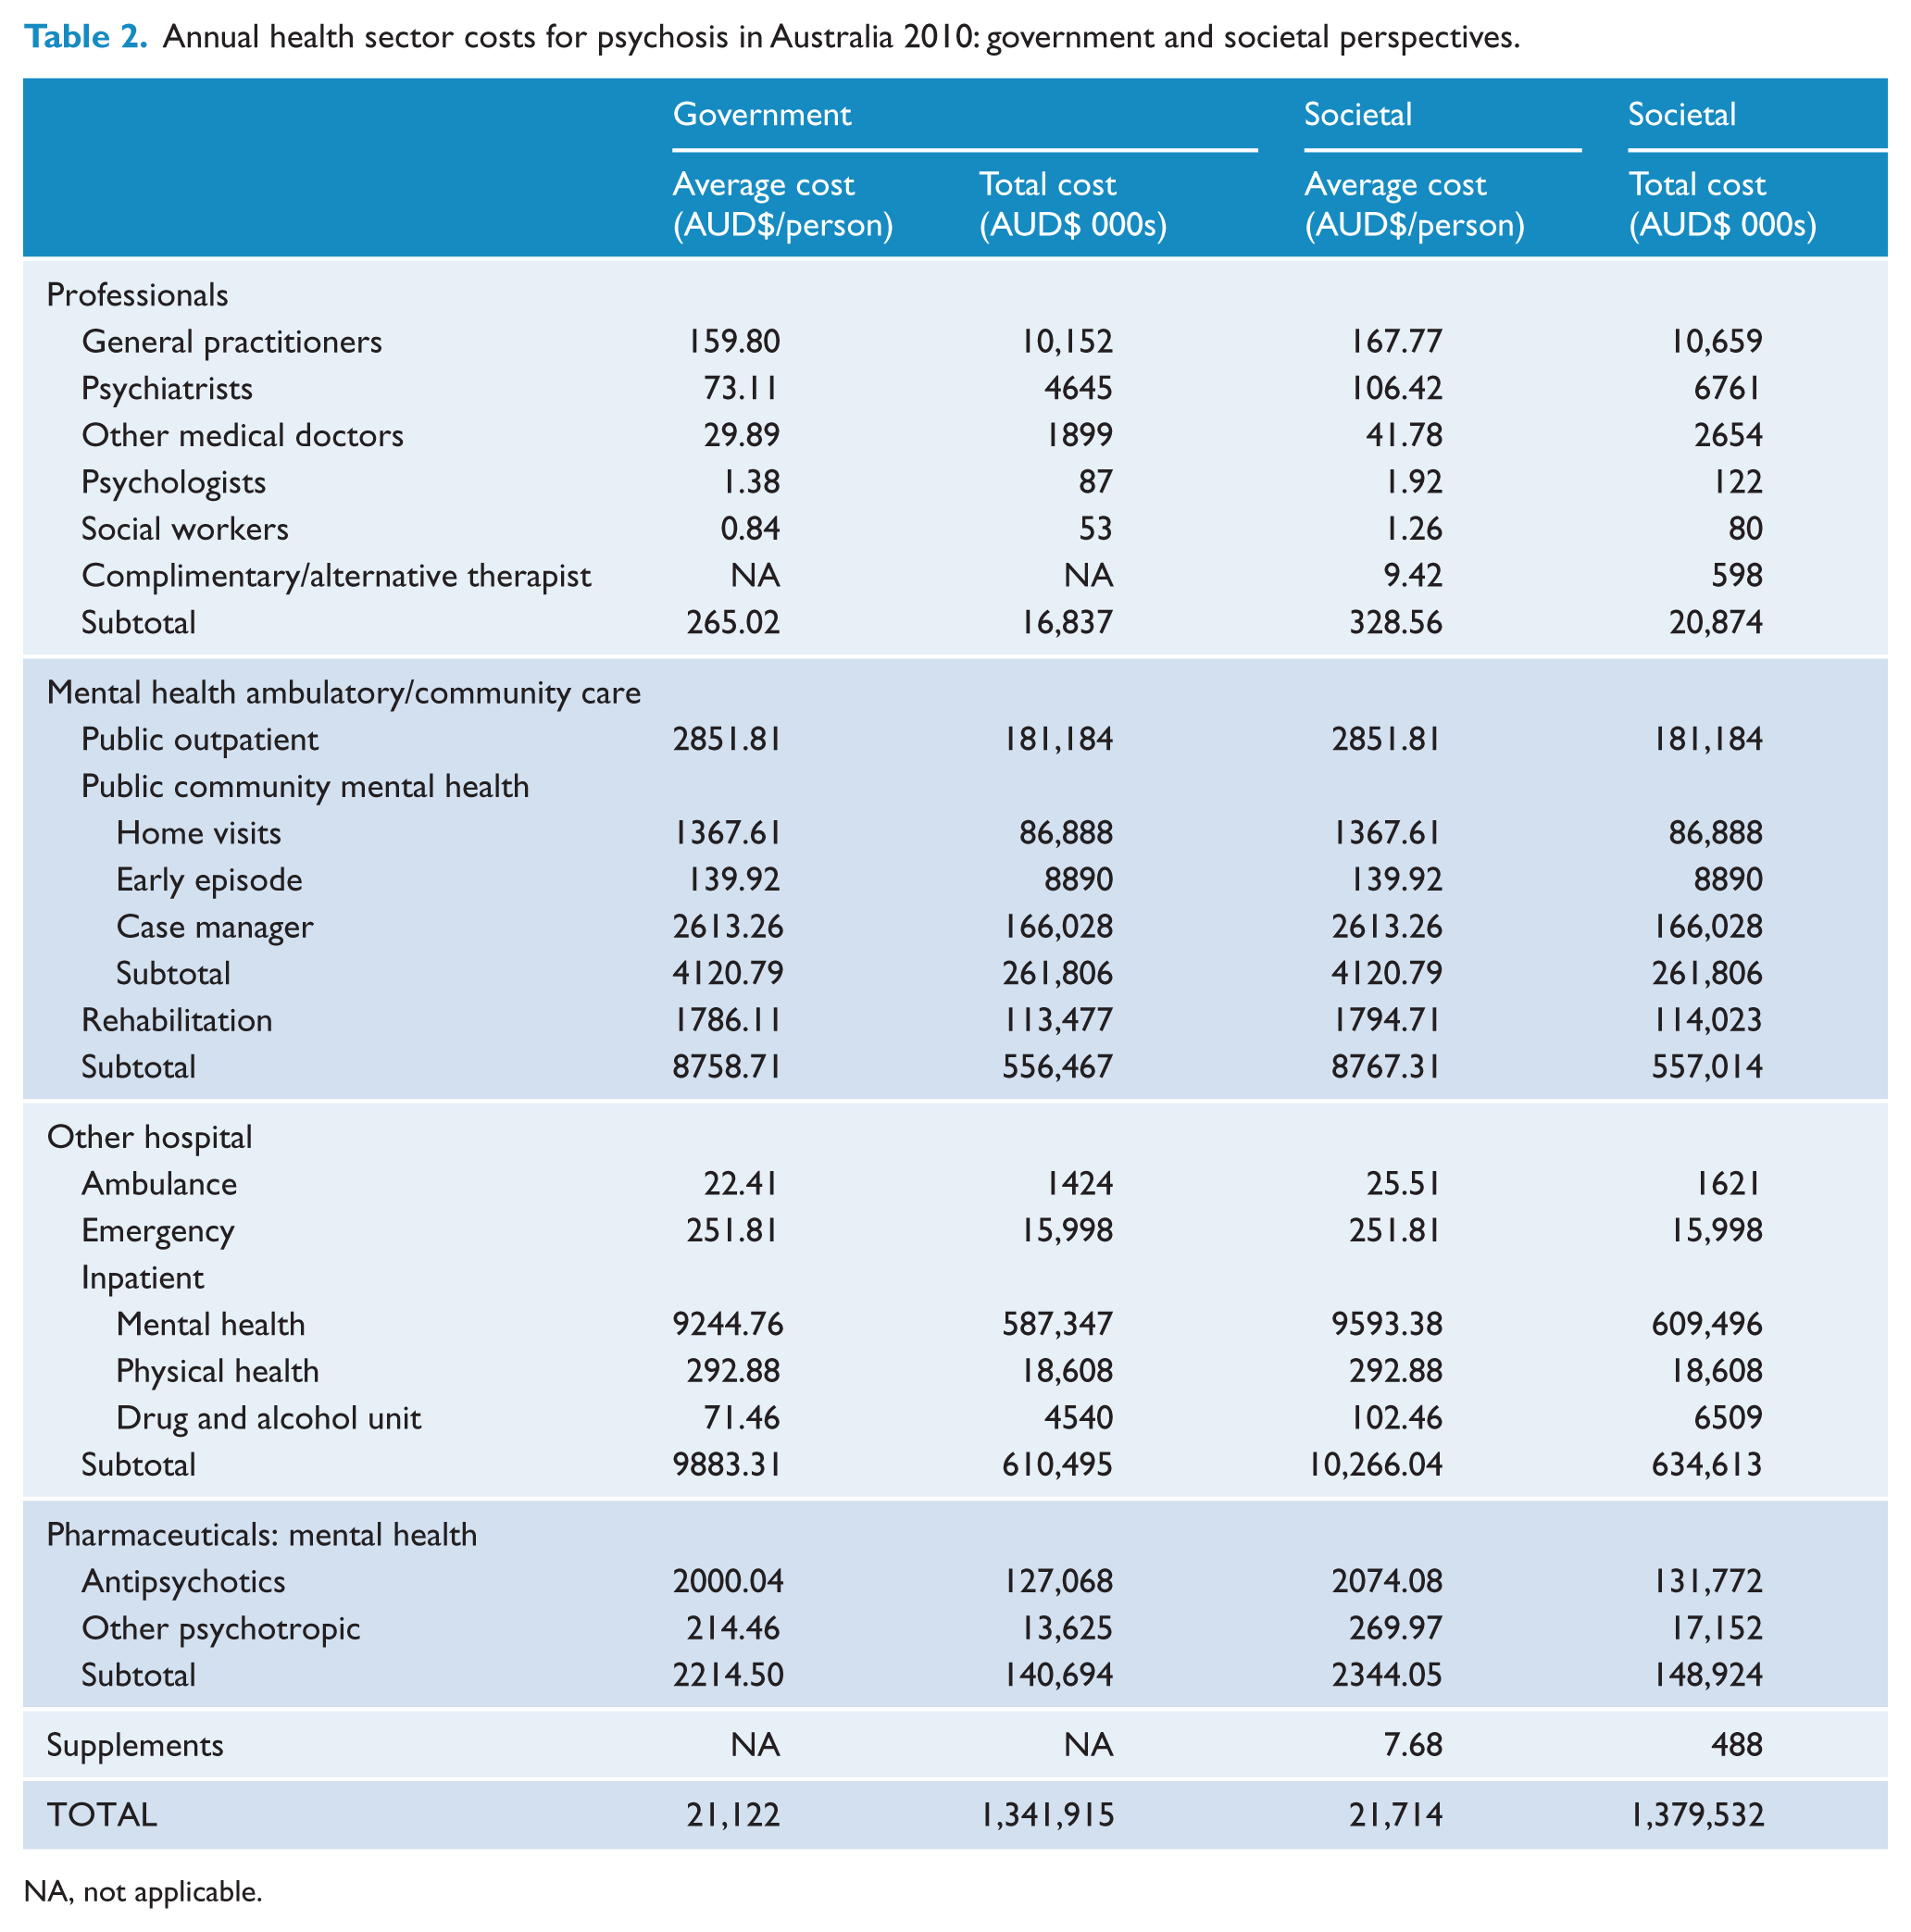
NA, not applicable.
Other sector costs
Other sector costs were estimated at $687 million and $930 million from government and societal perspectives, respectively (Table 3). In regard to the societal perspective, these costs primarily comprised costs for accommodation (56.4%) and NGO service provision (21.1%). Costs for assisting people to find work and of subsidizing supported employment accounted for 13.0% of costs. Other resource use captured included support and/or service contacts with voluntary organizations (2.6%) and the Personal Helpers and Mentors Scheme (PHaMs) (2.0%). The cost for administering government benefits (e.g. DSP) was 2.4% of other sector costs. Legal costs, encompassing criminal justice costs for victims and perpetrators, legal aid, and nights spent in prison, comprised 2.5% of these costs.
Annual other sector costs for psychosis in Australia 2010: government and societal perspectives.
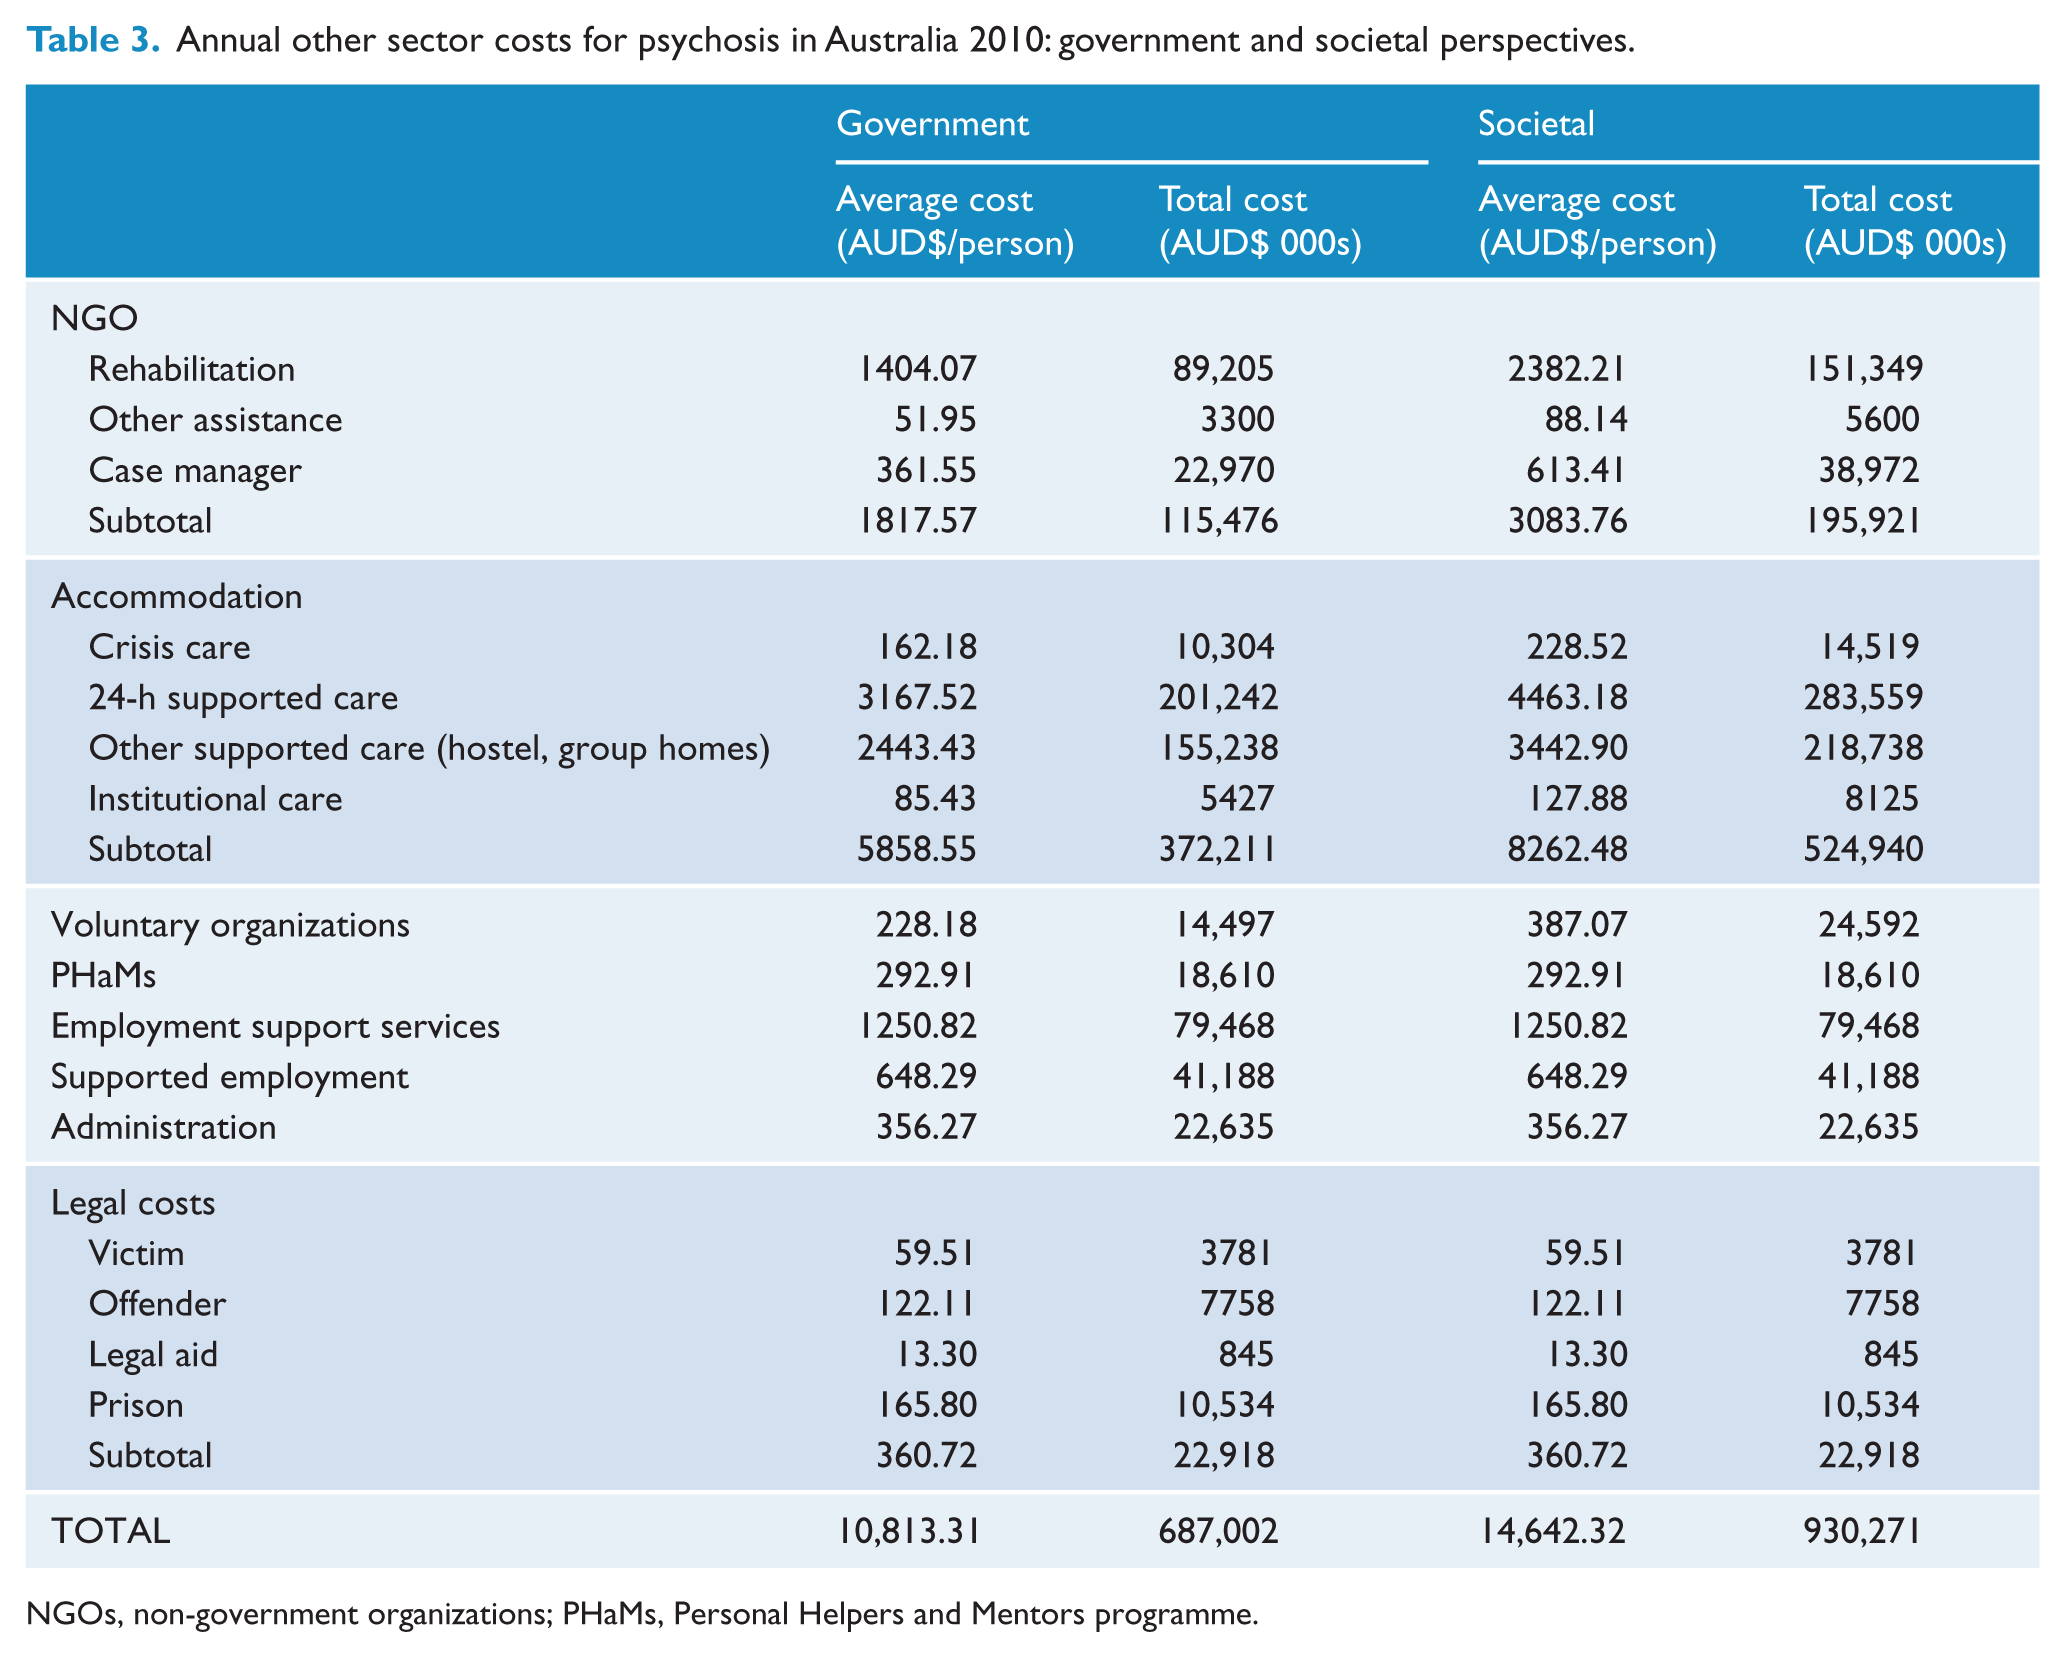
NGOs, non-government organizations; PHaMs, Personal Helpers and Mentors programme.
Productivity/time-loss costs
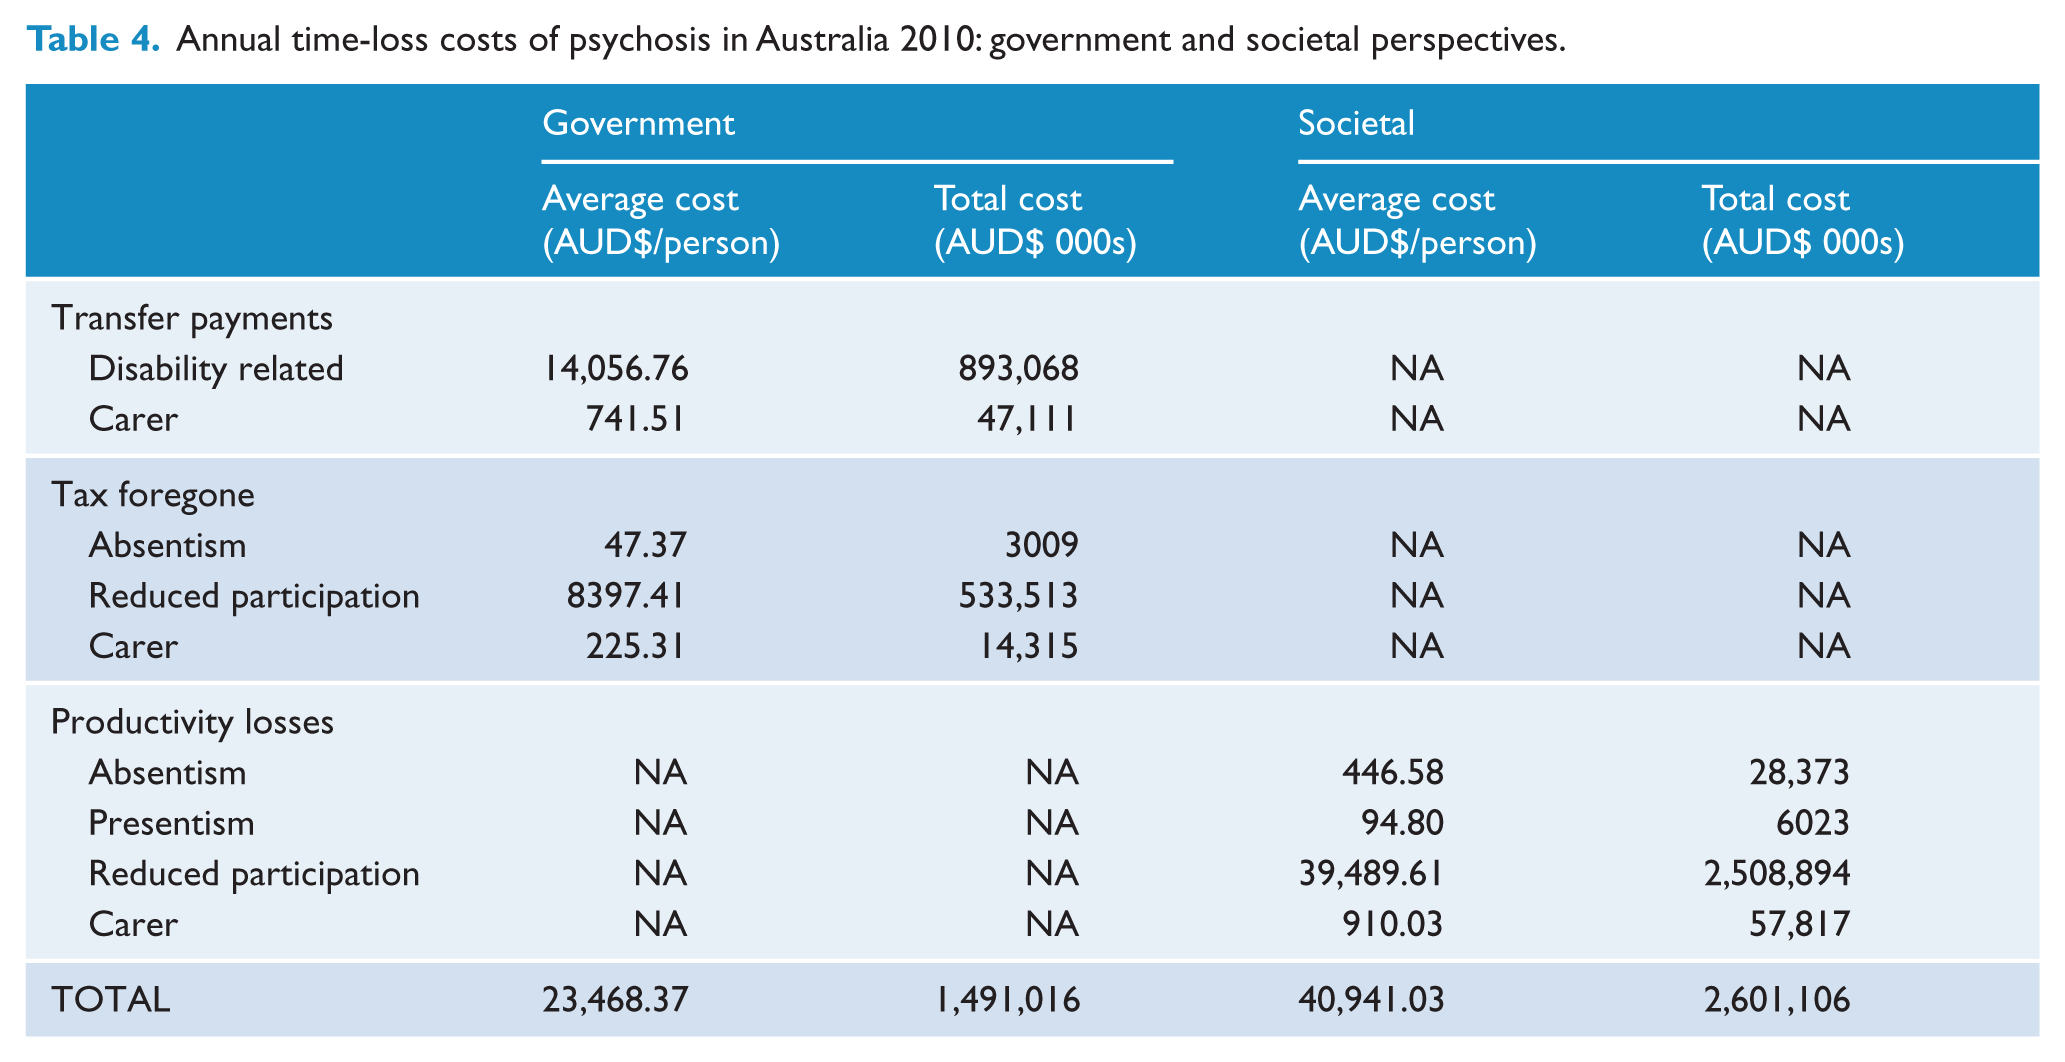
The value of forgone (lost) production due to psychotic illness is estimated at $2.62 billion per annum from the societal perspective, overwhelmingly due to reduced employment among people with psychosis at a cost of $2.51 billion (Table 4). Carers receiving Carer Payment are estimated to give rise to production losses due to reduced labour force participation of $57 million per year. Inclusion of carers receiving a Carer Allowance increases these losses almost 2.6-fold to $147 million (inclusive). The estimated value of absenteeism of people with psychosis is over 4.5-times greater than losses due to presenteeism, at $28.4 million and $6.0 million respectively. From a government perspective, time-loss costs are estimated at $1.49 billion, 60% of these arising from psychosis-related transfer payments (mostly DSPs), and 36% due to estimated tax forgone because of reduced participation by individuals with psychosis. There is a small loss in the form of tax forgone arising from absenteeism, but no loss due to presenteeism as individuals would still be paid. Overall, carers account for $61 million in costs, primarily transfer payments (76.7%).
Annual time-loss costs of psychosis in Australia 2010: government and societal perspectives.
Costs by principal service provider
A comprehensive breakdown of the average societal cost per person with psychosis by principal service provider is provided in Table 5, with the confidence intervals for the major cost categories and selected resource items listed in Table 6. A complete listing is provided in Appendix 5.
Annual average costs of psychosis in Australia 2010: principal service provider and societal perspective.
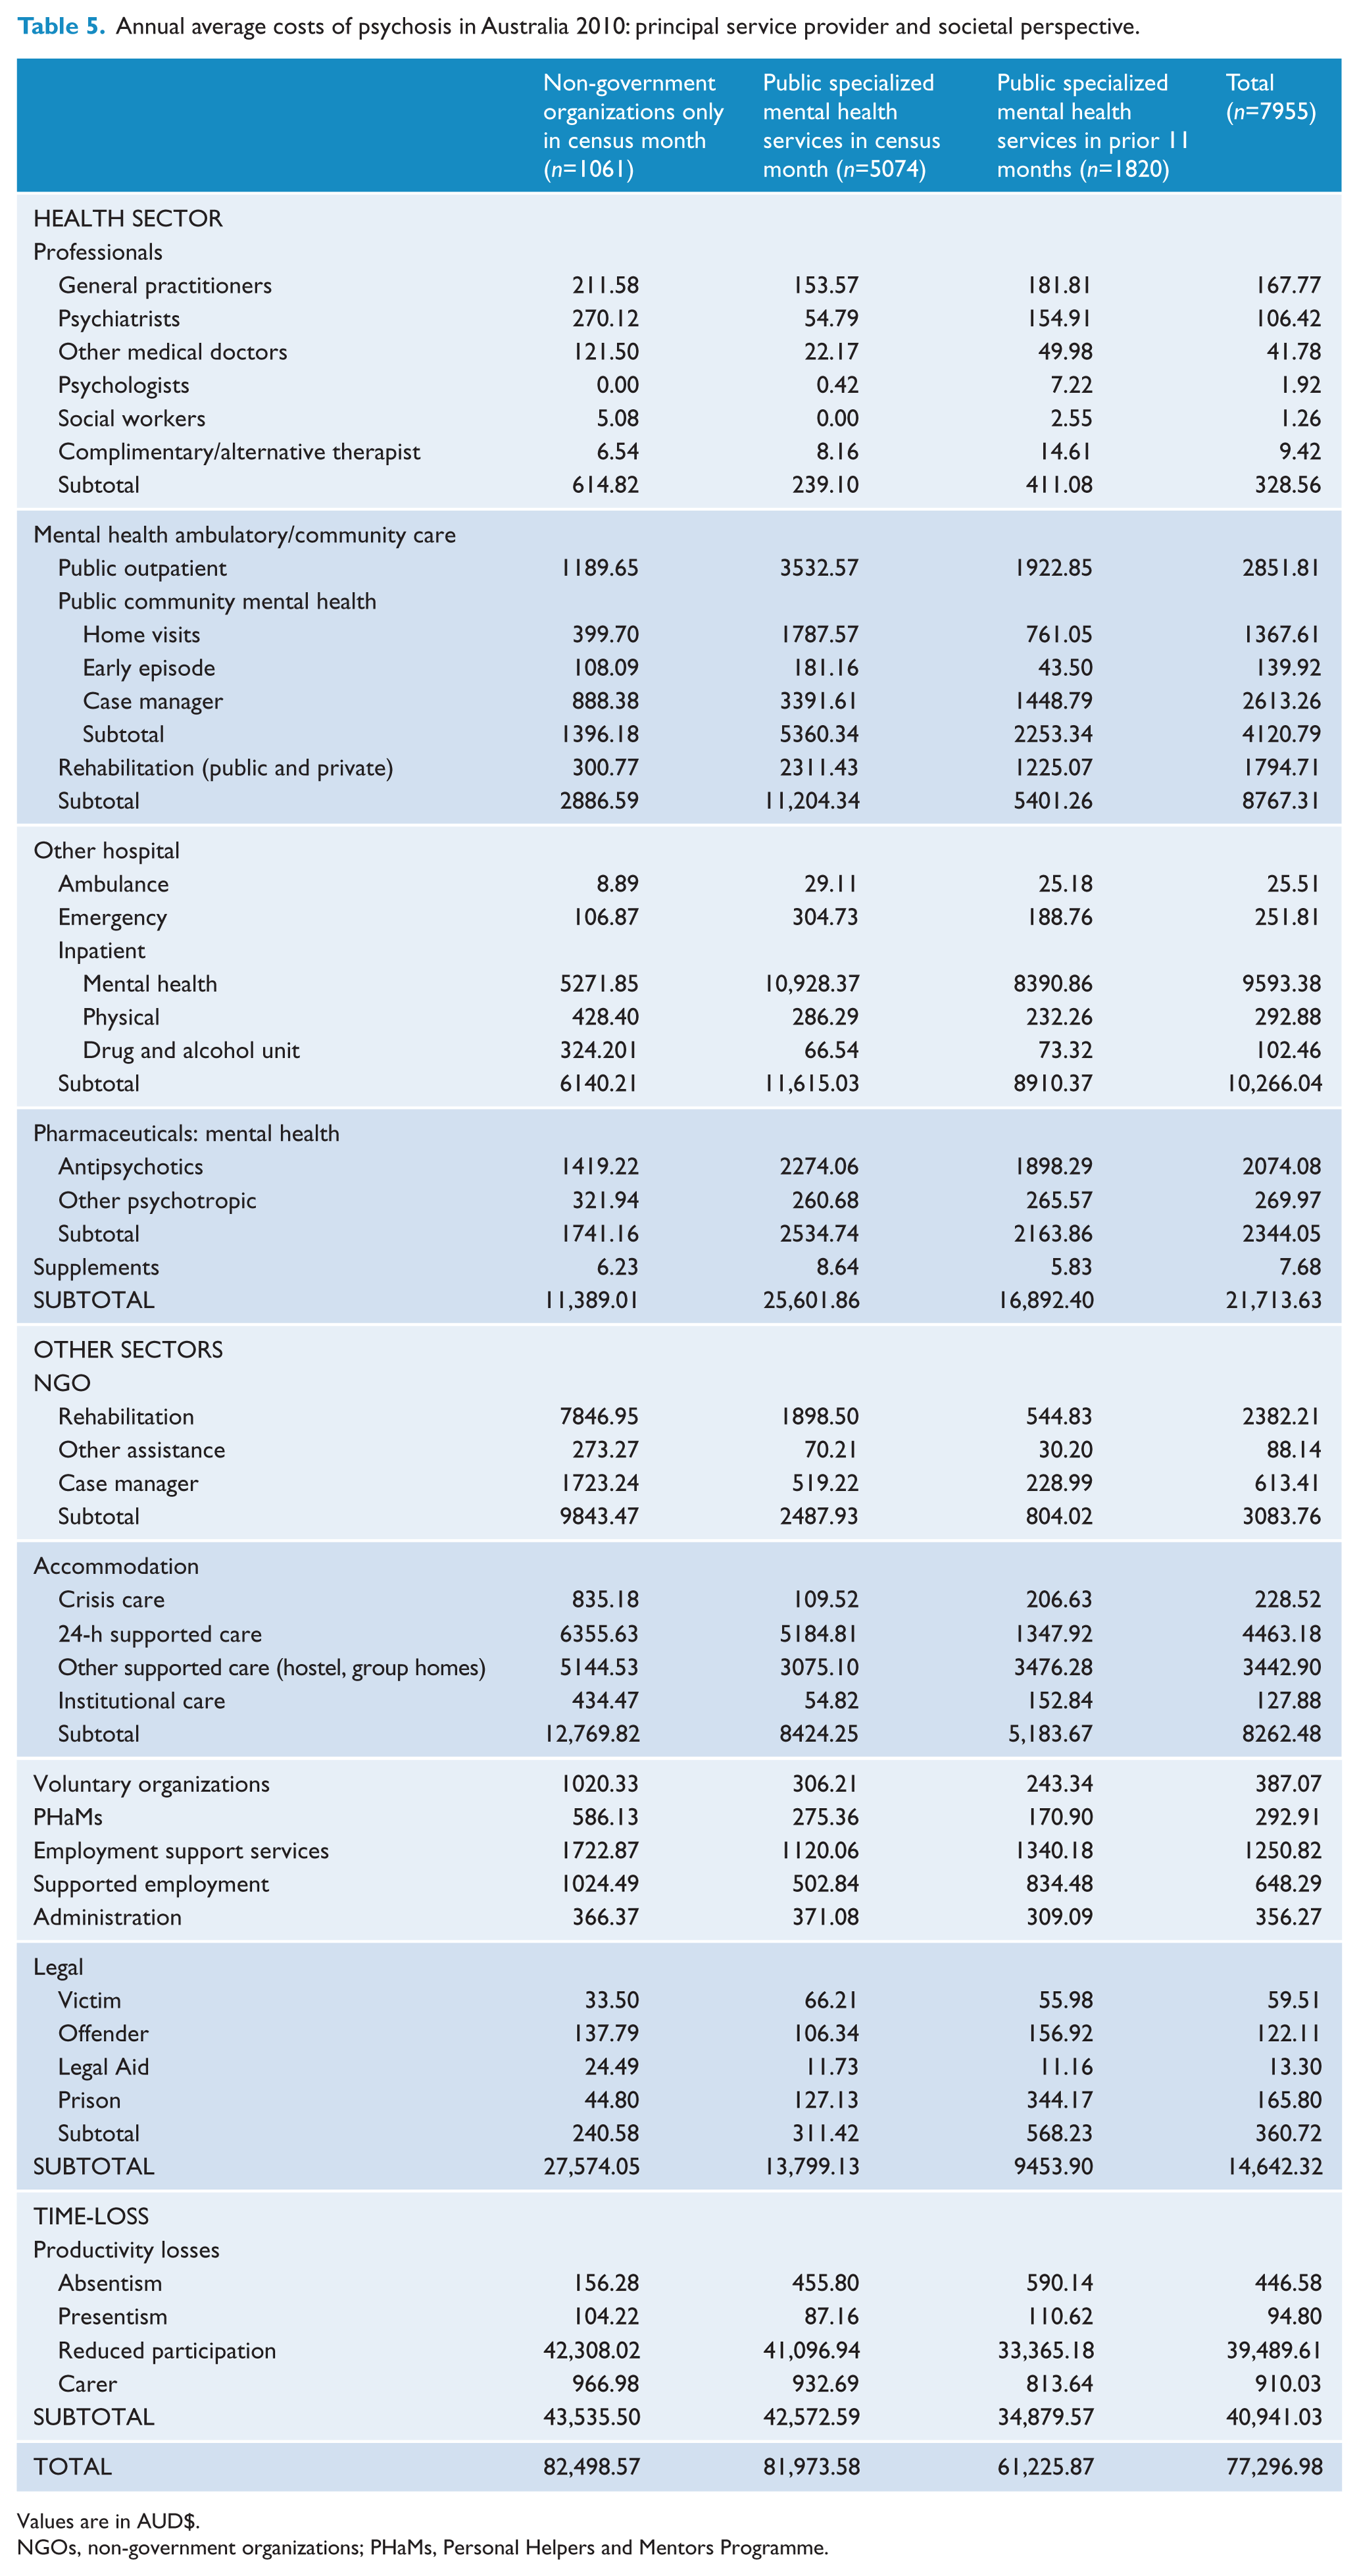
Values are in AUD$.
NGOs, non-government organizations; PHaMs, Personal Helpers and Mentors Programme.
Average costs of psychosis in Australia 2010: principal service provider, major cost categories and selected service items, societal perspective.
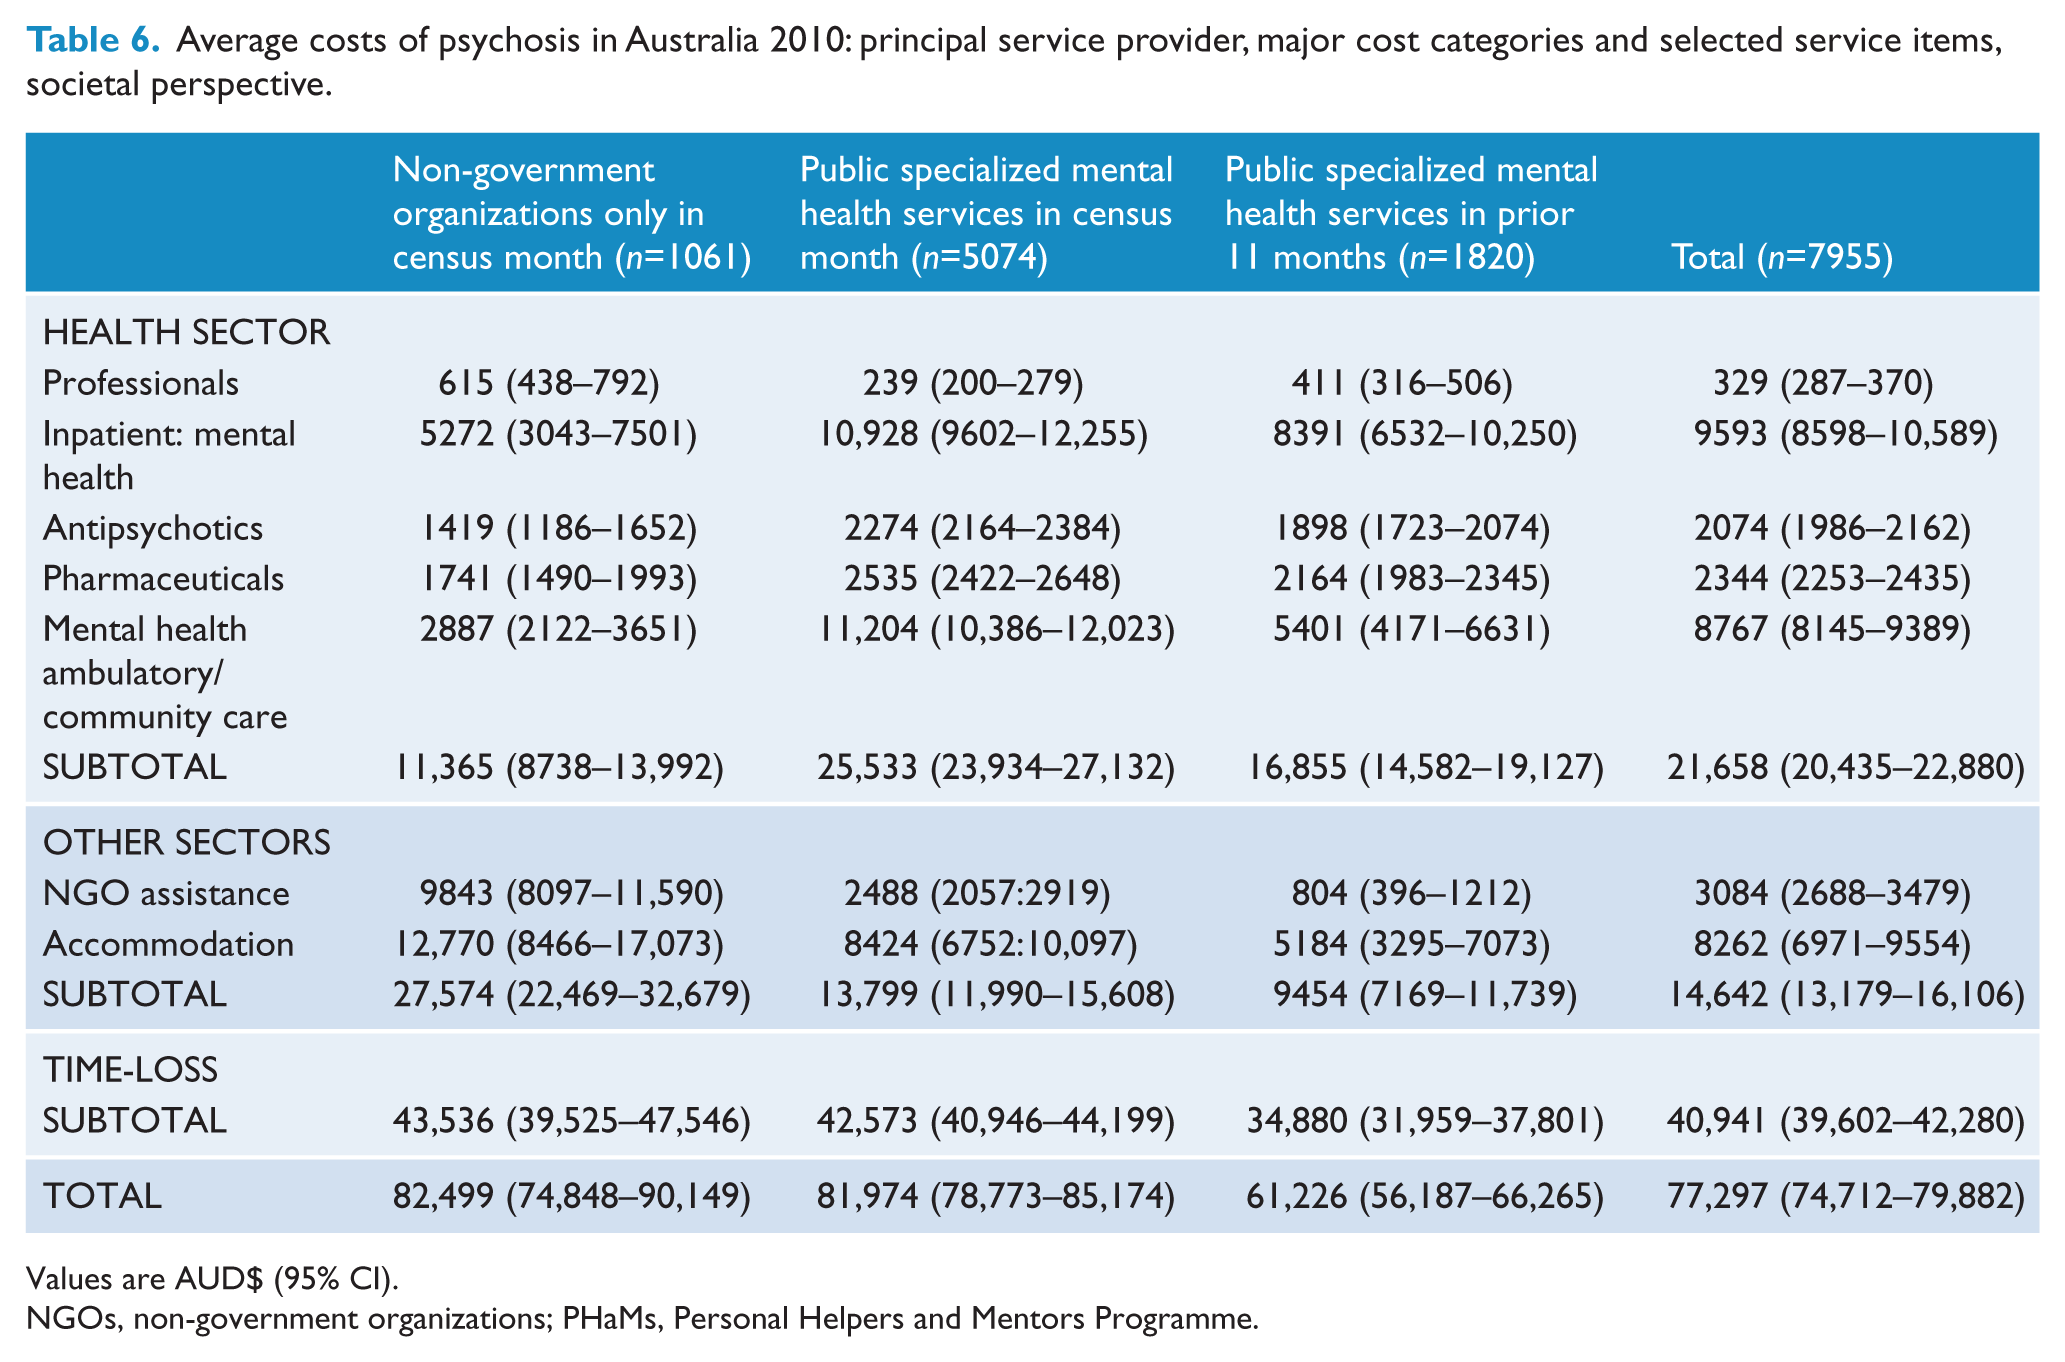
Values are AUD$ (95% CI).
NGOs, non-government organizations; PHaMs, Personal Helpers and Mentors Programme.
Across all categories, weighted costs were found to be significantly associated with principal service provider: total costs (F(2,1822)=24.418, p < 0.001), health sector costs (F(2,1822)=47.278, p < 0.001), other sector costs (F(2,1822)=20.641, p < 0.001), and time-loss costs (F(2,1822)=10.889, p < 0.001). As detailed below, the relationships between costs and principal service provider are highly dependent upon the cost category and individual resource items within those categories.
For total, other sector and time-loss costs, the costs were highest for current NGO clients and lowest for recent PSMHS clients. For other sector costs, and NGO costs within this category, this gradient is particularly strong, with significant differences observed between costs for each principal service provider. Otherwise, significant differences are observed between the two extremes only.
Within the health sector, a strong three-tiered gradient is observed overall, as well as for ambulatory costs and antipsychotics. The highest costs are observed for current PSMHS clients and the lowest for current NGO clients. Similar but weaker gradients are observed for pharmaceutical costs and mental health inpatient costs. In contrast, for professionals, costs are highest for current NGO clients and lowest for current PSMHS clients. Thus the distribution of health sector costs and individual line items thereof, differs markedly dependent upon the principal source of service provision.
Discussion
The current COI analysis provides a comprehensive assessment of the resource impacts arising from the treatment, care, and support of people with psychosis in Australia in 2010. The costs of psychosis to Australia are substantial in breadth and extent, at $4.91 billion, consisting of $2.31 billion in direct costs across health and other sectors and $2.60 billion in morbidity-related productivity losses. Given the typically chronic or recurring nature of psychosis, these costs are unremitting and will remain so without the implementation of effective and efficient preventive, treatment, and support strategies. While COI studies can highlight the potential impacts of effective strategies through cost modelling (see Carr et al., 2002), the determination of worthwhile (i.e. cost-effective) strategies is beyond their scope.
On the basis of health sector costs estimated in this analysis ($1.38 billion) and total Australian health expenditure in 2009–10 of $117.2 billion (excluding research) (Australian Institute of Health and Welfare, 2011), psychosis, with an annual treated prevalence of 0.45% in PSMHS (Morgan et al., 2012), accounts for almost 1.2% of total health expenditure. In turn, the annual average disorder-specific health sector costs for psychosis at $21,658 per person is over 3.9-times the level of expenditure for the general population of $5479 per person. Government subsidizes over 97% of the estimated health sector costs for psychosis.
At an average of $9593 per person, the costs of psychiatric inpatient admissions are the largest single health sector cost, contributing 44% of the total. These costs were generated by the third of the population with at least one psychiatric admission, the annual average being 1.6 admissions. Overall, hospital costs of $10,266 are 5.0-fold greater than the estimated Australian population average of $2059 (Australian Institute of Health and Welfare, 2011: Tables A6, E1).
Pharmaceutical costs for psychosis are 1.0% of total national prescribed medication expenditure of $14.4 billion (Australian Institute of Health and Welfare, 2011). Population expenditure on pharmaceuticals captured in the current analysis comprises 5.4% of the known expenditure on those agents in Australia, based on cost data reported in Australian Statistics on Medicine 2009 (Department of Health and Ageing, 2011). If limited to antipsychotic medication only, this figure increases to 30.4%. For clozapine, 80% of total expenditure on this drug during 2009 is accounted for in the current analysis (Department of Health and Ageing, 2011).
In turn, around 60% of national antipsychotic drug expenditure is on people outside of the selection parameters for this study. While some of these individuals would have psychotic disorders (e.g. people with psychosis who are aged 13–17 years, elderly, imprisoned, or treated privately by psychiatrists or GPs) or other approved indications for antipsychotic drug use (e.g. behavioural disturbance in children with developmental disorders), they would only account for a minority of this 60%. Thus, the data imply a very large amount of off-label use of antipsychotic drugs, the existence of which has been identified previously (Hollingworth et al., 2010, 2011). With regard to clozapine, the higher proportion of overall expenditure accounted for arguably reflects tighter controls around this agent, with clozapine supplied through the Highly Specialised Drugs Program. The question thus arises how to ensure appropriate and cost-effective use of all antipsychotic agents.
Of particular interest is expenditure of an estimated $1 million of disposable income on complementary therapies. This expenditure is by people who identify financial constraints as their primary concern. There are no significant differences in costs for alternative therapists or supplement use by principal service provider or age (data not shown). At least two questions arise. What benefits are participants receiving that they are expending meagre disposable income in this manner? Who is recommending supplements for use? Over half the respondents taking supplements had discussed their supplement use with their doctor.
Within the National Mental Health Report 2010 (Department of Health and Ageing, 2010), the costs of supported accommodation, NGO service provision, and national programmes and initiatives under the COAG Action Plan on Mental Health (e.g. PHaMs) come under the umbrella of specialist mental health services. Spending on specialist mental health services in 2007–08 was $5.32 billion (Department of Health and Ageing, 2010); adjusting for inflation, this equates to $5.87 billion in 2010 prices. On the basis of the current analysis, the costs of specialist mental health services for psychosis are estimated at $2.09 billion and thus, at least 39.3% of total specialist mental health service expenditure. The extent of expenditure is not unexpected, given that psychotic illnesses are held to ‘account for most of the costs of specialized mental health care in Australia’ (Department of Health and Ageing, 2010). This importance is reflected across individual cost categories, with the estimated expenditure for psychosis on ambulatory care comprising 44.0% of all expenditure on such care; inpatient services 35.8%; pharmaceuticals 20.3%; and NGO services 87.7%.
The primacy of productivity losses in the generation of total societal costs is consistent with previous analyses in Australia and internationally (Access Economics, 2002; Carr et al., 2003; Knapp et al., 2004; Mangalore and Knapp, 2007). Their importance reflects the fact that psychosis can undermine an individual’s short- and long-term education and employment prospects (Waghorn et al., 2012). For example, in the 7 days prior to interview, 21.5% of participants were employed compared with 72.4% of the working age population (15–64 years) in July 2010 (Australian Bureau of Statistics, 2010b).
The extent of productivity losses in the current analysis, 53.0% from the societal perspective, is similar to 51.7% estimated for schizophrenia (broadly defined) in the USA in 2002 (Wu et al., 2005). In comparison, levels of up to 70.1% in the UK (Mangalore and Knapp, 2007) and 83.0% in South Korea (Chang et al., 2008) have been estimated. Compared with the UK (Mangalore and Knapp, 2007), which has a comparable healthcare system, subject to similar socioeconomic and cultural factors (De Hert et al., 1998; Pang, 2002), the lower proportionate contribution of productivity losses in our study and also Wu and colleagues (2005) is primarily believed to be due to the adjustment for underlying levels of unemployment and the exclusion of transfer payments in the latter two studies. In Mangalore and Knapp (2007), as in some other studies (Langley-Hawthorn, 1997; Access Economics, 2002), income-related transfer payments have been included, in addition to productivity losses in the assessment of total costs. Mangalore and Knapp (2007) acknowledge that such an approach is inappropriate from an ‘efficiency standpoint’, but argue that ‘from a distributional perspective it is helpful to know what these payments amount to, as they represent transfers of wealth from one part of society (taxpayers) to another (social security recipients)’. We agree that the calculation of psychosis-related transfer payments is worthwhile in the assessment of costs of illness, but from a government perspective only, to provide information on financial costs incurred. To include transfer payments from a societal perspective is inappropriate, leading to double-counting of time-loss costs.
In the current analysis, time-loss costs from the government perspective are 56.8% of the estimate from the societal perspective. This is a direct reflection of the comparative value of the average weekly earnings and the DSP. In August 2010, average weekly earnings were $982.90 ($1188.10 for males and $774.20 for females), whereas the value of the DSP, including supplements for a single person, was $350.55 per week (i.e. less than half of average weekly earnings). In turn, we argue that psychosis-related transfer payments, as income replacement payments, can be viewed as a lower bound of productivity losses.
Over the 12 months prior to interview, government income support was the main source of income of 85.0% of this population, with 73.7% receiving a DSP, 93.4% of whom received this support over the entire year.
Productivity losses for people with a mental illness on a DSP have been estimated at $9.69 billion in 2007–08 (Department of Health and Ageing, 2010), assuming that the average recipient, if in employment, would attract 75% of the average national wage. Assuming no growth in the number of people requiring pensions, this equates to $10.69 billion in 2009–10 (adjusted for inflation). Allowing for methodological differences between this study and our own, people with psychosis are estimated to give rise to over a fifth of productivity losses due to reduced labour force participation because of mental illness, a figure vastly out of proportion to the prevalence of psychoses relative to other mental disorders.
Recently, the cost of absenteeism and presenteeism in the Australian workforce due to mental illness was estimated at $5.9 billion in 2009 (Hilton et al., 2010). Based on the current analysis, psychosis makes limited ‘contribution’ to this lost productivity, which is not unexpected given the low levels of employment within this population, at a third the national average as detailed above.
Informal carers are a fundamental and valuable resource in the care and support of people with psychosis. The financial and intangible costs incurred by carers have not been specifically assessed in the current study, leading to gross underestimates of this burden (Awad and Voruganti, 2008). Even given this limitation, the importance of informal care is reflected in the value of forgone production that, at $58 million, is on par with the combined costs of supported employment and PHaMs. At the upper estimate of $147 million, the value compares with the costs of both pharmaceuticals and rehabilitation provided through NGO services.
Overall, the variety and extent of resource use differs by principal service provider between and within cost categories. As such, people being supported within each of these service environments can be considered to be distinct cohorts. One hypothesis is that the principal service providers capture individuals at different stages of illness.
For example, it is postulated that clients who received support through the PSMHS during the census month comprise acute and/or recently active chronic cases as reflected in the highest level of mental health ambulatory, inpatient and antipsychotic costs, and the lowest level of professional costs for consultations in the private sector.
Individuals captured through utilization of PSMHS services in the 11 months prior to census potentially constitute patients in transition or experiencing ‘early’ recovery. They are more engaged in the workforce as reflected in lower levels of productivity losses for reduced participation and receive the second highest levels of mental health ambulatory and community care and have the second highest antipsychotic usage. The group is not homogeneous, however, with higher levels of variability across some line-items, such as 24-hour supported care, prison costs, and PHaMs (Supplement 5).
Individuals whose principal service provider in the census month was an NGO have the highest costs for NGO service provision and voluntary organization service provision. They place the greatest demands on other sector services and the least on specialized mental health services. Elsewhere, these individuals have been identified as having more impaired functioning, being older, and more chronically ill than individuals whose principal service provider was PSMHS (Morgan et al., 2011 chapter 16; Raudino et al., 2014). In aggregate, these data support a view of current NGO clients as comprising people in long-term recovery.
Thus it appears that using principal service providers and recency of contact as a framework within which to characterize the needs of affected individuals could facilitate the design and implementation of efficient and targeted service delivery and the opportunity to fully operationalize ‘wrap around care’ – providing care in an integrated and cohesive framework of service providers of varying expertise (Lee et al., 2010).
Strengths and limitations
These results support Gustavsson and colleagues (2011) regarding the importance of data representativeness in the assessment of COI. Convenience samples are not adequate and data representativeness should be formally considered in all future COI studies.
Moreover, the assessment of COI at the individual-participant level provides a powerful basis for analysis, underpinned by the simultaneous comparison of diverse arrays of resource utilization through a single value metric. Such information is of particular benefit in subgroup comparisons, identifying similarities and differences, and identifying areas for further research and/or policy implementation. The use of a single source of data for resource use strengthens the current study in this regard.
The survey design did not aim to capture healthcare provision for people solely in the care of private providers or service utilization by those who had dropped out of all contact with agencies. The analysis does not encompass young (<18 years) or older (>64 years) individuals with psychosis, nor those imprisoned at the time of census. The impact of their inclusion on average costs is unknown. Extrapolation of the average cost is conservatively based on PSMHS 12-month treated prevalence. The economic burden of carers was limited to an assessment of productivity losses. Intangible costs were not assessed for either carers or individuals with psychosis. However, the respondent’s valuation of their health state assessed using the Assessment of Quality of Life (AQoL) (Hawthorne et al., 1999) will be explored in a forthcoming analysis.
Conclusions
The costs of psychosis to Australia are significant in breadth and extent, and disproportionately high relative to psychosis prevalence. Assessed at $4.91 billion in 2010, the main costs are morbidity-related productivity losses of $2.60 billion, with health sector costs, especially inpatient care, contributing $1.38 billion. Given the chronic or recurring nature of psychosis, these costs, which are predominantly subsidized by government, will remain unremitting without the implementation of effective and efficient prevention, treatment, and support strategies. The determination of worthwhile (i.e. cost-effective) strategies needs to be ascertained separately. A needs-based framework based on principal service provider and recency of contact may facilitate this process.
Footnotes
Acknowledgements
This publication is based on data collected in the framework of the 2010 Australian National Survey of High Impact Psychosis. The members of the Survey of High Impact Psychosis Study Group are: V Morgan (Project Director); A Jablensky (Chief Scientific Advisor); A Waterreus (Project Coordinator); A Mackinnon (Chief Statistical Advisor); R Bush, D Castle, M Cohen, C Galletly, C Harvey, P McGorry, J McGrath, H Stain (Site Directors); V Carr (Australian Schizophrenia Research Bank); A Neil (Health Economics); B Hocking (SANE Australia); S Saw (Australian Government Department of Health and Ageing). Ethics approvals for the study were obtained from relevant institutional human research ethics committees.
This report acknowledges, with thanks, the hundreds of mental health professionals who participated in the preparation and conduct of the LPDS and SHIP surveys and the many Australians with psychotic disorders who gave their time and whose responses form the basis of this publication.
Funding
The study was funded under contract to the Australian Government Department of Health and Ageing.
Declaration of interest
The authors report no conflicts of interest. The authors alone are responsible for the content and writing of the paper.
References
Supplementary Material
Please find the following supplemental material available below.
For Open Access articles published under a Creative Commons License, all supplemental material carries the same license as the article it is associated with.
For non-Open Access articles published, all supplemental material carries a non-exclusive license, and permission requests for re-use of supplemental material or any part of supplemental material shall be sent directly to the copyright owner as specified in the copyright notice associated with the article.