
Abstract
Although the phrase ‘scarce resources’ in the health care context has achieved cliché status, it reflects the reality that rationing within the health care sector is commonplace, albeit uncommonly acknowledged. Given the finite nature of resources, their allocation to particular health services–whether in response to increased need, potential health gain, new technology or political advocacy–comes at a cost, the opportunity cost. The opportunity cost is the benefits (of the next best alternative) that are foregone by committing resources to the chosen alternative. For example, the opportunity cost of increasing services to persons with one mental disorder may be a decrease in health outcomes arising from a reduction in services to persons with another mental disorder. As awareness of these constraints on health expenditure grows, increasing attention is being directed towards resource allocation in psychiatry, as in other medical specialties.
It has been argued that the determination of resource allocation priorities within mental health care should be based on burden of disease estimates and the costeffectiveness of available interventions [1, 2]. However, the use of burden of disease data for informing resource allocation decisions, particularly short-term allocations, is not universally accepted, and criticisms have been made on conceptual and methodological grounds [3, 4] with debate on this issue not yet resolved [5, 6]. On the other hand, the need to consider the costeffectiveness of interventions in making resource allocation decisions is not in contention. To do otherwise would be to leave such decisions with no rational basis, and subject to historical tradition and the influence of pressure groups, or based on consequences alone; each scenario leading to inefficiency in resource utilization. In considering the cost-effectiveness of interventions in mental health care, it is also essential that ‘intangible’ or psychosocial ‘costs’ and equity implications are given due weight.
Cost of illness (COI) studies aim to quantify the economic costs borne by individuals and organizations arising from a particular disease. Like other burden of disease research, COI studies can be used to draw attention to areas of apparent high or low burden, and thereby alert policy makers to areas of potential need. However, as COI valuations do not compare costs and benefits of competing treatment alternatives, they do not directly address the issue of economic efficiency, that is, whether an intervention is cost-effective. Despite this limitation, when based on patient-level data, COI studies can help identify areas where the potential exists for more efficient use of existing resources, and provide baseline data about pathways and costs for a range of economic evaluations [7, 8].
Cost of illness studies can be based on either prevalence or incidence figures. Prevalence-based estimates assess the economic burden of all cases of a disease (both pre-existing and new cases) in a given population over a defined period, usually a year. Incidence-based estimates assess the lifetime economic burden of all new cases of a disease occurring in a given population in a defined period, again usually a year. Thus, prevalence estimates can be used as an indication of the costs of providing health care, while incidence-based studies are particularly useful for estimating the potential benefits of prevention programmes. For example, an earlier Australian study used an incidence-based approach to estimate the costs of schizophrenia [9, 10], the results of which were employed to model the economic impacts of reduced incidence, improved prognosis and a shift to community care [11]. However, most COI studies are prevalence-based [e.g. 12–15].
Methods for calculating illness costs are generally either ‘top-down’ or ‘bottom-up’. The former approach entails disaggregating national or regional expenditure records by diagnosis [e.g. 12,15], while the latter involves the application of unit cost estimates (i.e. for each element of service use) to each individual, which are then averaged [e.g. 11,16].
Within the COI literature, costs are generally defined as direct or indirect costs. Direct costs encompass the goods and services, medical and non-medical, used in relation to a given disease. Indirect (or productivity) costs represent economic products (goods and services) that are not produced owing to the morbidity and mortality associated with the disease. Indirect costs have traditionally been measured using the ‘human capital’ approach in which lost productivity is estimated as discounted earnings, with earnings reflecting productivity at the margin. An alternative method, the ‘frictioncost’ approach, has been put forward recently, which is based on the time taken to reorganize production processes owing to the loss of a worker through illness or death. However, this method does not include the full costs of lost productivity, only the social cost of employment transition [17], and therefore results in lower cost estimates, as shown in a recent study of the costs of schizophrenia [18].
The present paper provides estimates of the average and total population costs for psychotic disorders employing a prevalence-based approach using data derived from the Low Prevalence (Psychotic) Disorders Study [19, 20]. The costs have been estimated using the ‘bottom-up’ method, and indirect costs estimated using a modified ‘human capital’ approach. The analysis also aims to identify the main cost drivers, compare the costs of illness for various diagnostic groups and examine the relationships between costs, demographic variables and levels of disability. Further, given the richness of the data, the current study raises questions about how funds are being spent on this group of disorders, and whether this expenditure represents value for money.
Method
A detailed account of the design and methods for the Low Prevalence Disorders Study (LPDS) has been published [19, 20]. This two-phase, census-based study was conducted in four metropolitan locations in Australia (Australian Capital Territory, Queensland, Victoria, Western Australia) in 1997–1998. The inclusion criteria were: age 18–64 years, and a diagnosis of any non-organic or non-substance induced psychotic disorder according to ICD-10 criteria. Phase 1 comprised a one-month census of all individuals in contact with ‘mainstream’ mental health services in the four participating locations. This sample was supplemented by patients drawn from the caseloads of General Practitioners (GPs) or private psychiatrists in the participating locations, persons of no fixed abode or living in marginal accommodation, and persons with previous service contacts but not in contact with the services in the census month. All eligible consenting subjects were screened for psychosis using a set of six questions targeting psychotic symptoms [20]. Phase 2 comprised standardized interviews with a stratified random sample (n = 980) of the screen-positive individuals (n = 3797). Exclusion criteria for the study were: temporary visitor status in Australia; significant cognitive deficit; residence in a nursing home or prison; and inability to communicate adequately in English.
Measures
The postscreening assessment instrument was the Diagnostic Interview for Psychosis, a semistructured diagnostic interview comprising three modules: (i) demographic and social functioning, including selected items from the World Health Organization (WHO) Disability Assessment Schedule [21]; (ii) diagnosis using the Operational Criteria for Psychosis [22] and elements of the WHO Schedules for Clinical Assessment in Neuropsychiatry [23]; and (iii) reported usage of a range of hospital- and community-based services in the past year. Interviews were conducted by trained clinical interviewers, for whom there was a satisfactory level of interrater diagnostic agreement (generalized Kappa = 0.73 for ICD-10 diagnoses).
We described the LPDS service utilization measures in another paper [24] and reported 12-month service utilization patterns among those with psychotic disorders (excluding participants who had been hospitalized for more than 6 months). In short, LPDS participants reported their extent of service use during the previous 12 months in the following categories: inpatient hospitalization (psychiatric and non-psychiatric); outpatient services (psychiatric and non-psychiatric), which included attendances at hospital and community clinics or receiving home visits from a community mental health team; and emergency service contacts (psychiatric and non-psychiatric), which included use of community-based mental health crisis teams. Use of psychiatric rehabilitation services, and consultations with psychiatrists and psychologists in private practice and GPs were also recorded for the previous 12 months. The numbers of participants using these services in the previous year were calculated, and the extent of usage by those who accessed the services was measured, in weeks for inpatient hospitalization and number of contacts for all other service use variables. Medications used by the participants in the previous year were also recorded. The main disability measure was the Social and Occupational Functioning Assessment Scale (SOFAS) [25], which ranged from 0 to 100, with higher scores indicating better functioning.
Cost estimation
Resources consumed were considered to fall into three categories: health care sector; patient and family; and other sectors, as proposed by Drummond and colleagues [26]. The health care sector encompassed resources used in providing initial and continuing care. The patient and family sector comprised out-of-pocket expenses incurred in seeking and receiving care, and time ‘lost’ by the patient and family during this process or arising from the death of the patient. Psychosocial or ‘intangible’ costs could not be given a monetary value, given the methodology of the LPDS, and were therefore not included in the cost calculations. Resources used in other sectors depended on the nature of the programme of care, and could include home-care services and inputs provided by the voluntary or non-government sector.
In the current analysis, a disaggregated version of a three-category approach was employed in the first instance, allowing ‘direct’ and ‘indirect’ costs to be estimated. The current analysis was also undertaken from two perspectives, government and societal. The societal perspective sought to determine the total estimable opportunity costs associated with the psychotic disorders. The analysis from the government perspective generated the financial costs of psychosis incurred by governments, both State and Federal. The distribution of cost units across the three categories, from both government and societal perspectives, is shown in Figure 1.
Financial cost categories from: (a), the government perspective; and (b), the societal perspective. Items asterisked (∗) indicate differing valuations employed for government and societal perspectives.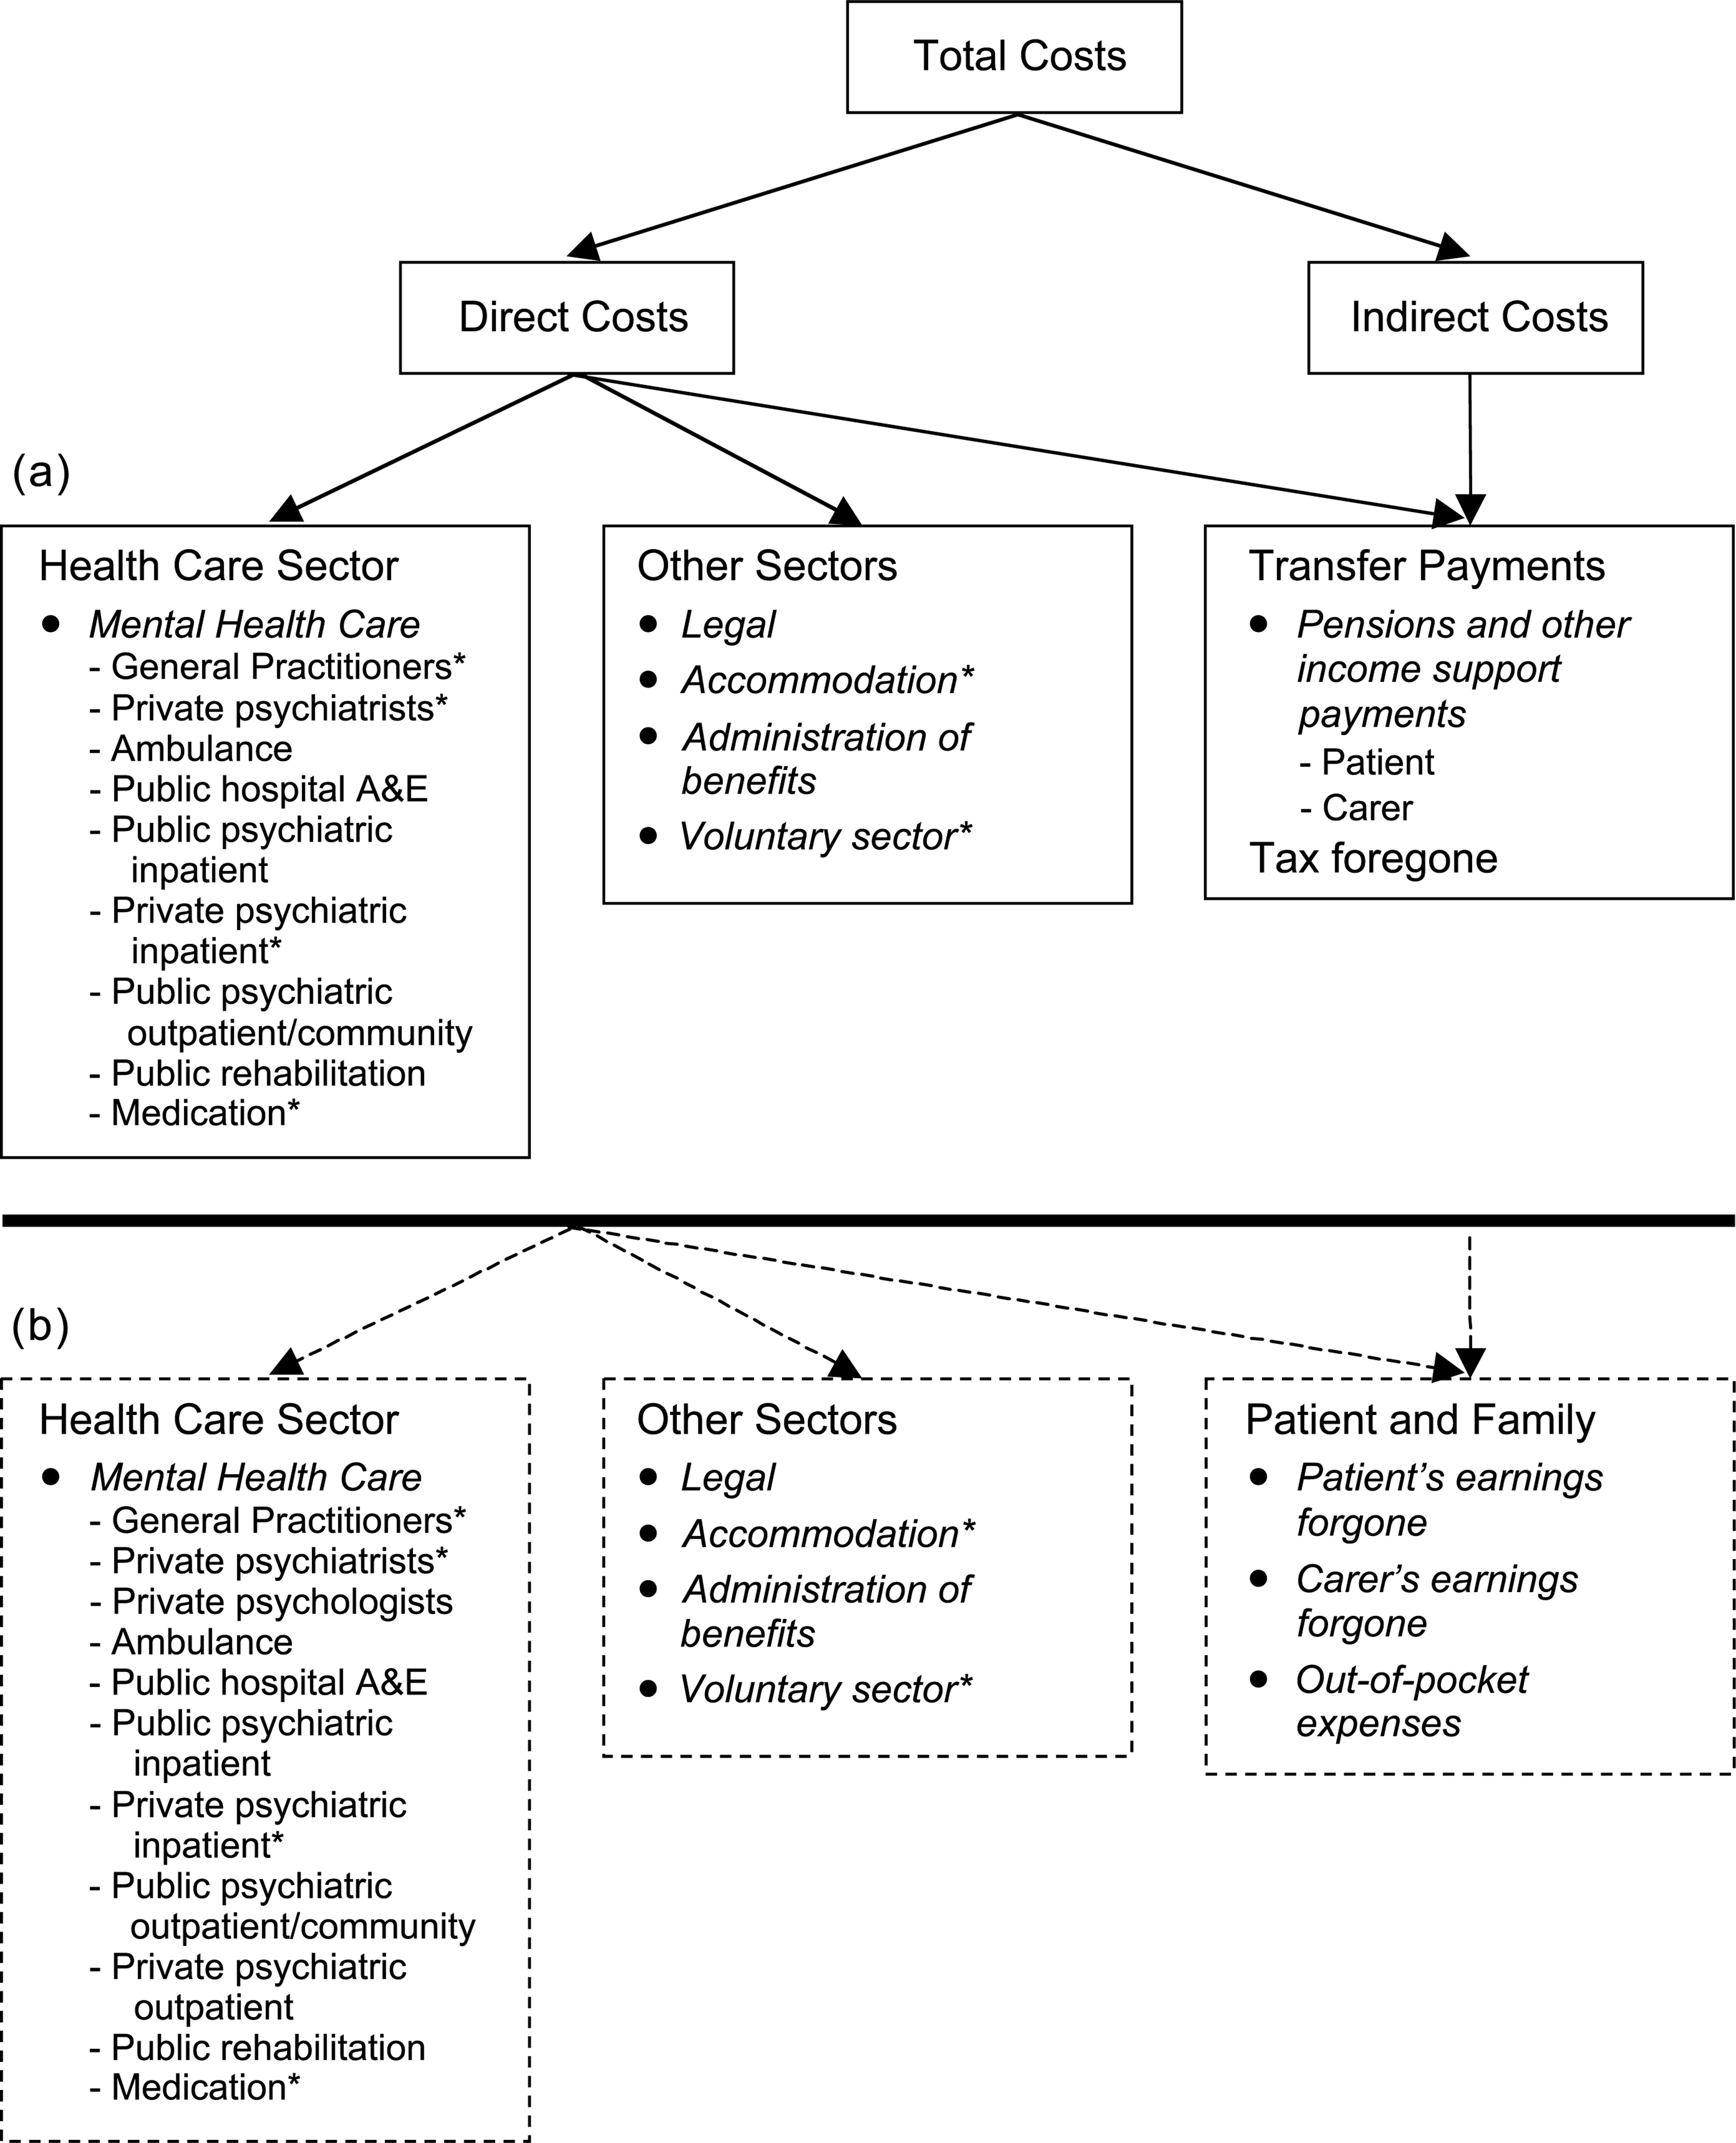
The general costs of providing health care (both societal and government perspectives) and the costs of transfer payments (government perspective only), which could not be regarded as psychosis-related, have been separately estimated. These costs encompass all nonpsychiatric inpatient and outpatient episodes of care (public and private), specialist consultations for non-psychiatric reasons, and the average number of GP consultations by gender for non-psychiatric reasons. Since these costs could not be regarded as attributable to psychotic illness they have not been included in the cost of psychosis calculations, nor any of the subgroup analyses.
Individual costs were estimated by multiplying the measured quantities of services and other resources utilized by their unit price. However, not all services and agencies, particularly community services involved in the supplementary care and support of people with psychosis, were recorded in the LPDS, or if recorded were not done so in a manner that enabled comprehensive costing. For example, information on incarceration was not recorded. Utilization of services provided by non-government or voluntary organizations such as mental health support groups, charities, religious organizations, as well as government social and welfare agencies were noted, but the number and types of services utilized were not recorded. However, conservative estimates of costs incurred within this sector have been made. In other instances, such as medication use, where only the identity of resources used was captured, conservative assumptions have also been made to obtain an estimate of resource use.
A set of standard (and conservative) unit prices was employed to value resource consumption. To make the study as relevant as possible, and reflecting the limited availability of some unit price data, costs have been estimated for the year 2000. It has been assumed that resource usage and practice patterns would not have changed significantly in the intervening period since the LPDS was conducted (1997–1998). The specific methodologies and assumptions employed in the calculation of costs are detailed in a separate bulletin [27] and further information is available from the authors on request.
From the individual costs, the average cost per person with treated psychosis was calculated. As the distribution of the achieved samples across the four recruitment locations, and by recruitment source within those locations, varied significantly χ 2 (19) = 488.4, p < 0.001), weights have been applied to each individual to reflect their probability of selection within each state and the size of the catchment area. The derivation of the weights is reported elsewhere (see bulletin [27], appendix 3). The weighted average cost per patient was then extrapolated to obtain a total estimate for the Australian urban population. This was based on the estimated one-month weighted prevalence of 4.7 per thousand within the 18–64 year-old age group [19, 20], and assuming 86% of the Australian population lives in urban areas. This equates to 48 784 persons with psychosis, given a population of 12 069 407 in the 18–64 years age group [Source: Table 6, Australian Bureau of Statistics, catalogue number 3101.0, June Quarter, 2000]. The one-month prevalence estimate was used as it had been calculated on the basis of the sampling frame from which the interviewed sample was drawn. Weighted cost estimates were used for calculating total population costs (i.e. aggregate ‘representative’ costs based on all 980 participants). Similarly, subgroup cost comparisons within the LPDS data set were based on weighted least squares analysis of covariance (ANCOVA w), which controlled for relevant covariates (e.g. gender) and included the weighting factor described above (i.e. to compensate for recruitment biases) as a regression weight in the least squares solution.
Results
The estimated annual cost of psychosis for the Australian urban population is approximately $1.45 billion from the government perspective and $2.25 billion from the societal perspective. As detailed in Table 1, these costs are largely comprised of direct mental health care costs and costs associated with time/productivity losses. The annual mental health care costs for the Australian urban population amount to $841 million from the government perspective and $867 million from the societal perspective. The costs of lost time/productivity have been estimated at $570 million per year from the government perspective and $1.34 billion from the societal perspective.
Costs of psychosis per year from government and societal perspectives
In view of the overall similarity in cost profiles for the government and societal perspectives (see Table 1), unless otherwise indicated, the subsequent analyses refer to the societal perspective. In practice, where necessary, we compared proportionate cost breakdowns for the two perspectives, or associations with other factors, to confirm that they were not significantly different.
Mental health care costs
As shown in Table 1, mental health care costs are primarily comprised of the costs of hospitalization. Inpatient costs, at $671 million per year from the societal perspective, account for 77% of mental health care costs. Inpatient costs were based on admissions to psychiatric facilities and drug and alcohol units. Some 46.6% of the sample had at least one inpatient psychiatric admission in the 12-month period, among whom the average (total) period of psychiatric hospitalization was 13.41 weeks (SD = 16.22, median = 6 weeks).
In contrast, the use of psychiatric outpatient or community mental health services by 55.6% of the sample accounted for only 9% of total mental health care costs. The use of emergency and crisis services, costed only in regards to occasions that were for a psychiatric problem, drug overdose, deliberate self-harm or substance use problems, gave rise to less than 1% of mental health care costs. The use of rehabilitation services or day programmes by a minority of patients (19.1%) accounted for a very small proportion (4%) of mental health care costs, less than the expenditure on medication (5%).
Other limited contributors were GP services (above background levels), which gave rise to 1% of mental health care costs, and private psychiatrist services, at less than 3%. General practitioner costs were estimated for all visits over and above the average number of GP visits per year by gender for the general population (5.5 for males, 7.5 for females). Among those who visited a GP at least once during the previous year (81% of the sample), the average number of GP visits per year was 11.14 (SD = 13.50). Private psychiatrist cost estimations included office practice visits, which were all assumed to be psychosis related, and imputed visits to private hospital inpatients.
On the basis of the results, it was estimated that patients with psychosis accounted for 6.3% of public expenditure for mental health services provided by GPs, 11.7% of public expenditure on private psychiatrist services and 88.5% of all public expenditure on psychiatric inpatient services, drug and alcohol units excluded. It was further calculated that the medication costs associated with psychosis amount to 19.6% of the total costs of psychotropic medications used in Australia (see bulletin [27], section 2.1.5, for details).
Other sector costs
Other sector costs were estimated at $34 million and $44 million, from the government and societal perspectives, respectively. As shown in Table 1, these costs comprised the costs of administrating a limited number of government benefits, the costs of services provided by non-government organizations (NGOs) and other voluntary groups, subsidies for group and supported accommodation, and some legal costs.
Legal costs were substantially underestimated because: no data were available to estimate costs involved in police apprehension and transport of involuntary patients or the operation of the various state mental health acts; criminal justice costs were based only on reported rates of having been a victim of violence (18%) and/or arrested for an offence (10%); and no basis for calculating costs of incarceration was included in the LPDS methodology.
The cost of providing services by NGOs and other voluntary groups was based on an estimated average of six occasions of service per patient per year and an estimate of the operating costs of these organizations. Some 5.1% of patients reported living in group homes or supported housing and this figure was used to calculate the costs of supported community accommodation based on a cost of $464 per week (with residents contributing an additional $75 per week).
Productivity/time loss associated costs
Patient and family costs included out-of-pocket expenses, limited to copayments for medical care and pharmaceutical costs, and ‘time-loss’ costs. Out-of-pocket expenses have been included within mental health care costs from the societal perspective, while time-loss costs have been estimated separately.
Time-loss costs would normally include mortality and morbidity costs. We estimated productivity losses arising from mortality on the basis of a 10% lifetime suicide risk and a 5% discount rate, which yielded a net present value of mortality costs of approximately $75 million per year for the Australian urban population (or an average of $1530 per patient). However, since the design of the LPDS necessitated an assumption of zero mortality (i.e. the focus was on ‘treated prevalence’), we have excluded this figure for mortality costs in our overall cost calculations. This means that our estimates of costs due to productivity losses will be considerably underestimated.
In terms of morbidity costs, only 14.5% of males and 17.0% of females were employed and receiving wages from an employer, or income from their own business, in the month prior to interview. Further, only 29.5% of males and 25.4% of females had regular fulltime or part-time work over the previous year. This contrasts with 67.8% of males and 49.9% of females in the general population aged 15 years or over who were employed (as of December 1997). Using a modified human capital approach we calculated morbidity related costs as the product of age- and gender-specific average weekly earnings foregone and the age-specific male employment ratio. This approach was employed in recognition of child-rearing and housekeeping activities that reduce female participation in the formal labour market. Thus, ‘time-loss’ costs due to earnings foregone were estimated to be $26 460 per patient per year with a population total cost of $1.29 billion per year. Potential productivity losses in respect of carers were based on the finding that 91 of the LPDS participants indicated they had a designated carer at home, although only 13 of the 91 (1% of the sample) had a carer who was receiving a carer's pension (see bulletin [27], appendix 1.2.2.1, for costing details). Estimation of these 91 carers' productivity losses, owing to their inability to work or their need to reduce the proportion of their time spent working because of carer commitments, yielded an average cost of $1055 per patient per year or $51.5 million per year for the Australian urban population.
The costs of lost productivity from the government perspective have been estimated as tax foregone and the costs of a limited number of transfer payments. Government benefits or welfare payments to the patient that were assumed to be psychosis related were the Disability Support Pension, Sickness Allowance and Special Benefit. Other forms of benefit payments (e.g. Newstart, Sole Parents Allowance, Unemployment Benefit, Age or Service Pension, etc.) have therefore been excluded from the cost calculations in this category. Other items contributing to annual transfer payments included rent assistance, the pharmaceutical allowance and the carer's pension.
Tax foregone is an opportunity cost from the government's perspective, being the amount of tax the government would have earned if people with psychosis (and their designated carers) had been working as per their gender and age peer groups. The average annual tax foregone has been estimated at $3676 per patient, which includes $156 in respect of designated carers.
Costs and diagnosis
The distribution of the major ICD-10 diagnostic groups in the sample was: schizophrenia, 52.0%; schizo-affective disorder, 10.4%; bipolar disorder, mania, 11.4%; depressive psychosis, 6.8%; and other psychoses, 14.8%. Table 2 shows the costs estimated for each diagnostic group by gender from the societal perspective. Analyses of covariance (ANCOVA W), controlling for gender, were used to examine cost differences between the diagnostic groups, with mental health costs (F (4, 930) = 4.00, p < 0.01) and total costs (F (4, 930) = 6.64, p < 0.001) being significantly associated with diagnostic group. Schizophrenia was clearly the most costly of the psychotic disorders, consuming approximately $21 600 per patient per year in mental health care costs and accounting for total costs of $51 600 per patient per year. On a population basis this equates, in round figures, to $601 million per year in mental health care and $1.44 billion per year in total costs. By contrast, the affective psychoses accounted for approximately half of the annual costs per patient with schizophrenia in terms of mental health care.
Costs of psychosis per year by diagnostic group and gender, from a societal perspective†
Costs, age and illness duration
Mental health care and total costs per patient per year from the societal perspective were examined in relation to age and duration of illness, while controlling for gender. There were no significant effects of age or illness duration for mental health care costs. However, for total costs there were significant effects of age (F (4,974) = 6.96, p < 0.001) and illness duration (F (5,973) = 4.30, p < 0.001). These findings are illustrated in Figures 2a and 2b, respectively, where it can be seen that there is an increase in total costs in the middle age range and with illness duration in excess of 5 years.
Average societal costs per patient per year by: (a), age; and (b), duration of illness. (Weighted data corrected for gender). ▪, mental health care; □, non-mental health care.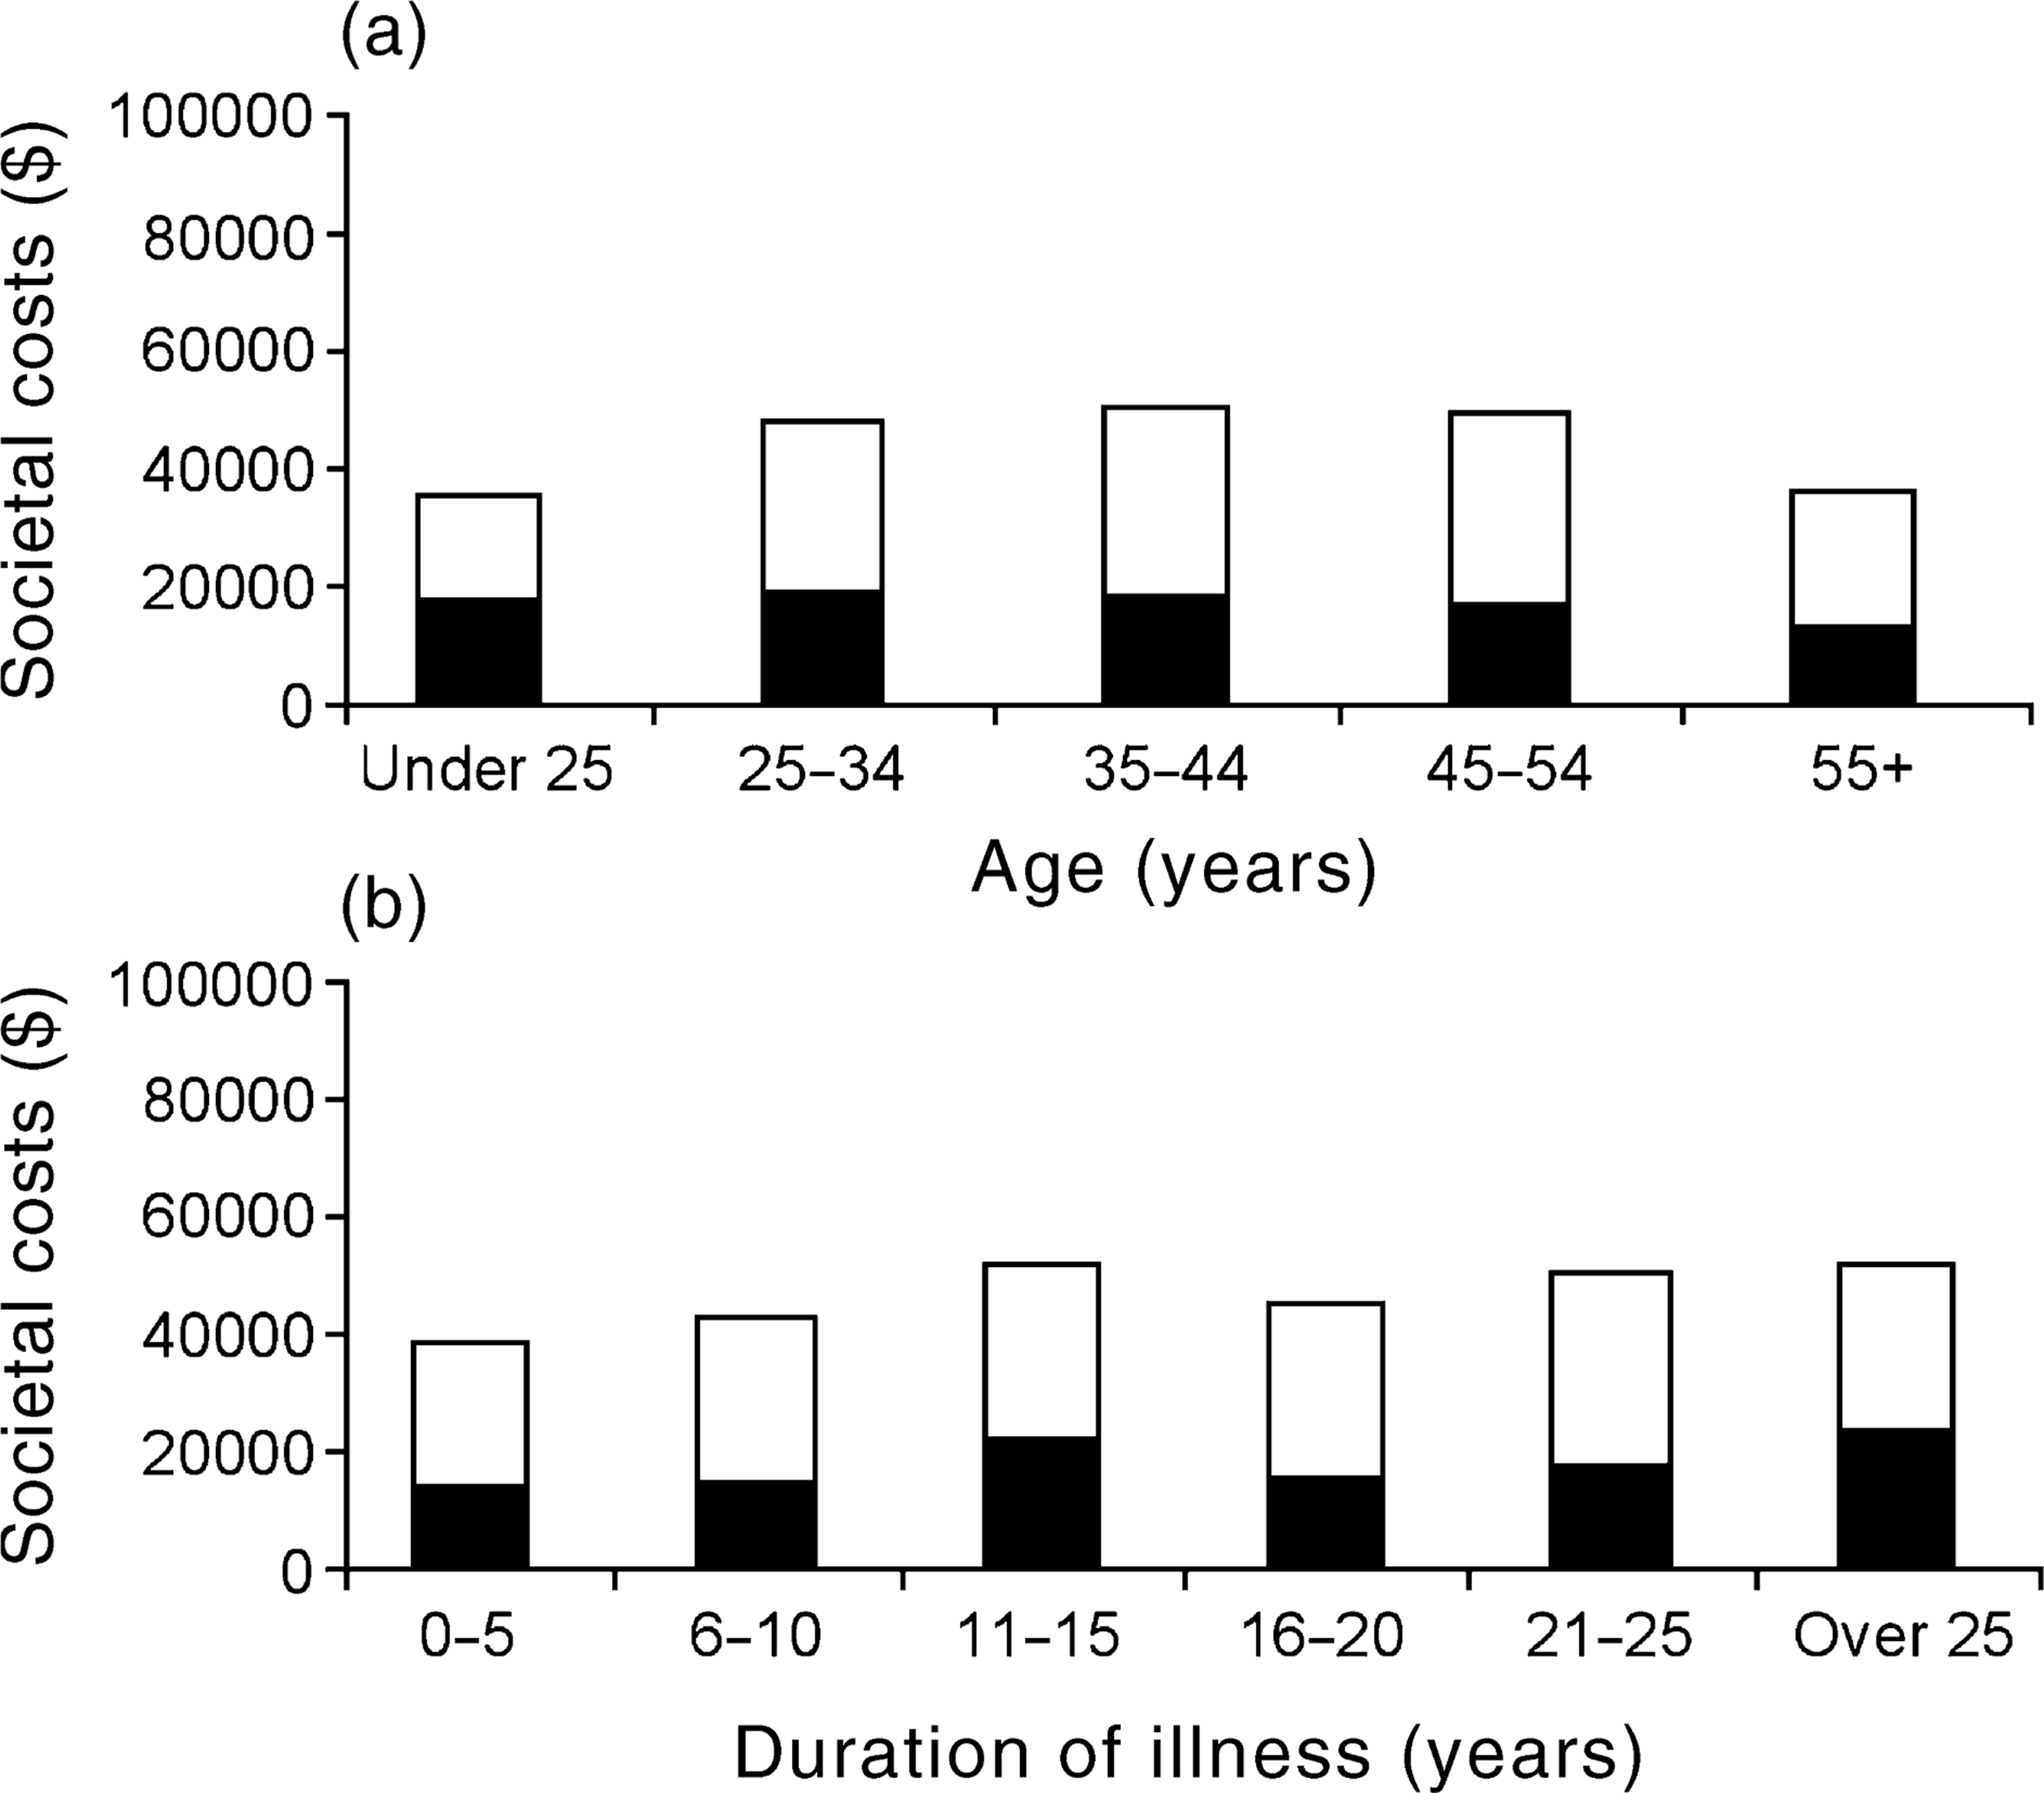
Costs, disability and levels of participation
Figure 3a illustrates the relationship between societal costs and increasing levels of social and occupational functioning as measured by the SOFAS. Controlling for gender, SOFAS group was significantly associated with mental health costs (F (7,971) = 19.82, p < 0.001) and total costs (F (7,971) = 30.87, p < 0.001). In each case, better functioning was associated with lower costs and poorer functioning with higher costs. Figure 3b shows the relationship between societal costs and full- or part-time employment, as well as other forms of participation such as study or housework, and enables comparisons with patients who were unemployed. Controlling for gender, current participation status was significantly associated with mental health costs (F (5,965) = 5.77, p < 0.001) and total costs (F (5,965) = 38.04, p < 0.001). Societal costs for the unemployed group were clearly much greater than for those in full- or part-time employment, and there were declining costs across those who gave housework, study and retirement as their main occupation, primarily reflecting differences in non-mental health care costs.
Average societal costs per patient per year by: (a), social and occupational functioning, as measured by the SOFAS; and (b), employment status and other forms of participation. (Weighted data corrected for gender). ▪, mental health care; □, non-mental health care.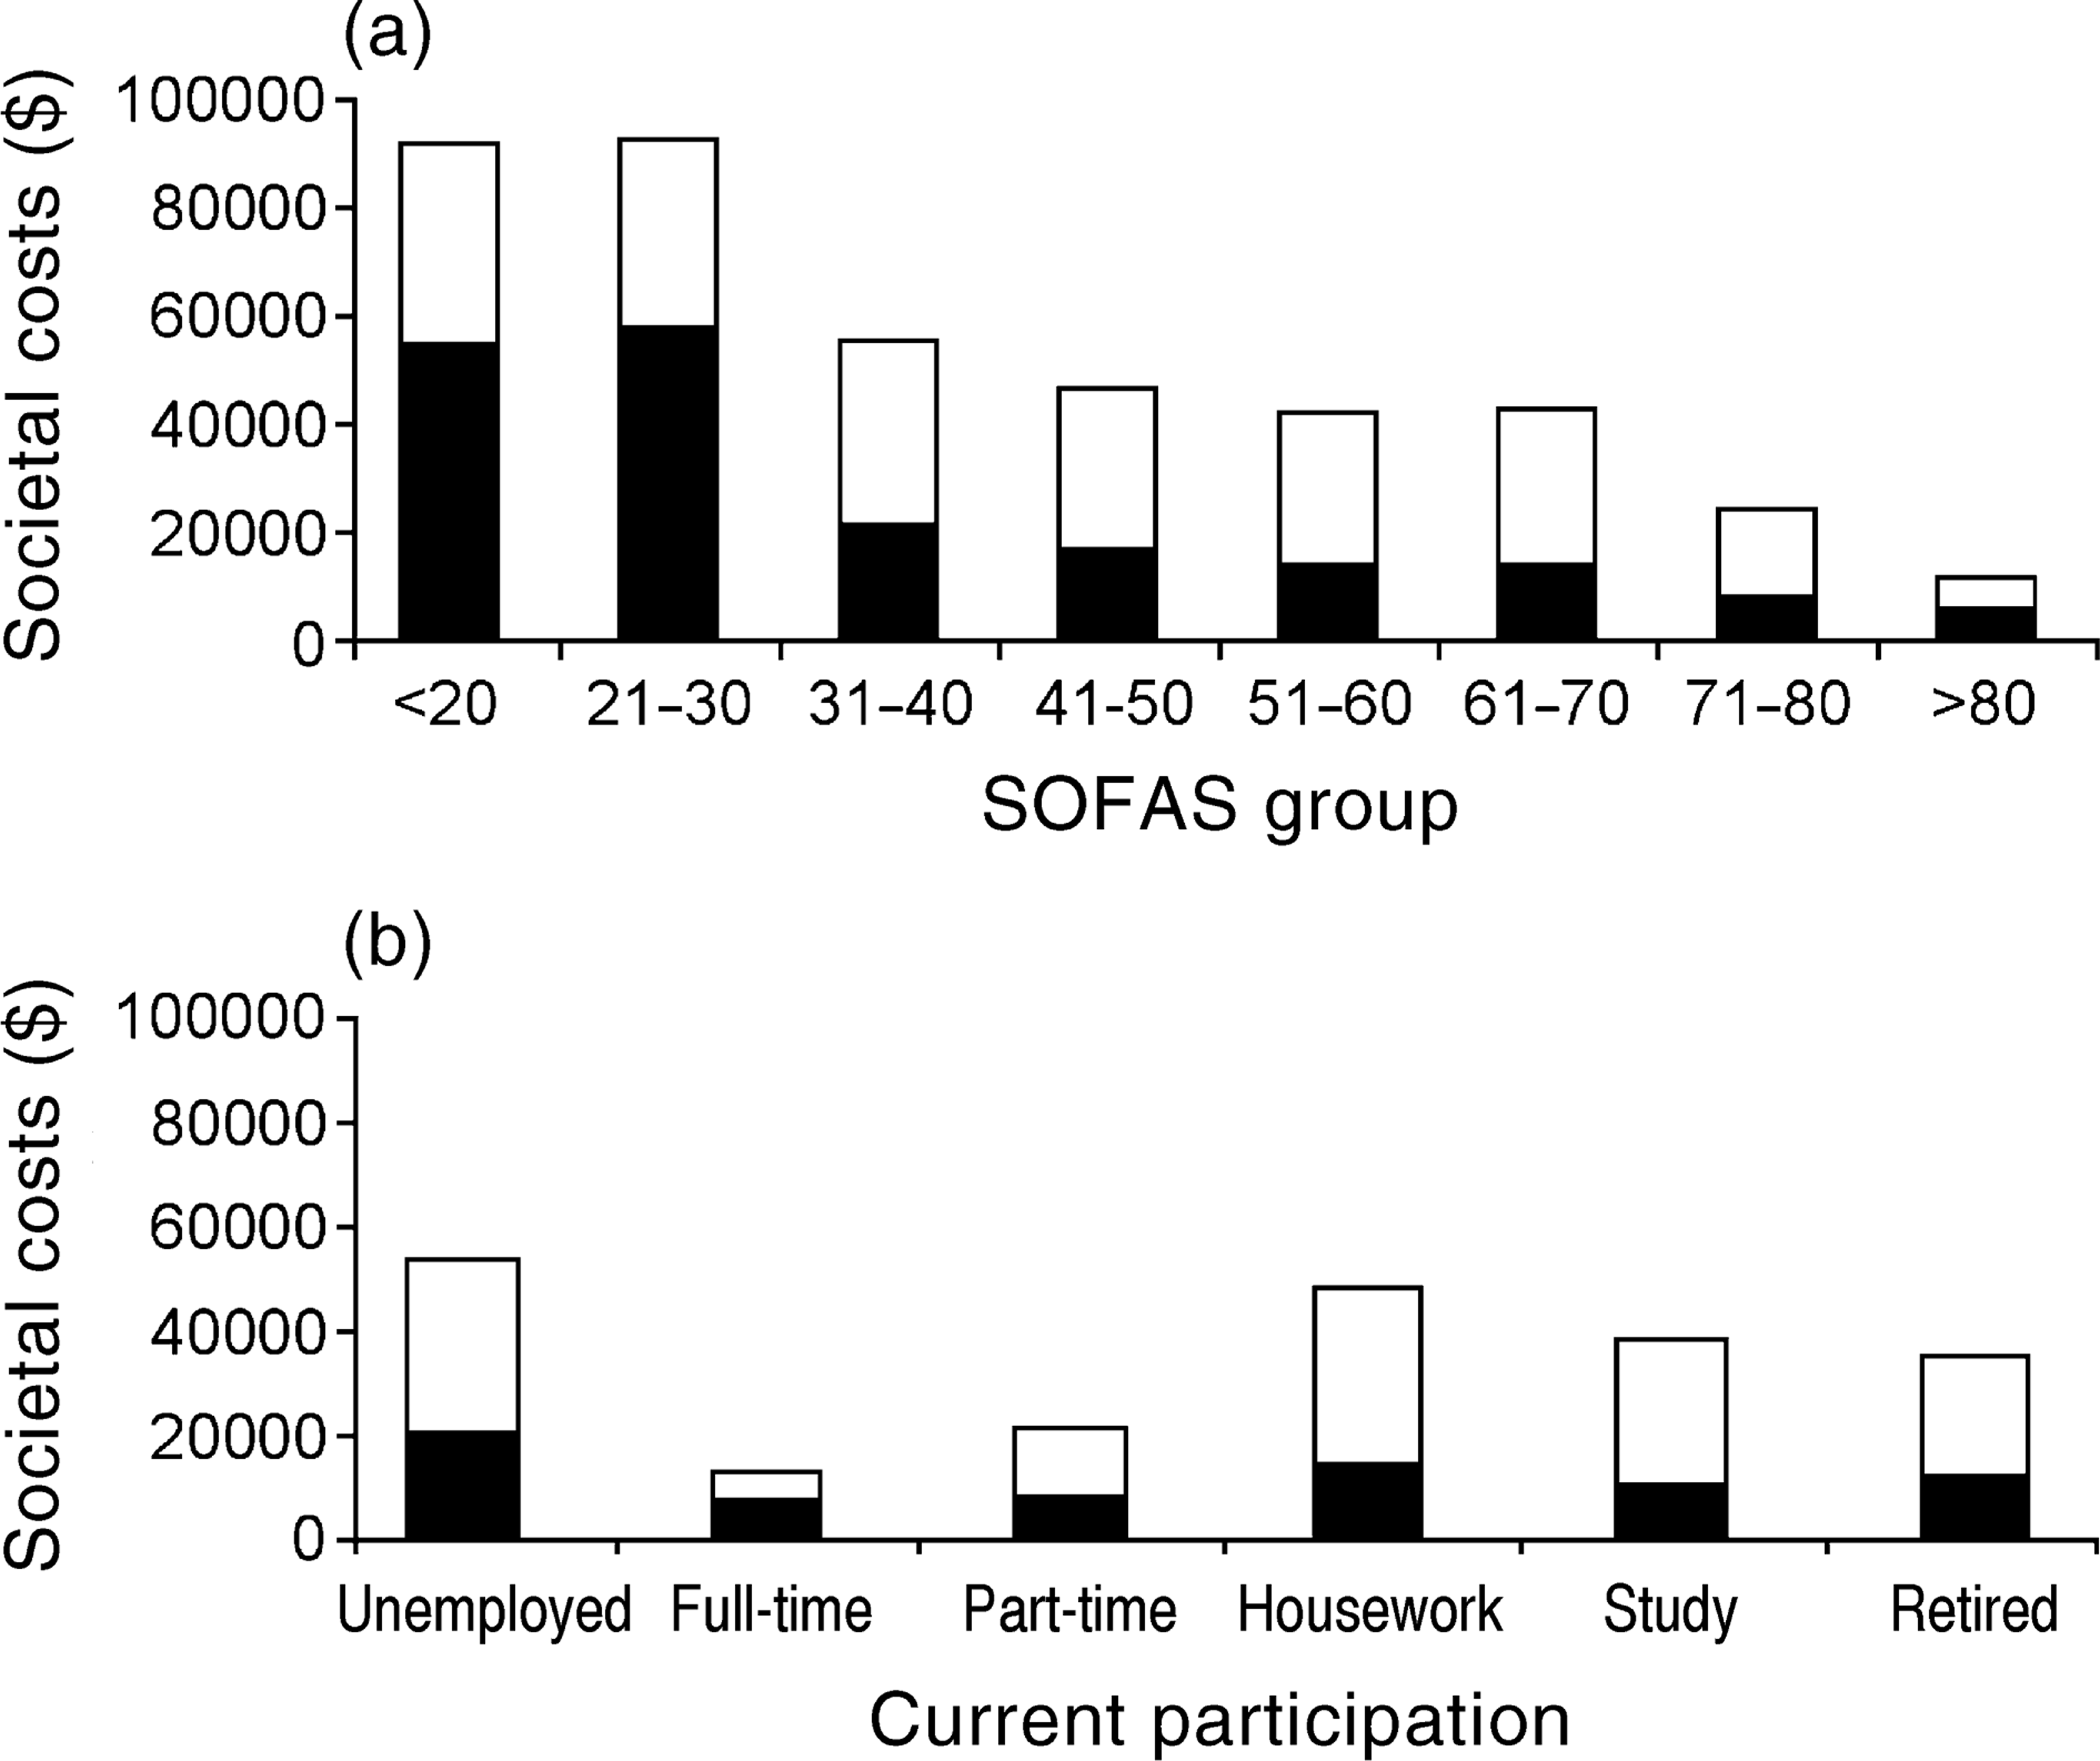
Discussion
The costs of psychosis are extraordinarily high, and the mental health care costs of schizophrenia in particular are especially high, being almost double the costs of affective psychoses. The main driver of mental health care costs is inpatient hospitalization, accounting for almost 80% of such costs. In turn, mental health care costs for psychoses are estimated to be 29.8% of mental health care costs nationwide. We also estimate that the mental health care costs of psychosis account for 2.6% of health and community services expenditure from the government and societal perspectives (see bulletin [27], section 2.6, for details of the health care expenditure data on which these percentages are based).
Mental health care costs are the main contributor to total costs from a government perspective, while earnings foregone are the primary driver from a societal perspective. The total costs of psychosis in Australia correspond to 0.23% and 0.36% of Gross Domestic Product (GDP) from the government and societal perspectives, respectively (mental health and community services expenditure being 0.14% and 0.15% of GDP from government and societal perspectives, respectively).
It must be kept in mind that the costs estimated herein are almost certainly underestimates. All unit values were conservative, some costs were not included (e.g. most legal costs could not be calculated), mortality costs were omitted from total cost calculations, one-month rather than 12-month prevalence figures were used, costs of general health care and non-health related benefits were excluded, costs to carers could be only partially estimated and there was no valuation of psychosocial costs.
Inpatient costs, in particular, are worthy of comparison with other countries, in view of their large contribution to mental health care costs. These costs appear to be proportionately higher in Australia compared to available figures for Canada and the UK [15, 28]. For example, Goeree et al. [15] estimated the financial burden of schizophrenia in Canada in 1996, including all age groups and the costs of incarceration. If we exclude costs attributable to ‘seniors’ homes' and ‘incarceration’, they identified $891.90 million (Canadian) in mental health care and associated community services costs for persons with schizophrenia ([15], Table 2). These comprised: inpatient costs (61.9%); supported accommodation (11.0%); community mental health services and hospital clinics (13.6%); medication costs (5.4%); and other costs (8.0%). Based on the societal mental health care and other sector costs reported in Table 1 (which total A$910.57 million), the corresponding local percentages are: inpatient costs (73.7%); supported accommodation (2.8%); community mental health services and hospital clinics (12.7%); medication costs (4.9%); and other costs (5.9%). Thus, the comparative figures for inpatient costs and supported accommodation suggest that in Australia proportionately greater reliance is placed on hospitals for ‘housing’ people with psychosis, whereas improved access to adequate supported accommodation may be a better investment. However, the effects of supported community accommodation on relapse rates, hospital readmissions, patient quality of life, extent of homelessness and levels of incarceration of people with psychosis remain to be thoroughly examined.
It is acknowledged that there are a number of issues to consider in undertaking international comparisons, and, consequently, the comparisons reported here should be taken as indicative only. Issues to consider include: differences in methodology, particularly differences in the resources costed; differences in relative resource prices between countries; and differences in service provision and resource prices over time. Given our interest in the relative distribution of psychosis expenditure, we focused on proportionate costs, not absolute (standardized) differences in per capita health costs.
The LPDS found that just under 40% of participants reported receiving counselling or some form of psychotherapy in the past year [19, 20]. It is not known what proportion of these were receiving evidence-based psychosocial treatments, but it is very likely to be rather less than 100%. This means that only a minority of psychotic patients, if any, is receiving a form of psychosocial treatment of demonstrable clinical effectiveness. Even if such treatments were associated with only modest improvements in functioning in a fraction of patients, there could be substantial flow-on savings to the community, not to mention improved quality of life for patients. The LPDS also found that only 19.1% of participants reported having attended a rehabilitation or day programme in the past year. This is a very low rate of involvement in rehabilitation, especially considering the fact that the literature supports the effectiveness of rehabilitation, particularly supported employment programmes [29, 30].
We have conducted some preliminary cost modelling of the potential impacts of psychosocial interventions and increased participation in meaningful activities (see bulletin [27], section 2.7), however, more sophisticated analyses are required, together with comprehensive assessments of the key predictors of costs and subgroup differences. Identification of cost offsets within mental health services through, for example, reduced hospitalization, may help fund expanded rehabilitation services for people with psychosis. Likewise, increased rates of employment resulting from wider availability of rehabilitation programmes may increase independence and disposable income, thereby also improving patient qualityof-life. In any event, considerable vigilance is likely to be required as ‘in principle’ savings identified through cost modelling may be hard to convert to practical cost savings [31]. At a policy level, the Australian National Mental Health Plans have already contributed to increased spending on community health services [32], however, there is still a long way to go, requiring new initiatives, more focused outcome assessments, and greater attention to the cost-effectiveness of treatment programmes and other interventions.
Some of the limitations of this study have already been mentioned in relation to unit cost valuations that, owing to the methodological limits of the LPDS, mean that costs have almost certainly been underestimated. We also recognize that the primary source of the data was patient selfreport and no independent corroborating information was available. Although this approach is open to bias, recent research suggests that this is not likely to be of sufficient magnitude to invalidate the findings [33].
Conclusions
Within the framework and limitations of the LPDS, we have provided estimates of the annual costs of psychoses in urban Australia. These are a very costly group of illnesses, especially schizophrenia. Increased societal costs are also associated with the middle third of life (i.e. the traditional ‘productive’ years), longer duration of illness, poorer functioning, and lower participation in meaningful activities. Mental health care costs, especially hospitalization, are the main contributor to total costs from a government perspective, while earnings forgone contribute most from a societal perspective.
Some of the findings from the LPDS also suggest that the current patterns of expenditure on psychoses are probably inefficient, if not inequitable. There may be substantial opportunity costs in maintaining the status quo and (1) not delivering effective treatments in sufficient volume to people with psychotic disorders, (2) not intervening effectively during the early phases of the illness, and (3) not improving access to evidence-based rehabilitation programmes and supported accommodation.
Given the tentative nature of current evaluations of the costs of mental health care, it is appropriate that we conclude with a series of questions, which partially set the agenda for future research, and which also challenge others to look for answers within existing and proposed databases: (1) have savings resulting from bed reductions and the closure of stand-alone psychiatric hospitals in Australia been redirected efficiently to other mental health and community services? (2) What are the main predictors of health care costs and subgroup cost differences among people with psychosis? (3) What proportion of current health care expenditure on psychotic disorders can be regarded as ‘discretionary’ (i.e. beyond that required for acute admissions, crisis services, emergency shelter, etc.), and how is this likely to change with time? (4) What magnitude of clinical improvement and reduced disability can we reasonably expect from evidence-based psychosocial interventions and how are these improvements likely to impact on costs? (5) How can we best demonstrate that actual improvements in community care for people with psychotic disorders (e.g. increased provision of psychosocial treatments, early interventions, rehabilitation programmes, and supported accommodation) lead to better outcomes and proportionate reductions in hospitalization and associated costs? (6) Does wider deployment of these interventions also deliver additional societal benefits, for example, through increased employment and reduced demands on carers, welfare services, voluntary agencies, and the criminal justice system? and (7) are the answers to these questions substantially different for non-psychotic disorders?
Footnotes
Acknowledgements
This paper is based primarily on data collected in the framework of the collaborative Low Prevalence (psychotic) Disorders Study (LPDS), an epidemiological and clinical investigation which is part of the National Survey of Mental Health and Wellbeing (NSMHWB), Australia 1997–1998. The team leaders for the LPDS study were: Assen Jablensky (Project Director, Perth, Western Australia), Mandy Evans (Canberra, Australian Capital Territory), Helen Herrman (Melbourne, Victoria) and John McGrath (Brisbane, Queensland). A complete list of investigators is available elsewhere [19, ![]() ]. The study was funded by the Commonwealth Department of Health and Aged Care (Perth, Melbourne, Brisbane) and by local sources (Canberra). Thank you to the many health professionals who contributed to the LPDS and the NSMHWB and the thousands of Australians who agreed to participate. The authors also thank Helen Bentham, Julie Byles, Kate D'Este, Patrick Johnston, Ailsa Korten and Tina Smith for their assistance with costs coding and analysis.
]. The study was funded by the Commonwealth Department of Health and Aged Care (Perth, Melbourne, Brisbane) and by local sources (Canberra). Thank you to the many health professionals who contributed to the LPDS and the NSMHWB and the thousands of Australians who agreed to participate. The authors also thank Helen Bentham, Julie Byles, Kate D'Este, Patrick Johnston, Ailsa Korten and Tina Smith for their assistance with costs coding and analysis.