
Abstract
Objective:
The 2010 Survey of High Impact Psychosis (SHIP) is Australia’s second national psychosis survey. This paper provides an overview of its findings, including comparisons with the first psychosis survey and general population data.
Methods:
The survey covered 1.5 million people aged 18–64 years, approximately 10% of Australians in this age group. A two-phase design was used. In phase 1, screening for psychosis took place in public mental health services and non-government organizations supporting people with mental illness. In phase 2, 1825 of those screen-positive for psychosis were randomly selected and interviewed. Data collected included symptomatology, substance use, functioning, service utilization, medication use, education, employment, housing, and physical health including fasting blood samples.
Results:
The estimated 1-month treated prevalence of psychotic disorders in public treatment services was 3.1 people per 1000 population; the 12-month treated prevalence was 4.5 people per 1000. The majority (63.0%) of participants met ICD-10 criteria for schizophrenia/schizoaffective disorder. One-half (49.5%) reported attempting suicide in their lifetime and two-thirds (63.2%) were rated as impaired in their ability to socialize. Over half (54.8%) had metabolic syndrome. The proportion currently smoking was 66.1%. Educational achievement was low. Only 21.5% were currently employed. Key changes in the 12 years since the first survey included: a marked drop in psychiatric inpatient admissions; a large increase in the proportion attending community mental health clinics; increased use of rehabilitation services and non-government organizations supporting people with mental illness; a major shift from typical to atypical antipsychotics; and large increases in the proportions with lifetime alcohol or drug abuse/dependence.
Conclusion:
People with psychotic illness face multiple challenges. An integrated approach to service provision is needed to ensure that their living requirements and needs for social participation are met, in addition to their very considerable mental and physical health needs.
Objective
The 2010 Survey of High Impact Psychosis (SHIP) is Australia’s second national psychosis survey. It builds on information gained in the first survey in 1997–98, the Low Prevalence (Psychotic) Disorders Study (Jablensky et al., 1999, 2000), with a substantial collection of new and updated information using a much expanded interview and assessment schedule. These data provide a comprehensive snapshot of multiple facets of the lives of people living with psychosis, extending and deepening our understanding of clinical presentation, living circumstances, social participation, and needs in this population. Many data elements are unique in that they have not been collected previously in the context of a large, epidemiological survey of psychosis. Thus, the survey includes many items on psychopathology, physical morbidity, cognitive ability, disability, at-risk behaviours, education, employment and income, accommodation, and service utilization and need that have been assessed contemporaneously and in depth in a large, representative sample. Replication of questions from the first survey provides a rare opportunity to assess change over time.
The main aims of the 2010 survey were: (i) to estimate the 1-month treated prevalence of psychosis for people aged 18–64 years in public specialized mental health services and, for the first time, in non-government organizations (NGOs) funded to support people with mental illness; (ii) to describe the profile of people with a psychotic illness including their mental and physical health, their general cognitive ability, and their personal, social, and living circumstances; (iii) to determine the use of a wide range of health and human services; and (iv) to assess the impact of psychotic illness and to identify factors associated with better outcomes.
This paper provides a detailed description of the methodology of the 2010 Australian national survey of psychosis and its key findings, including comparisons with the first Australian psychosis survey in 1997–98 and with general population data. More comprehensive findings appear in a series of papers in this and the following issue of the Australian and New Zealand Journal of Psychiatry.
Method
Population coverage
The 2010 survey was conducted at seven mental health service sites in five Australian states. The geographical regions covered by the survey were the catchment areas of the sites: (i) Hunter New England and (ii) Orange services in New South Wales; (iii) West Moreton in Queensland; (iv) Northern Mental Health in South Australia; (v) North West Area Mental Health Service and (vi) St Vincent’s Mental Health Service in Victoria; and (vii) Fremantle, Peel and Rockingham – Kwinana in Western Australia. These sites covered a total area of 61,682 square kilometres and an estimated resident population aged 18–64 years of 1,464,923 people, or approximately 10% of the Australian population in the same age range. The survey included people who were 18–64 years of age, resident in the catchment sites and in contact with designated services, namely public specialized mental health services (inpatient, outpatient, ambulatory, and community services and clinics, hereafter abbreviated to public mental health services) and NGOs funded to support people with mental illness. All public mental health services in the catchment sites participated in the screening. Relevant NGOs located in each catchment area were also asked to participate and 86% of centres and sections within these agencies took part; those not participating were smaller sections within larger participating organizations, predominantly in rural areas.
Census month and interview period
The census of people with psychosis was in March 2010. Interviewing took place from April to December 2010, except in Orange where it continued through to the end of March 2011.
Design
A two-phase design was employed (Pickles et al., 1995). This design was appropriate for estimating the prevalence of a relatively uncommon outcome and was also efficient in identifying those likely to meet diagnostic criteria for whom the full interview schedule was relevant. Phase 1 screening identified three mutually exclusive groups: (1) people in contact with public mental health services in the census month; (2) people not in contact with these services in the census month but in contact with NGOs supporting people with mental illnesses in that month; and (3) people not in contact with public mental health services or NGOs in the census month but in contact with public mental health services in the 11 months prior to census (Figure 1).
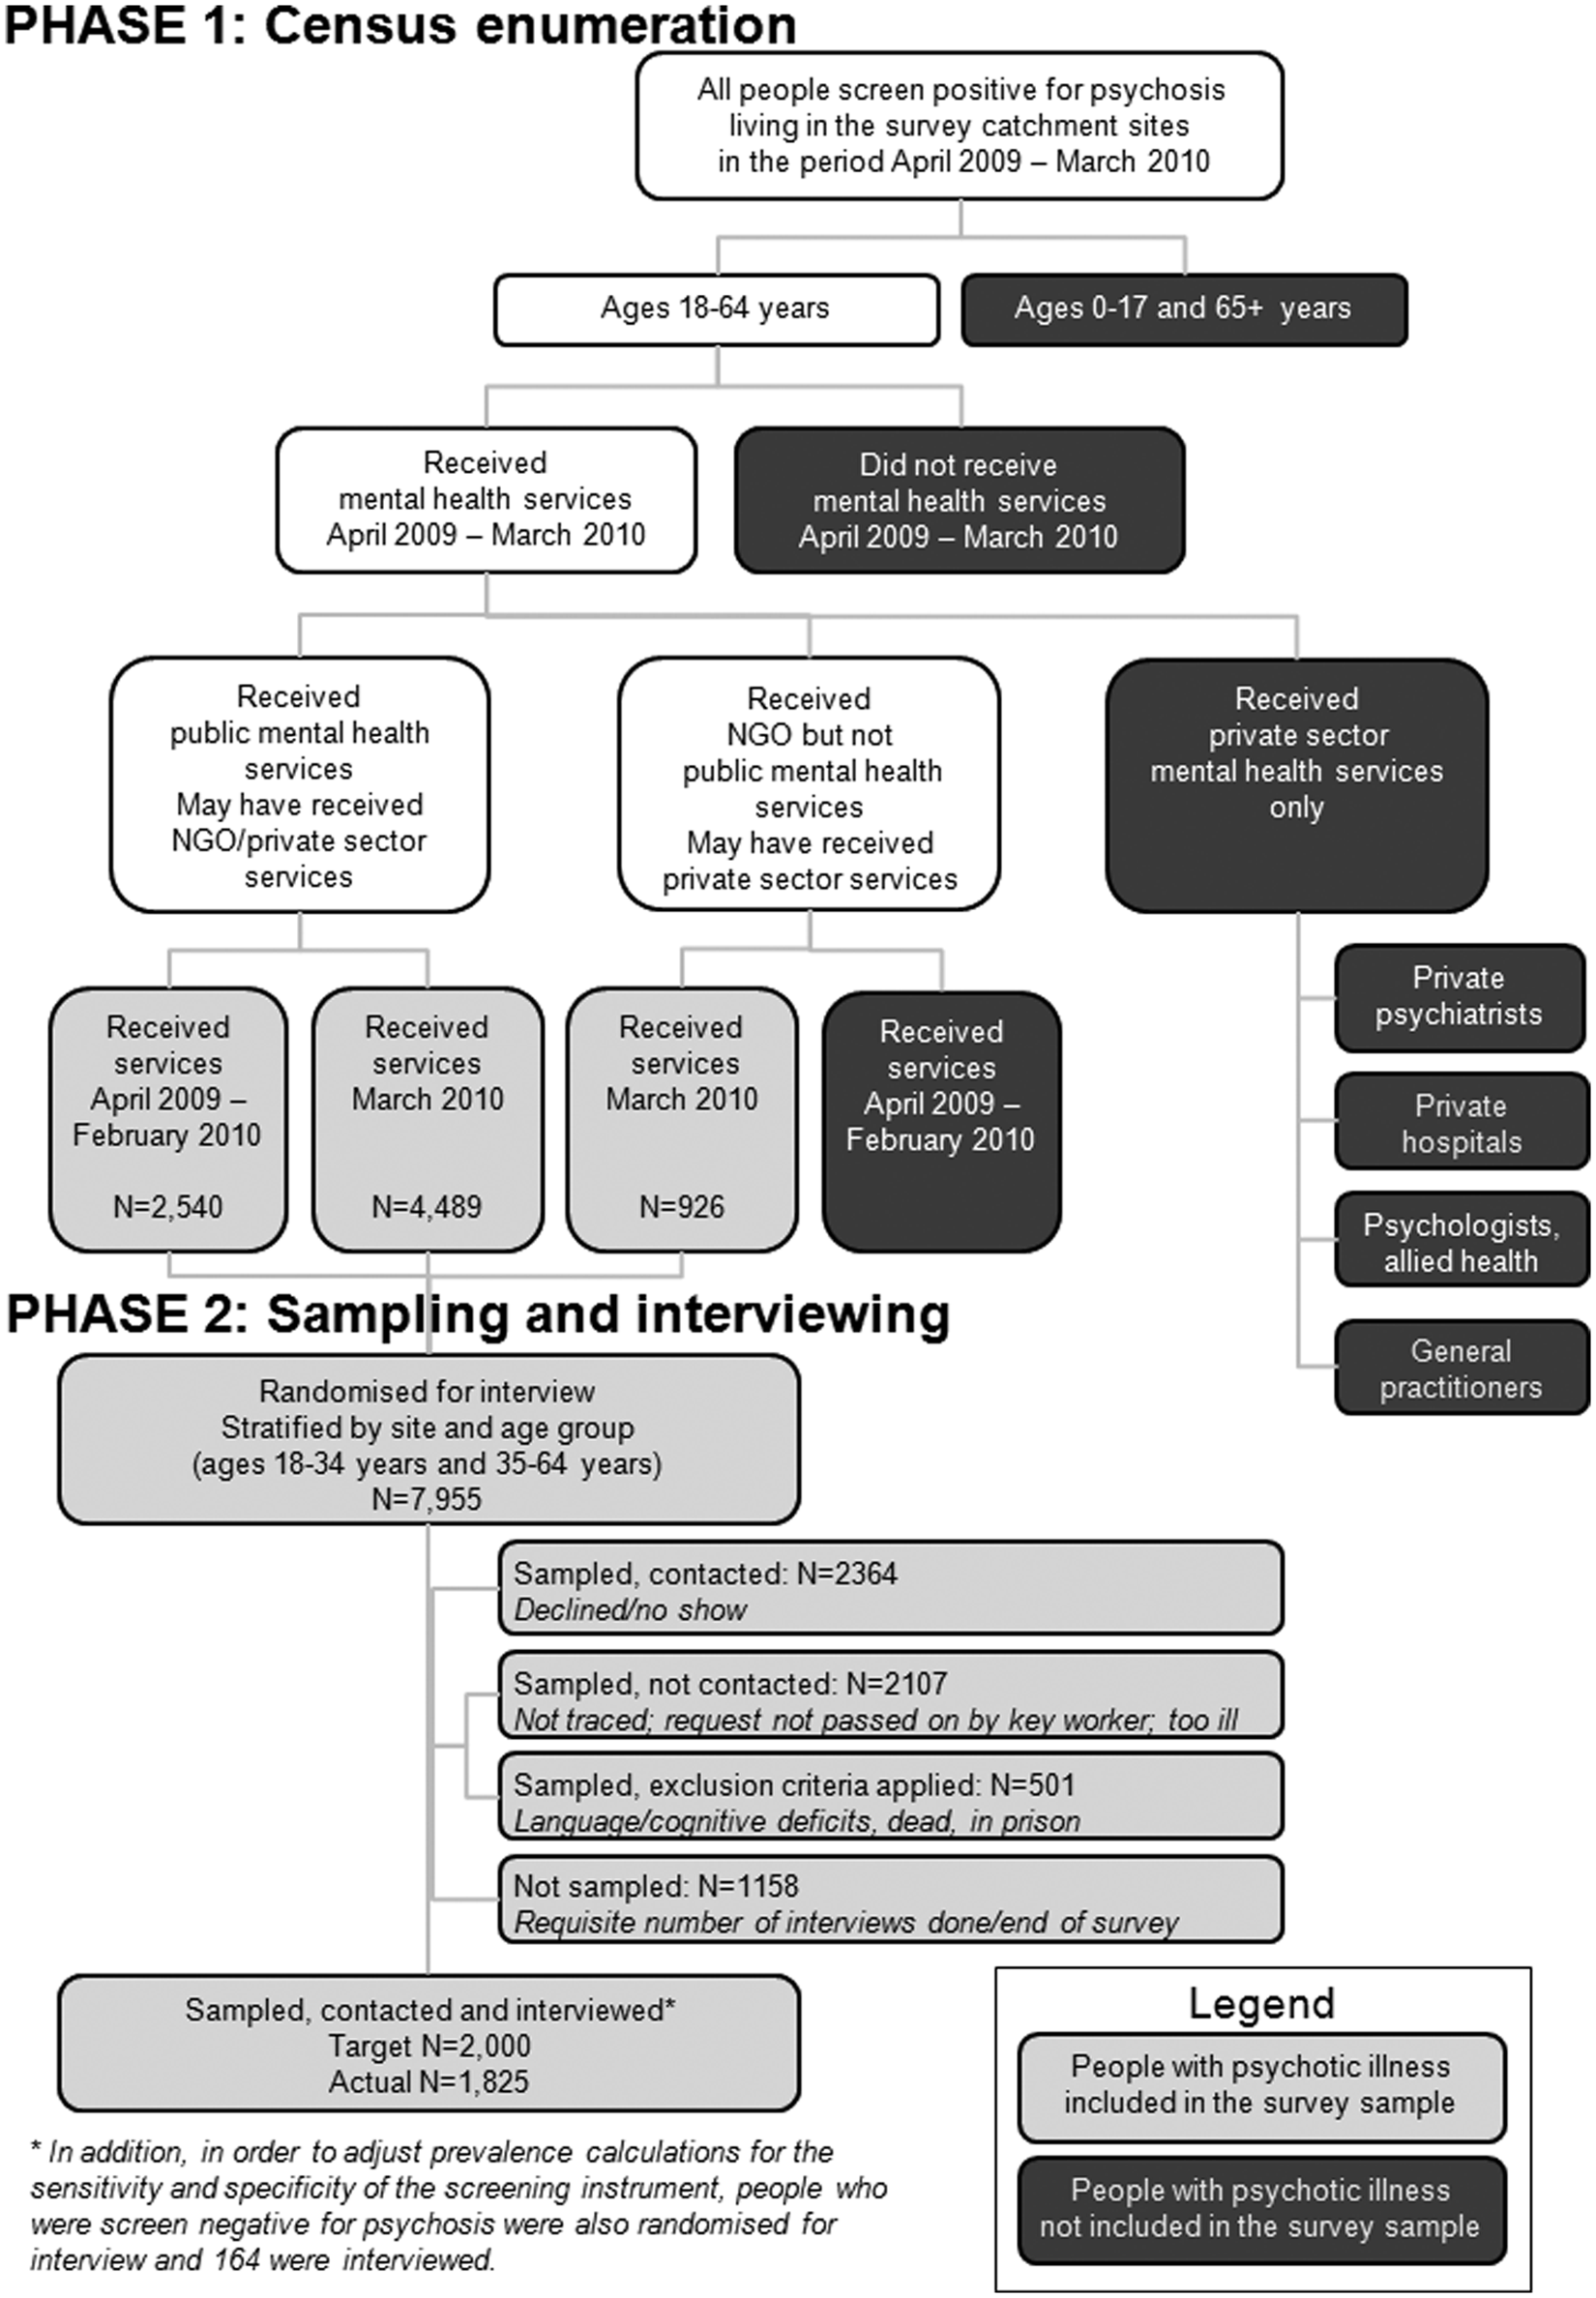
Flowchart of the survey coverage
A psychosis screener was used to identify individuals likely to meet criteria for formal diagnosis. The screener was developed for the first national psychosis survey (Jablensky et al., 1999, 2000). Pilot testing prior to the second survey led to minor modifications and improved psychometric properties with excellent sensitivity (0.96, 95% CI 0.87–1.00) and good specificity (0.88, 95% CI 0.47–1.00). In the actual survey, screening sensitivity was favoured over specificity, as phase 2 included a full diagnostic interview, and key workers were asked to err on the positive side if unsure of a rating. Sensitivity remained high (0.98, 95% CI 0.97–0.98) but specificity dropped (0.41, 95% CI 0.35–0.46). Given the high prevalence of psychosis in the ascertainment sample, the predictive value of the screener remained acceptable: the positive predictive value for the screener was 0.90 (95% CI 0.89–0.91) and the negative predictive value was 0.76 (95% CI 0.69–0.83). Screening items covered hallucinations and delusions (six items) and being on antipsychotic medication (key worker version) or being told by a doctor that a person had a psychotic disorder (version administered by a key worker to new clients). For the survey, screen-positive cut-off was a positive rating on two or more of these items. In addition to census month enumeration, administrative records were scanned to identify people with a recorded diagnosis of psychosis and in contact with public mental health services in the 11 months prior to census but not in the census month. Diagnoses within scope were: ICD-10 schizophrenia (F20), schizotypal disorder (F21), persistent delusional disorder (F22), acute or transient psychotic disorder (F23), induced delusional disorder (F24), schizoaffective disorders (F25), other and unspecified non-organic psychotic disorder (F28, F29), manic episode with psychotic symptoms (F30.2), bipolar affective disorder with psychotic symptoms (F31.2, F31.5), severe depressive episode with psychotic symptoms (F32.3), recurrent depressive disorder with psychotic symptoms (F33.3), or at least two admissions with a drug- or alcohol-induced psychosis (F10–F19:5 and F19.7 only).
For phase 2 interviews, recruitment targets were set for each catchment site. Of the 7955 people who screened positive for psychosis and met eligibility criteria, 1825 were interviewed. Randomization for interview was stratified by catchment site and age group. Equal numbers were targeted in two age strata (18–34 years and 35–64 years) to ensure adequate coverage of younger as well as older age participants. An additional 164 people were randomly selected and interviewed from the pool of people who were screened negative for psychosis. This group completed the diagnostic module only. Their data enabled estimation of prevalence in the census groups without assuming that the psychosis screen had perfect sensitivity. People were excluded from the interview phase if (i) they had insufficient English or a communication or cognitive impairment affecting their capacity for informed consent or completion of a valid interview or (ii) they were unavailable for interview due to residence in a nursing home or prison.
Assessment
The interview schedule consisted of 32 modules covering: psychopathology; substance use; cognitive ability; physical health; service utilization and need; medication and side effects; functioning, disability, and quality of life; education; employment; accommodation; and income. Questions from the 1997–98 psychosis survey (Jablensky et al., 1999, 2000) were included to enable an assessment of change over time. In addition, questions from the 2007 National Survey of Mental Health and Wellbeing (Australian Bureau of Statistics, 2008b; Slade et al., 2009) and Australian Bureau of Statistics national surveys facilitated comparison with population norms. There were a number of embedded instruments. Diagnostic assessment was based on a semi-structured clinical research interview, the Diagnostic Interview for Psychosis (DIP) (Castle et al., 2006) which was first used in the 1997–98 Australian survey of psychosis (Jablensky et al., 2000). The DIP contains selected interview questions and probes from the WHO Schedules for Clinical Assessment in Neuropsychiatry (Wing et al., 1990) mapped on the 90 diagnostic items of the OPCRIT (McGuffin et al., 1991). The DIP scores serve as input to a computer algorithm which provides a diagnostic classification of the case in accordance with ICD-10 and DSM-IV criteria, thus reducing substantially subjective bias in the interpretation of the scored symptoms and signs. The DIP interview was administered by mental health professionals who had undergone extensive training prior to the data collection phase of the survey.
A number of externally developed instruments were used in their entirety, namely: Assessment of Quality of Life (Hawthorne et al., 1999), Alcohol Use Disorders Identification Test (Babor et al., 2001), CAGE (Mayfield et al., 1974), Fagerstrom Test for Nicotine Dependence (Heatherton et al., 1991), International Physical Activity Questionnaire (short format) (Craig et al., 2003), Multidimensional Scale of Independent Functioning (Jaeger et al., 2003), National Adult Reading Test (Nelson and Willison, 1991), Personal and Social Performance Scale (Morosini et al., 2000), and RBANS Digit Symbol Coding Test (Randolph, 1998). Items of the Carpenter deficits syndrome from the World Health Organization Schedules for Clinical Assessment in Neuropsychiatry (Kirkpatrick et al., 1989; World Health Organization, 1999) were also included. Participants underwent a physical examination in which their blood pressure, height, weight, and waist circumference were measured by trained staff following standardized procedures. They also provided a fasting blood sample at accredited pathology laboratories for assays of high-density lipoproteins, triglycerides, and plasma glucose. International Diabetes Federation criteria (International Diabetes Federation, 2006).and the more recent harmonized criteria (Alberti et al., 2009) were used to determine metabolic syndrome. Absolute 5-year risk of a cardiovascular event was calculated using the Framingham risk equation (Anderson et al., 1990; National Vascular Disease Prevention Alliance, 2009). The World Health Organization body mass index reference range (World Health Organization, 1995) was used to classify obesity. Level of physical activity, collected using the International Physical Activity Questionnaire (Craig et al., 2003), was classified according to Australian Bureau of Statistics categories used in the 2007 National Mental Health Survey (Australian Bureau of Statistics, 2008b). Participants were also asked to consent for their general practitioner to be contacted. General practitioners completed two questionnaires: one on the participant’s health and use of services, and one on their own perspectives on treating and managing psychosis in general practice.
Interviewers were predominantly mental health professionals seconded from public health services. They were trained in the use of the survey instruments and to take standardized physical measures (for example, waist circumference and blood pressure). They also received specialized training in administering and scoring the DIP and the cognitive assessment tasks. Procedures were implemented to ensure quality and reliability of the assessments. National training workshops were conducted for all interviewers, in addition to onsite training, with weekly inter-site teleconferences throughout the survey. Inter-rater reliability was assessed in the course of the field interviews and the level of agreement achieved among interviewers was good (averaged pairwise agreement of 0.94 for ICD-10 diagnoses and intra-class correlation of 0.98 for the National Adult Reading Test).
Estimation of treated prevalence
Treated prevalence of the target disorders was estimated using sampling weights derived from phase 1 to phase 2 data (Alonzo et al., 2003). Diagnostic status was ascertained at interview using the DIP (Castle et al., 2006) and the proportion of screened people meeting criteria for an ICD-10 diagnosis of psychosis was estimated using appropriately weighted screen-positive and screen-negative subsamples. From this proportion, the number of people meeting diagnostic criteria in the census month was estimated for each site. Aggregate estimates in each age and sex stratum were obtained by combining the fraction of the estimated resident population of each catchment meeting diagnostic criteria. For estimates combining strata, adjustments were made to reflect the age and sex distributions of the Australian population aged 18–64 years. Separate prevalence estimates were calculated for people only in contact with NGOs supporting people with psychotic illnesses in the census month. Here, the relatively small number of participants interviewed precluded construction of a separate set of weights. Instead, a set of weights for the combined groups of those presenting at public mental health services and NGOs was developed and the logistic model described above was fitted to the interview data with the addition of an indicator of NGO status. This model was used to estimate prevalence in NGOs. Resident population was estimated from data provided by the Australian Bureau of Statistics for each catchment. Population numbers for 2010 were not available at the time of calculation so growth rates for each stratum in the whole Australian population were applied to extrapolate 2009 population estimates. The statistical package Stata/IC version 10.1 was used for estimation. Further details on the design and methodology are available (Morgan et al., 2011).
Participant response
The response rate among the 4189 people contacted for interview from those screen-positive for psychosis and randomized was 44%. A further 2107 people had been randomly sampled for interview but not asked to participate because (i) they could not be traced or had died in the period since screening (57%), (ii) case managers had assessed them as not mentally well enough or, in some cases, had neglected to pass on the request (21%), or (iii) interviewers judged them to be too unwell physically or mentally to provide consent (22%). Comparison of screening data for interviewed participants and those selected for interview but not participating for any reason indicated no systematic selection biases. Both groups were alike in terms of sex (60% of those interviewed were male compared to 62% of those selected but not interviewed) and age group (44% of those interviewed were aged 18–34 years at the time of screening compared with 43% of those not interviewed). The psychosis screening profiles for both groups were similar indicating no marked differences in terms of lifetime symptom profiles based on the screener items.
Comparison data
The first Australian national survey of psychosis was conducted in 1997–98 (Jablensky et al., 1999, 2000). Both the 1997–98 and 2010 surveys had similar aims, employed the same two-phase design and methodology and used the same core instruments: the Psychosis Screener (Jablensky et al., 2000) for census month screening and the DIP (Castle et al., 2006)) for the interview, although the 2010 interview schedule was an enhanced version of the 1997–98 schedule with many additional questions and assessments. In 1997–98, screening took place (i) in public mental health services, (ii) in private psychiatric and general medical practices, and (iii) at contact points for homeless people. To ensure comparability, comparisons across the two surveys in this paper have been restricted to those people using public mental health services in the census month. This included 687 participants from the 1997–98 survey and 1211 participants from the 2010 survey. The proportions of male participants, older participants, and participants with schizophrenia or a schizoaffective disorder were similar in both subsamples. The first two columns of Tables 2–6 compare key findings from both surveys for these subsamples. The full sample data for the 2010 survey are given in the third column in these tables. Where possible, comparisons are drawn with population estimates, mainly from the 2007 National Survey of Mental Health and Wellbeing but also Australian Bureau of Statistics data, to allow benchmarking (Australian Bureau of Statistics, 2008b; Slade et al., 2009; Slade, 2011).
Ethics
The study was approved by institutional human research ethics committees at each of the seven study sites and all participants provided written, informed consent.
Results
Prevalence of psychotic disorders
The prevalence of a disorder is the proportion of people who meet diagnostic criteria for the disorder in a defined population over a specified period. In March 2010, the estimated treated prevalence of psychotic disorders ascertained in a 1-month period for people aged 18–64 years was 3.5 people per 1000 population, distributed as 3.1 people per 1000 population in public mental health services and 0.4 people per 1000 population in NGOs supporting people with mental illness (Table 1). This 1-month treated prevalence of 3.5 people per 1000 population, based on the estimated resident population of Australia, equates to 50,019 people. The estimated 12-month treated prevalence in public mental health services was 4.5 people per 1000 population, or an estimated 63,533 people aged 18–64 years.
Estimated treated prevalence of ICD-10 psychotic disorders
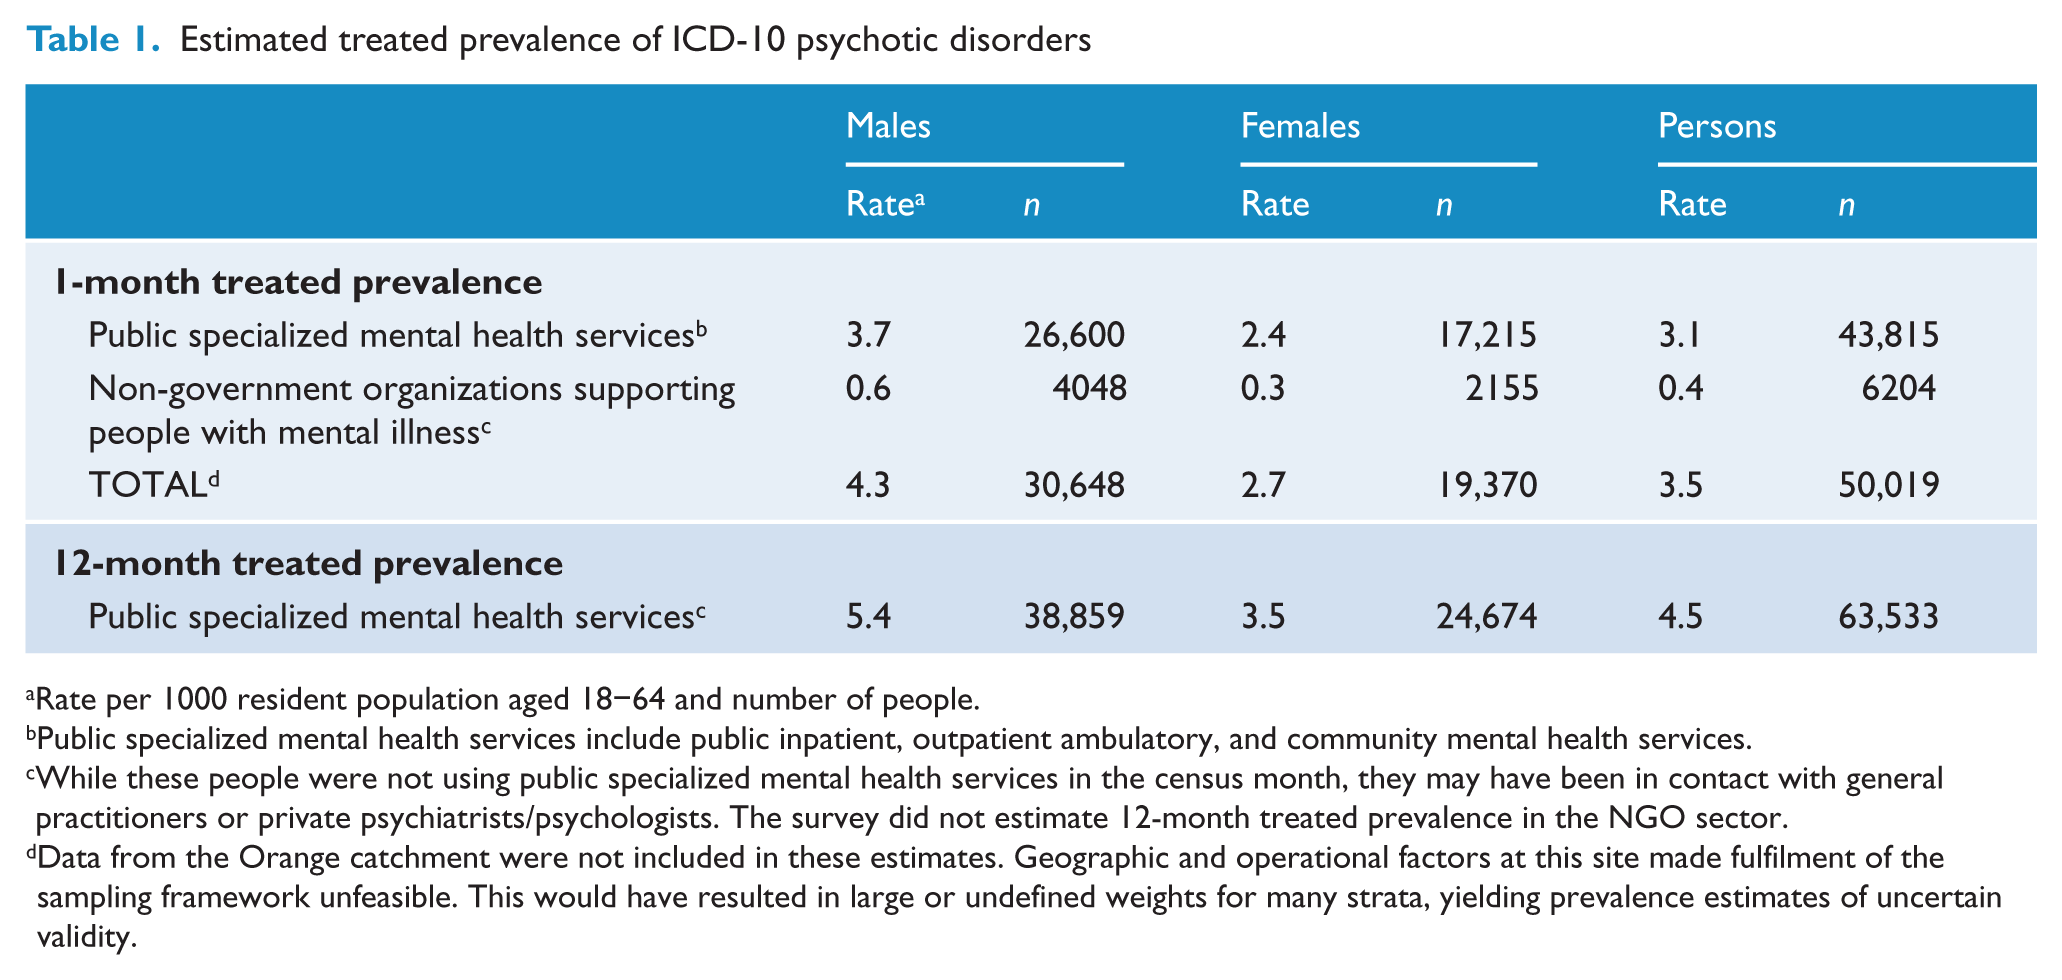
Rate per 1000 resident population aged 18–64 and number of people.
Public specialized mental health services include public inpatient, outpatient ambulatory, and community mental health services.
While these people were not using public specialized mental health services in the census month, they may have been in contact with general practitioners or private psychiatrists/psychologists. The survey did not estimate 12-month treated prevalence in the NGO sector.
Data from the Orange catchment were not included in these estimates. Geographic and operational factors at this site made fulfilment of the sampling framework unfeasible. This would have resulted in large or undefined weights for many strata, yielding prevalence estimates of uncertain validity.
In 1997–98, the estimated 1-month prevalence of psychotic disorders, distributed across sectors, was 3.3 people per 1000 population in public mental health services, 1.4 in the private treatment sector covering people solely in contact with private psychiatrists and general practitioners in the census month, and 0.4 for those who were homeless and not in contact with any treatment services (Jablensky et al., 2000). The 1997–98 estimated 12-month treated prevalence in public mental health services was 4.0 persons per 1000 population.
The interviewed sample
The interviewed sample consisted of 1825 people who were screen-positive for psychosis and randomly selected for interview, stratified by age group (18–34 years of age and 35–64 years of age). There were 1087 male participants (59.6 %) and 1052 participants in the 35–64-year-old age group (57.6%). Two-thirds (66.4%) were using public mental health services in the census month, March 2010; 11.2% were only using NGOs supporting people with mental illness in that month; and a further 22.4% had not used public mental health services or NGOs in the census month but had been using public mental health services in the 11 months prior to the census month.
Socio-demographic and economic profile
The majority of participants were Australian-born (82.2%). One-quarter (24.5%) of women and 12.1% of men were currently in a married or a de facto relationship. Over half (56.2%) of the women had had children of their own and one-quarter (23.6%) of all women had children under 18 years of age living with them: the respective figures for men were much lower at 25.9% and 5.5% (Table 2). One in five participants (18.4%) had difficulty reading and/or writing. Less than one-third (31.5%) of participants had completed the final year of schooling and just under one-half (47.1%) had a post-school qualification (trade certificate or higher). Comparative figures for the general population were 53.0% and 59.4% respectively (Slade, 2011). In the week prior to interview, 21.5% were in paid employment. This figure rose to 32.7% for any employment in the previous 12 months. By comparison, 72.4% of the general population aged 15–64 were employed in July 2010 (Australian Bureau of Statistics, 2010). Two-thirds (69.0%) of employed participants were working part-time in their main job and 27.5% of those employed would have preferred to work more hours. The main source of income for 85.0% was a government pension (Table 2). Since the 1997–98 survey, the proportion of women with children under 18 years of age living at home with them had doubled. There was only a marginal increase in the proportion in paid employment and no change in the proportion whose main source of income was a government pension.
Sociodemographic and lifestyle variables
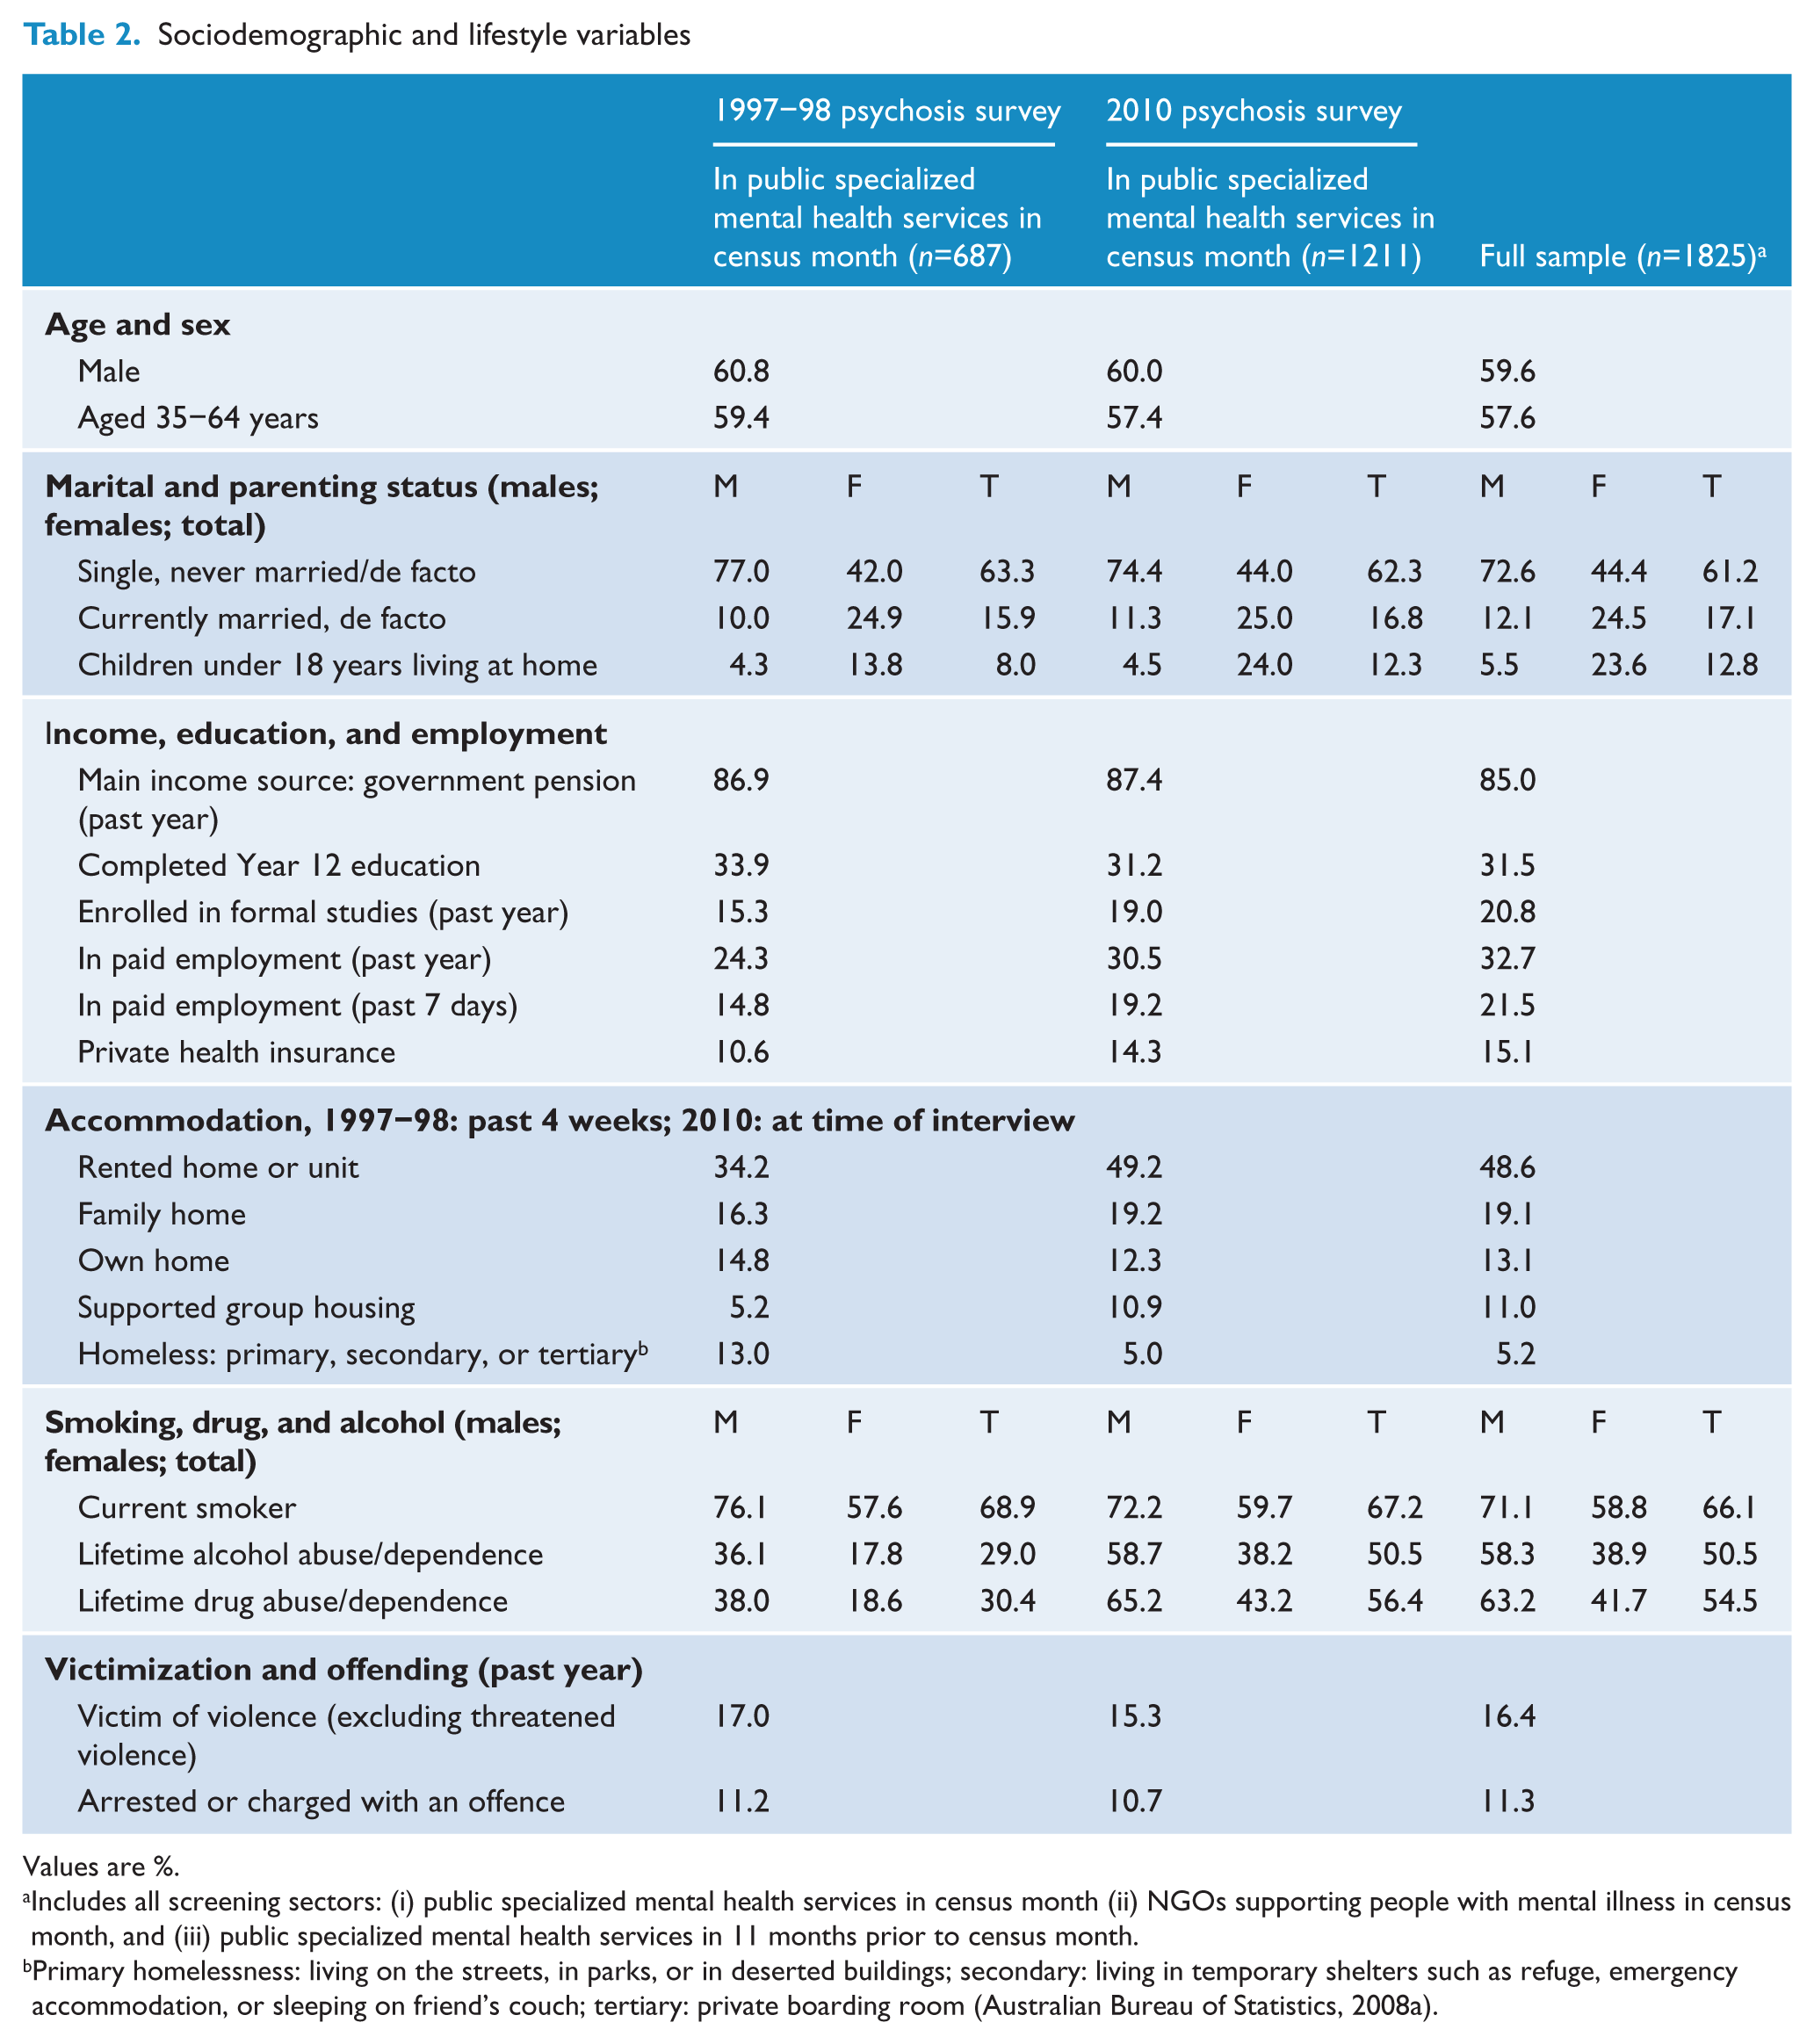
Values are %.
Includes all screening sectors: (i) public specialized mental health services in census month (ii) NGOs supporting people with mental illness in census month, and (iii) public specialized mental health services in 11 months prior to census month.
Primary homelessness: living on the streets, in parks, or in deserted buildings; secondary: living in temporary shelters such as refuge, emergency accommodation, or sleeping on friend’s couch; tertiary: private boarding room (Australian Bureau of Statistics, 2008a).
At the time of interview, 26.8% of participants were living in public rented houses or units, 21.8% were in private rented houses or units, 19.1% were in a family home (for example, living with parents), 13.1% were in their own home or unit, 11.0% were in supported group accommodation, and only 2.0% were in an institution or hospital (Table 2). However, 5.2% of participants (7.3% of males and 2.0% of females) were currently homeless and 12.8% had experienced at least one period of homelessness in the previous 12 months. Those who had been homeless reported an average of 155 days of homelessness (median 99 days) during the past year. By comparison, in the 2006 census, the prevalence of current homelessness in the general population was estimated to be 0.5% (Australian Bureau of Statistics, 2008a). One-quarter (22.7%) of participants reported being on a public housing waiting list.
Mental health profile
By design, all participants met screening criteria for psychosis and 90.0% met full diagnostic criteria for an ICD-10 non-organic psychotic disorder. The most common diagnosis was schizophrenia (47.0%). An additional 16.1% had a schizoaffective disorder, 17.5% bipolar affective disorder, 4.4% a depressive psychosis, and 5.0% a delusional or other non-organic psychotic disorder (Table 3). While 10.0% did not meet full diagnostic criteria for an ICD-10 psychotic disorder, two-thirds of these had a lifetime history of psychotic symptoms including hallucinations, delusions, and subjective thought disorder and the majority (8.7% of the total sample) also met criteria for severe depression.
Mental health profile
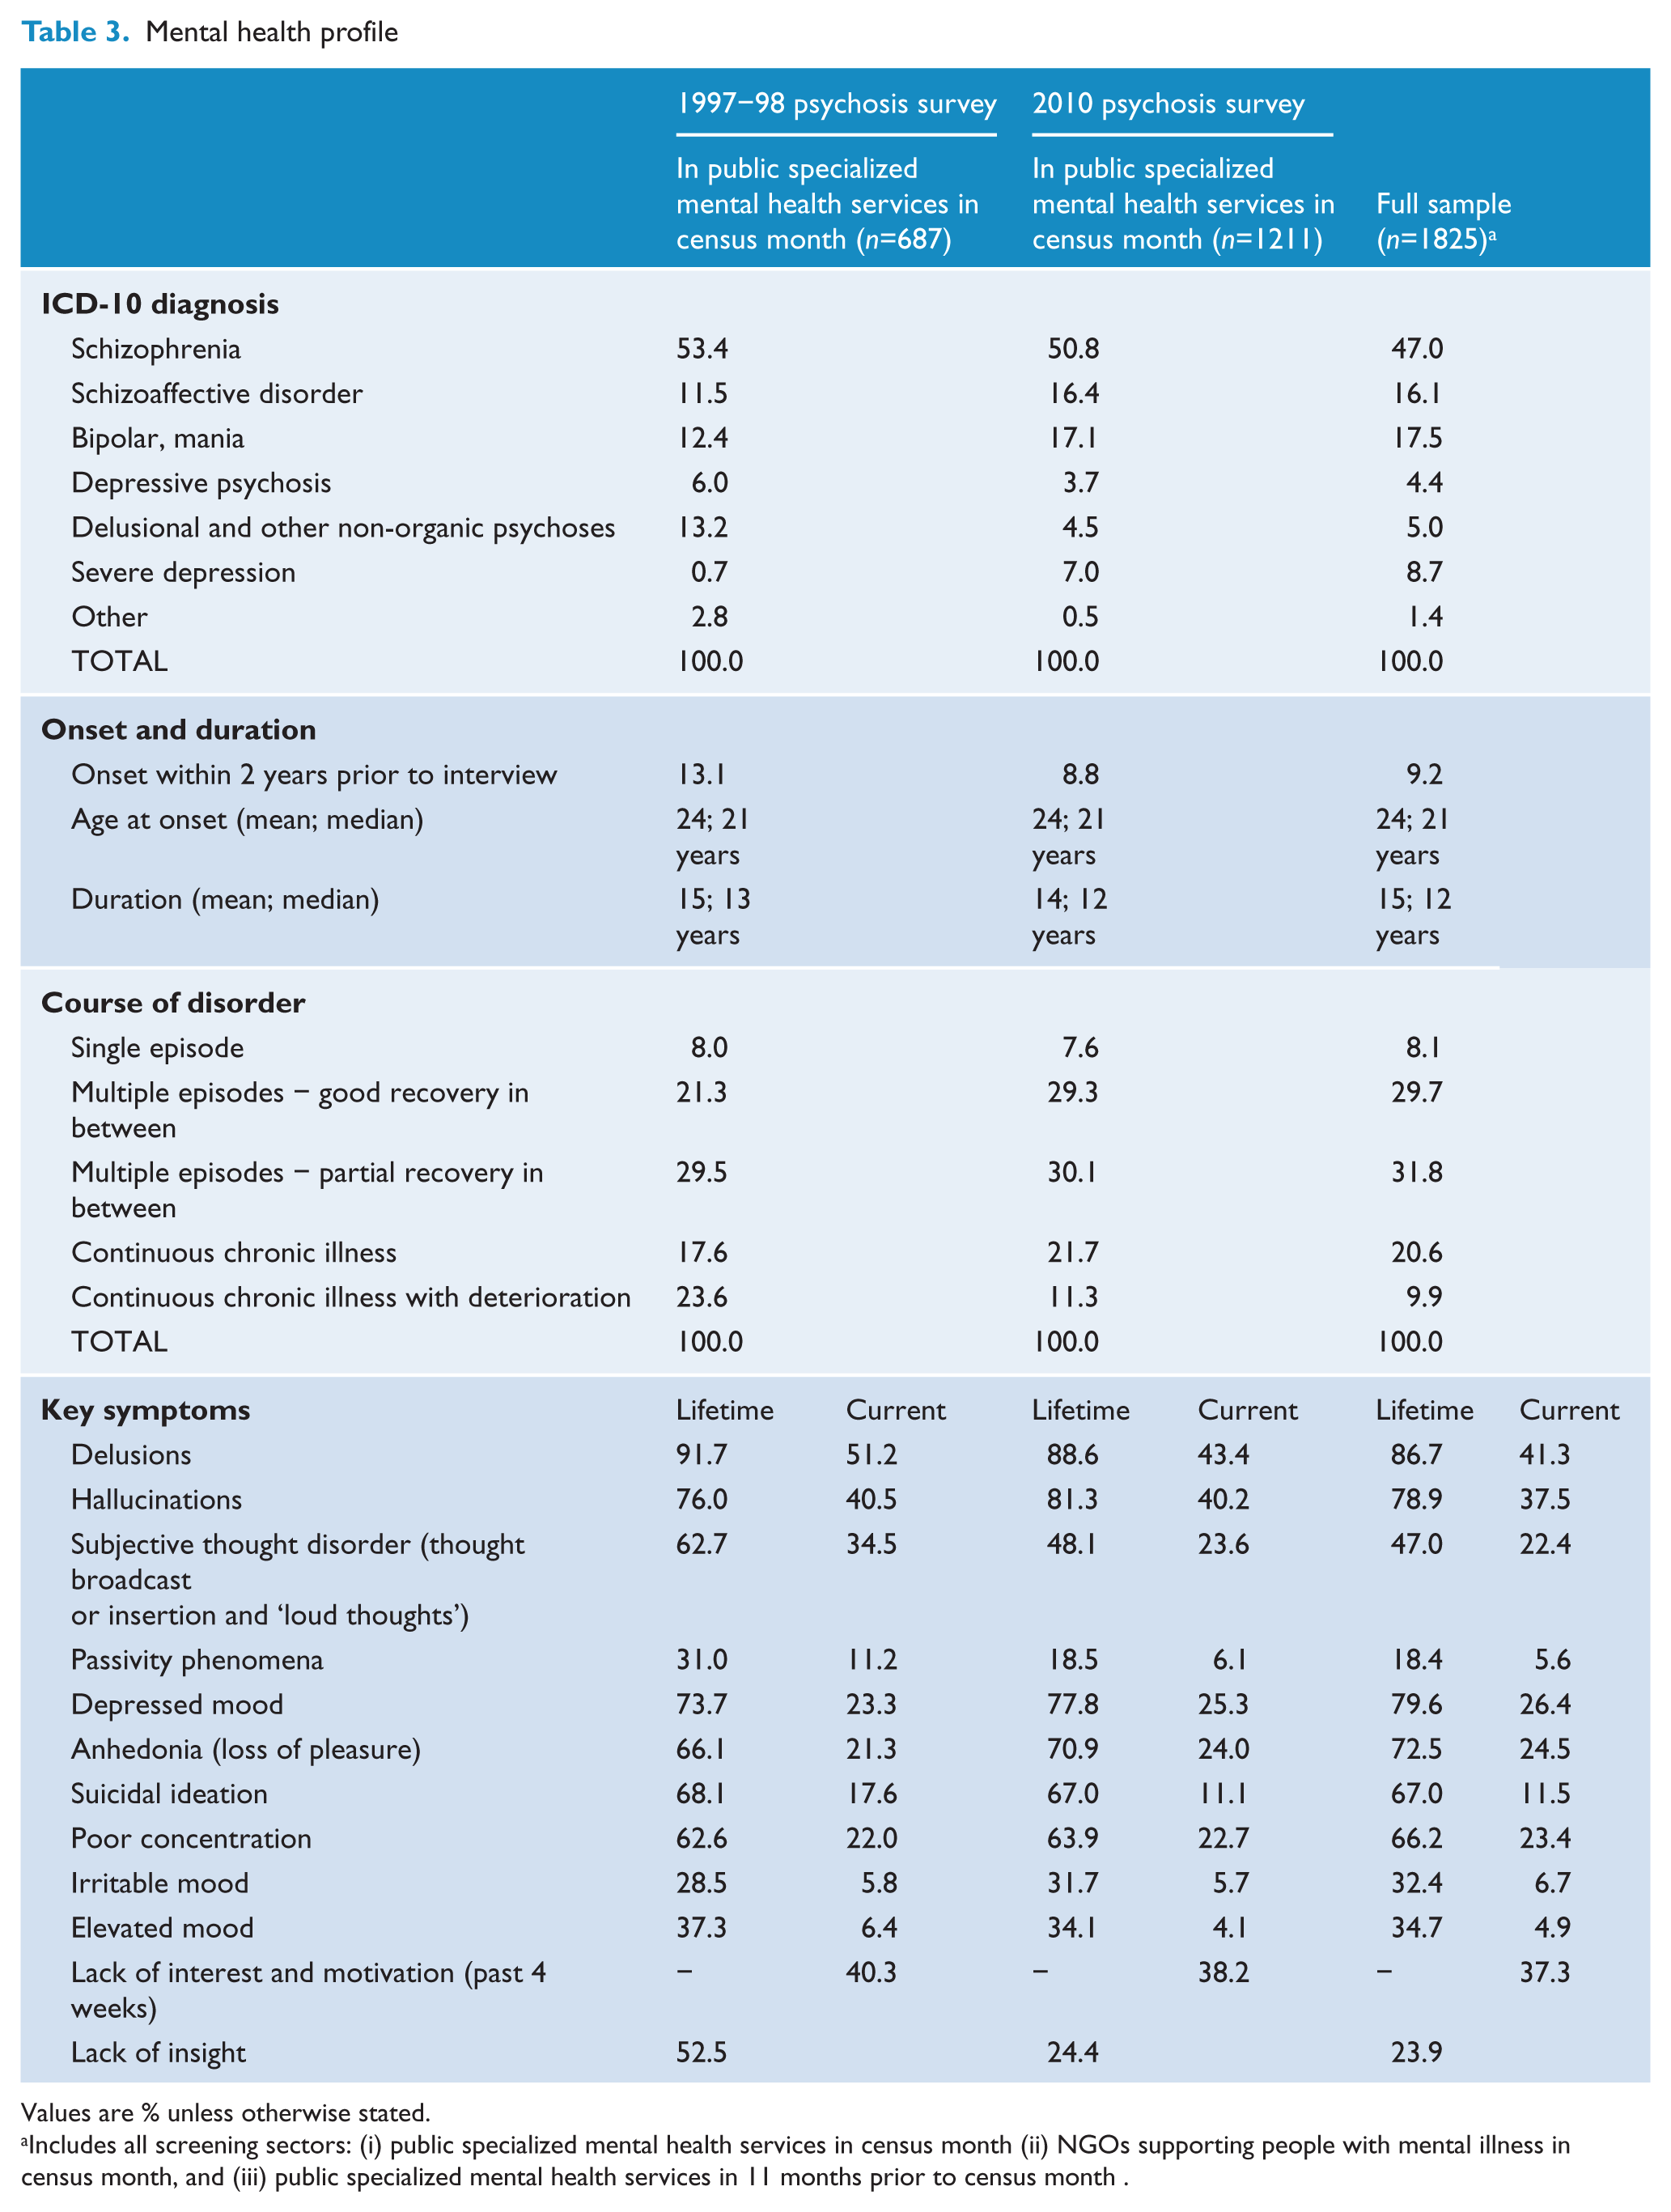
Values are % unless otherwise stated.
Includes all screening sectors: (i) public specialized mental health services in census month (ii) NGOs supporting people with mental illness in census month, and (iii) public specialized mental health services in 11 months prior to census month .
Onset of illness was under 25 years of age for 64.8% of participants (67.0% of males and 61.5% of females) and between the ages of 25 and 34 years for 23.2% (23.1% of males and 23.3% of females). For 11.5% (9.2% of males and 14.9% of females), onset was after 34 years of age. The mean age at onset was 24 years and the median was 21 years. For most, onset was insidious, over a period of more than 6 months (42.2%) or gradually over 1–6 months (29.1%). The mean duration of illness was 15 years, with a median of 12 years. For the majority, the course of illness was one of multiple episodes with good (29.7%) or partial (31.8%) recovery between episodes (Table 3). However, almost one-third (30.5%) had a continuous chronic form of illness. There were 8.1% who had only had one episode of illness prior to interview and 9.2% who had had their first episode within 2 years of interview. Comparing course of disorder for the 2010 public mental health services subsample with the 1997–98 subsample, there were proportionally more participants with multiple episodes with good recovery between episodes in 2010 (29.3% compared to 21.3%) and fewer with a chronic deteriorating course of illness (11.3% compared to 23.6%).
Both the current and lifetime symptom profiles of participants (Table 3) were dominated by positive psychotic and affective symptoms. Positive symptoms included delusions (experienced by 86.7% over a lifetime and 41.3% currently), hallucinations (78.9% and 37.5%, respectively), and subjective thought disorder including thought broadcast or insertion and thought echo (47.0% and 22.4%). Notably, over their lifetime, 79.6% of the participants had experienced depressed mood, 72.5% anhedonia and 66.2% poor concentration; one-quarter were experiencing these symptoms currently (26.4%, 24.5%, and 23.4%, respectively). Over a 12-month period, many participants experienced negative or deficit symptoms including a diminished sense of purpose (52.0%), loss of motivation and interest (51.7%), diminished emotional range (51.6%), restricted affect (43.2%), poverty of speech (19.0%), and impairment in socializing (63.2%). Almost one-quarter (22.0%) of participants had five or more of these negative symptoms while 85.2% had at least one. More than half the participants reported having symptoms associated with anxiety (59.8%) and depression (54.5%) in the past year. One-quarter (23.9%) of participants lacked insight into their mental illness.
The proportion of participants who were experiencing persistent thoughts that life was not worth living was 11.5%. The figure for lifetime suicidal ideation was much higher at 67.0%. One-half (49.5%) reported attempting suicide at some point in their lifetime (44.2% of males and 57.5% of females). By contrast, 3.7% of the general population aged 18–64 reported an attempted suicide over a lifetime: 4.9% of females and 2.4% of males (Slade, 2011).
Physical health profile
Participants were asked if they had been diagnosed by a doctor at any time in the past with any of a wide range of physical health conditions (Figure 2). Other than cancer, rates for all conditions for which there were general population comparisons in the 2007 mental health survey (Slade, 2011) were higher in people with psychosis compared to the general population aged 18–64. Just under one-third (31.8%) reported chronic back, neck, or other pain and 25.4% frequent and/or severe headaches and migraines. Just over one-quarter (26.8%) reported heart or circulatory conditions. One-fifth (20.5%) of people had diabetes. Other physical health issues included asthma (30.1%), allergies (26.0%), arthritis (20.8%), and respiratory problems (18.0%). Notable, although less common, were hepatitis (11.2%), eating disorders (8.0%), and epilepsy (7.3%).
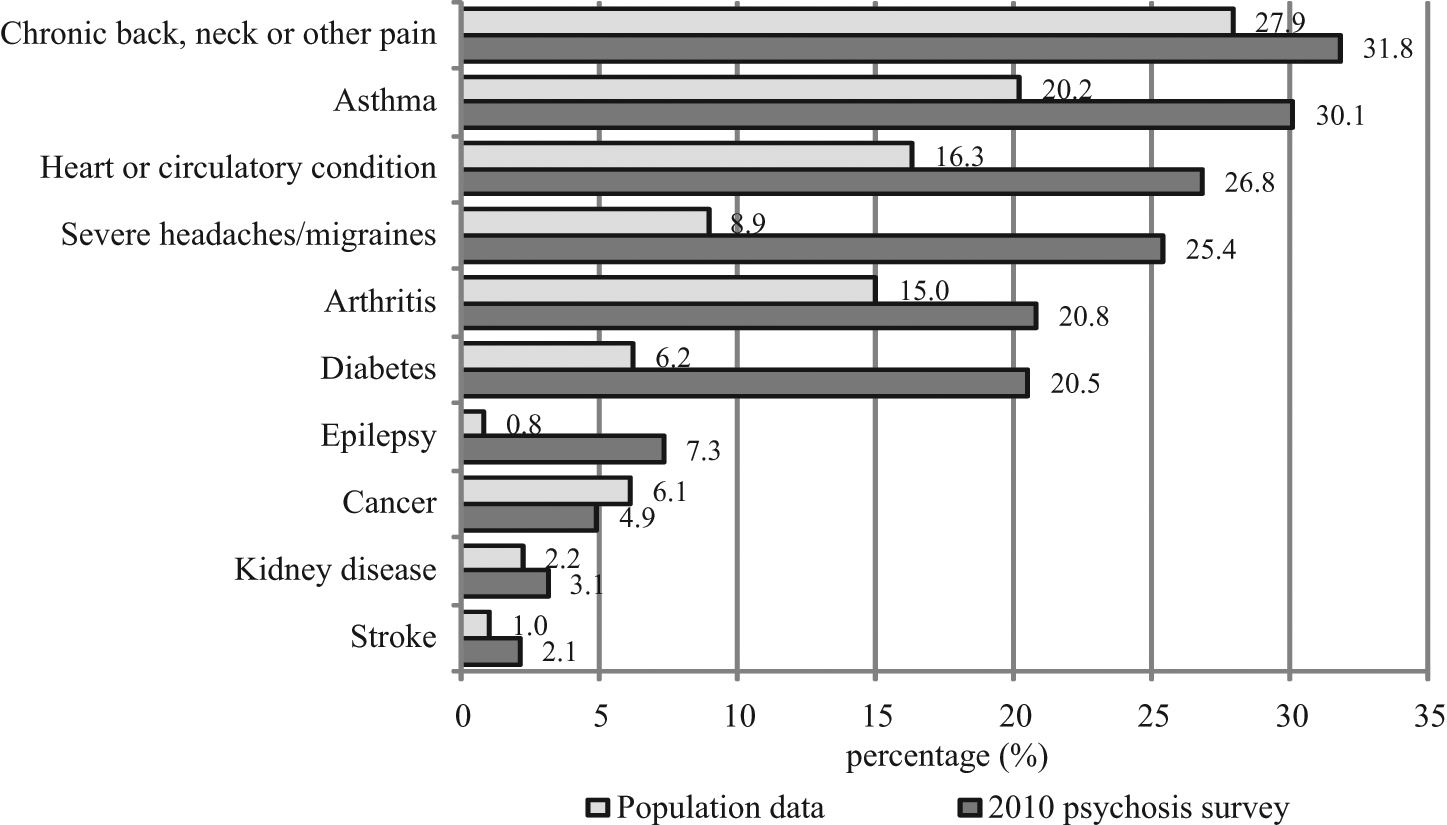
Lifetime physical health conditions and population comparison
Among people with psychosis aged 18–64, one-half (53.5%) of participants met older International Diabetes Federation criteria for metabolic syndrome (International Diabetes Federation, 2006) and 54.8% met the newer harmonized criteria (Alberti et al., 2009) or were already on treatment. Both sets of criteria include at-risk levels for abdominal obesity (82.1%), high-density lipoproteins (49.7%), blood pressure (48.8%), triglycerides (48.0%), and plasma glucose (28.6%).
One-quarter (24.0%) were at high risk for a cardiovascular event in the next 5 years based on the Framingham risk equation (Anderson et al., 1990; National Vascular Disease Prevention Alliance, 2009) or already had cardiovascular disease. Many reported a family history of risk factors for diabetes or cardiovascular disease, specifically hypertension (38.8%), diabetes (35.0%), heart disease (34.9%), and obesity (24.3%). Nutrition was poor: over two-thirds (71.1%) did not eat fruit at all or ate one or less servings a day and one-half (48.6%) did not eat vegetables at all or ate one or less servings a day. Moreover, 45.1% were obese and 33.5% were assessed as sedentary based on physical activity in the 7 days prior to interview. By comparison, population data indicated that 21.0% of the general population were obese and 18.0% classified as sedentary (Slade, 2011).
Medication use and psychosocial therapies
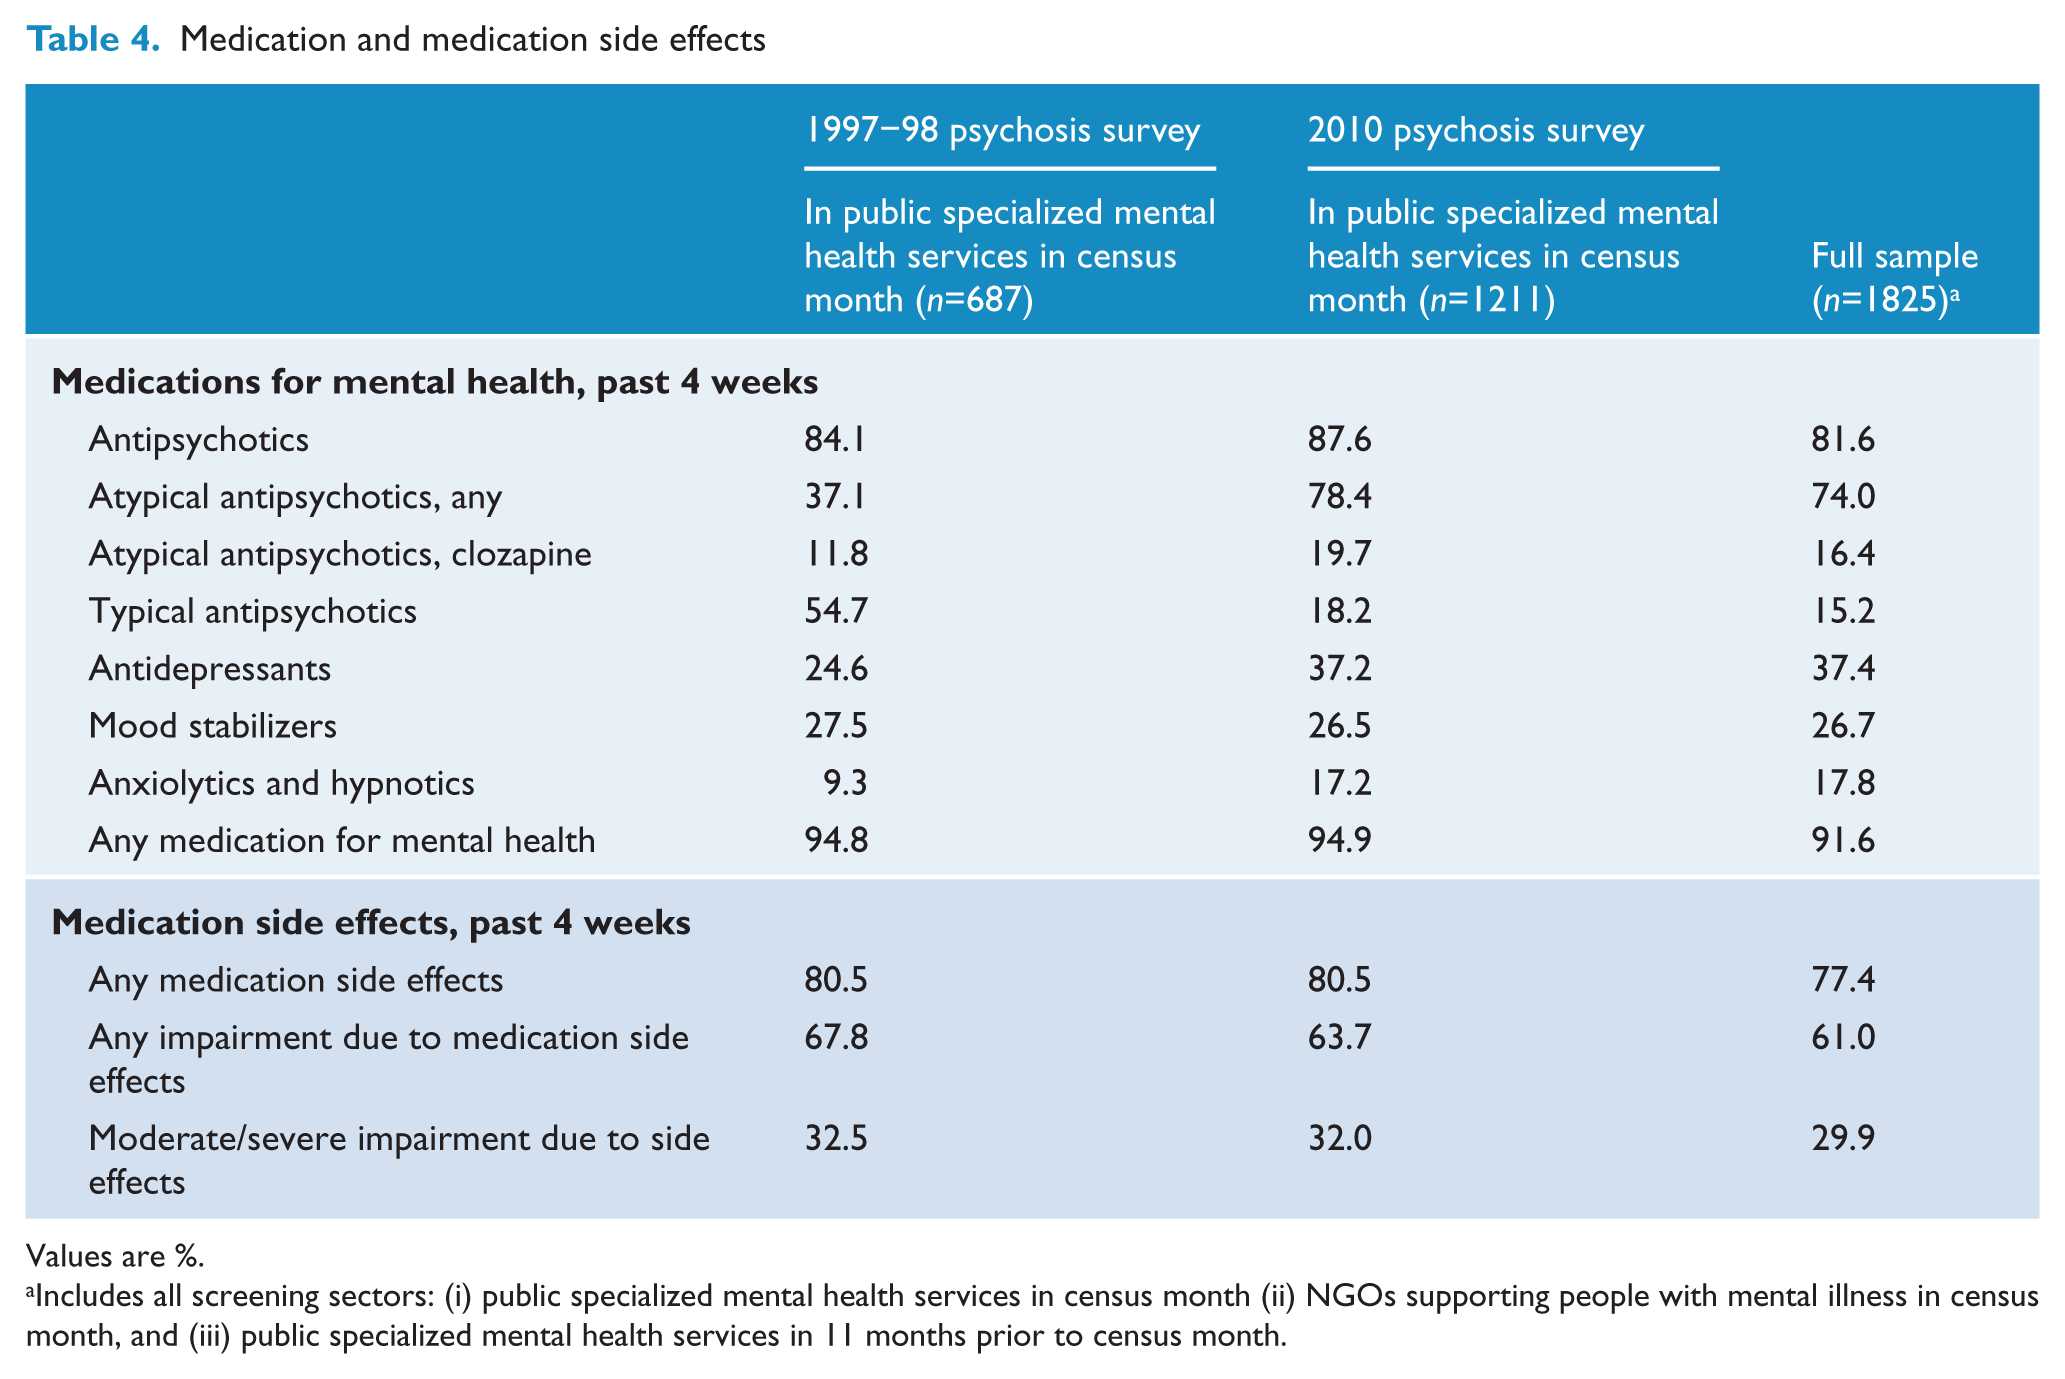
Most (91.6%) participants had been prescribed medication for their mental health in the 4 weeks prior to interview: 81.6% were taking antipsychotics (74.0% of the total sample were using atypical antipsychotics and 15.2% were using typical agents); 37.4% were on antidepressants; 26.7% were on mood stabilizers; and 17.8% were on anxiolytics or hypnotics (Table 4). Polypharmacy was common: 63.4% of those on psychotropic medication were using more than one class of medication and, among those using antipsychotic medication, 27.4% were using two or more antipsychotics. The majority using psychotropic medication said medication relieved their symptoms, either a lot (57.2%) or a little (28.2%). However, of the total, 77.4% reported medication side effects, 61.0% reported impairment in their daily life as a result of medication side effects, and 29.9% reported moderate or severe impairment. Weight gain associated with medication use was reported by 37.5% of participants: the median amount of weight gained over the previous 6 months was 8 kg. Fewer participants were receiving psychosocial therapies for their mental health. The most commonly accessed therapies were talking therapies such as counselling, psychotherapy, and group therapy (30.5%), cognitive behavioural therapy (22.3%) and family therapy (11.4%). Compared to data from the 1997–98 survey, a similar proportion of participants was using antipsychotic medication in 2010, but the use of atypical antipsychotics had doubled (Table 4). The proportions reporting medication side effects and associated impairment were comparable for both survey periods.
Medication and medication side effects
Values are %.
Includes all screening sectors: (i) public specialized mental health services in census month (ii) NGOs supporting people with mental illness in census month, and (iii) public specialized mental health services in 11 months prior to census month.
Substance use
Substance use data are summarized in Table 2. The proportion currently smoking, at 66.1% (71.1% for males and 58.8% for females), was well above the general population rate of 25.3% (28.2% and 22.5% for males and females respectively). On average, people were smoking 21 cigarettes a day. Half (50.5%) the participants had a lifetime history of alcohol abuse or dependence (58.3% for males and 38.9% for females). A similar proportion (54.5%) had a lifetime history of illicit drug abuse or dependence (63.2% for males and 41.7% for females). This included cannabis, amphetamines, tranquillizers, ecstasy, heroin, hallucinogens, cocaine, and solvents/inhalants. General population comparison figures for lifetime alcohol harmful use or dependence were 24.7% (35.3% for males and 14.1% for females) and for illicit drug harmful use or dependence were 8.9% (12.0% for males and 5.8% for females) (Slade, 2011).
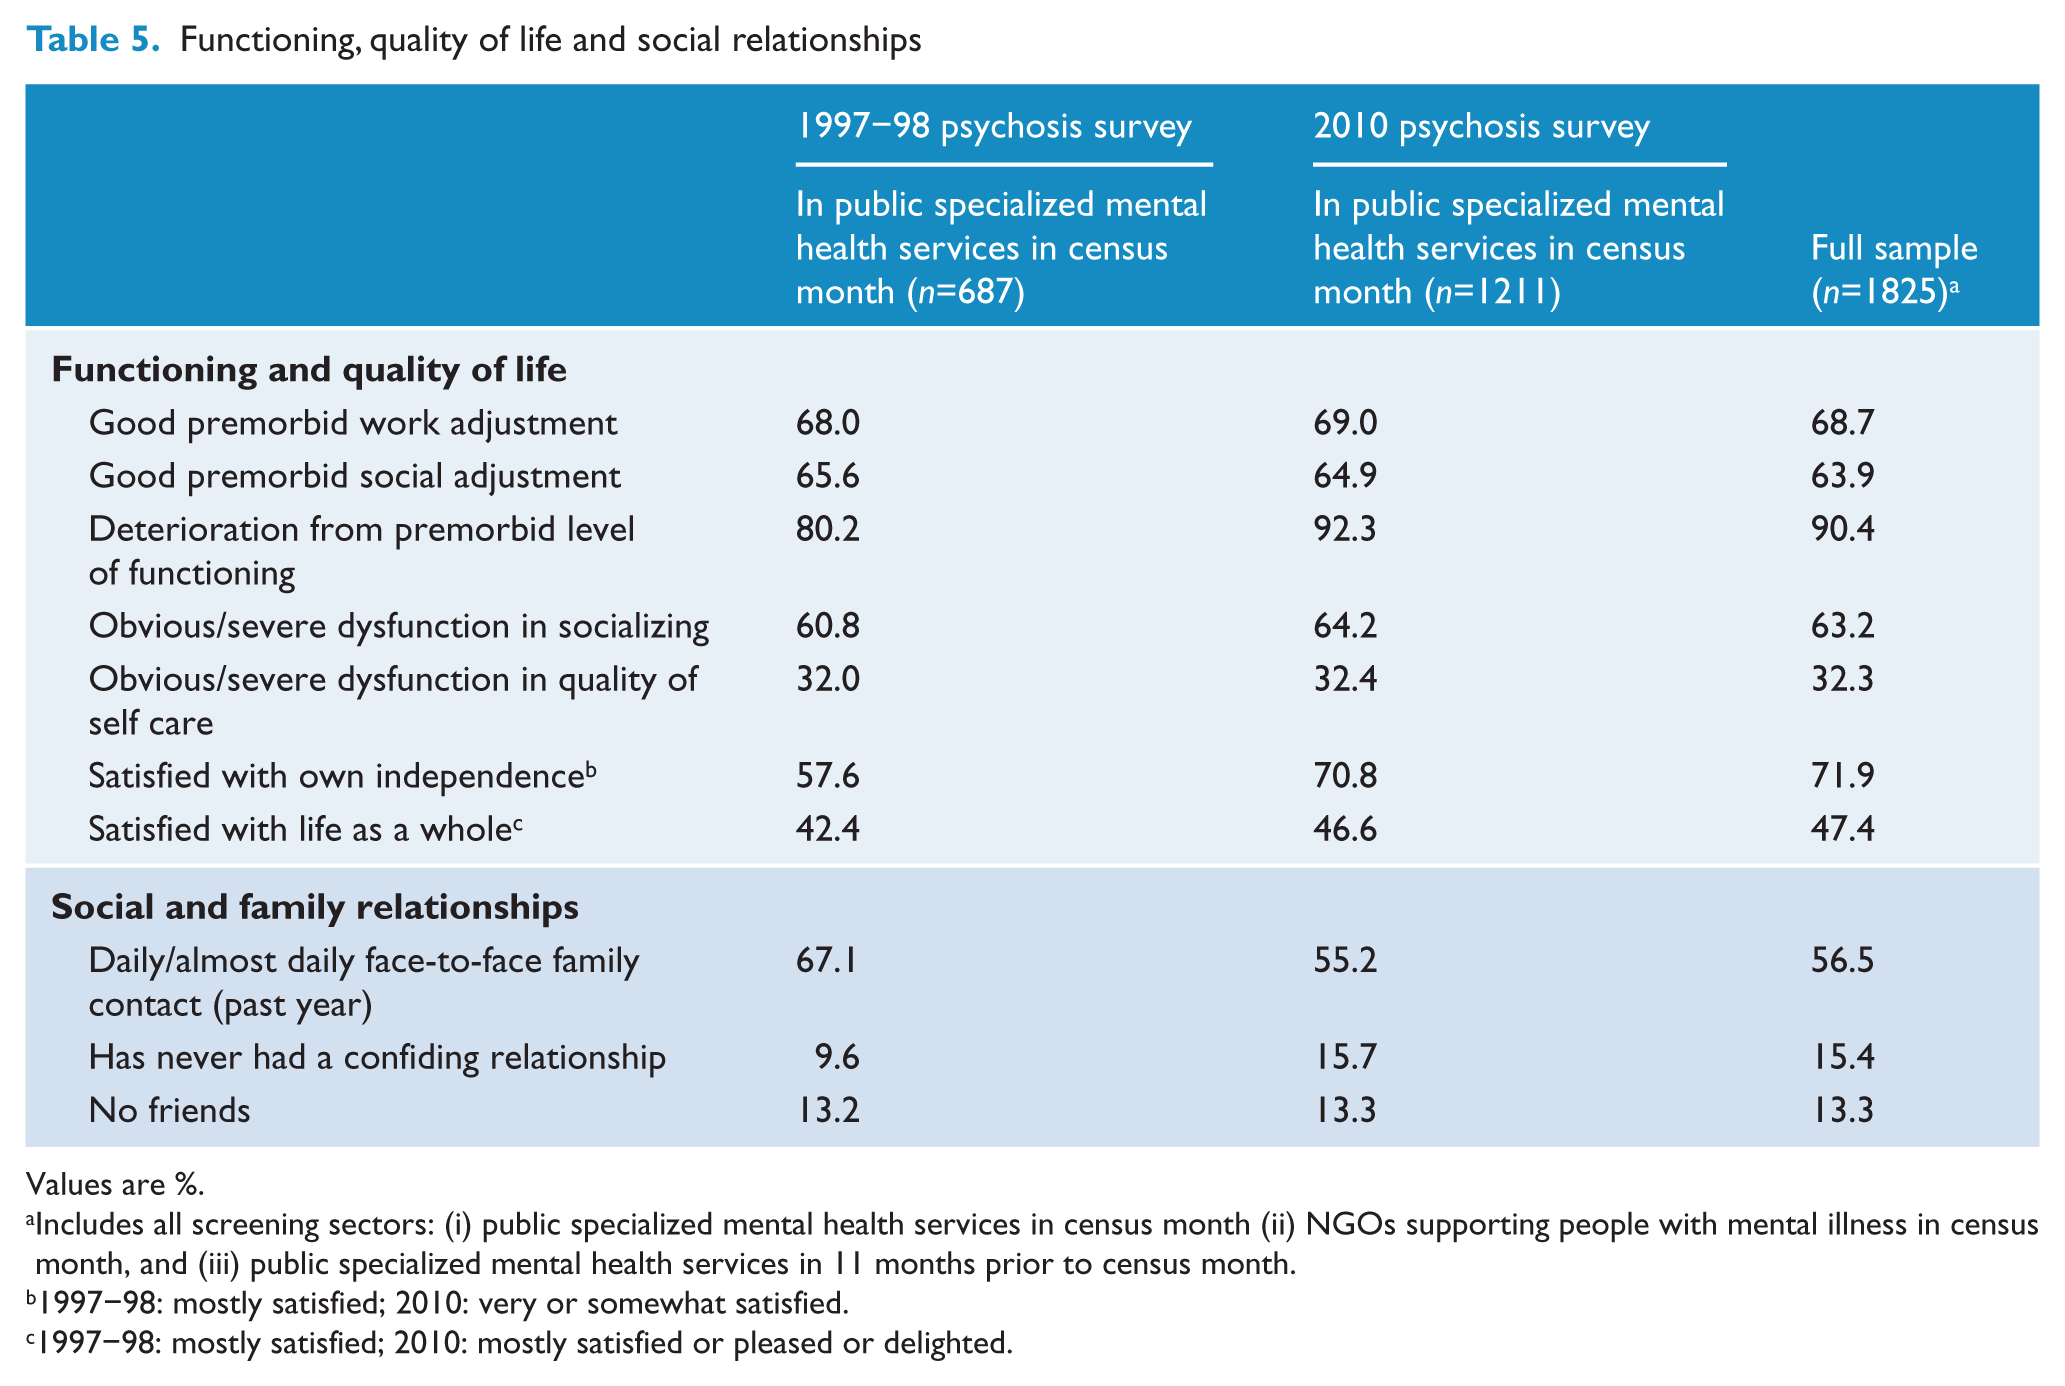
Functioning and disability
Prior to the onset of their illness, 68.7% of participants had been functioning normally in their work or study roles and 63.9% had normal social functioning (Table 5). However, 90.4% reported deterioration in overall functioning following illness onset: 63.2% had obvious or severe dysfunction in their capacity to socialize over the past year and 32.3% had severe impairment in their ability to care for themselves over the past 4 weeks. Global performance (including paid and unpaid work, childcare, other caring responsibilities, study, and activities of daily living) was assessed using the Multidimensional Scale of Independent Functioning (Jaeger et al., 2003). One-quarter (24.0%) of participants were rated as normal or very mildly disabled relative to community norms with respect to independent functioning in the 4 weeks prior to interview, while 22.7% were assessed as significantly to extremely or totally disabled.
Functioning, quality of life and social relationships
Values are %.
Includes all screening sectors: (i) public specialized mental health services in census month (ii) NGOs supporting people with mental illness in census month, and (iii) public specialized mental health services in 11 months prior to census month.
1997–98: mostly satisfied; 2010: very or somewhat satisfied.
1997–98: mostly satisfied; 2010: mostly satisfied or pleased or delighted.
Social networks
A large proportion of participants had frequent contact with family (Table 5). Almost all (96.1%) had had some contact with a family member over the previous year: 65.4% had contact almost every day, while a further 18.2% had contact at least weekly. Face-to-face contact with family members in the previous year was almost as high: 93.2% had at least one contact, 56.5% were in contact almost daily and another 17.1% at least once a week. Most participants (85.3%) said they had someone to rely on at times of serious need: for 67.0% of participants, this was a family member while, for 18.3%, it was a friend. Many (70.5%) also had at least one person they could confide in, with 40.9% confiding mainly in family and 29.6% mainly in friends. However, a large proportion of participants (69.3%) said that their illness made it hard to maintain close relationships. One-quarter (22.4%) felt socially isolated and lonely and a further 24.2% said that, despite having some friends, they were lonely for company. While most (86.5%) had one or more friends, 47.5% said they needed and would like to have more. Almost one-third (31.0%) lived alone and 40.6% of these would prefer to be living with someone else. Moreover, 13.3% of participants had no friends at all, 14.1% had no one to rely on and 15.4% had never had a confiding relationship (Table 5).
Stigma and discrimination may interfere with social activities and community engagement, leading to increased social isolation. Almost two-fifths (37.9%) of participants had experienced stigma or discrimination in the past year as a result of their mental illness, and said that fear (22.7%) or actual experience (20.3%) of stigma or discrimination had stopped them doing things they had wanted to do. Victimization rates were high, with 38.6% reporting any victimization (for example, break in, assault), 24.8% reporting assault including threatened assault, and 16.4% reporting actual assault (Table 2).
Use of health and related services
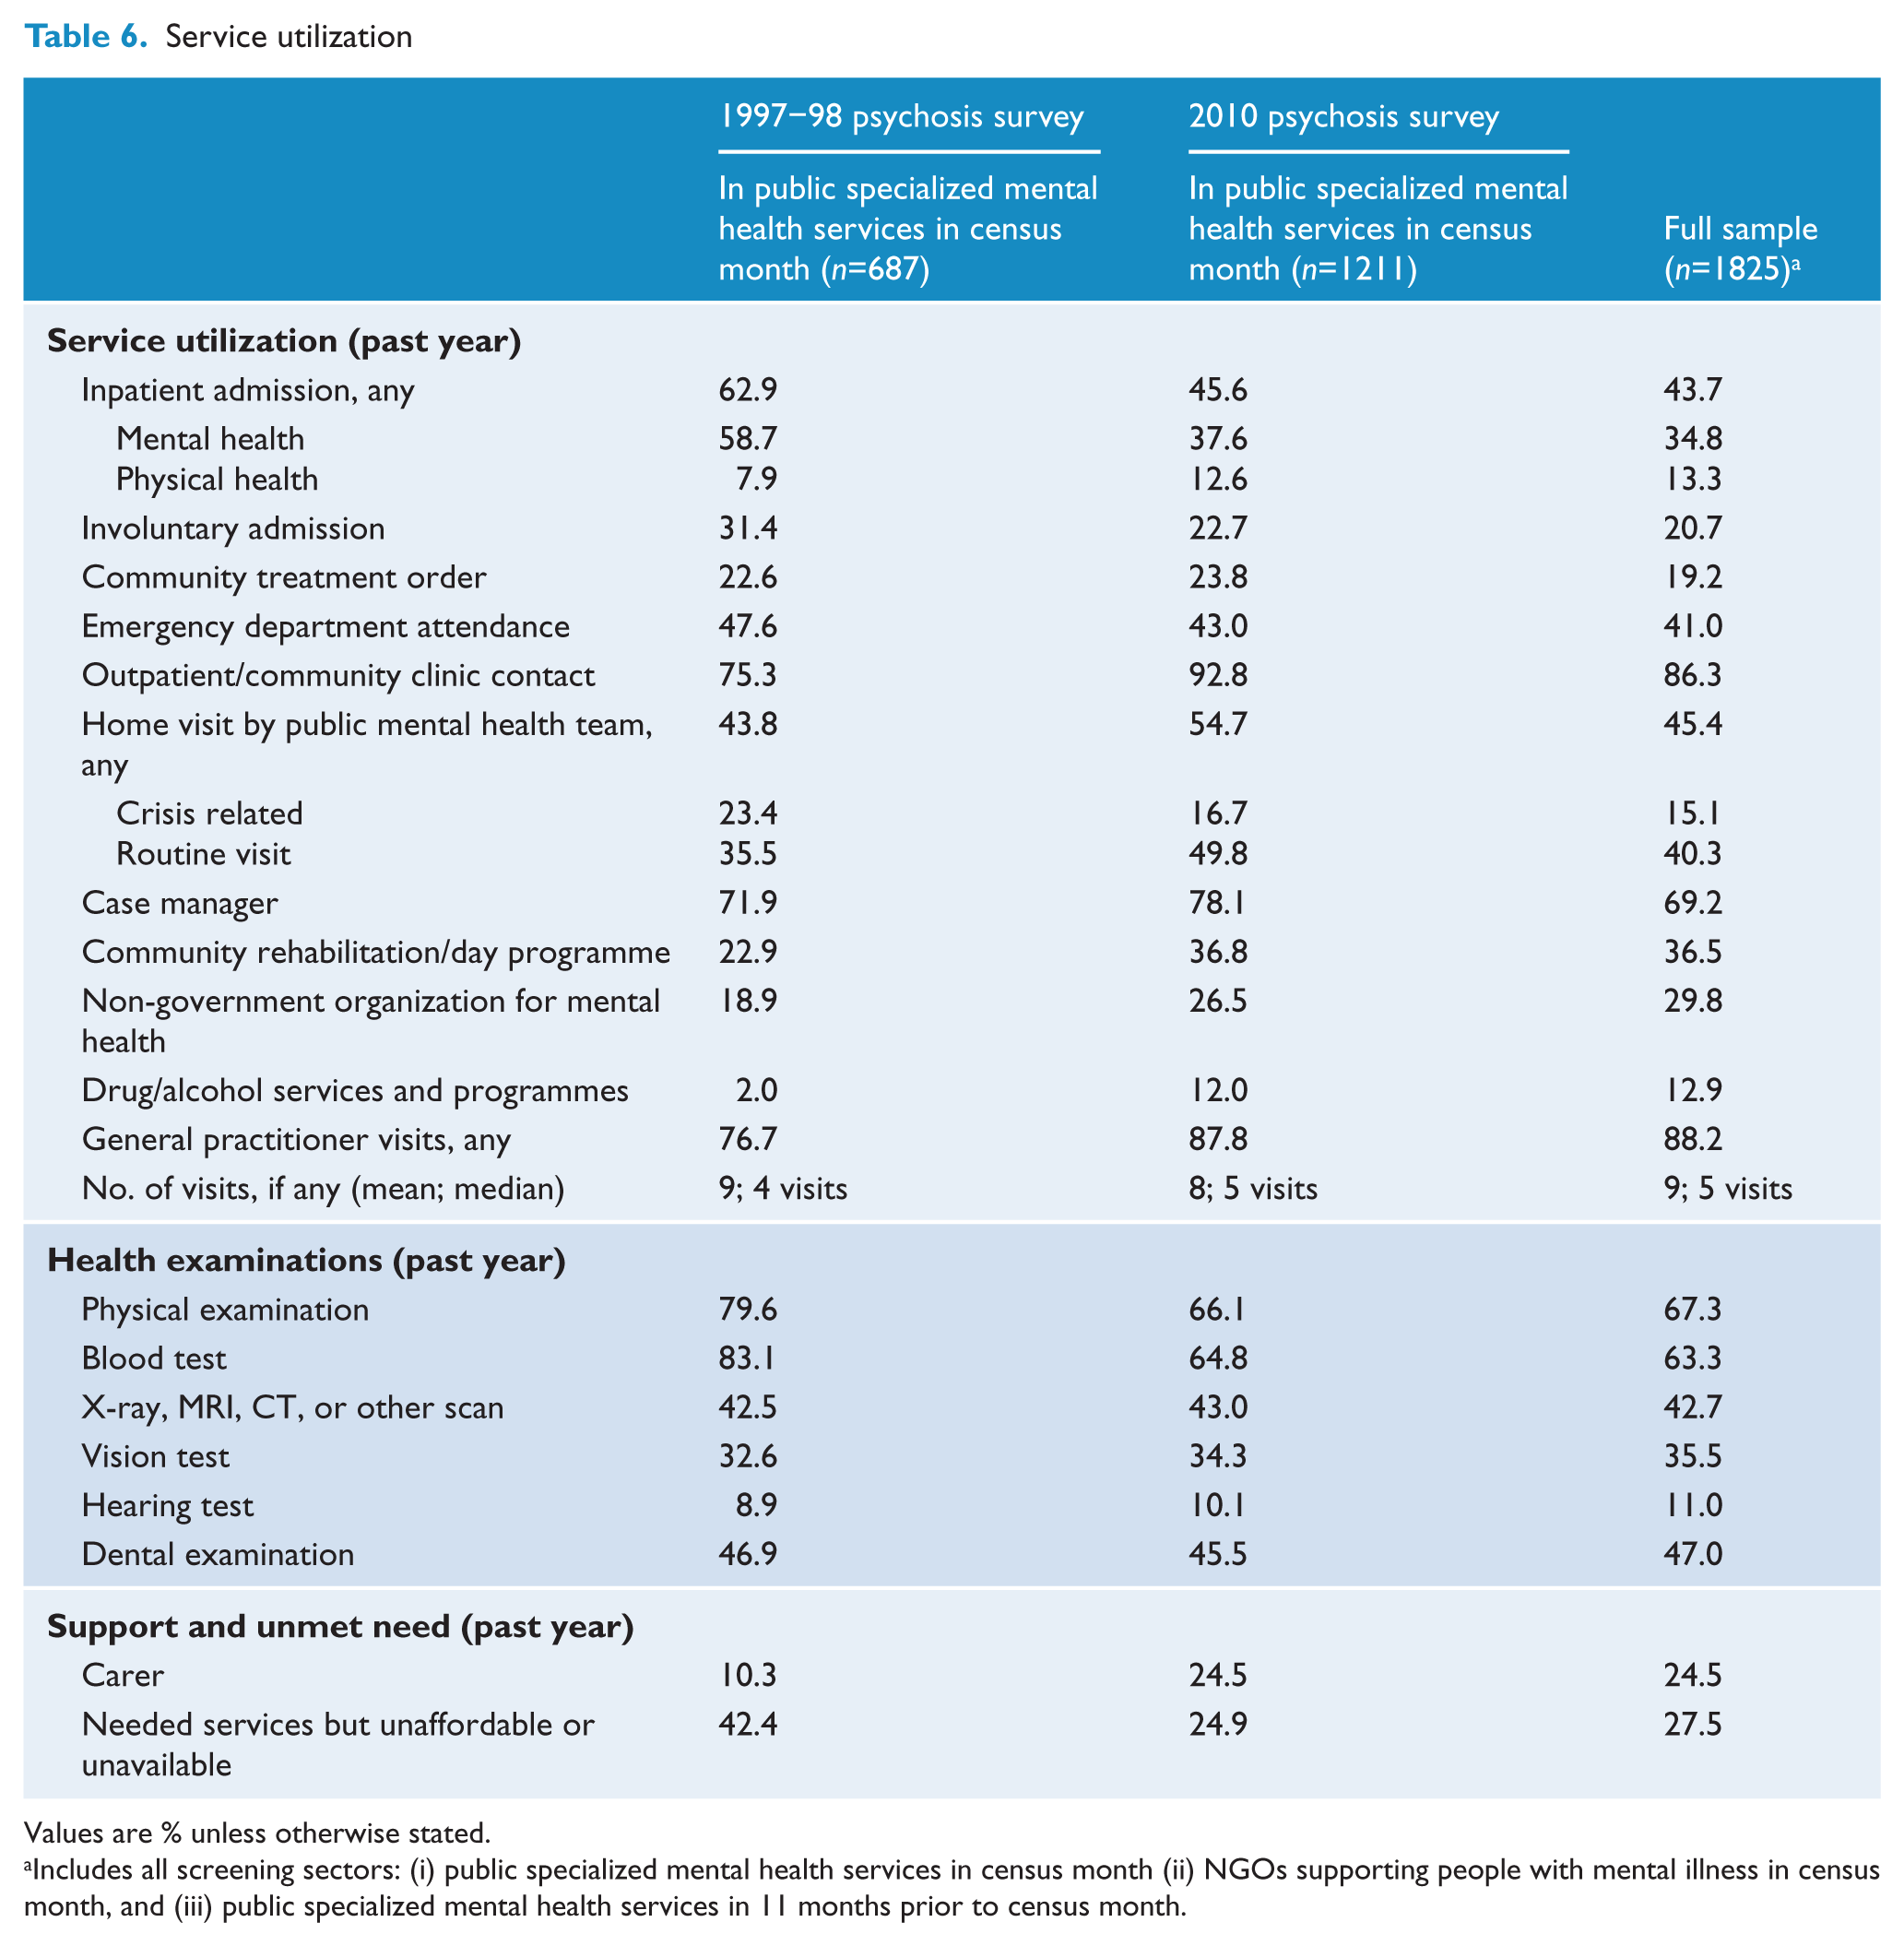
Overall, health service use by participants for any reason was high, with 98.9% using public inpatient, emergency, or outpatient/ambulatory/community health services or visiting a general practitioner for any health reason in the past year: 43.7% reported at least one inpatient admission; 41.0% had been seen in an emergency department; 86.3% had used outpatient/ambulatory/community health services; and 88.2% had visited a general practitioner (Figure 3 and Table 6). In all service categories other than general practice, participants were more likely to have used the services for mental health rather than physical health reasons.
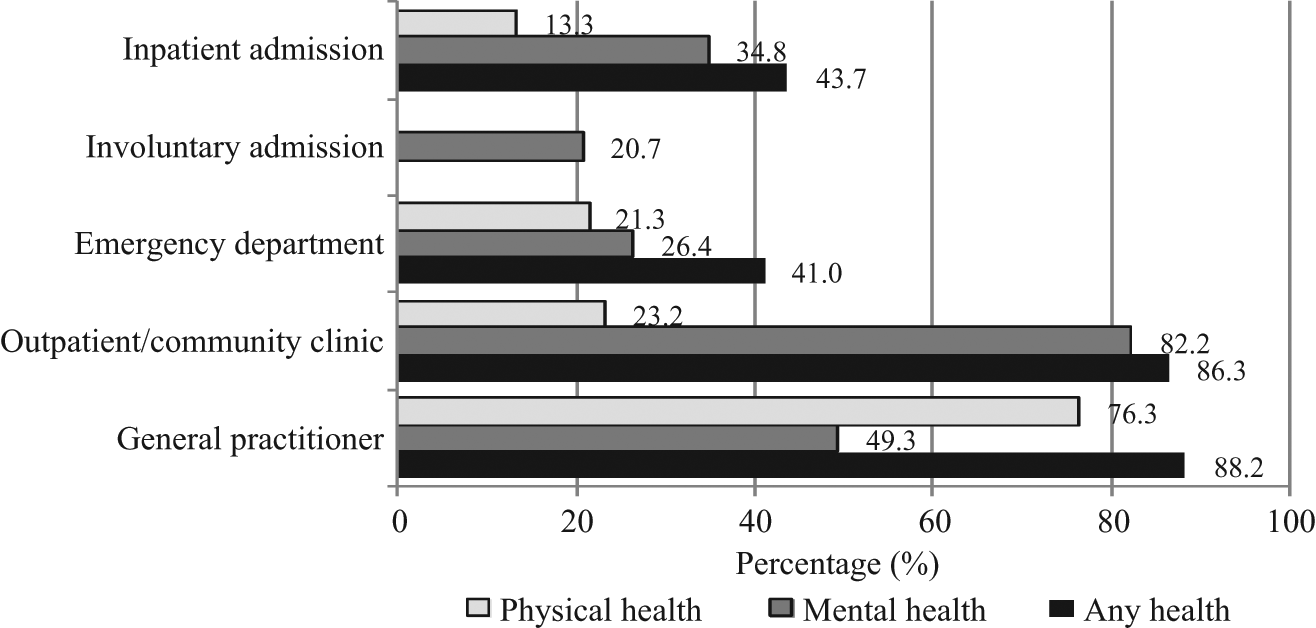
Health service utilization (past year)
Service utilization
Values are % unless otherwise stated.
Includes all screening sectors: (i) public specialized mental health services in census month (ii) NGOs supporting people with mental illness in census month, and (iii) public specialized mental health services in 11 months prior to census month.
In the 12 months prior to interview, 29.8% of participants had used services provided by NGOs supporting people with mental illness. A smaller proportion (11.2%) were solely in contact with the NGO sector in the census month. In addition, over one-third (36.5%) of participants had participated in community rehabilitation or day programmes run by public mental health services or NGOs: 14.5% in public mental health services (predominantly individual programmes) and 22.4% in NGOs (predominantly group-based programmes). The percentage with an individual rehabilitation or recovery plan was 28.9%. The majority (69.2%) had a case manager. While 52.4% had been visited at home by someone from either public mental health services or NGOs in the past year, very few (8.8%) had assertive community treatment where their main mental health care was provided in the home. Compared to data from the 1997–98 psychosis survey, there was a marked decrease in the proportion of people with psychiatric inpatient admissions for mental health-related reasons, while utilization of a variety of community treatment services rose (Table 6).
Despite high levels of substance use, only 12.9% had used drug and/or alcohol services or programmes. The proportion reporting ever using early intervention psychosis programmes was 8.4%, or 3.7% for the past year. This rose to 16.8% for younger people aged 18–34 years. These figures are likely to be underestimates as programmes are run under various names and participants may not always be aware that the service they had received was part of an early intervention psychosis programme. Over the previous year, participants also accessed community organizations providing material or financial aid such as the Salvation Army and St Vincent de Paul (21.7%); religious or spiritual groups (14.7%); legal aid services (8.4%); community telephone services for mental health such as SANE Australia and Lifeline (8.2%); and community counselling services such as Relationships Australia (4.7%). The proportion using the internet to seek information about mental health was 17.3%.
Other support
Over half (56.4%) of the participants reported receiving no or only minimal support to maintain role performance across work, study, and home domains; 30.6% were receiving modest or moderate support; and 13.0% were receiving significant, comprehensive, or total support. Over the previous year, 12.3% of participants had had a personal support worker and one-quarter (24.5%) had had a carer (Table 6). For 40.8% of those with carers, the carer was their mother and, for 25.7%, the carer was their partner. Half (50.6%) had help with domestic responsibilities in the 4 weeks prior to interview. Other support services received over the previous year included help with housing needs (21.9%), help with financial management (32.2%), and help to find employment (20.5%), an employment support worker (4.8%). Only 29.5% had help with socializing over the previous year despite marked deficits in this area.
Participants were asked which help received over the past year they thought was most important. They named support from mental health staff (29.6%, with 11.9% of participants naming case managers/key workers specifically and 9.0% naming psychiatrists and other medical officers); medication for their mental health (27.2%); other forms of mental health care, such as counselling, education, rehabilitation, and programmes in NGOs (18.8%); support from others (18.1%); and help connected with diet, sleep, and physical activity (15.5%). Participants said that the person who had spent the most time over the past year helping them with their mental health problems was their case manager (23.3%), family or friends (23.1%), psychiatrist (14.7%), mental health nurse (7.5%), general practitioner (6.8%), other mental health professional (6.0%), and psychologist (5.5%).
Unmet needs
Over one-quarter (27.5%) of participants had needed but had not received one or more services in the previous year (Table 6). Many named unmet needs related to treatment (55.5%) or treating services (26.9%), which were primarily but not wholly mental health related. A further 30.5% reported that they had needed assistance in other areas of their lives including, but not limited to, housing, finances, employment, legal assistance, and practical assistance (for example, help obtaining household goods), while 4.6% had socializing and leisure-related needs. When asked the reason why they had not received the service they needed, 37.9% said it was not available, 31.3% reported that they could not afford it, and 20.0% did not know how to access that service.
Future prospects
Participants identified the most important challenges for them in the coming year. The top three challenges were not health related. They were financial problems (42.7%), loneliness and social isolation (37.2%), and lack of employment (35.1%). Health-related issues were ranked next, with 27.4% naming physical health issues and 25.7% naming the uncontrolled symptoms of mental illness. Housing was ranked sixth, at 18.1%. Only half (47.4%) of the participants were satisfied (‘delighted, pleased or mostly satisfied’) with their life as a whole, compared to a general population figure of 81.5% for the same item (Slade, 2011). Nonetheless, regardless of the difficulties facing them, 71.9% of people with psychosis were very or somewhat satisfied with their level of independence and 77.4% believed their circumstances would improve over the forthcoming year.
Discussion
At 3.1 people per 1000 population, the 1-month treated prevalence of psychotic illness in public mental health services in 2010 is similar to the 1997–98 rate of 3.3 people per 1000 population. Combining data from all sectors across the two surveys (public mental health services, private treatment services, and the homeless group) gives an overall estimated 1-month prevalence of approximately 5.3 people per 1000 population. From a policy perspective, where prevalence is a key index for indicating the number of people in the population who are in need of facilities, treatment, and support, this translates to some 75,000 people with psychotic illness in need of support in any 1-month period. While it is possible that there has been some leakage across sectors over time, this figure is still likely to be an underestimate as it does not count those people with psychosis who, in the census month, were not receiving treatment services, other than the homeless group who were enumerated in the 1997–98 study. It also misses those people with psychosis in prison during the census.
The 2010 Australian national survey of psychosis provides a comprehensive snapshot of the circumstances of these people living with psychotic illness. Onset of psychosis most commonly occurs in late adolescence or early adulthood, which is a critical stage for education, training, and the consolidation of life skills; however, one-third of participants had their first episode after the age of 24 years, with illness onset impacting on later stages of life. For the majority, the effect of psychotic illness is debilitating and enduring. In this treated population, one-third of participants had a chronic disorder without remission. Nine out of ten participants experienced deterioration in social, occupational, or emotional functioning after the onset of their illness, with 32.3% of the total having marked impairment in self care in the 4 weeks prior to interview. Delusions, hallucinations, and negative symptoms were prominent. Of great concern, half had made a suicide attempt at some time in the past.
People with psychosis have many metabolic and cardiovascular risk factors related to: lifestyle (high rates of smoking, obesity, lack of physical activity, and poor nutrition); antipsychotic medication use and associated weight gain; and a family history of cardiovascular disease and related conditions. Over half (54.8%) the participants met harmonized criteria (Alberti et al., 2009) for metabolic syndrome. This is very similar to 54% for a clinical sample reported in one of very few Australian studies (John et al., 2009) although another study found 68% for a chronic, predominantly hospitalized sample (Tirupati and Chua, 2007). For the survey participants, poor physical health compounds the heavy burden already associated with their mental illness. However, although poor physical and mental health were both ranked highly by participants as challenges for the coming year, with physical health (27.4%) ranked a little above mental health (25.7%), the top three challenges identified by people with psychosis were not health related but concerned financial matters, loneliness and social isolation, and unemployment. General practitioners of participants endorsed the same top three challenges for their patients when asked the same question.
Employment is an important form of social engagement as well as a key source of income. Only one-third of participants had been in employment at any stage throughout the year and the vast majority were reliant on government benefits for their main income source. Most of those employed were working part-time only, with a substantial minority preferring more hours of work. Poor school and post-school completion rates observed for many people with psychosis further detract from their employability and are compounded by the effects of cognitive impairment associated with psychosis.
Families and friends play an important role in the lives of people with psychosis. Over half the participants (56.5%) were in face-to-face contact with family on a daily basis. One-quarter (24.5%) had a carer and, for 40.8% of this group, the carer was their mother, for 25.7% it was a partner and for 5.4% it was their child. People with psychosis also have parenting and caring responsibilities. One unexpected statistic emerging from the 2010 survey data was that one-quarter of women with psychosis had children under 18 years of age living at home with them; this was almost double the proportion in 1997–98. Moreover, a minority (14.7%) of participants were carers for others with a disability, long-term illness, or in old age; this figure rose to 21.3% for women aged 35–64 years.
When comparing 2010 survey data with data from the 1997–98 survey, a number of key differences were observed. There was a marked drop in psychiatric hospitalizations, including involuntary admissions. The small increase in physical health-related hospitalizations is encouraging in view of the very poor physical health of people with psychosis and the documented lower rate of intervention for this population compared to the general population once physical health problems have been identified (Lawrence et al., 2003). The decrease in psychiatric inpatient admissions was associated with a concurrent increase in the use of outpatient and community mental health services as well as other programmes designed to assist and treat people with psychosis living in the community. These included case management, rehabilitation programmes, and access to NGOs supporting people with mental illness. However, there may be some negative consequences associated with the shift. The proportions of participants with an annual medical examination and blood test dropped. This change is likely to be a result of the reduction in hospitalizations where physical health monitoring is a routine part of the admission procedure: the proportion with assessments not undertaken in the inpatient setting (vision, hearing, and dental assessments) did not change. Reflecting the differences in service utilization across the two time periods, the proportion in 2010 with an unmet need for services that were either unaffordable or unavailable had almost halved and the proportion in 2010 who were satisfied with their own independence rose by 23% even though the proportion satisfied with life as a whole was lower albeit similar for both survey periods (Table 5). It is more difficult to interpret the difference in the profile of course of disorder, where there was an increase in the proportion of participants with multiple episodes with good recovery between episodes in 2010 and a decrease in the proportion with a continuous chronic form of illness with deterioration. A similar pattern of difference was found in subanalyses stratified by sex, age group, diagnosis, and inpatient status. This item, which is probed then rated by the interviewer on the basis of all available information, was identical for both surveys. It is likely that a number of factors may be impacting on how outcomes were rated in 2010 including: the reduction in psychiatric inpatient admissions and lengths of stay; the increase in the proportion of people living independently in rental accommodation; increased access to and benefit from rehabilitation programmes; and the increased use of atypical medication.
The shift from the use of typical to atypical antipsychotics was a major change in Australia in the period between the two surveys. In keeping with other studies, the 2010 survey found that a smaller proportion of those using atypical antipsychotics compared to those using typical antipsychotics were experiencing neurological (extrapyramidal) side effects. Nonetheless, the proportion experiencing disabling treatment side effects remained similar for both surveys. Enduring disability among people with psychosis, even where there is optimal use of antipsychotic medications, highlights the fact that pharmacological interventions, while beneficial, are not sufficient in the management of psychotic illness. Meanwhile, the proportion receiving psychosocial interventions was relatively low despite evidence of their importance as an adjunct to psychotropic medication in the treatment of psychosis.
Comparing substance use data from 2010 with those collected in the 1997–98 psychosis survey, the proportion with lifetime histories of alcohol and illicit drug abuse/dependence had almost doubled. These data raise critical issues for the treatment and ongoing management of psychosis with drug and alcohol comorbidity. While the proportion getting any treatment for drug and alcohol problems has risen since 1997–98, from 2.0% to 12.0% for those in public mental health services, this remains a very small percentage of the total number affected. Unexpectedly, in the face of concerted public antismoking campaigns including smoking bans in public facilities, there was no change in the rate of current smoking since the first survey. Individuals with psychosis were 2.5-times more likely to smoke compared to the general community. High rates of smoking have important health implications. While broad-based smoking reduction campaigns have had a major impact on population trends, they appear to have had no effect on people with psychosis. Antisubstance use campaigns may be more effective if other interventions are successfully implemented to increase meaningful social and occupational participation among affected people. In a follow up to the first survey, comments included ‘What is there to stop for? When you wake up in the morning, what else is there?’, and ‘We smoke marijuana because there is nothing else to do’ (Morgan et al., 2002).
Limitations and caveats
The 2010 national survey of psychosis is the largest of its kind in Australia and one of the most comprehensive epidemiological investigations into psychotic illness worldwide. Replication of questions from the 1997–98 psychosis survey has enabled an assessment of change over time. Inclusion of items from the 2007 National Survey of Mental Health and Wellbeing and Australian Bureau of Statistics national surveys has facilitated benchmarking against population data. There are, however, some limitations. Imprecision in the prevalence estimates reported here may arise from normal sampling variation, errors in population estimates, and diagnostic misclassification. In addition, some people in contact with mental health services may have been missed during screening, resulting in an underestimation of prevalence. Participant refusal and the inability to interview some very ill patients may have biased prevalence downwards also, particularly if refusal was associated with a higher likelihood of meeting diagnostic criteria. However, comparison of participant screening data with data for those selected for interview but not participating for any reason indicated no selection biases based on available data. In general, factors that might bias estimates are likely to be either negligible or to result in underestimation of the prevalence of psychotic illness. While the survey relies primarily on self-reported data, there is no reason to believe that this has introduced systematic reporting biases into the data collection. Moreover, the many global assessments of functioning, disability, and course of illness in the interview schedule were made by the interviewers, predominantly mental health professionals trained to use specified probe questions and to elicit examples of actual behaviour before using their clinical judgement to make a rating based on all available information, including clinical case notes. These global assessments and the reports of general practitioners on their patient who participated in the survey corroborate participant self reports. Finally, the 2010 survey did not include people who were solely in contact with private treatment services, including general practitioners and private psychiatrists/psychologists, or who were homeless in the 12-month ascertainment period and not in contact with public treatment services. Only a minority of people with psychosis have private health insurance and, for those whose main care is in the private sector, many will have some contact with public treatment services over the period of a year. Similarly, many homeless people with psychosis have contact with public treatment services over the period of a year. Our first survey estimated a 1-month prevalence of 1.4 cases of psychosis per 1000 in the private treatment sector and 0.4 per 1000 for those who were homeless. Estimates would be much lower for a 12-month period. Descriptive data were collected on these groups as part of the 1997–98 survey and have been published (Jablensky et al., 2000).
Conclusion
People with a psychotic illness have the same requirements for and aspirations of good health, adequate housing, worthwhile employment, and sufficient income to meet their basic needs as other Australians. They express a similar yearning for social interaction and meaningful relations with others. Many have partners and children and some are carers for others with a disability who rely on them. Comparisons with data from the 1997–98 survey indicate that things have improved for people with psychotic illness but there are still major gaps. Their challenges relate to employment, income, housing, social contact, and the need for social support in addition to mental and physical health issues. These challenges highlight the importance of an integrated approach to service provision to ensure that their living requirements and needs for social participation are met, as well as their very considerable mental and physical health needs. The population-level data collected as part of the 2010 national psychosis survey provide a solid empirical foundation to guide policy development and service provision around all aspects of the lives of people living with psychosis.
Footnotes
Acknowledgements
This publication is based on data collected in the framework of the 2010 Australian National Survey of High Impact Psychosis. The members of the Survey of High Impact Psychosis Technical Group were: V Morgan (National Project Director), A Jablensky (Chief Scientific Advisor), A Waterreus (National Project Coordinator), R Bush, V Carr, D Castle, M Cohen, C Galletly, C Harvey, B Hocking, A Mackinnon, P McGorry, J McGrath, A Neil, S Saw, H Stain. The site coordinators were A Baker, L Campbell, J Green, J Griffith, M Hanlon, M Haydock, L Hayes, A Poon and S Sweeney. The interviewers were L Anthes, N Atkinson, F Barclay, K Barrack, L Bates, A Brown, R Bush, I Cairney, R Caley, S Dixon, L Dixon, K Douglas, L Drinkwater, P Edwards, V Fenby, C Harper, M Heath, B Hulse, E Killen, L Niven, D Novello, D Rich, G Roddis, K Scholes, S Turner and J Waterson. Population statistics from the 2007 National Survey of Mental Health and Wellbeing matching the psychosis survey age criteria were provided by Dr Tim Slade. Ethics approvals for the study were obtained from relevant institutional human research ethics committees. We acknowledge, with thanks, the hundreds of mental health professionals and general practitioners who participated in the preparation and conduct of the survey and the many Australians with psychotic disorders who gave their time and whose responses form the basis of this publication.
Funding
The study was funded under contract to the Australian Government Department of Health and Ageing.
Declaration of interest
The authors report no conflicts of interest. The authors alone are responsible for the content and writing of the paper.