
Abstract
Introduction
There has been little Australian research into the psychological distress of tertiary students. This is surprising given that 42% of 18–20-year-olds attend tertiary institutions (Birrell et al., 2008) and the prevalence of mental disorders is highest between the ages of 16–24 (Slade et al., 2009). The psychological distress of tertiary students takes on increasing importance in the context of recent higher education policy. With the changing structure of the economy and the need for a highly educated and skilled workforce to compete internationally, the Australian Government has responded to current and projected skill shortages by setting targets for a higher participation rate, particularly for socio-economically disadvantaged students (Birrell et al., 2007; Department of Education Employment and Workplace Relations (DEEWR), 2008; 2009b). A major emphasis of this policy has been on improving the learning experience and outcomes of university students.
It is therefore of some concern that two recent Australian studies reported that university students had significantly higher levels of psychological distress than their community peers. Using the Kessler Psychological Distress Scale (K10) with a cut-point of ≥ 22 (high to very high distress), Leahy et al. (2010) assessed the prevalence of psychological distress in a sample of undergraduate students from the University of Adelaide and found that they had a significantly higher prevalence of high psychological distress than their age-matched community peers (48% vs 11%). In the other study, which also used the K10, Stallman (2010) examined the prevalence of psychological distress in students from two large Australian universities and showed that university students had a significantly higher prevalence of elevated distress (scores: 16–50) and very high distress (scores: 30–50) than their community peers (84% vs 29% and 19% vs 3%, respectively).
International studies that have used self-reported symptom measures of psychological distress or disorders and compared tertiary students with their community peers have also generally found that students had poorer psychological health (Royal College of Psychiatrists, 2003). For example, Roberts et al. (1999) found that, with the exception of physical functioning, all subscales of the Short-Form-36 Health Survey (SF-36) and the General Health Questionnaire indicated levels of tertiary student health significantly below population norms matched for age and gender. Similarly, Stewart-Brown et al. (2000) showed that students had poorer health on all eight dimensions of the SF-36 than their community peers, with the greatest difference for role limitations due to emotional problems (i.e. depression and anxiety). However, a more recent study by Blanco et al. (2008), using DSM-IV criteria in a structured diagnostic interview administered by trained interviewers, found no significant difference in the prevalence of mood and anxiety disorders between college students and non-students.
Studies have generally found that female students have a higher risk of psychological distress or mental disorders than male students, although not consistently or for all disorders (Blanco et al., 2008; Eisenberg et al., 2007; Leahy et al., 2010; Roberts et al., 1999; Stallman, 2010; Stewart-Brown et al., 2000; Verger et al., 2010). Younger students have been found to be at greater risk of mental disorders than older students (e.g. students aged 18–22 vs those aged > 25, Eisenberg et al., 2007; students aged 18–34 vs those aged > 34, Stallman, 2010). Consistent results have been obtained for the association of financial problems with psychological distress or mental disorders in tertiary students (Andrews and Wilding, 2004; Eisenberg et al., 2007; Roberts et al., 1999; Stallman, 2010; Stewart-Brown et al., 2000). Furthermore, students from a low socio-economic background have also been shown to have a higher risk of mental disorders (Eisenberg et al., 2007; Verger et al., 2010). In addition, Roberts et al. (1999: 105–106) found that students worked on average 17.6 (SD = 11.6) hours per week outside of university and that working longer hours in paid employment was associated with poorer mental health outcomes (b = 0.21, p < 0.005). Psychological distress has also been associated with negative effects on students’ ability to study and academic outcomes (Andrews and Wilding, 2004; Stallman, 2010; Stewart-Brown et al., 2000; Verger et al., 2010). Factors that have been found to protect against psychological distress or mental disorders include living on campus and being married or in a domestic relationship (Blanco et al., 2008; Eisenberg et al., 2007; Stallman, 2010).
While these studies provide valuable insights into the psychological distress of tertiary students, they have some limitations. In relation to the international studies, direct comparisons with Australian students are complicated by the different social and institutional contexts, screening instruments and survey methodologies. In the Australian context, both of the recent studies mentioned above used samples from one or two universities, making it difficult to generalise to the rest of the Australian university student population. Finally, because these studies focused on university students, no information on the prevalence and correlates of psychological distress in vocational education and training (VET) students is available.
Given the at-risk age group that tertiary students largely comprise and the potential negative impact of psychological distress on tertiary students’ educational experience and outcomes, more epidemiological information is required on the prevalence and characteristics associated with psychological distress in tertiary students relative to their non-student peers. Accordingly, the aims of this study are: (1) to obtain a range of estimates for the prevalence of moderate and high psychological distress in tertiary students and their non-student peers using three nationally representative household surveys; and (2) to examine any differences in the characteristics associated with moderate and high psychological distress between university students, VET students and non-students.
Method
National survey datasets
The national household surveys analysed in this study were the 2007 Household, Income and Labour Dynamic in Australia (HILDA) survey, the 2007–08 National Health Survey (NHS) and the 2007 National Survey of Mental Health and Wellbeing (NSMHWB). The HILDA survey was based on personal interviews and a self-completion questionnaire (response rate for face-to-face interviews was 91% and, of these, 89% returned the self-completion questionnaire); the NHS and NSMHWB were both based on face-to-face interviews (response rates were 91% and 60%, respectively). More details about these survey designs are available elsewhere (Australian Bureau of Statistics, 2009a, 2009b; Watson, 2009).
Respondents
With the HILDA survey it was possible to define university and VET students based on the courses they were studying. University student courses included bachelor degree, bachelor degree with honours, graduate diploma or certificate, and postgraduate degrees (Masters and PhD). VET student courses included certificates I–IV, diploma, associate degree and advanced diploma. VET students are comprised of Technical and Further Education (TAFE) and Technical College students. The 2007–08 NHS data also made a distinction between students studying at university or VET institutions. However, all that was available in the NSMHWB dataset was a distinction between tertiary students studying full-time or part-time. The present study defines tertiary students as university and VET students combined.
The number of tertiary students and community peers, aged 18–59 years, analysed in this study were: the HILDA survey, tertiary student n = 1022, non-student n = 8732; the NHS, tertiary student n = 1144, non-student n = 7293; and the NSMHWB, tertiary student n = 1025, non-student n = 4880. As noted, with the HILDA survey and NHS it was possible to examine university and VET students separately. In the HILDA survey, university student n = 599 and VET student n = 423; in the NHS, university student n = 725 and VET student n = 419.
Screening instrument
All surveys used the Kessler Psychological Distress Scale (K10), which has been shown to have good validity compared to diagnoses derived from structured diagnostic interviews, and has been extensively used to estimate the prevalence of population psychological distress (Kessler et al., 2002, 2003; Slade et al., 2011). The HILDA survey asked the K10 questions in the self-completion questionnaire, while the NHS and NSMHWB asked these questions in face-to-face interviews. Commonly used cut-off points for the creation of the psychological distress categories are: 10–15 = ‘low distress’, 16–21 = ‘moderate distress’, 22–29 = ‘high distress’ and 30–50 = ‘very high distress’ (Australian Bureau of Statistics, 2009a, 2009b; Wooden, 2009). Slade et al. (2011) present the most recent normative data on the K10 from the 2007 NSMHWB. The stratum-specific likelihood ratios that were calculated showed that the odds of any mental disorder given respondents’ K10 scores were: 0.5 for low distress, 1.9 for moderate distress, 5.3 for high distress and 15.6 for very high distress. The stratum-specific likelihood ratios were highest for depression and anxiety disorders. In this study, owing to the relatively small sample sizes of tertiary students, high and very high distress categories were combined into ‘high distress’ (scores: 22–50).
Socio-demographic and economic characteristics examined
All analyses examining the association of the characteristics of interest with moderate and high psychological distress were based on the HILDA survey. These data were used because VET students were identifiable and detailed variables on personal income and hours worked in paid employment were available.
The characteristics examined were: age group (18–24, 25–34 and 35–59); gender (male/female); study mode (full-time/part-time); physical conditions (a positive response to any of these items: arthritis, asthma, any type of cancer, chronic bronchitis or emphysema, type 1 diabetes (childhood onset), type 2 diabetes (adult onset), heart/coronary disease, high blood pressure/hypertension, and other circulatory conditions); relationship status (married or living with someone, separated/divorced/widowed, and never married and not living with someone); hours of paid employment per week (none, 1–22, 23–39 and ≥ 40); financial problems (a positive response to any of these items: ‘Could not pay electricity, gas or telephone bills on time’, ‘Could not pay the mortgage or rent on time’, ‘Pawned or sold something’, ‘Went without meals’, ‘Was unable to heat home’ and ‘Asked for financial help from friends or family’); and quartiles of financial year, personal gross income from all sources (≤ $18,259, $18,260–$38,000, $38,001–$60,500 and ≥ $60,501).
Data analysis
Prevalence estimates were made of moderate and high psychological distress in university and VET students, tertiary students and non-students, with 95% confidence intervals (CIs), overall and by age and gender for each survey. In addition, to adjust for the different age and gender distributions of students and non-students in each survey, direct standardization was used to re-estimate the prevalence of moderate and high psychological distress between the groups. Pearson chi-square analyses, with a second-order correction converted into an F-statistic, were used to test for significant differences in the distribution of distress categories overall, and by age and gender between students and non-students. Post-estimation, adjusted Wald tests were also used to specifically assess differences in proportions between students and non- students at the moderate and high distress levels, with Bonferroni adjusted p-values.
With the HILDA survey, design-based chi-square analyses were used to examine differences in the distribution of the characteristics between the groups. To analyse if any of the characteristics of interest were associated with moderate and high distress relative to low distress in each group, multinomial logistic regression models were used to estimate relative risk ratios (RRR) with 95% CIs. In addition, models with study status (university students, VET students or non-student) in interaction terms were also estimated to examine differences between these groups on the characteristics of interest. With the exception of the age and gender models, all the other models were adjusted for age and gender. Given the complex survey designs, jackknife replicate weights were used to adjust standard errors. All analyses were conducted with Stata 10 (StataCorp 2007, Stata Statistical Software: Release 10; College Station, TX: StataCorp LP).
Results
Prevalence of psychological distress
Table 1 shows the prevalence of low, moderate and high psychological distress in university and VET students, tertiary students combined and non-students for each of the surveys. As can be seen from the table, in the HILDA survey, the distribution of the distress categories between tertiary students and non-students was significantly different (p < 0.01). Post-estimation comparisons showed that, while tertiary students had a significantly higher prevalence of moderate distress than non-students (27.1% vs 21.2%, p < 0.05), the prevalence of high distress was similar between the groups (18.6% vs 16.2%, p > 0.05). University students had a marginally higher prevalence of moderate distress than non-students (28.8%, p = 0.06), and a higher, non-significant prevalence of moderate distress than VET students (24.8%, p > 0.05). The prevalence of high distress was similar between university students, VET students and non-students (17.4%, 20.2% and 16.2%, respectively, p > 0.05).
The prevalence of low, moderate and high psychological distress for university and VET students, tertiary students combined and non-students (18–59 years of age): 2007 HILDA, 2007–08 NHS and the 2007 NSMHWB.
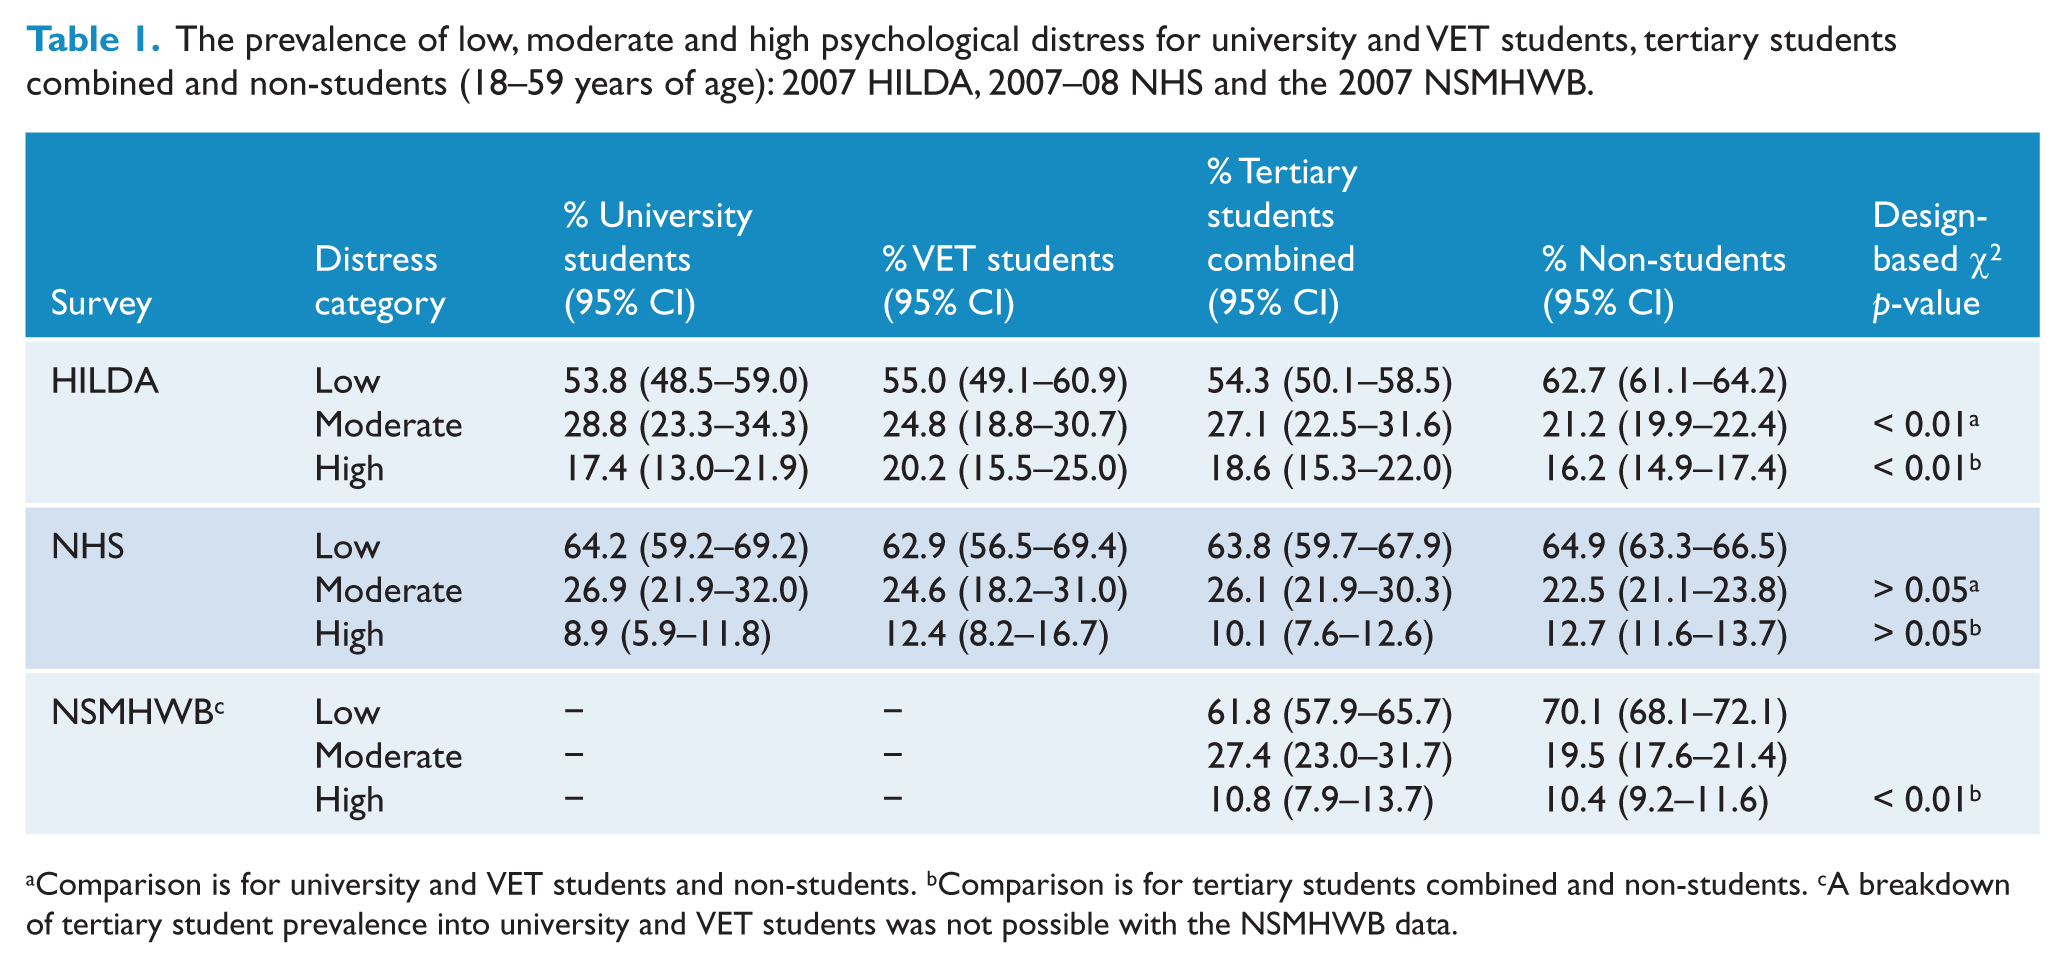
Comparison is for university and VET students and non-students. bComparison is for tertiary students combined and non-students. cA breakdown of tertiary student prevalence into university and VET students was not possible with the NSMHWB data.
The distribution of the distress categories between tertiary students and non-students was also significantly different in the NSMHWB (p < 0.01). Similar to the results in the HILDA survey, while students had a significantly higher prevalence of moderate distress (27.4% vs 19.5%, p < 0.05), the prevalence of high distress was similar between the groups (10.8% vs 10.4%, p > 0.05).
In the NHS, the distribution of the distress categories between tertiary students and non-students was similar (p > 0.05). Tertiary students had a higher, non-significant prevalence of moderate distress and a lower, non-significant prevalence of high distress than non-students (26.1% vs 22.5%, p > 0.05; and 10.1% vs 12.7%, p > 0.05, respectively). There were no significant differences between university students, VET students and non-students in moderate distress (26.9%, 24.6% and 22.5%, p > 0.05, respectively). The prevalence of high distress was also similar between university students, VET students and non-students (8.9%, 12.4% and 12.7%, p > 0.05, respectively).
Age and gender standardized prevalence rates showed that the overall distribution of the distress categories between tertiary students combined and non-students remained significantly different in the HILDA survey (p < 0.01) and the NSMHWB (p < 0.01), and non-significant in the NHS (p > 0.05). However, the higher prevalence of moderate distress in tertiary students was attenuated in the HILDA survey and the NSMHWB (24.7% vs 21.6%, p > 0.05; and 24.3% vs 19.6%, p > 0.05, respectively). (A table of results is available from the first author.)
Table 2 shows the distributions of the distress categories for tertiary students and non-students by age and gender. University and VET students were combined in these prevalence estimates because of the relatively small number of cases. As can be seen from Table 2, the distributions of the distress categories by age between students and non-students were significantly different in the HILDA survey and the NSMHWB (p < 0.05), but were similar in the NHS (p > 0.05). There were no significant differences in moderate and high distress between students and non-students by age group in any of the surveys.
The prevalence of low, moderate and high psychological distress by age and gender for tertiary students combined and non-students (18–59 years of age): 2007 HILDA, 2007–08 NHS and the 2007 NSMHWB.
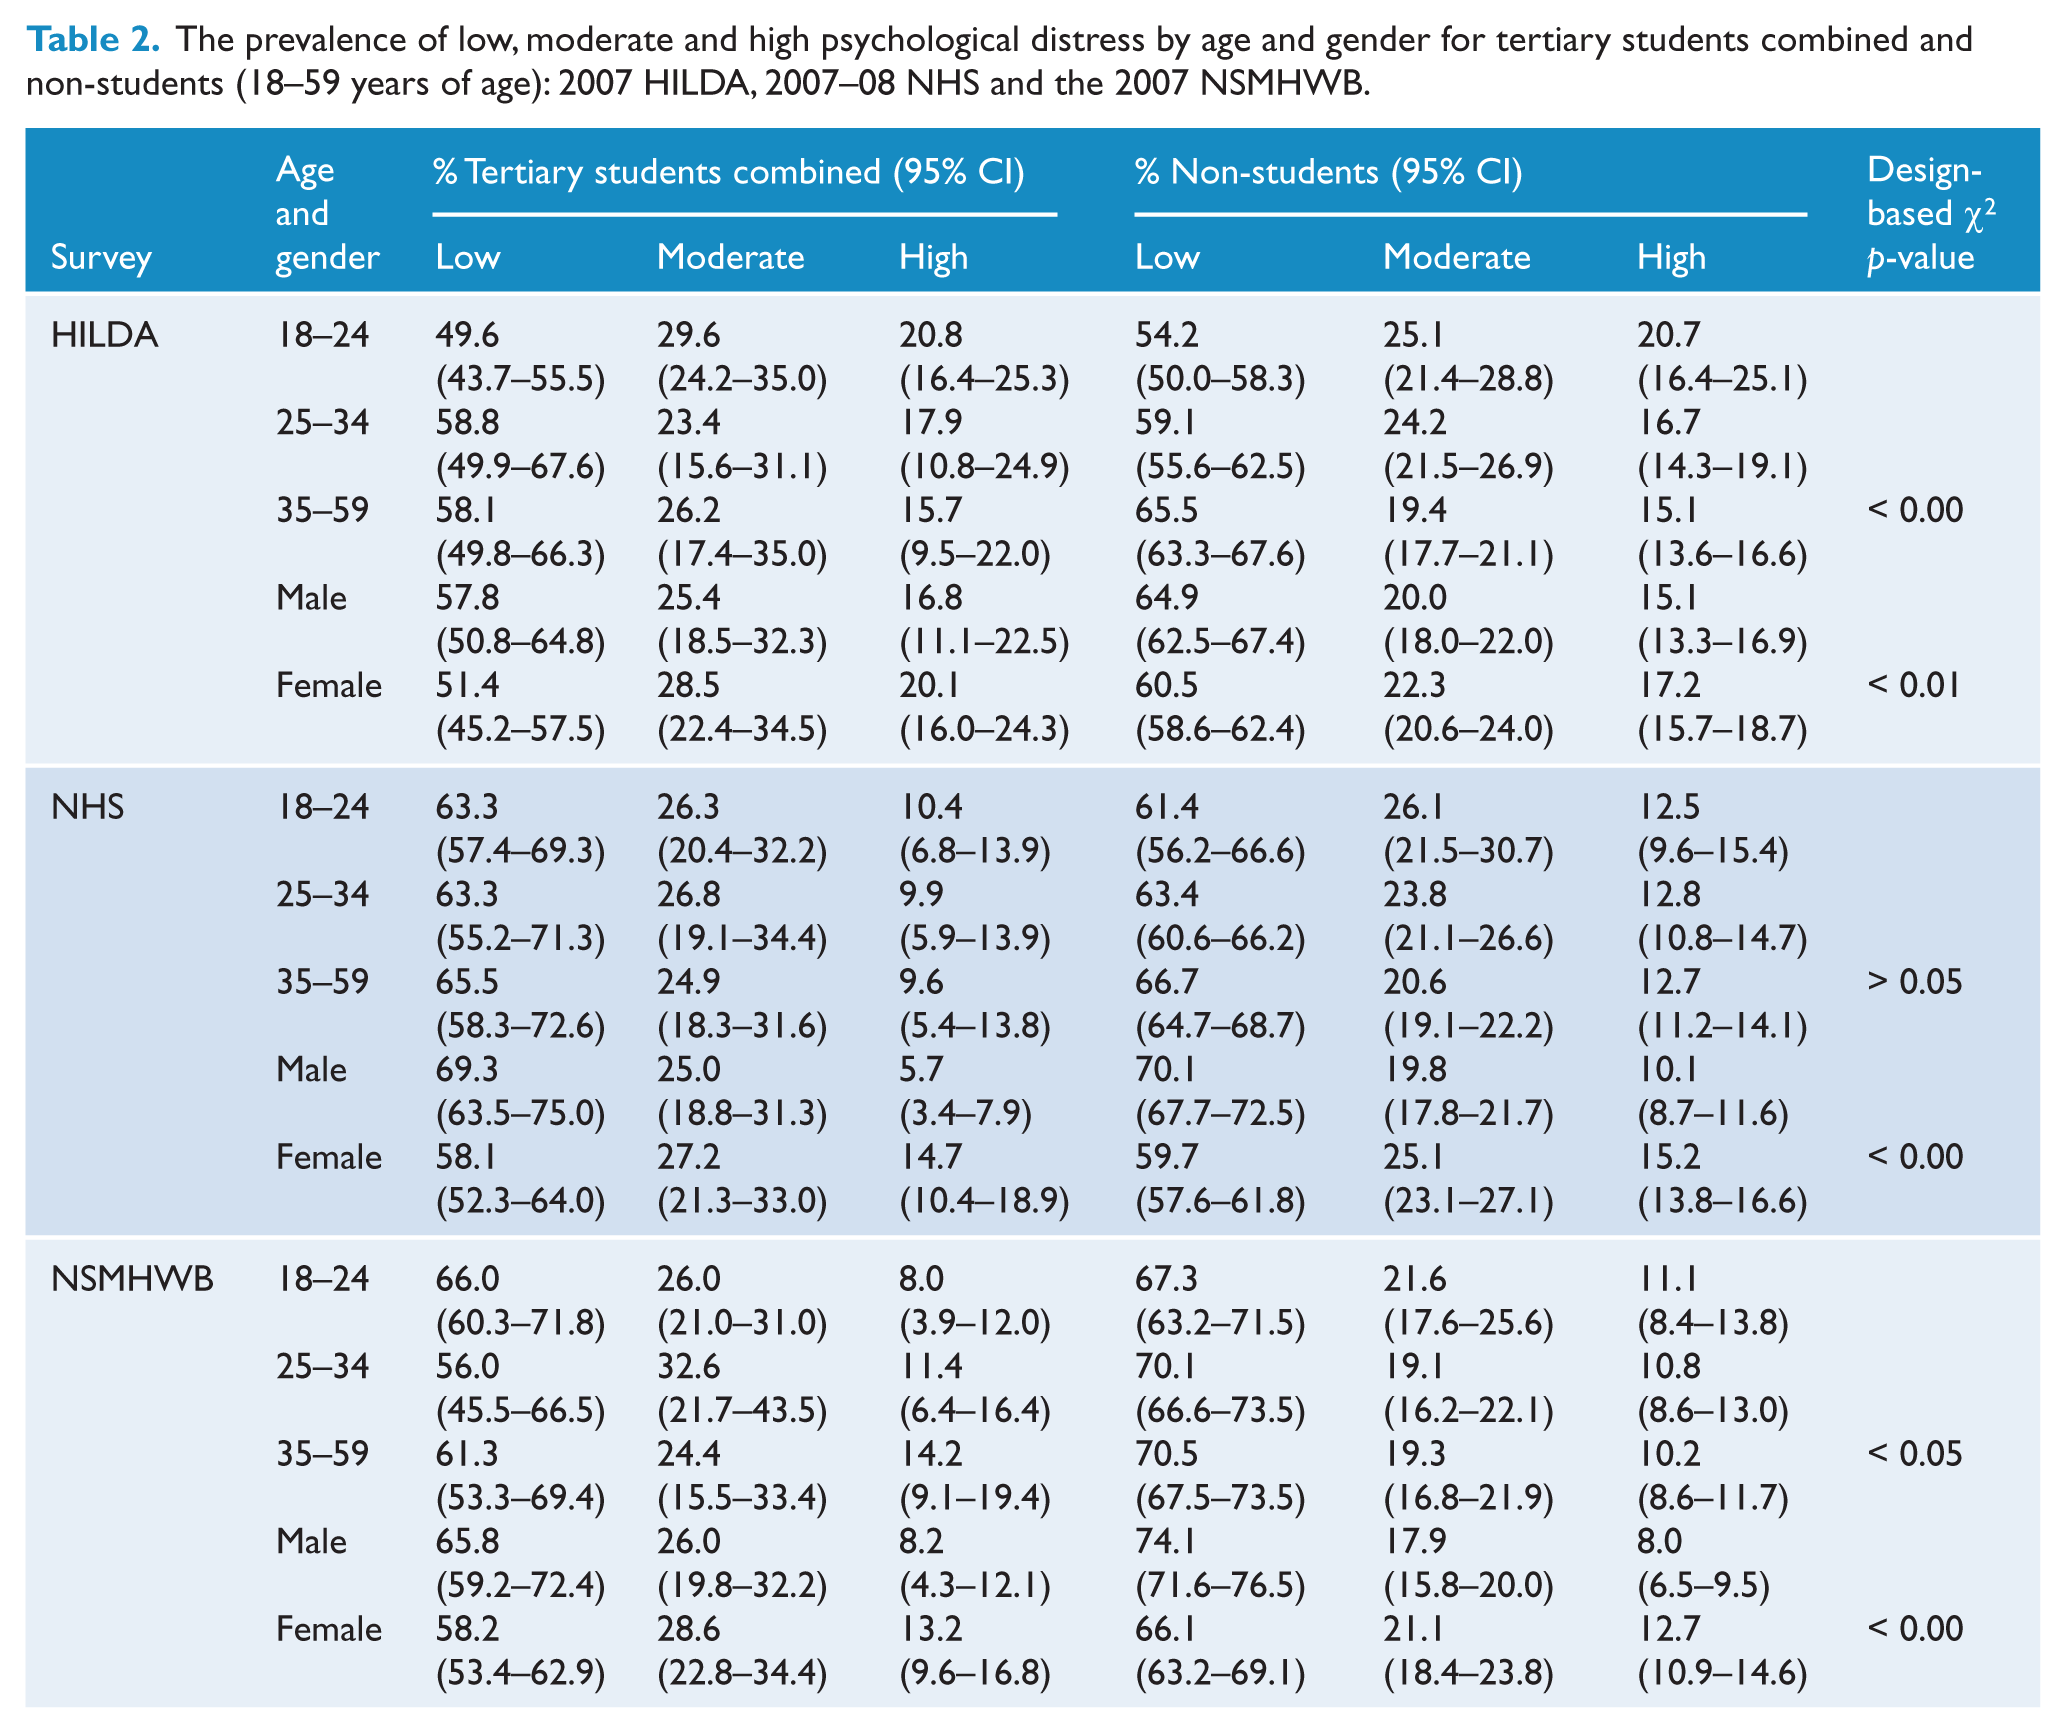
Table 2 also shows that the distribution of the distress categories between male and female students and non- students was significantly different in all three surveys. While male non-students and female students had a greater prevalence of high distress than male tertiary students in the NHS (10.1% vs 5.7%, p < 0.05; and 14.7% vs 5.7%, p < 0.01, respectively), there were no significant gender differences in moderate distress. There were no significant gender differences in moderate and high distress between students and non-students in the other two surveys.
Socio-demographic and economic correlates of psychological distress
Table 3 shows the characteristics of university and VET students and their non-student peers that were examined in the HILDA survey. With the exception of gender, the distributions of all other characteristics were significantly different between university students, VET students and non-students.
Socio-demographic and economic characteristics of university and VET students, tertiary students combined and non-students (18–59 years of age): 2007 HILDA.
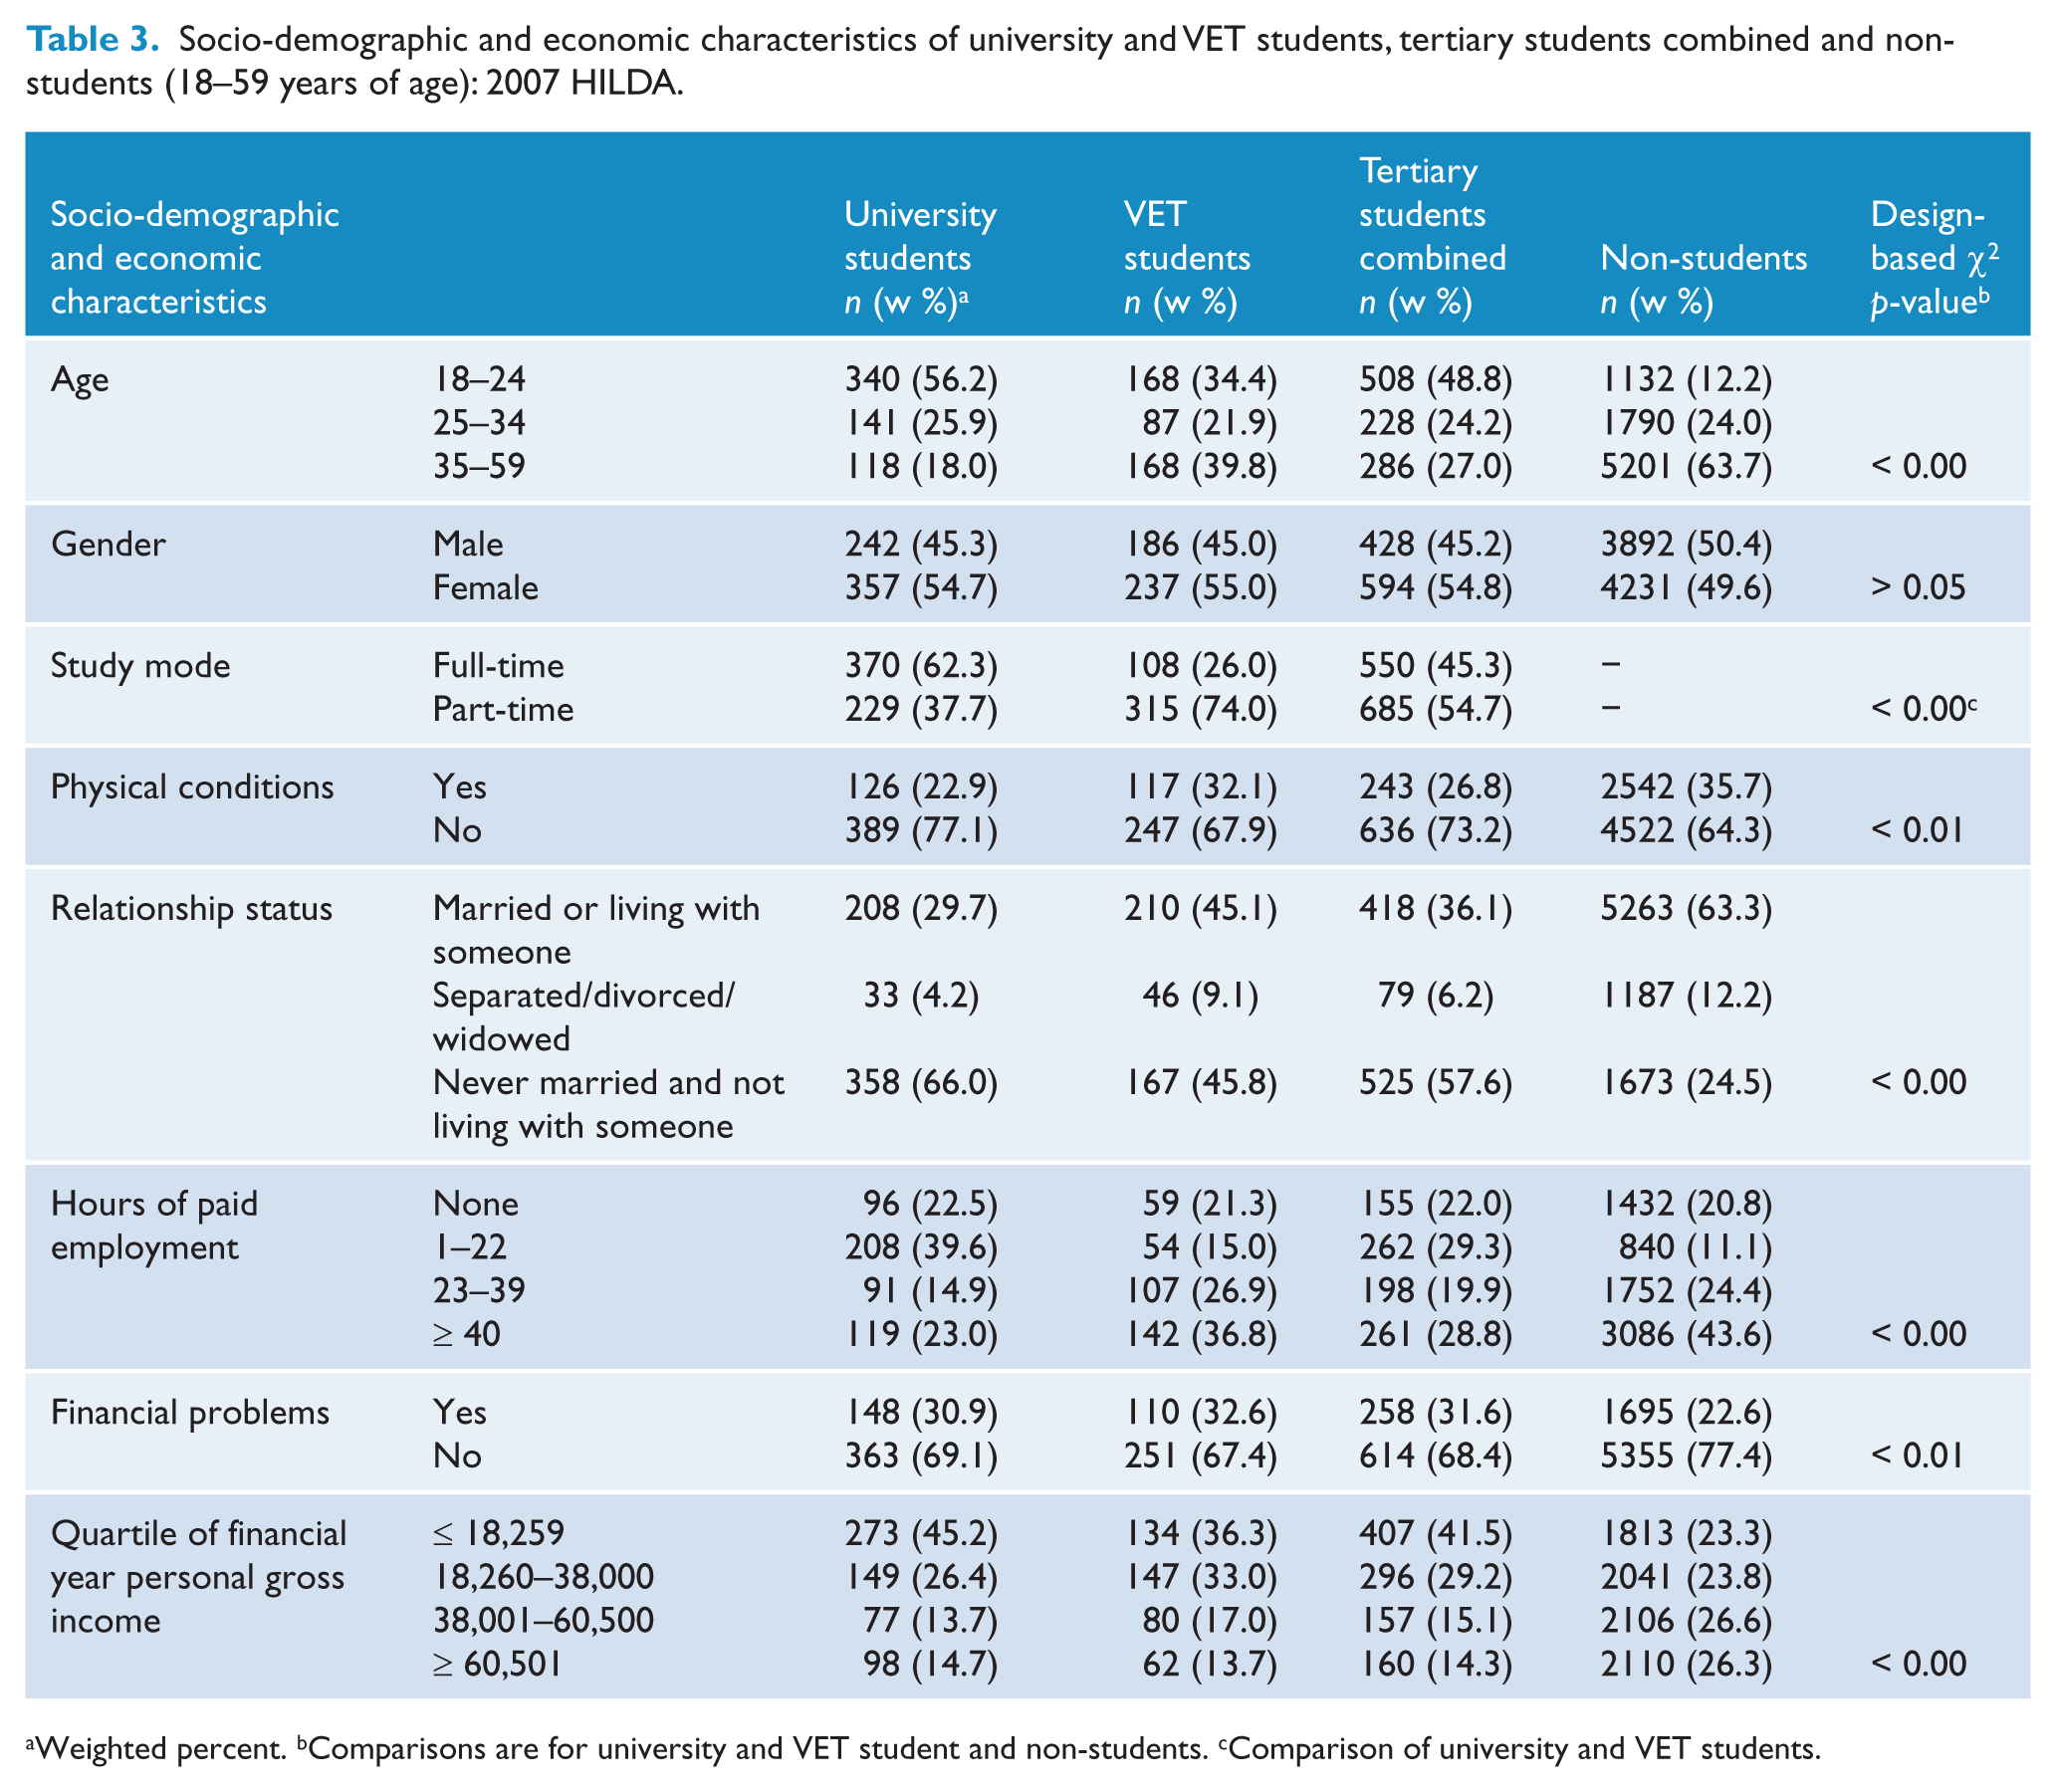
Weighted percent. bComparisons are for university and VET student and non-students. cComparison of university and VET students.
Multinomial regression results for non-students
Table 4 shows the results of the multinomial logistic regression analyses. As can be seen from the table, in non-students moderate distress was associated with younger age, not being married, financial problems and low income, while high distress was associated with younger age, female gender, physical conditions, not being married, not working, financial problems and lower income.
Univariate multinomial logistic regression models examining the factors associated with moderate and high relative to low psychological distress in university and VET students, tertiary students combined and non-students (18–59 years of age): 2007 HILDA. a
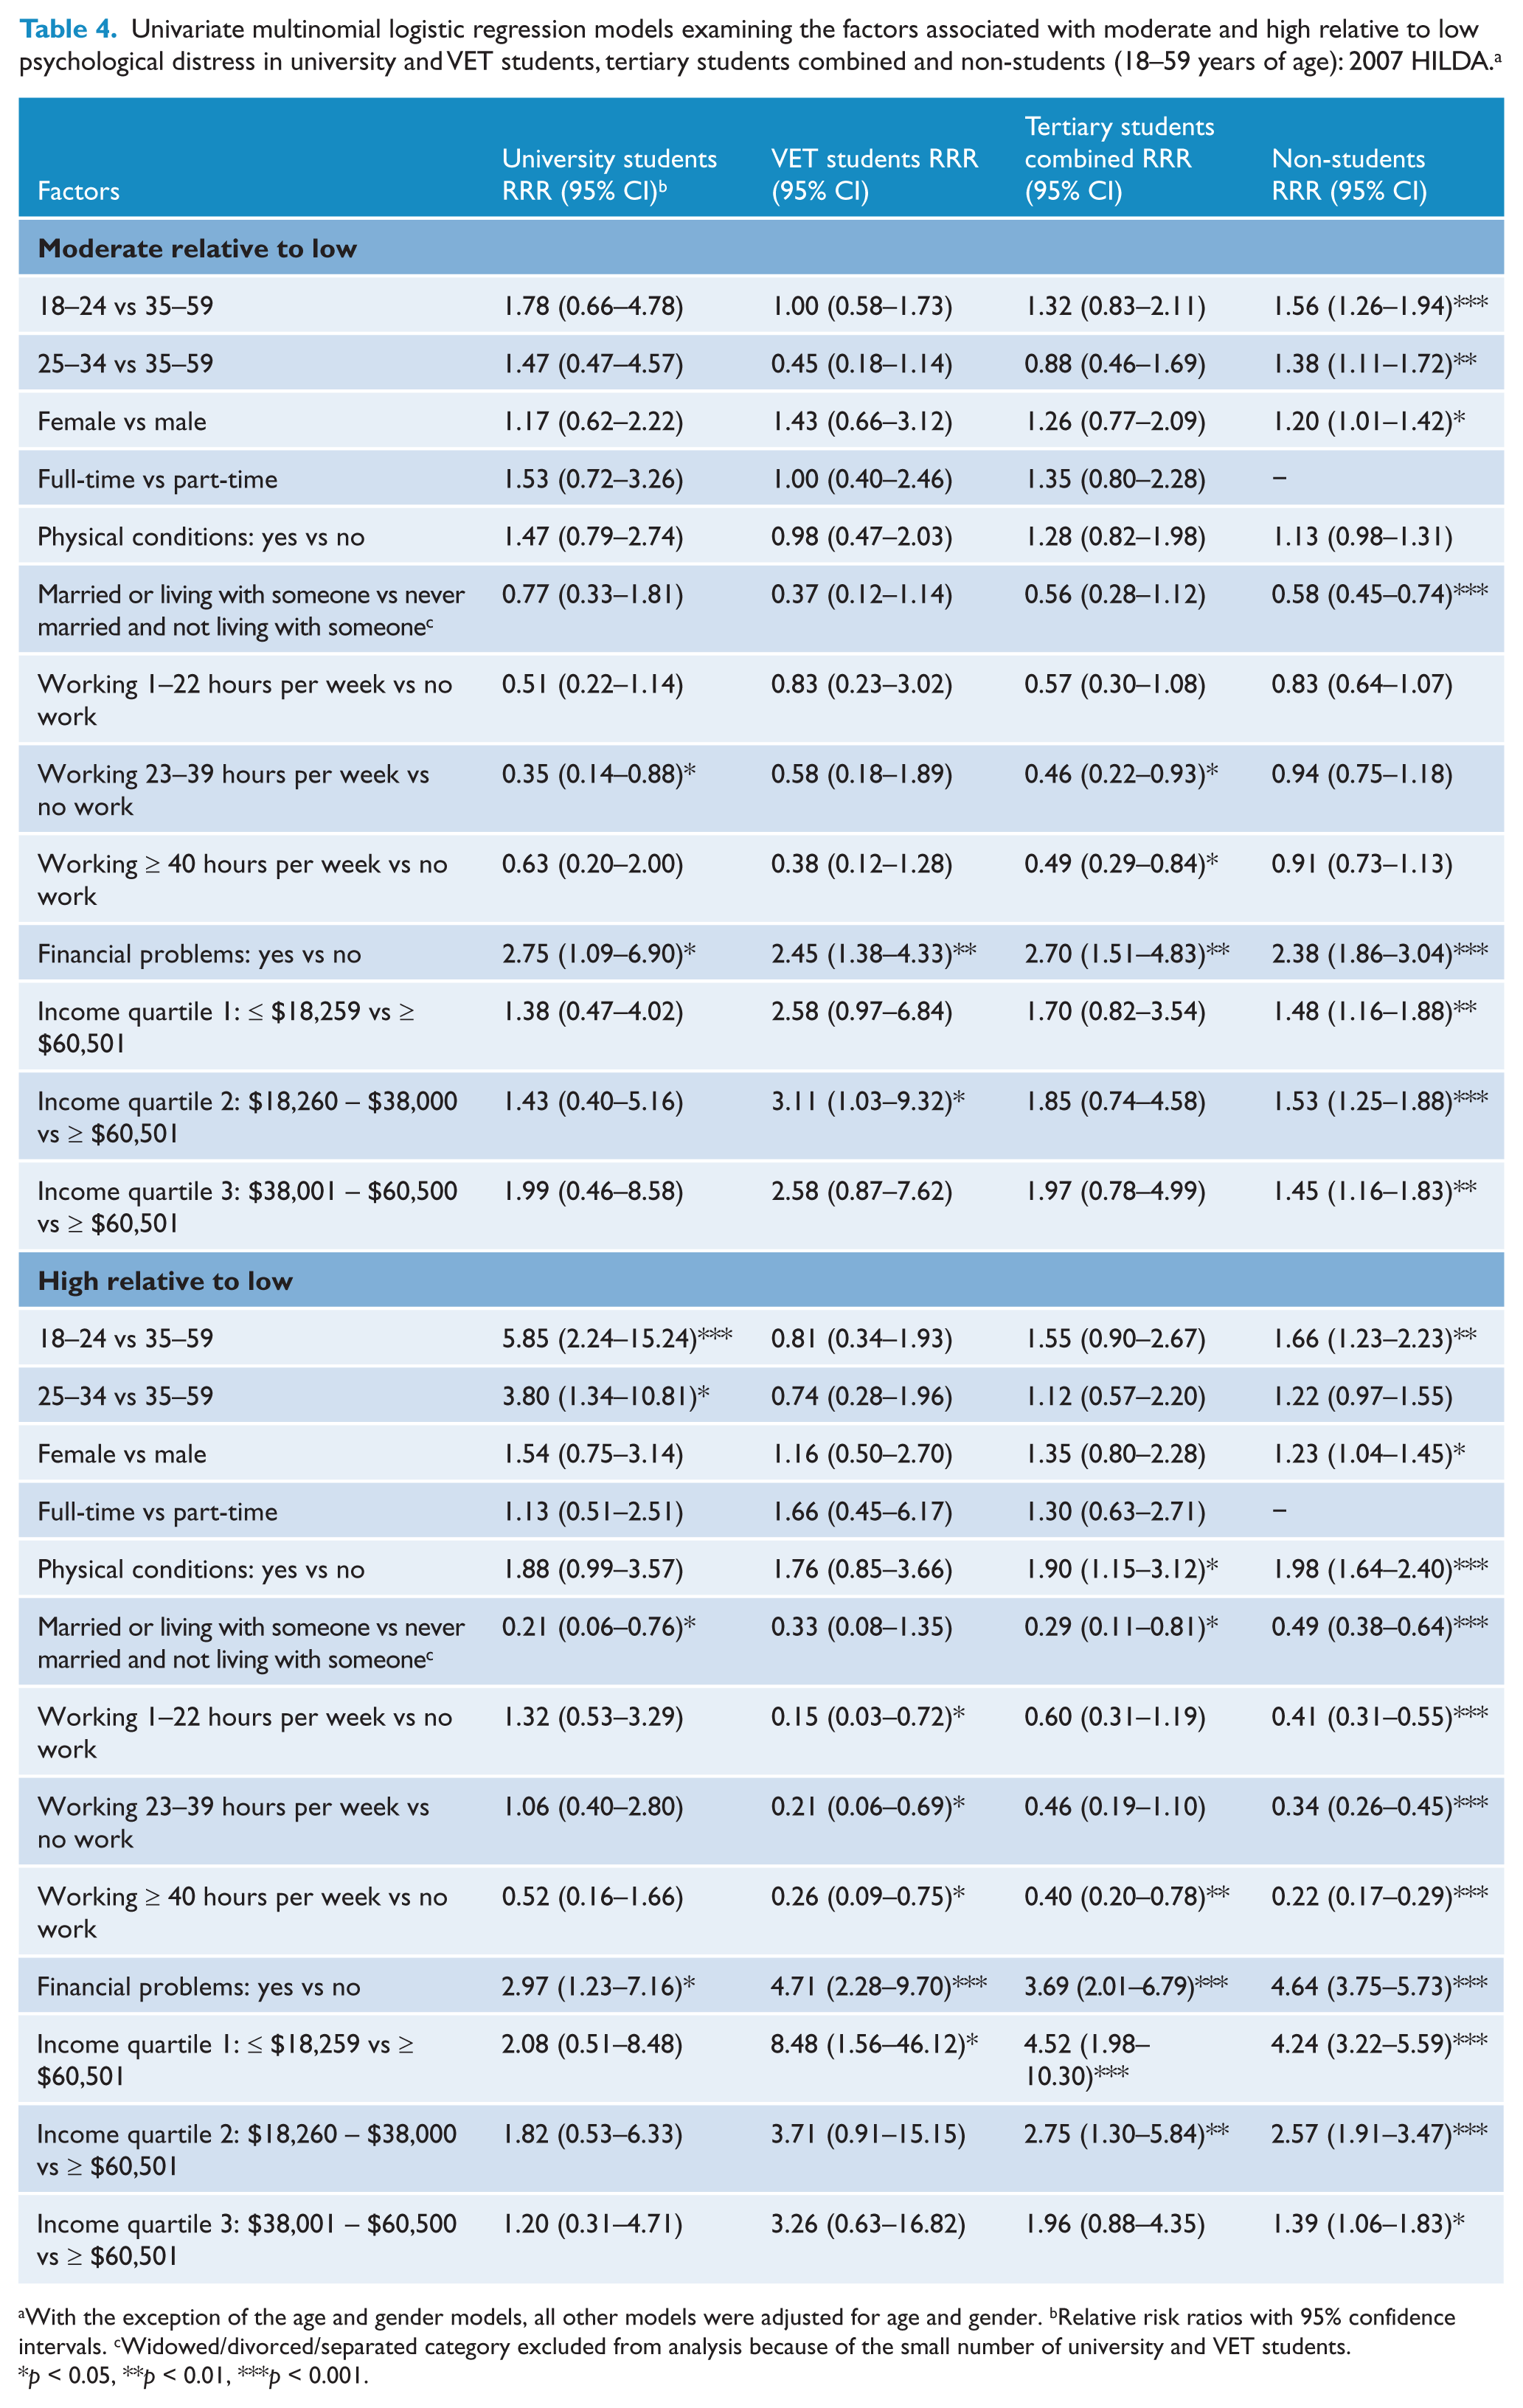
With the exception of the age and gender models, all other models were adjusted for age and gender. bRelative risk ratios with 95% confidence intervals. cWidowed/divorced/separated category excluded from analysis because of the small number of university and VET students.
p < 0.05, **p < 0.01, ***p < 0.001.
Multinomial regression results for students
Table 4 also shows that 18–24 and 25–34-year-old university students had a greater risk of high distress than those aged 35–59. Models with study status (university or VET students, or non-students) included as an interaction term, which examined whether there were any significant differences in the relative risk of psychological distress between the groups, showed that university students in these age categories also had a significantly greater risk of high distress than VET students (RRR = 7.20, 95% CI = 1.81–28.64, p < 0.01; and RRR = 5.15, 95% CI = 1.03–23.52, p < 0.05, respectively) and non-students (RRR = 3.53, 95% CI = 1.28–9.76, p < 0.05; and RRR = 3.10, 95% CI = 1.04–9.30, p < 0.05, respectively); results not shown in a table. Tertiary students with physical conditions also had a greater risk of high distress than those without physical conditions. However, university students and tertiary students combined who were married or living with someone in a domestic relationship had a reduced risk of high distress.
In relation to financial factors, university and VET students with financial problems, like non-students, had a significantly greater risk of moderate and high distress. VET students with incomes ≤ $18,259 had a greater risk of high distress, and those with incomes from $18,260 to $38,000 had a higher risk of moderate distress than those with incomes ≥ $60,501. There were no statistically significant differences in the relative risk of moderate or high distress by income category for university students.
The examination of hours worked in paid employment revealed that VET students who engaged in any paid employment, similar to non-students, had a lower risk of high distress. Furthermore, university students and tertiary students combined who worked 23–39 hours per week and tertiary students who worked ≥ 40 hours per week had a lower risk of moderate distress than those who did not work.
To examine if there were any differences in the relative risk of moderate and high distress by the hours worked in paid employment between the groups, models that included study status as an interaction term were also estimated. The results revealed that, compared to those who did not work, university students who worked 1–22 or 23–39 hours of paid employment per week had a significantly greater risk of high distress relative to VET students (RRR = 8.62, 95% CI = 1.34–55.60, p < 0.05; and RRR = 5.07, 95% CI = 1.19–21.58, p < 0.05, respectively) and non-students (RRR = 3.22, 95% CI = 1.20–8.65, p < 0.05; and RRR = 3.10, 95% CI = 1.15–8.38, p < 0.05, respectively); results not shown in a table.
To account for the possibility that the greater risk of high distress in university students who worked 1–22 or 23–39 hours of paid employment per week relative to VET students may have been the result of the larger proportion of university students who were studying full-time (62.3% vs 26.0%, see Table 3), an additional model was estimated adjusting for full-time or part-time study. The results showed that, while the greater risk of high distress in university students who worked 23–39 hours per week relative to VET students was attenuated and no longer statistically significant (RRR = 4.54, p > 0.05), university students who worked 1–22 hours of paid employment still had a significantly greater risk of high distress relative to VET students (RRR = 8.89, 95% CI = 1.40–56.32, p < 0.05; results not shown in a table).
Discussion
The aims of this study were to estimate the prevalence of moderate and high psychological distress in university students, VET students, tertiary students combined and non-students using three national household surveys, and to examine any differences in the characteristics associated with these distress levels between students and non-students using the HILDA survey. The study showed that the prevalence of moderate distress was significantly higher in tertiary students than non-students in the HILDA survey (27.7% vs 21.2%), which was largely driven by university students, and the NSMHWB (27.4% vs 19.5%). Age and gender standardization of the prevalence rates revealed that the moderate distress differences between students and non-students were attenuated in the HILDA survey (24.7% vs 21.6%) and the NSMHWB (24.3% vs 19.6%), but the overall distributions of the distress levels remained significantly different between students and non-students. The higher prevalence of moderate distress in students may be due to the pressures of study commitments, a factor that impacts on tertiary students but not their non-student peers. However, none of the surveys showed any significant difference in the prevalence of high psychological distress between tertiary students and non-students. The prevalence of high distress (K10 scores: 22–50) in university students was 17.4% in the HILDA survey and 8.9% in the NHS. This is in contrast to the two recent Australian studies that reported a significantly greater prevalence of psychological distress in university students, with rates for high distress (K10 scores: 22–50) of 48% (Leahy et al., 2010) and very high distress (K10 scores: 30–50) of 19% (Stallman, 2010).
The large discrepancy in prevalence estimates between the current study and the previous Australian studies is difficult to explain, but is most likely due to methodological differences. These studies sampled students from one or two universities and used either web-based (Stallman, 2010) or paper and web-based questionnaires (Leahy et al., 2010) that were self-completed by students, while the prevalence estimates of distress in their population peers were taken from household surveys that used face-to-face interviews. In addition, one of the studies (Stallman, 2010) had very low response rates (12.2% at one university and 4.6% at the other), meaning that there may have been response bias. It has been shown that correcting for response bias in web-based surveys of university students is important because not doing so can lead to an overestimation of the prevalence of depression and anxiety disorders (Eisenberg et al., 2007). To gain a better understanding of these differences, research is required on the effect of different survey methodologies on prevalence estimates derived from screening instruments such as the K10.
In relation to the correlates of moderate and high psychological distress that were examined with the HILDA survey, consistent with other research, 18–24 and 25–34-year-old university students had a greater risk of high distress compared to those aged 35–59 years old. Models with study status included as an interaction term showed that university students in these age categories also had a greater risk of high distress relative to VET students and non-students. This difference might be due to a combination of a stressful transition to independence and the higher pressures of academic study for younger university students compared to VET students and non-students. Furthermore, tertiary students who had physical conditions, similar to their non- student peers, had a greater risk of high distress.
This study found that tertiary students and non-students with financial problems had a significantly greater risk of moderate and high distress. This is a well-established association found in other studies (Andrews and Wilding, 2004; Eisenberg et al., 2007; Roberts et al., 1999; Stallman, 2010). Of particular interest is a longitudinal study conducted in England of university students which found that financial hardship showed an independent relationship with depression when pre-entry anxiety and depression were controlled (Andrews and Wilding, 2004). Research into Australian university student finances (James et al., 2007) has also shown that many students were in a stressful financial situation, which meant that they often had to ask for loans or gifts from others.
There was some evidence of a difference between university and VET students in the association of income with psychological distress. While VET students with low incomes, like their non-student peers, had a greater risk of high distress, there was no significant association between low income and psychological distress in university students. The results for VET students and non-students are consistent with the substantial evidence that relatively low income, an indicator of low socio-economic status, is associated with mental disorders in the wider community (Butterworth et al., 2011; Fryers et al., 2003; Muntaner et al., 2004). However, given the significant association of psychological distress with financial problems, it is somewhat surprising that low personal income was not also associated with psychological distress in university students. This may be the result of income not being accurately reported by university students, especially by those who live in the family home (Verger et al., 2010) with relatively advantaged parents. It has been shown that parental education, occupation and income are better indicators of low socio-economic status in university students (DEEWR, 2009a). The results of the present study suggest that having financial problems is also a reliable risk factor for psychological distress.
This study also found that a large percentage of tertiary students worked some hours per week in paid employment (78%; see also James et al., 2007). Models with study status included as an interaction term also showed that university students who worked 1–22 or 23–39 hours per week, compared to those who did not work, had a significantly greater risk of high distress relative to VET students and non- students. The greater risk of high distress in university students relative to VET students and non-students is perhaps not surprising, given that any work was strongly protective of high distress in these groups. However, the greater risk of high distress in university students who worked 1–22 hours per week relative to VET students, adjusting for part-time or full-time study, might be due to the higher demands of academic study in the context of having limited flexibility to take time off from financially necessary work for study when required. James et al. (2007) have presented evidence that employed university students often miss classes because of work commitments.
Finally, the study found that university students and tertiary students who were married or living with someone in a domestic relationship, similar to their non-student peers, had a lower risk of high distress. This finding is also consistent with other studies (Eisenberg et al., 2007; Stallman, 2010). Factors that may have contributed to this result are the social and emotional support of a partner and the ability to pool financial resources.
Given the current policy focus on increasing the participation rate of tertiary students to address current and projected knowledge and skill shortages, and to improve their educational experience and outcomes, especially for disadvantaged students, it is important that students’ psychological distress is addressed. However, the evidence on which interventions work best is limited (Reavley and Jorm, 2010). For students with high psychological distress, individual-based services are likely to be most appropriate. There is some evidence, however, that tertiary students are reluctant to seek help, with relatively small proportions of students with psychological distress being diagnosed or treated by health professionals (Leahy et al., 2010; Stallman, 2010; Verger et al., 2010). As a result, convincing them to use these services may be challenging. For this reason, it is important that student population approaches, such as tertiary student mental health literacy and mental health promotion campaigns, are also developed and implemented. Furthermore, given the results of this study, it is important that financial problems and appropriate increases to income support are considered, especially as factors in potentially preventing the onset and recurrence of psychological distress in some tertiary students. An appropriate level of income support may lead to a reduction in financial problems and the need to work extended hours in paid employment for students in full-time study. As has been noted in other national contexts, as the university participation rate of students from disadvantaged backgrounds increases, student income and financial problems are likely to become increasingly important issues (Andrews and Wilding, 2004; Eisenberg et al., 2007).
Limitations
This study has some important limitations that should be kept in mind when interpreting the results. First, while the study used a validated screening instrument, psychological distress should not be equated with clinical diagnoses of mental disorder. Furthermore, the current study analysed cross-sectional data, which means that an understanding of causal processes is not possible. Also, this study could not investigate the association of psychological distress with different university and VET courses because of the small number of cases. Finally, it was not possible to investigate how the levels of psychological distress affected students’ ability to study or their academic outcomes.
Conclusion
Using three nationally representative household surveys, this study has shown that there is evidence of a higher prevalence of moderate distress in tertiary students (largely driven by university students) than non-students, although these were attenuated when the prevalence rates were age and gender standardized. However, the prevalence of high psychological distress was similar between tertiary students and non-students in all three surveys. Analysis of the HILDA survey showed that the correlates of moderate and high distress were also similar between tertiary students and non-students. However, younger university students and university students who worked 1–39 hours per week in paid employment had a significantly greater risk of high distress relative to VET students and non-students, for whom any work was strongly protective of high distress. University and VET students with financial problems, like their non-student peers, had a significantly greater risk of moderate and high distress. These findings suggest that financial risk factors are likely to take on more importance as the participation rate of disadvantaged students increases and should raise concerns about the success of policy initiatives aimed at improving the educational experience and outcomes of these tertiary students.
Footnotes
Acknowledgements
This paper used unit record data from the Household, Income and Labour Dynamics in Australia (HILDA) survey, the National Health Survey (NHS) and the National Survey of Mental Health and Wellbeing (NSMHWB). The HILDA project was initiated and is funded by the Australian Government Department of Families, Housing, Community Services and Indigenous Affairs (FaHCSIA) and is managed by the Melbourne Institute of Applied Economic and Social Research (Melbourne Institute). The NHS and the NSMHWB are managed by the Australian Bureau of Statistics (ABS). The findings and views reported in this paper, however, are those of the authors and should not be attributed to FaHCSIA, the Melbourne Institute or the ABS.
Funding
The research was supported by the National Health and Medical Research Council.
Declaration of interest
Orygen Youth Health Research Centre receives support from the Colonial Foundation.