
Abstract
Keywords
Introduction
The prevalence of clinically significant depression, anxiety or psychological distress is disproportionately high in people with non-communicable chronic diseases including diabetes, cardiovascular disease (CVD), cancer, asthma and arthritis (Atlantis et al., 2011a, 2011c; Clarke and Currie, 2009; Gunn et al., 2010; Holden et al., 2010; Moussavi et al., 2007). When comorbid, psychological distress can significantly worsen the health and economic burden of chronic diseases. For instance, psychological distress in people with comorbid chronic diseases is associated with amplification of their somatic symptoms (Katon et al., 2007), low health-related quality of life scores (Atlantis et al., 2011b; Egede, 2007; Gunn et al., 2010; Moussavi et al., 2007), non-adherence to medical treatment or healthy lifestyle advice (DiMatteo et al., 2000), excess CVD mortality (Atlantis et al., 2011a), as well as high health service utilization (Atlantis et al., 2011b; Egede, 2007) and costs (Britt et al., 2008).
Depression was among the leading causes of global burden of disease in 2004, and its public health effect is expected to increase further in the rankings by 2030 according to the World Health Organization (World Health Organization, 2008). However, the reliability, validity and interpretation of the projected global burden of depression are uncertain for several reasons. First, only a small number of the epidemiological studies used to estimate the projected burden of depression had trends data drawn from nationally representative populations (Brhlikova et al., 2011). Second, antidepressant use, which has increased markedly in high-income countries over recent decades (Barbui et al., 1999; Harman et al., 2009; Mant et al., 2004; Meijer et al., 2004; Moore et al., 2009), was not taken into account in these estimations. Antidepressants are typically used to treat depressive and/or anxiety disorders and could affect prevalence estimates of depression during population surveillance. Finally, the increasing burden of chronic diseases, which are frequently comorbid with symptoms of depression and anxiety (Atlantis et al., 2011a, 2011c; Clarke and Currie, 2009; Gunn et al., 2010; Holden et al., 2010; Moussavi et al., 2007), was similarly not taken into account. Global trends data show that mean total serum cholesterol and systolic blood pressure have now stabilized or even decreased, whereas both mean fasting plasma glucose and diabetes prevalence have increased since 1980 (Danaei et al., 2011a,b; Farzadfar et al., 2011). Although these studies suggest that the rising burden of CVD has been mitigated when assessed separately, evidence suggests that the prevalence of multiple comorbid chronic diseases (often termed multi-morbidity) has been increasing considerably during this period (Uijen and van de Lisdonk, 2008). Reliable population-specific epidemiological information is thus needed to estimate recent changes in the burden of common mental disorders associated with comorbid chronic diseases, develop healthcare policy, and evaluate the effectiveness of interventions.
Recent epidemiological evidence based on nationally representative data sources shows that the prevalence of diabetes and high cholesterol increased from 3.9 to 6.0% and 11.4 to 14.1%, whereas the prevalence of high blood pressure and CVD (heart attack, stroke or angina) decreased from 21.3 to 20.1% and 6.2 to 5.3% in the adult Australian population between 1989 and 2005 (Atlantis et al., 2009). There are also indications that the prevalence of depression has increased during this period (Goldney et al., 2010), as has antidepressant prescribing (Mant et al., 2004). Furthermore, population-based studies from other countries have shown an increase in the prevalence of anxiety disorders during the past 15 years (Kosidou et al., 2010; Olfson et al., 2004), and these are often comorbid with depression (Licht et al., 2008). Whether changes in the prevalence of psychological distress and contemporaneous use of antidepressants or anti-anxiety (AD/AA) medications differed according to the presence or absence of comorbid chronic diseases during this period in Australia has yet to be documented.
To address this knowledge gap, we gained access to three of the most recent nationally representative survey data sources to investigate comprehensively 8-year changes in the prevalence of psychological distress and reported use of AD/AA medications associated with comorbid chronic diseases in the adult Australian population from 2001 to 2008.
Methods
Survey design and sampling procedure
Data were obtained from the 2001 (Australian Bureau of Statistics a), 2004–05 (Australian Bureau of Statistics b) and 2007–08 (Australian Bureau of Statistics c) Australian National Health Surveys (NHS) conducted by the Australian Bureau of Statistics every 3 years. Each NHS was conducted using a stratified multistage area sample of private dwellings. Information about health status, use of health services, health-related lifestyle factors, and socio-demographic characteristics of participants were obtained by trained interviewers from usual residents of private dwellings in urban and rural areas of Australia. A private dwelling was predefined as a ‘house, flat, home unit, caravan, garage, tent and any other structure being used as a private place of residence’.
Study populations
The 2001, 2004–05 and 2007–08 NHS achieved overall response rates of 92%, 89% and 91% (fully responding households, after sample loss), respectively. After excluding participants aged less than 25 years, the final crude samples studied consisted of n = 16,290, n = 17,662 and n = 14,407 adults in the 2001, 2004–05 and 2007–08 NHS, respectively.
Outcome measures
Psychopathology status
Current symptoms of psychological distress were measured with the 10-item Kessler Psychological Distress Scale (K10), which was developed to monitor population prevalence and trends in non-specific psychological distress (Kessler et al., 2002). Participants were asked to rate how often, in the past 4 weeks, they felt negative emotions on 10 question items. The K10 has a five-value response option for each question: (1) all of the time, (2) most of the time, (3) some of the time, (4) a little of the time, and (5) none of the time, which are scored in reverse. Thus, summed scores can range from 10 (indicating no distress) to 50 (indicating severe distress). Clinically significant psychological distress was defined using a cut-off point of ≥ 30 for the K10, which has been shown to predict accurately membership in the current anxiety or affective disorders categories linked to the Composite International Diagnostic Interview, and corresponds to increased frequency of mental health service utilization (Andrews and Slade, 2001). The Cronbach’s α coefficient for the K10 in the 2004–05 NHS sample was 0.85 (Atlantis and Ball, 2008).
To determine contemporaneous use of medications for mental health, participants were asked whether they had taken any sleeping tablets or capsules, tablets or capsules for anxiety or nerves (AA), tranquillizers, antidepressants (AD), mood stabilizers or other medications for mental health (using a prompt card) in the last 2 weeks. This information was collected with respect to ‘mental wellbeing’ along with the K10 questions. The broad groups of medications of interest in this study were confined to AD or AA medications.
Chronic diseases
Lifetime diagnosis of diabetes (type 1 and type 2), CVD, cancer, asthma and arthritis was determined by self-report, which included prompt cards with predefined categories. Predefined CVD categories, which were based on the International Classification of Diseases and Related Health Problems, 10th revision (ICD-10), included rheumatic heart disease; heart attack; heart failure (only included in the 2007–08 NHS); stroke (including after-effects of stroke); angina; high blood pressure or hypertension; low blood pressure or hypotension (only included in the 2004–05 and 2007–08 NHS); hardening of the arteries, atherosclerosis or arteriosclerosis; fluid problems, fluid retention or oedema; high cholesterol; rapid or irregular heartbeats, tachycardia or palpitations; heart murmur or heart valve disorder; haemorrhoids; and varicose veins.
Predefined cancer categories included skin cancer (including melanoma, basal cell carcinoma, squamous cell carcinoma); colon/rectum/bowel (colorectal); breast; prostate; lung (including trachea, pleura and bronchus); female reproductive organs (including cervix, uterus, ovary); bladder/kidney; stomach; leukaemia; lymphoma; cancer of unknown primary site; or other (specify). Predefined arthritis categories included osteoarthritis; rheumatoid arthritis; gout; rheumatism; and ‘other type of arthritis’.
Socio-demographic and lifestyle variables
Socio-demographic information regarding sex, age, relationship status, country of birth, usual work hours and workforce status was collected using standard questions. Body mass index (BMI) was derived from self-reported height and weight values, and computed as weight in kilograms divided by height in meters squared. Standard international cut-off points were used to define underweight (BMI < 18.5 kg/m2), healthy weight (BMI 18.5–24.9 kg/m2), overweight (BMI 25 to 29.9 kg/m2) and obesity (BMI ≥ 30 kg/m2). Leisure-time physical activity data were derived from self-reported duration and intensity of physical exercise (including walking) for recreation, sport or health/fitness during the past 2 weeks, at the time of the interview. Total time spent in leisure-time physical activity was multiplied by intensity weights (3.3 for walking, 4.0 for moderate and 8.0 for vigorous intensity exercise) to compute metabolic equivalent-minutes per week (MET-mins/wk). A leisure-time physical activity score of ≥ 540 for MET-mins/wk is equivalent to 135 minutes or more per week of at least moderate-intensity physical activity.
Participants were asked, ‘How many serving of fruit do you usually eat each day?’ (including fresh, frozen and tinned fruit), to assess daily fruit intake. Participants were asked, ‘How many servings of vegetables do you usually eat each day?’ (including fresh, frozen and tinned vegetables), to assess daily vegetable intake. A serving of fruit was ‘one medium piece or two small pieces of fruit, or one cup of diced fruit, or one quarter cup of sultanas or four dried apricot halves – about 150 g of fresh fruit or 50 g of dried fruits.’ A serving of vegetables was ‘half a cup of cooked vegetables or one cup of salad vegetables – about equivalent to 75 g’. All types of vegetables were included except legumes and tomatoes, in contrast were counted as a fruit. Interviewers used picture prompt cards as well as additional probing questions to help participants in accurately reporting the number of servings usually consumed per day. In the Australian National Nutrition Survey, these short dietary questions were shown to have good consistency across population subgroups for adequately discriminating between the different number of fruit and vegetable servings consumed (1 serve or less, 2 to 3 serves, and 4 serves or more) assessed against the 24-hour recall method (Coles-Rutishauser et al., 2001).
Information about past week alcohol consumption was recorded against 10 general categories of alcoholic drinks, with further categorization according to light, medium or full strength for beer, and white, red or low alcohol for wine. Quantities were recorded in terms of standard measures where possible; otherwise interviewers recorded a description of the quantity consumed. Computer-assisted coding systems were used to calculate in millilitres the amount of pure alcohol contained in the drinks reported. This system, which has been used since the 2001 NHS, took information about the type of alcoholic drinks consumed (including brand name for common drinks), and the size and number of drinks consumed, and applied a conversion factor to obtain the amount of pure alcohol consumed. Past week alcohol consumption of ≥ 140 mL is equivalent to consuming 1.6 standard Australian drinks each day. Participants were asked questions about current and historical smoking behaviours to assess smoking status.
Statistical analyses
Statistical analyses were completed using SPSS version 17.0 (SPSS Inc., Chicago, IL). All data were age within sex standardized to the Australian population distributions according to the 2001 Census of Population and Housing. Changes over time in the standardized prevalence of psychological distress and use of AD/AA medications (outcome variables) and associations with socio-demographic, lifestyle and chronic disease predictors were assessed using logistic regression models, with effect estimates expressed as odds ratios (OR) with 95% confidence intervals (CIs). All models were fitted with survey year as a categorical variable and included tests for interaction between each predictor and survey year, to determine whether associations differed across surveys (Tables 1 to 3). Associations of psychological distress and use of AD/AA medications with chronic disease variables were also assessed independently of survey year by removing the interaction term from the logistic regression models (Model 1 in Tables 2 and 3). These models were further adjusted for sets of covariates to explore the extent to which socio-demographic and lifestyle predictors partially explained these associations (Models 2 and 3 in Tables 2 and 3), which included any significant interactions with survey year previously detected (Table 1). Finally, the independent effects of each chronic disease predictor were assessed in a full multivariate adjustment model (Model 4 in Tables 2 and 3). To estimate how much of the associations of psychological distress and use of AD/AA medications with chronic diseases were explained by socio-demographic and lifestyle predictors, the percentage change in the effect estimate after adjustment for these covariates was computed as: 100*(log OR Model [without covariate] – log OR Model [with covariate])/log OR Model [without covariate]. Statistical tests were two-sided, and significance was set at p < 0.05.
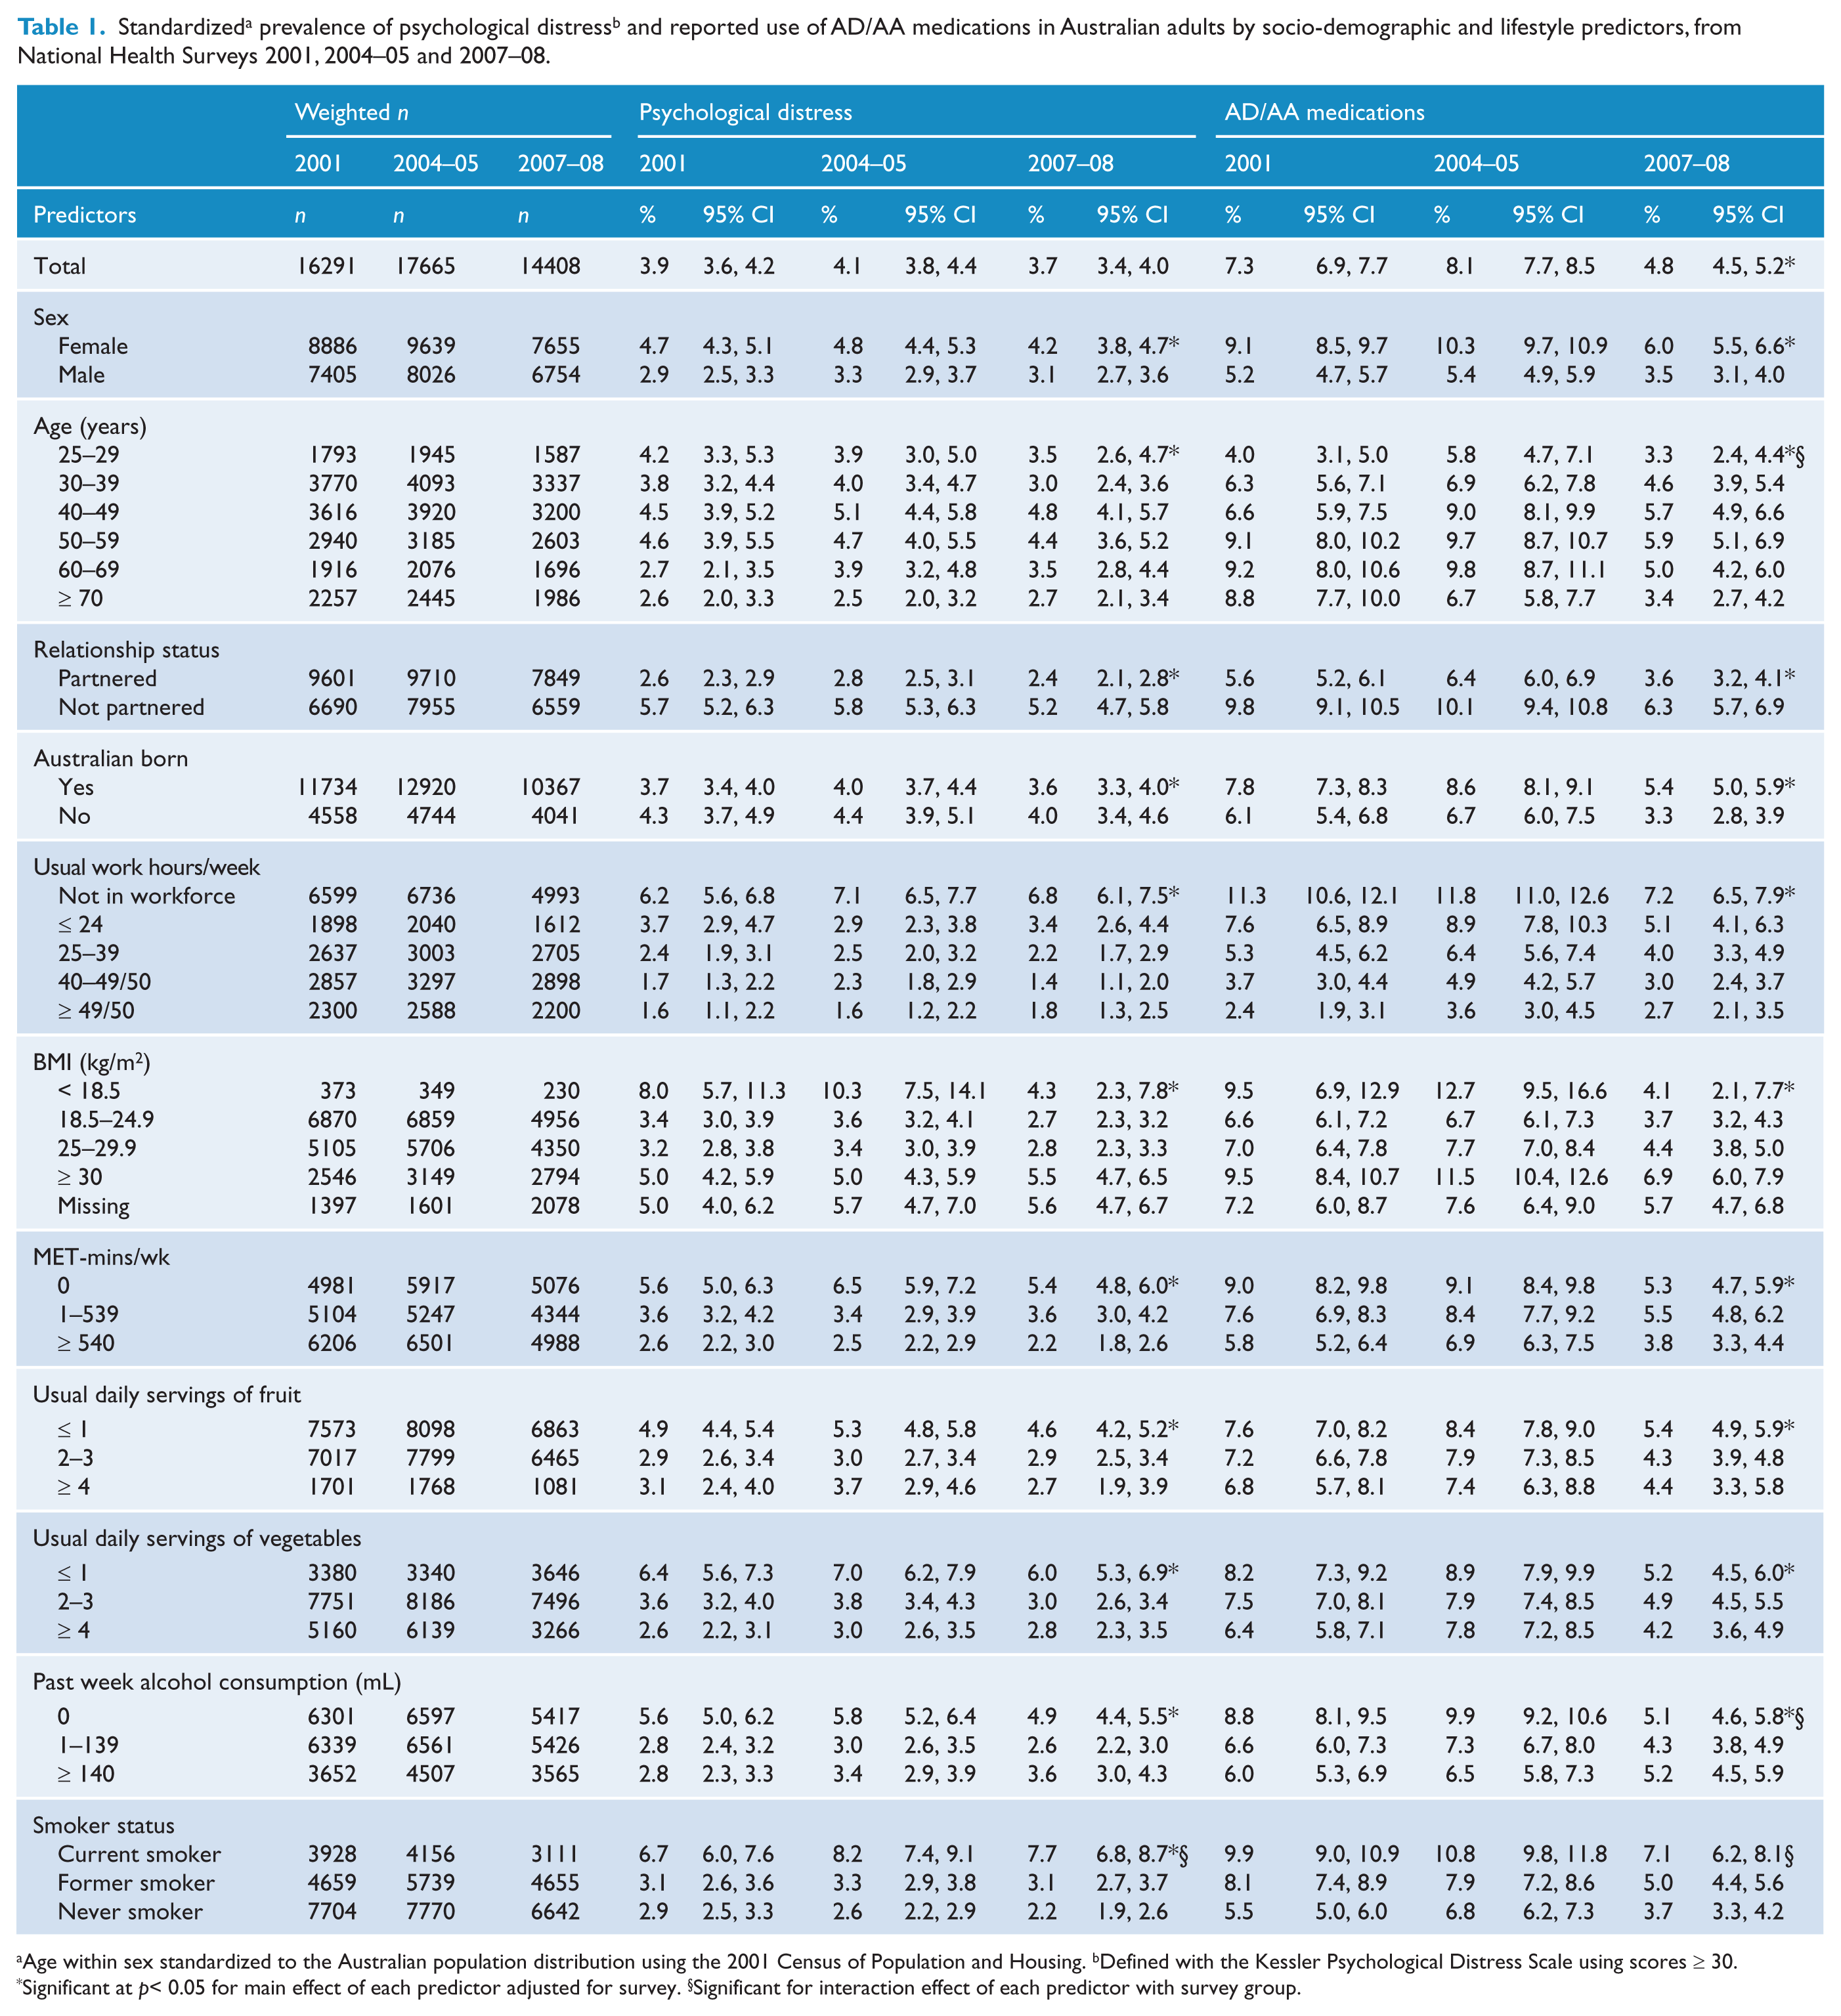
Age within sex standardized to the Australian population distribution using the 2001 Census of Population and Housing. bDefined with the Kessler Psychological Distress Scale using scores ≥ 30.
Significant at p < 0.05 for main effect of each predictor adjusted for survey. § Significant for interaction effect of each predictor with survey group.
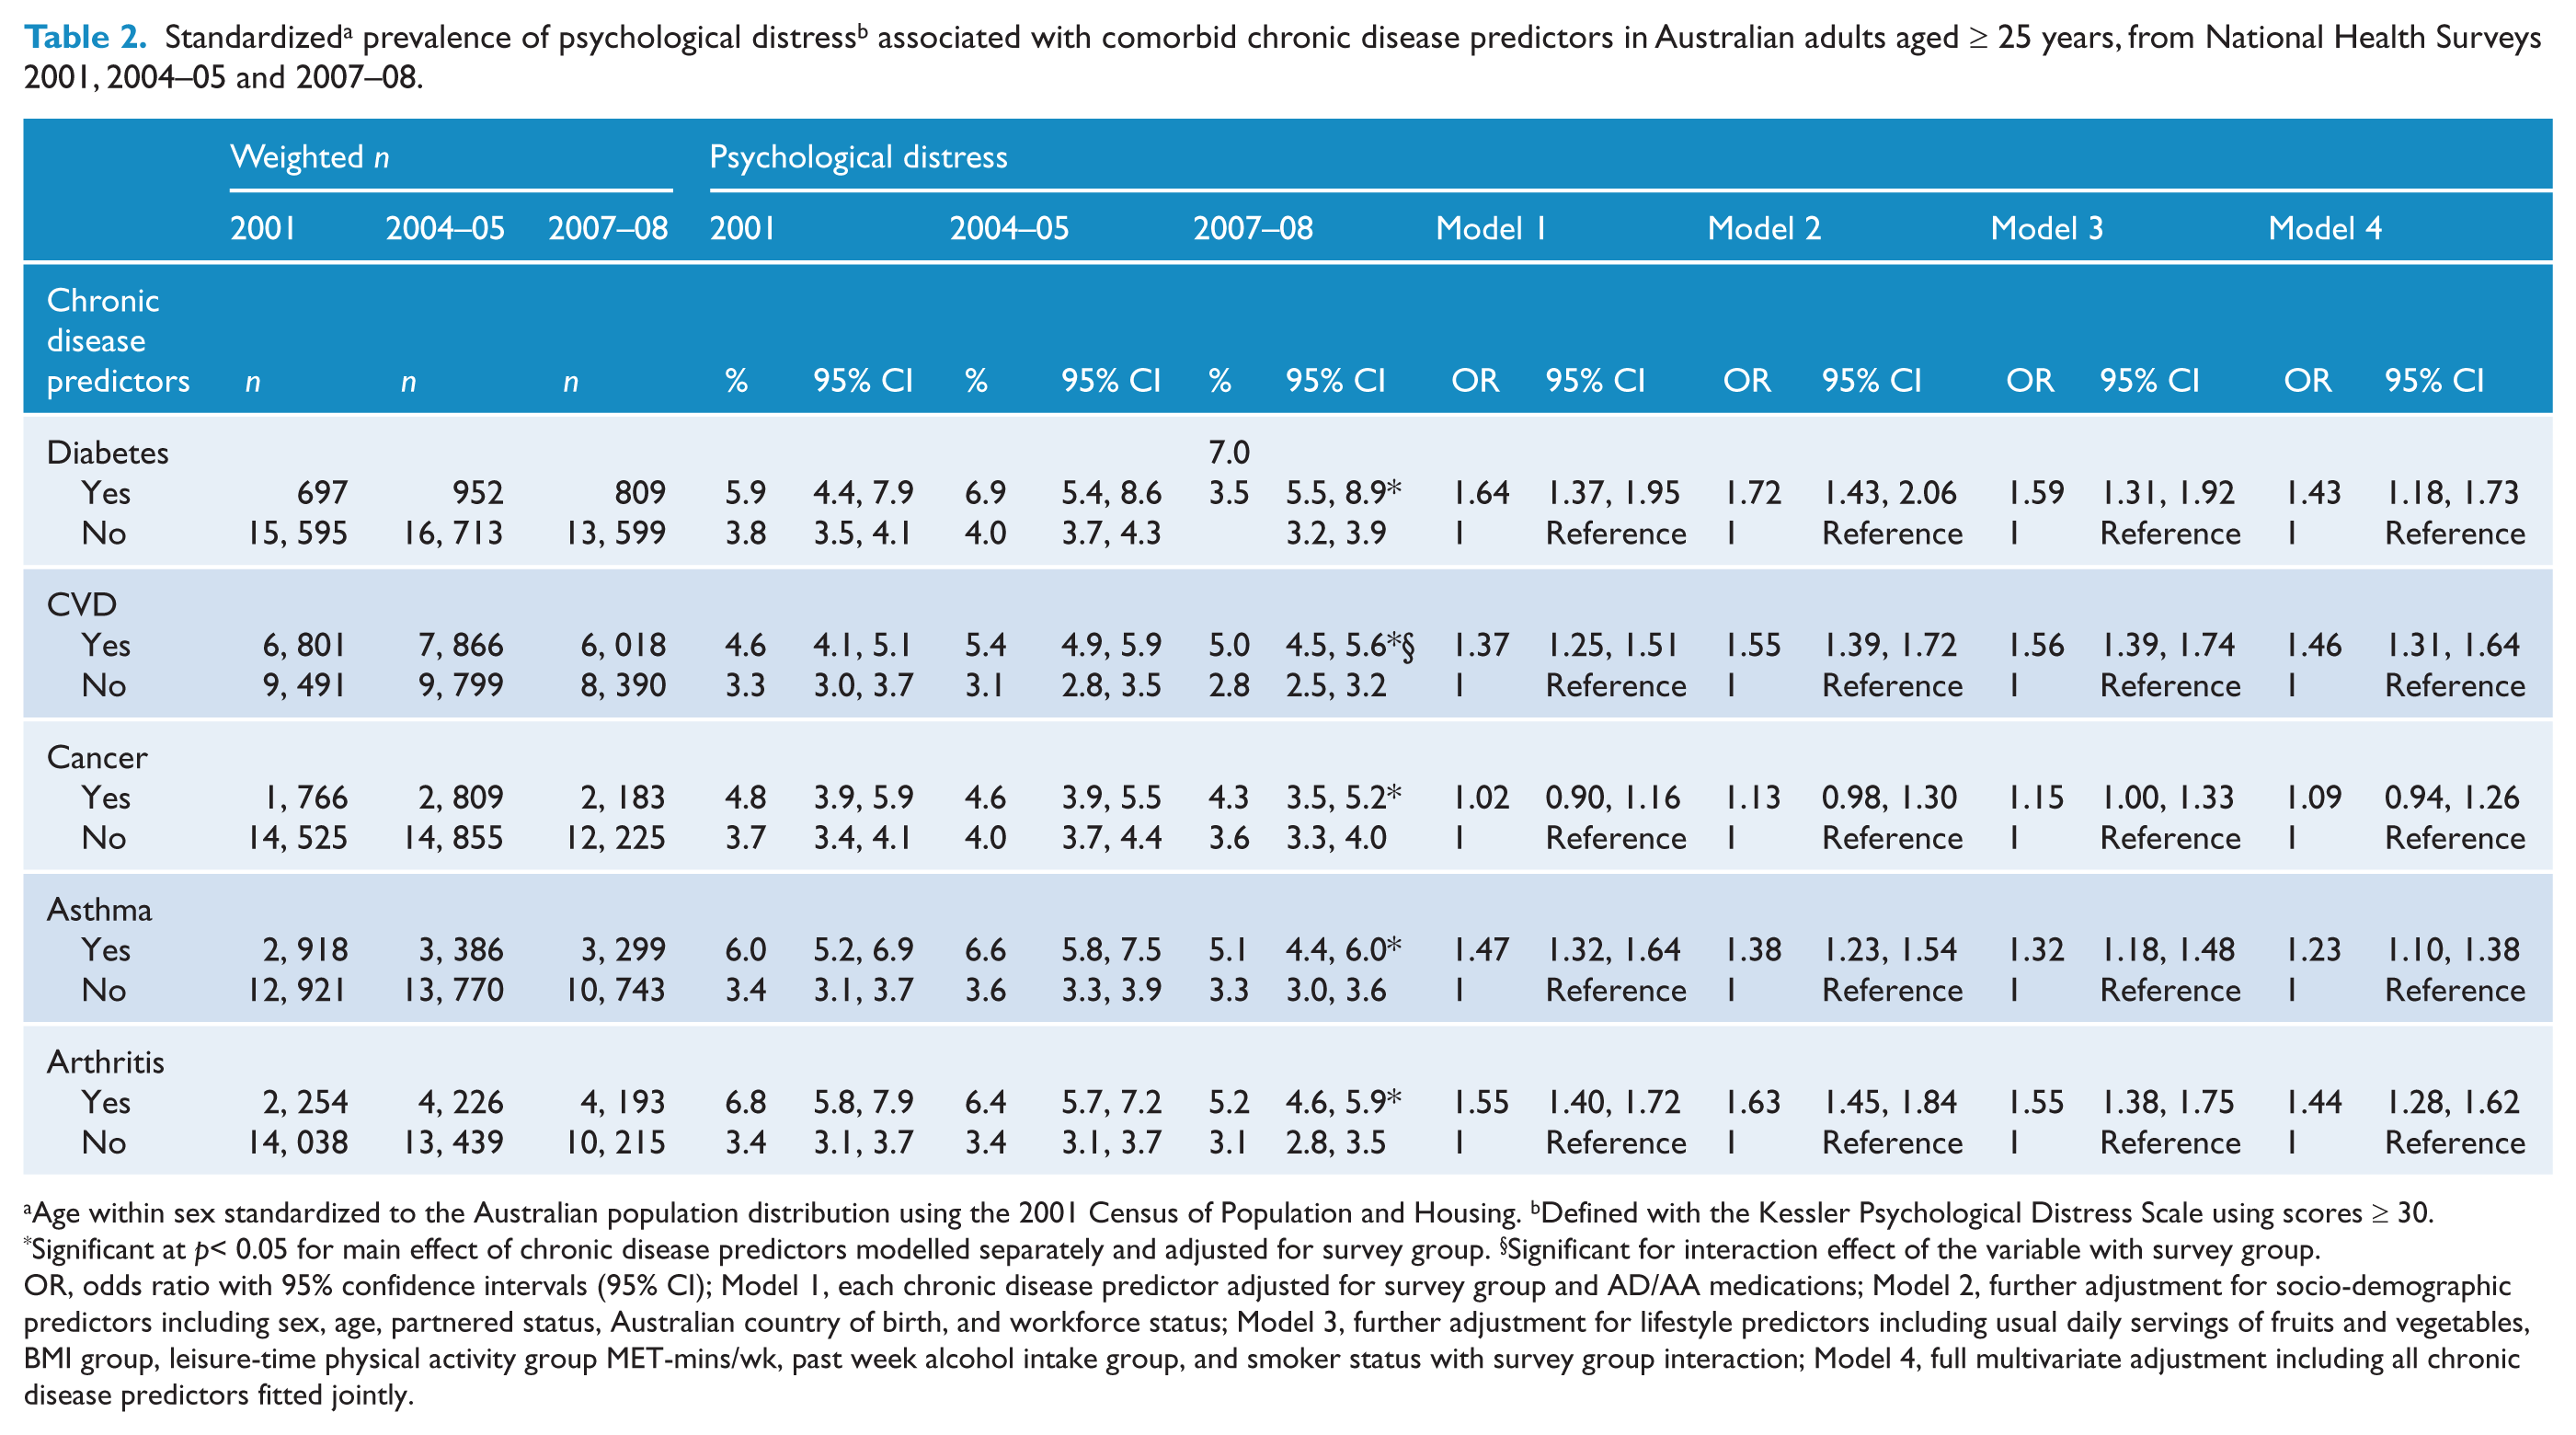
Age within sex standardized to the Australian population distribution using the 2001 Census of Population and Housing. b Defined with the Kessler Psychological Distress Scale using scores ≥ 30.
Significant at p < 0.05 for main effect of chronic disease predictors modelled separately and adjusted for survey group. § Significant for interaction effect of the variable with survey group.
OR, odds ratio with 95% confidence intervals (95% CI); Model 1, each chronic disease predictor adjusted for survey group and AD/AA medications; Model 2, further adjustment for socio-demographic predictors including sex, age, partnered status, Australian country of birth, and workforce status; Model 3, further adjustment for lifestyle predictors including usual daily servings of fruits and vegetables, BMI group, leisure-time physical activity group MET-mins/wk, past week alcohol intake group, and smoker status with survey group interaction; Model 4, full multivariate adjustment including all chronic disease predictors fitted jointly.
Standardized a prevalence of reported use of AD/AA medications associated with comorbid chronic disease predictors in Australian adults aged ≥ 25 years, from National Health Surveys 2001, 2004–05 and 2007–08.
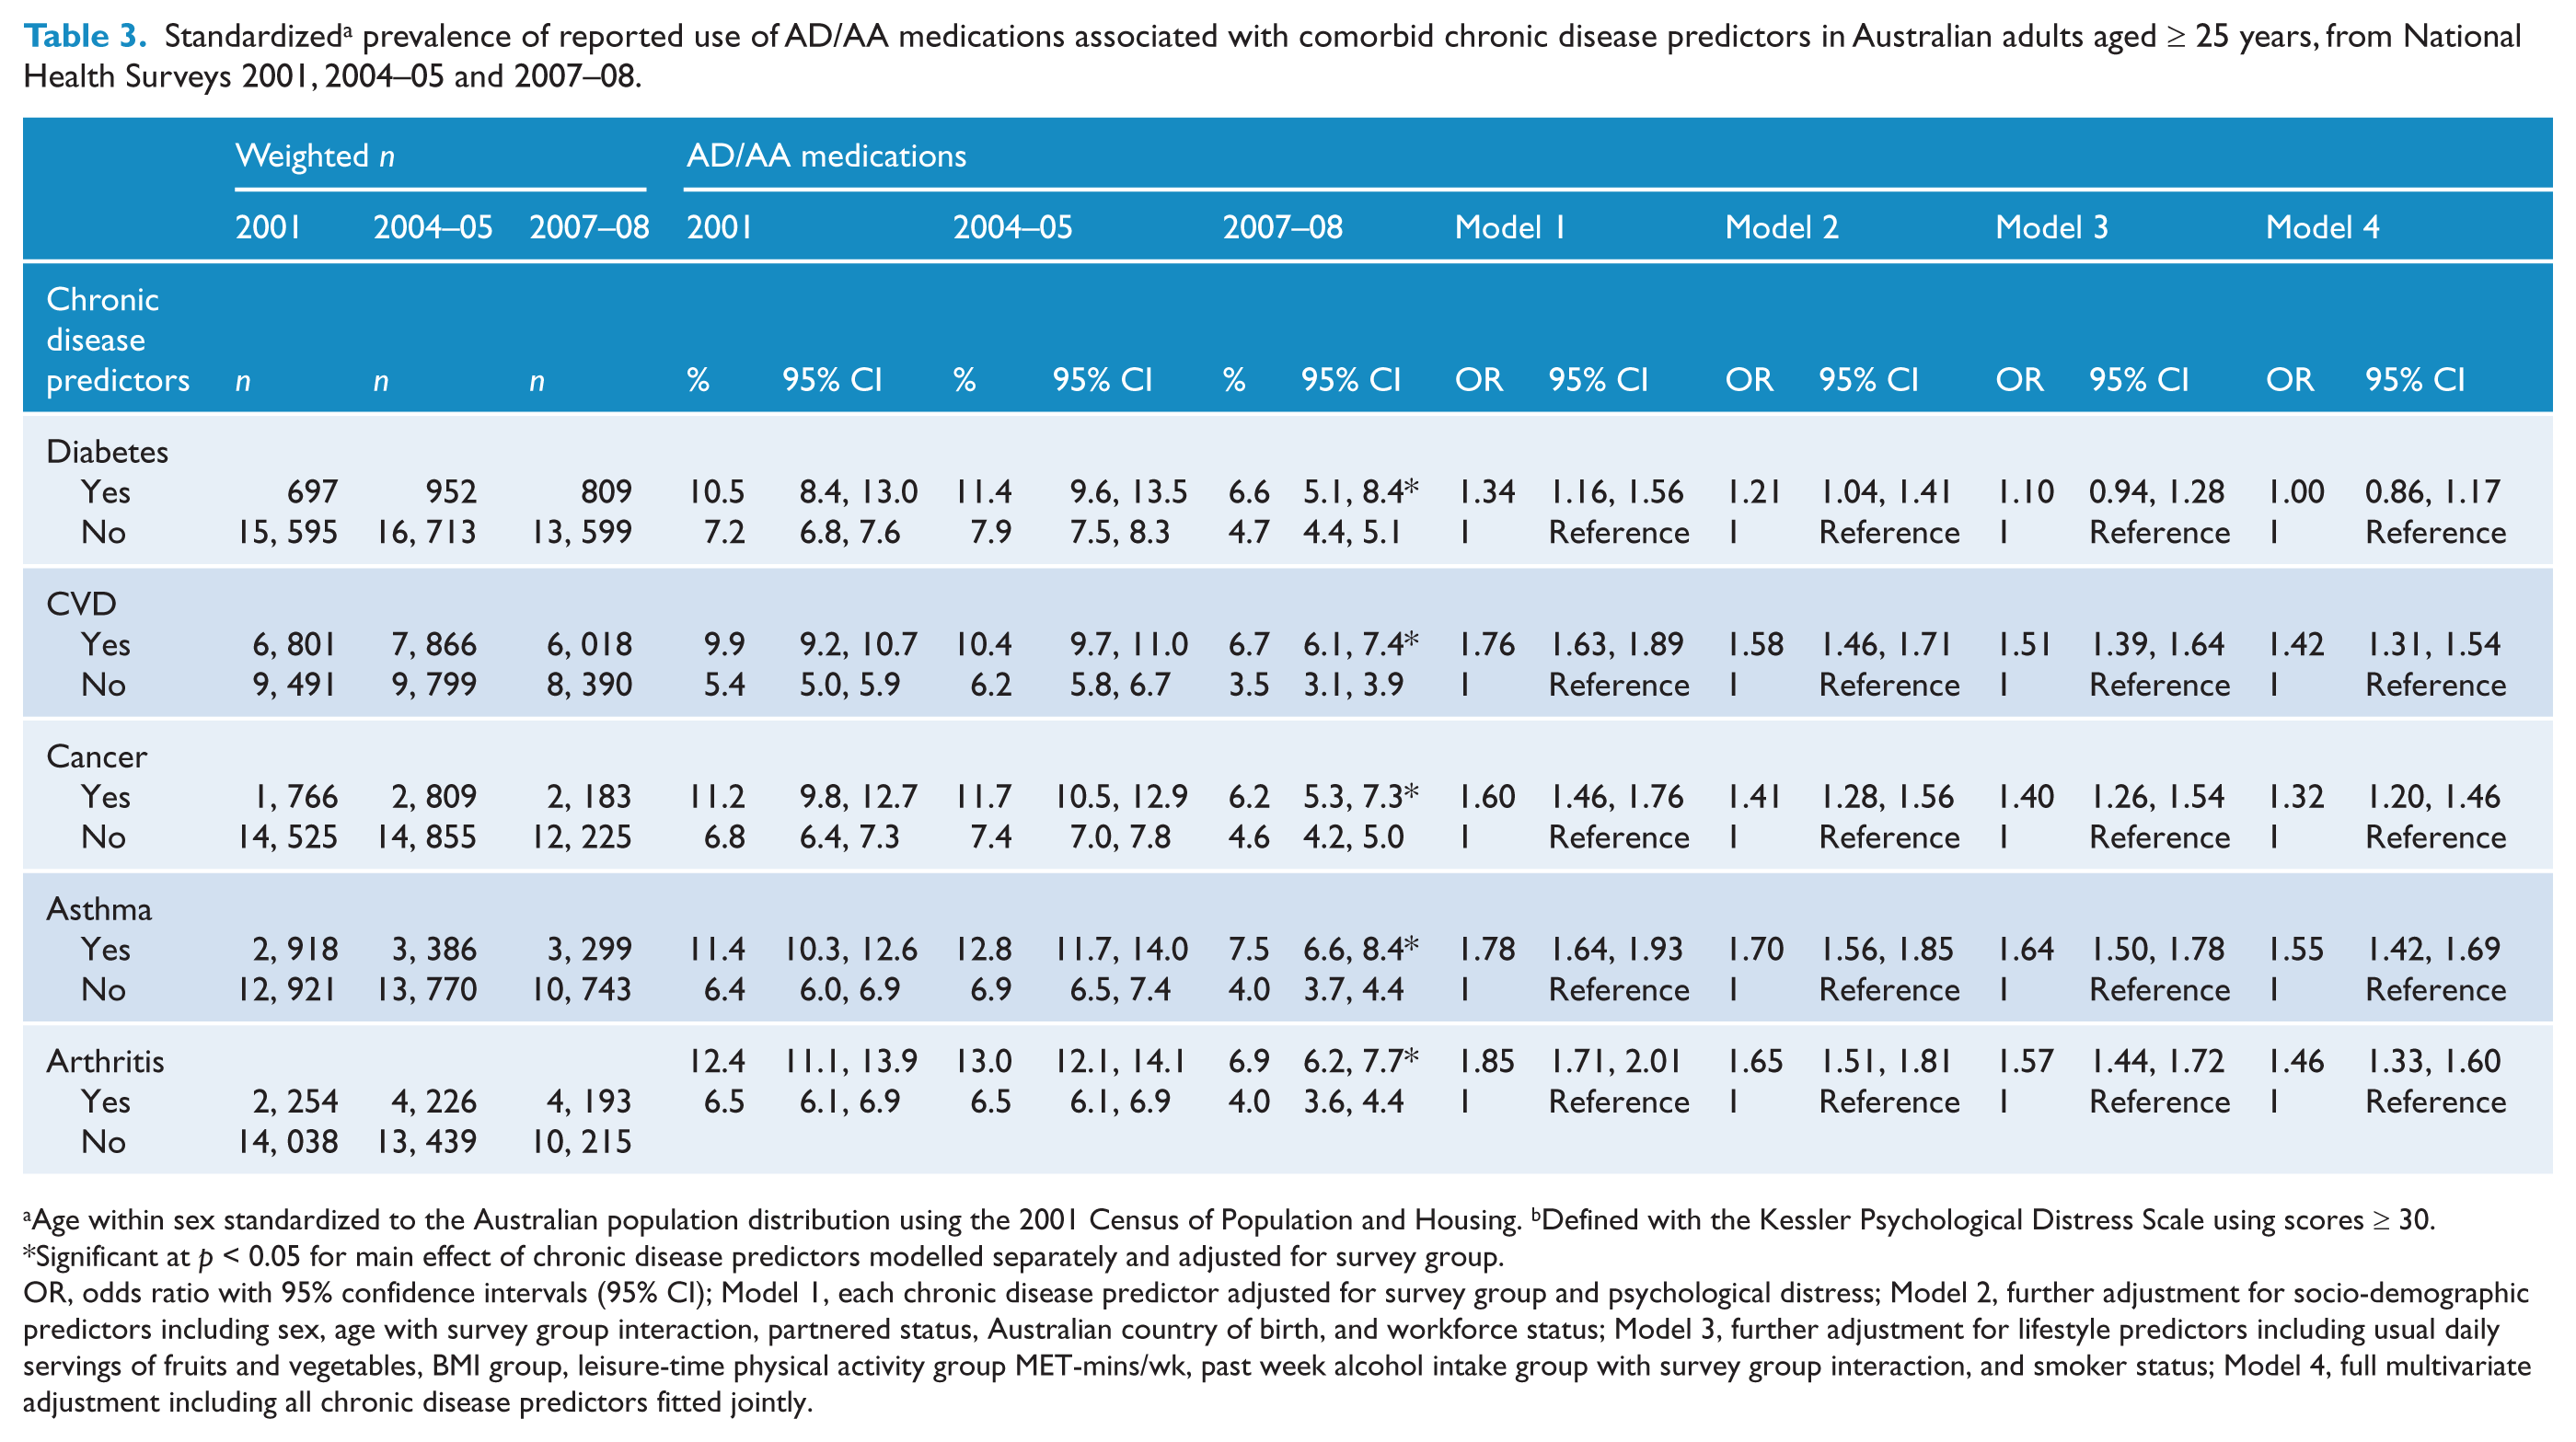
Age within sex standardized to the Australian population distribution using the 2001 Census of Population and Housing. b Defined with the Kessler Psychological Distress Scale using scores ≥ 30.
Significant at p < 0.05 for main effect of chronic disease predictors modelled separately and adjusted for survey group.
OR, odds ratio with 95% confidence intervals (95% CI); Model 1, each chronic disease predictor adjusted for survey group and psychological distress; Model 2, further adjustment for socio-demographic predictors including sex, age with survey group interaction, partnered status, Australian country of birth, and workforce status; Model 3, further adjustment for lifestyle predictors including usual daily servings of fruits and vegetables, BMI group, leisure-time physical activity group MET-mins/wk, past week alcohol intake group with survey group interaction, and smoker status; Model 4, full multivariate adjustment including all chronic disease predictors fitted jointly.
Results
Changes in the standardized prevalence of psychological distress and reported use of AD/AA medications by socio-demographic and lifestyle variables across the three surveys appear in Table 1. Between 2001 and 2008, the prevalence of psychological distress was relatively stable (3.9 vs. 3.7%), whereas the prevalence of AD/AA decreased from 7.3 to 4.8%. The prevalence of both psychological distress and AD/AA medications was highest for female sex, 40 to 59 years age groups, not partnered, not Australian born, not in the workforce, low and high as well as missing BMI groups, low physical activity, low fruit and vegetable intake groups, no past week alcohol consumption, and former as well as never smoker status. Significant interactions indicate that associations of psychological distress with smoking status, and AD/AA medications with age and past week alcohol consumption, were inconsistent across the three surveys.
Changes in the standardized prevalence of psychological distress by chronic diseases across the three surveys appear in Table 2. The prevalence of psychological distress increased from 5.9 to 7.0% and 4.6 to 5.0% for diabetes and CVD, but decreased from 3.8 to 3.5% and 3.3 to 2.8% for no diabetes and no CVD over the 8-year period. A significant interaction suggests that the association between psychological distress and CVD was inconsistent across the three surveys. In contrast, the prevalence of psychological distress decreased from 4.8 to 4.3% and 3.7 to 3.6% for cancer and no cancer, 6.0 to 5.1% and 3.4 to 3.3% for asthma and no asthma, and 6.8 to 5.2% and 3.4 to 3.1% for arthritis and no arthritis, consistently over the 8-year period.
On average, psychological distress remained significantly associated with chronic diseases after adjustments for covariates, which included AD/AA medications (Models 1 to 3). After adjustments for socio-demographic covariates, the strength of these associations (percentage change in the log OR) increased by 10 to 470% for diabetes, CVD, cancer, and arthritis, but decreased by 17% for asthma. After further adjustments for lifestyle covariates, the strength of these associations increased by 1 and 14% for CVD and cancer, but decreased by 10 to 15% for diabetes, asthma and arthritis. Finally, after further adjustment for all chronic diseases fitted jointly (Model 4), the strength of these associations decreased by 14 to 38%, and became non-significant for cancer.
Changes in the standardized prevalence of reported use of AD/AA medications by chronic diseases across the three surveys appear in Table 3. The prevalence of AD/AA medications decreased from 10.5 to 6.6% and 7.2 to 4.7% for diabetes and no diabetes, 9.9 to 6.7% and 5.4 to 3.5% for CVD and no CVD, 11.2 to 6.2% and 6.8 to 4.6% for cancer and no cancer, 11.4 to 7.5% and 6.4 to 4.0% for asthma and no asthma, and 12.4 to 6.9% and 6.5 to 4.0% for arthritis and no arthritis, consistently over the 8-year period.
On average, AD/AA medications remained significantly associated with chronic diseases after adjustments for socio-demographic covariates, which included psychological distress (Models 1 and 2), but the strength of these associations decreased by 8 to 36%. After further adjustments for lifestyle covariates, the strength of these associations decreased by 4 to 50%, and became non-significant for diabetes. Finally, after further adjustment for all chronic diseases fitted jointly (Model 4), the strength of these associations decreased by 12 to 98%.
Ancillary analysis
Results in Tables 2 and 3 show a marked decrease in the strength of associations of both psychological distress and AD/AA medication use with all chronic disease predictors fitted jointly (Models 4). The results suggest that the associations with several chronic diseases were partially explained by the presence of multiple comorbid chronic diseases. A post hoc analysis was therefore conducted to investigate the associations between psychopathology variables and the number of chronic diseases (new predictor fitted as a continuous variable), which ranged from 0 to 5, accounting for all other covariates. Each additional chronic disease increased the odds of both psychological distress (OR 1.34 [1.27, 1.41]) and reported use of AD/AA medications (OR 1.40 [1.35, 1.45]). Results presented in Figure 1 show that both the prevalence (with 95% CIs) of psychological distress and use of AD/AA medications were proportionately associated with increasing number of chronic diseases in a dose–response manner.
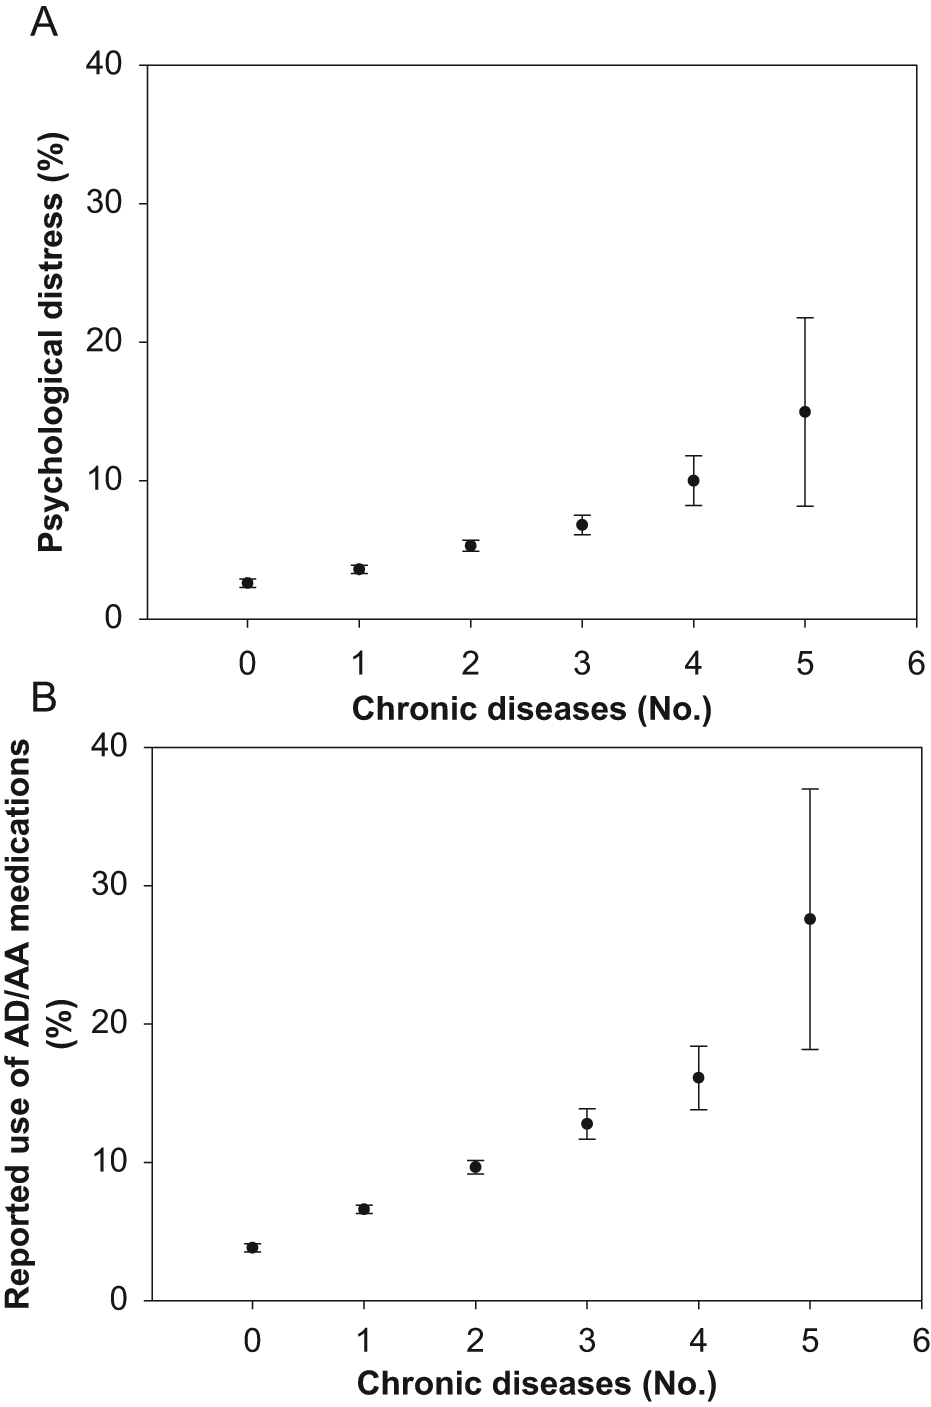
Standardized prevalence (with 95% CIs) of psychological distress (A) and reported use of AD/AA medications (B) associated with number of chronic diseases. Each additional chronic disease increased the odds of both psychological distress (OR 1.34 [1.27, 1.41]) and AD/AA medication use (OR 1.40 [1.35, 1.45]) in a dose–response manner.
Discussion
Our comprehensive study of serial and representative population-based data sources shows that although the prevalence of psychological distress changed little for adult Australians overall, it increased for people with diabetes and CVD from 2001 to 2008. This suggests that the rising burden of psychological distress in Australia was partially driven by the rising prevalence of diabetes and CVD, particularly for older people and those with socioeconomic disadvantage and unhealthy lifestyle behaviours (Atlantis et al., 2009). Conversely, the reported use of AD/AA progressively decreased for people with and without chronic diseases during this period, which suggests that access to mental health services might not have been commensurate with a rising demand, particularly for people with comorbid diabetes and CVD. Indeed, findings of the Australian National Survey of Mental Health and Wellbeing conducted in 2007 show that only 45 and 21% of people with a 12-month affective and anxiety disorder, respectively, used mental health services (Australian Bureau of Statistics d, 2008); the prevalence and self-reported treatment of affective and anxiety disorders were poorly aligned with the prescribing of medications for these disorders (Hollingworth et al., 2010), whereas AD/AA medications were frequently used for chronic diseases without a mental disorder (Harris et al., 2011).
Alternatively, practitioners may have been relying less heavily on the use of these agents to manage psychological distress in the community because of the mental healthcare reforms initiated in 2001 and 2006 which provided better access to psychological treatments (Fletcher et al., 2008). There are several other plausible explanations for the decreasing trend in the reported use of AD/AA medications over the 8-year period worth considering. First, efforts to both enhance public knowledge and diminish stigma associated with symptoms of depression in Australia were extensive (Goldney et al., 2010), but seem to have lost some traction over recent years, particularly between our two most recent surveys. Over time, this might have had a regressive impact on the public’s perception of psychotropic drugs, and willingness to report mental illness to a doctor or see a psychiatrist. Second, safety and efficacy concerns for AD medications raised during this period could have influenced prescribing practices. For instance, various agencies issued safety warnings concerning the potential risk of suicide in children and adolescents from 2002 to 2004, which received extensive media attention, academic interest, and probably decreased AD prescribing (Olfson et al., 2008). This might have also heightened well-established safety concerns for AD use in older people with chronic diseases (Caughey et al., 2010), who are most likely to have multi-morbidity (Gunn et al., 2010; Uijen and van de Lisdonk, 2008) and use AD/AA medications (Atlantis et al., 2011c). As for efficacy, two systematic reviews published in 2008 raised serious doubts about the benefits of AD medications (Kirsch et al., 2008; Turner et al., 2008), which also generated significant media attention and controversy (Mathew and Charney, 2009). Finally, there is overlap between the symptoms of depression and the symptoms of chronic diseases, including lack of energy or increased fatigue, sleep disturbance and changes in appetite, which may have led to diagnostic confusion (Mathew and Charney, 2009) and a decrease in AD prescribing. Similarly, the meaning and experience of being ill with a chronic disease – for example from cancer – may have changed because of better treatment methods and chances of survival. Nonetheless, findings of the most recent systematic review of placebo-controlled trials show that AD medications are both safe and effective in reducing acute depressive symptoms (pooled standardized mean difference was 0.34 for continuous scores) in people with depression and a range of comorbid chronic diseases (Taylor et al., 2011). Clinicians and allied health service providers need unbiased information about the benefits and risks of AD medications, and other forms of treatment, in depressed and anxious patients with comorbid chronic diseases to guide informed treatment decisions.
On average, the odds of psychological distress and reported use of AD/AA medications was 1.15 to 1.59-fold and 1.10 to 1.64-fold higher, respectively, for all chronic diseases after adjustments for socio-demographic and lifestyle variables. After further adjustment for all chronic diseases fitted jointly, these associations decreased in strength by 14 to 98%, suggesting that the associations between several of these chronic diseases and psychopathology were partially explained by the presence of multi-morbidity. Indeed, our results show that both the prevalence of psychological distress and use of AD/AA medications were proportionately associated with increasing number of chronic diseases in a dose–response manner (see Figure 1), which is consistent with findings from previous Australian (Gunn et al., 2010; Holden et al., 2010) and global (Moussavi et al., 2007) studies.
Strengths and innovations of this study include the analysis of trends across three large and representative population-based surveys in Australia that used identical methodologies to assess psychological distress and various other outcome measures; contemporaneous use of medications for mental health were inventoried; population-based trends for psychopathology associated with common chronic diseases were reliably estimated; and results were age/sex standardized to the 2001 Australian reference population to account for age-related changes in the population distribution and non-response and non-coverage biases.
The results of this study should also be balanced against several noteworthy limitations. The issue of directionality of associations between outcome measures remains unclear in this study because data were derived from serial surveys (cross-sectional studies). Unknown diabetes would probably have been incorrectly classified as no diabetes because this information was determined by self-report (Dunstan et al., 2001), thereby decreasing the effect of the associations. Classification errors (underestimations) may also have occurred for underweight, overweight or obesity because height and weight, which we used to compute BMI, were also determined by self-report (Australian Bureau of Statistics, 1998). Both biases, however, would have resulted in more conservative effect estimates (odds ratios). Other limitations include potential biases due to self-report outcome measures (such as use of AD/AA), missing information on non-respondents, and misclassification errors for covariates. Finally, we acknowledge that our measure of psychological distress, the K10, does not equate to a clinical diagnosis of depression or anxiety disorder according to DSM-IV or ICD-10 criteria, although the cut-off point that we used in this study to identify cases has well-established validity (Andrews and Slade, 2001). People with chronic diseases endorse depressive symptoms measured with psychometrics that are actually due to their physical disorder (Grayson et al., 2000), and this bias could have partially explained the divergent changes in the prevalence of psychological distress (measured with the K10) and reported use of AD/AA associated with some chronic diseases.
This comprehensive study of serial and representative population-based data sources shows that although psychological distress prevalence changed little for adult Australians overall, it increased for people with diabetes and CVD from 2001 to 2008. Conversely, the reported use of AD/AA progressively decreased for people with and without chronic diseases. Overall, our findings show there was a persistently higher psychopathology burden associated with each and increasing number of chronic diseases. Effective interventions and policies are needed to mitigate psychological distress associated with comorbid chronic diseases, including unbiased information about the benefits and risks of AD/AA medications and other forms of treatment. Furthermore, these results indicate that the introduction of effective strategies to prevent diabetes and other chronic diseases could have the added benefit of reducing the prevalence of psychological distress in the community.
Footnotes
Funding
This research received no specific grant from any funding agency in the public, commercial or not-for-profit sectors.
Declaration of interest
NS participated in scientific symposia organized by Eli Lilly, Pfizer, Janssen and Lundbeck and served as a consultant to Eli Lilly, Lundbeck and Servier.