
Abstract
There has been a long controversy about whether the prevalence of common mental disorders is increasing in the population. Much of the early evidence on this issue came from community surveys of lifetime prevalence which used retrospective recall of episodes earlier in life. These studies suggested that prevalence had increased in many countries over successive cohorts during the twentieth century [1]. However, the validity of retrospective assessment is known to be limited [2]. Of greater interest are repeat surveys in the same community using identical methods of case ascertainment. An early Swedish study of this type did support an increase in depression over 25 years [3]. However, a 40-year study in Canada found little change in prevalence of anxiety or depression over 40 years [4, 5]. Similarly, a Finnish study over 16 years found no change in prevalence of mental disorders in the whole population, but a lower prevalence over time in the youngest birth cohort [6]. In a meta-analysis of US studies using the Children's Depression Inventory, there was a slight decrease in scores for boys over cohorts, but no change for girls [7]. By contrast, a similar meta-analysis of studies using anxiety scales did find an increase for children and college students over a 40-year period [8]. Although these repeat surveys are not entirely consistent, they do not support the strong increase found in retrospective studies.
Historical trends in prevalence may not be generalizable across countries because of local factors operating. Furthermore, time trends observed decades ago may not apply currently. There is therefore a need for local contemporary data. In Australia, there has been no good historical data on prevalence of mental disorders or on symptoms. We are remarkably ignorant about whether the mental health of the Australian population has been improving or worsening or stable. The National Health Surveys have included a measure of psychological distress on three occasions, but have used a different measure each time making comparison impossible. The only repeat use of a measure was the Kessler 10 (K10) questionnaire in the National Survey of Mental Health and Wellbeing in 1997 and again in the National Health Survey in 2001. The 2001 survey found a much higher prevalence of moderate or greater levels of psychological distress than the 1997 survey (36% vs 26%) [9]. However, such a large change over only 4 years raises the suspicion that the methodology of the surveys was not comparable. Another general measure of mental health, the mental health scale from the Short Form-36 (SF-36), was included in both the 1995 National Health Survey [10] and the 2001 Household, Income and Labour Dynamics in Australia (HILDA) Survey (the first-wave of a large-scale nationally representative survey of Australian households) [11]. Comparison of these two surveys showed poorer mental health in the later survey [12], with the change greatest among younger respondents. Again, however, methodological differences between the surveys limit interpretation.
We report data from two Australian surveys of adult samples that used the same measure of psychological distress and had comparablemethodology. These surveys were carried out in 1995 and 2003–2004, respectively, a gap of 8 years. To our knowledge this is the first credible data available on time trends in psychological distress in Australia.
Method
The methods of the 1995 and 2003–2004 household surveys have been described in detail previously [13–15]. Briefly, the 1995 survey involved a national sample of 2031 people aged 18–74 years, while the 2003–2004 survey involved 3998 people aged 18 years or over. To allow direct comparison of 5-year age groups, we used the data from 20–24 years to 70–74 years from each survey. This selection gave 1964 and 3507 participants, respectively.
Both surveys were primarily concerned with mental health literacy. The second survey contained the same questions as the first, but with some additional ones added. Toward the end of the surveys, the participants were given the 4-NS [16]. This questionnaire asks: ‘In the past month have you suffered from any of the following: colds, sore throats, headaches, dizziness, palpitations, breathlessness, backache, flu, anxiety, depression, tiredness, irritability, nervousness’, with response options of ‘yes’, ‘no’ or ‘do not know’. The 4-NS score is the sum of ‘yes’ responses to the four symptoms of anxiety, depression, irritability and nervousness.
For descriptive analysis, means and standard errors on the 4-NS were graphed for each age- and gender-group in the two surveys. The data were also analysed using negative binomial regression for men and women separately. In these analyses, age, survey occasion, and ageby- occasion were used as predictors of 4-NS score. Age was coded as a linear effect of 5-year age groups, but other analyses using dummy coding led to a similar interpretation. Data were weighted using survey weights to give better population estimates and to control for possible differences across surveys in response rates and representativeness. Geographical clustering in the sample was ignored in view of evidence that area clustering effects are minor with mental health measures [17, 18]. The negative binomial modelwas used because of the negative skew in the 4-NS distribution. Analyses were conducted using Stata 8.0.
Results
Figure 1 shows the mean scores on the 4-NS for men and women at both surveys. Scores were similar across the surveys, except for men aged 20–24 years and 25–29 years, who showed increased scores on the second survey occasion.
Mean 4-NS score (and standard error of the mean) within age groups at 1995 and 2003?2004: (a) men; (b) women.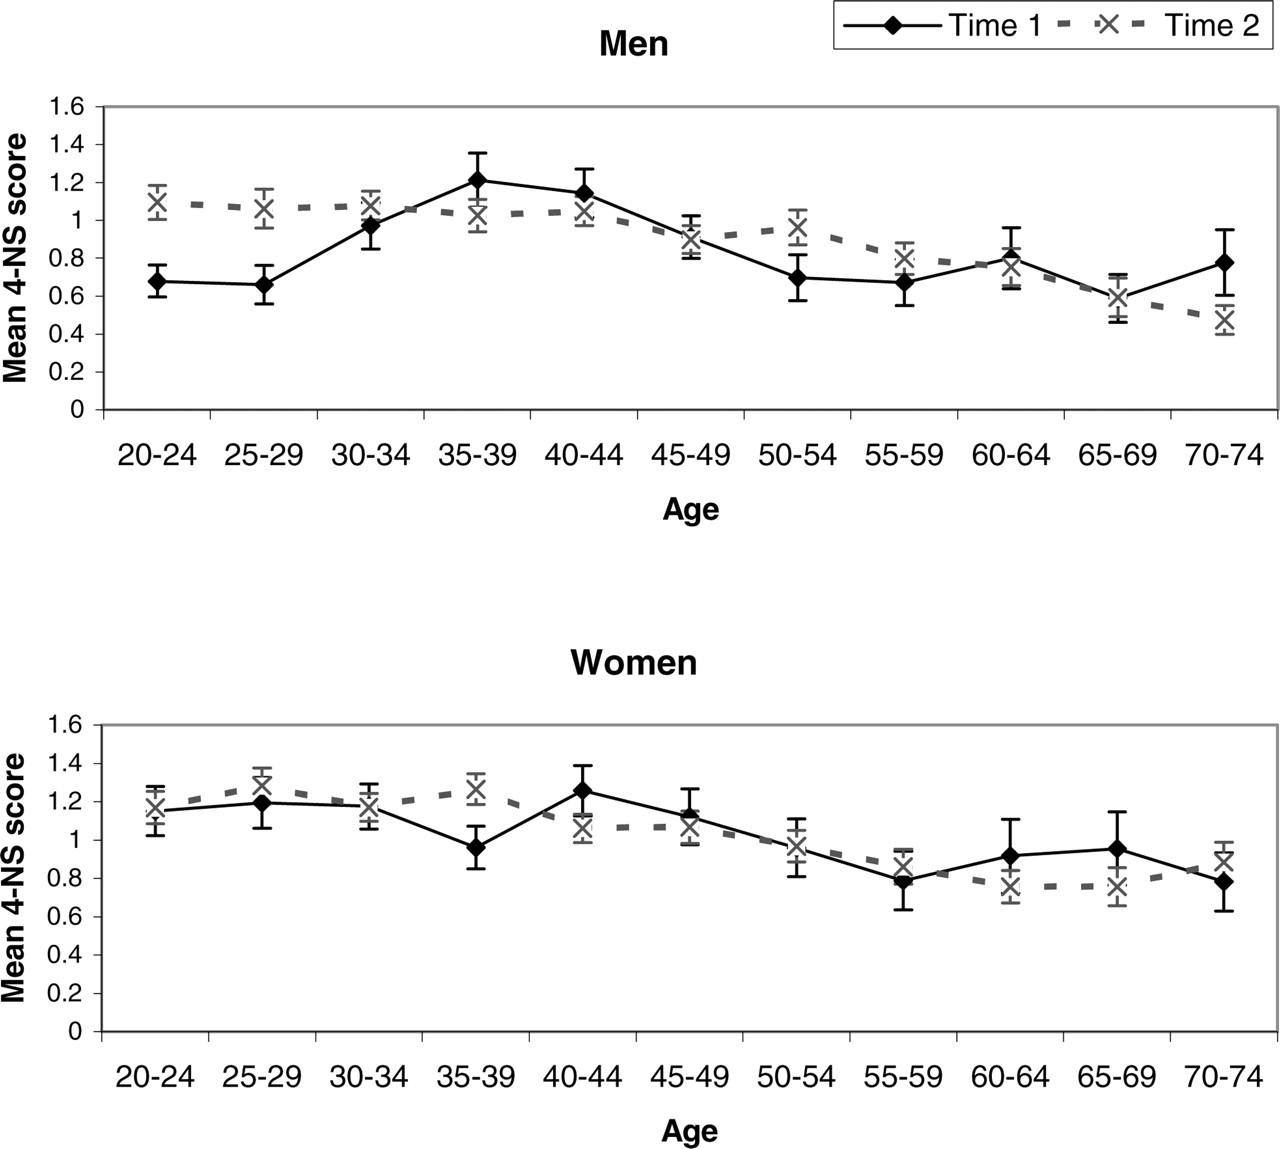
Regression analysis showed, for men, a significant effect of survey occasion (p=0.007) and an interaction of occasion with age (p=0.019). For women, there was a significant age effect (p=0.017), but no effect of occasion or age-by-occasion. An analysis of individual 4-NS items for men showed consistent changes across all items, but these were only statistically significant for one of the items, which is not unexpected given the greater unreliability of individual items.
Differences of the sort observed for men could be due to the comparison of different cohorts in the two surveys. In other words, the men aged 20–24 years in 1995 are not the same 20–24 year olds as in 2003–2004. To compare the same cohorts, an approximate comparison would be 20–24 years at 1995 with 30–34 years at 2003–2004, and 25–29 years at 1995 with 35–39 years at 2003–2004. (This comparison is only approximate because there were 8 years between surveys not 10 years.) It can be seen from Fig. 1 that the worsening of psychological distress between surveys occurred even when the same cohorts are compared.
Discussion
The present data show an increase in psychological distress in young men aged 20–29 years, but no changes in other male age groups or in women. This change is not simply due to a new cohort with a higher risk moving into this age group. The increase is apparent when the same cohorts are tracked over time, indicating that psychological distress has increased for these particular cohorts.
Is this change real or could it be an artifact? Unfortunately, there are no confirming sources of data available apart from the suicide rate. The most recent suicide data available are for the period 1993–2003 and these show a slight improvement for men in the 20- to 29-year age group [19]. However, suicide rates and psychological distress do not necessarily follow the same patterns, as shown by the higher rate of psychological distress in women compared to the higher rate of suicide in men.
Possible sources of artifact would be changes in interpretation or meaning of questionnaire items or changes in the willingness to report particular symptoms. However, such artifacts are implausible for the current findings because they would not be expected to affect only one age–gender group. Furthermore, analysis of individual 4-NS items showed consistent trends for all four items.
This study used a questionnaire, the 4-NS, that is not in widespread use. The reason for using this particular measure is that itwas designed to appear ‘medical’ rather than to be specifically about mental health [16]. The two surveys that provided the datawere primarily concerned with assessing mental health literacy and we did not want to cue the participants as to the specific mental health focus. Nevertheless, the 4-NS has been validated by correlation with the Present State Examination total score and was found to perform similarly to other short screening tests, with a correlation of 0.62 [16].
If the increase in 20- to 29-year-old men is indeed real, we can only speculate on the possible causes. Nevertheless, monitoring of time trends does serve to identify subgroups in the population which need particular targeting for intervention. In the area of mental health, we are lacking any routine monitoring data apart from the suicide rate, a situation which is different from other major sources of disease burden. The present data illustrate the need for routine population monitoring using a standard methodology. A recent proposal for routine monitoring involved a National Depression Index which is based on the K10 questionnaire but allows easy interpretation in terms of relative risk for depression [20].
Footnotes
Acknowledgements
The 1995 survey was carried out with funding from a National Health and Medical Research Council Unit Grant. The 2003–2004 survey was carried out as part of the Australia–Japan Partnership, a cross-national study of mental health literacy in both countries. This survey was funded by the Australian Department of Health and Ageing, aNational Health and Medical Research Council Program Grant, and beyondblue: the national depression initiative. We thank our colleagues who were involved in the 1995 survey and Helen Christensen, Kathy Griffiths and Kelly Blewitt for their role in the 2003–2004 survey.