
Abstract
Introduction
For diseases that are major causes of mortality, there is routine monitoring of changes at a national level using death certificate data (Australian Institute of Health and Welfare, 2011). This monitoring can be used to evaluate the impact of public health efforts and to monitor for emerging diseases. However for mental disorders, which are primarily causes of disability rather than mortality, national monitoring is more difficult. While suicide data are available (Australian Government Department of Health and Ageing, 2008), these reflect only the tip of the iceberg of the national impact of mental disorders.
Repeated national surveys of mental disorders could in principle provide relevant data, but changes in diagnostic criteria and survey instruments over time, as happened with the 1997 and 2007 Australian National Surveys of Mental Health and Wellbeing (Slade et al., 2009), make time series comparisons difficult. A more feasible alternative is to use short screening instruments for national monitoring (Mackinnon et al., 2004). These are much less time consuming and expensive to administer than diagnostic instruments, and are less likely to change in content or scoring over time. Such instruments include the K10, K6, the Patient Health Questionnaire and the 4-NS (Furukawa et al., 2003; Henderson et al., 1981; Kroenke et al., 2010).
In Australia, a national approach to monitoring changes in mental health in this way has yet to emerge. Nevertheless, a number of relevant national and state datasets have been analysed in recent years to examine historical changes. The first study used data from national surveys of mental health literacy carried out in 1995 and 2003–04 to examine changes in psychological distress in adults aged 20–74 (Jorm and Butterworth, 2006). Using the 4-NS as a measure of distress, it found an increase in males aged 20–29 years, but no change in females or other male age groups. The second study compared the prevalence of major depression, as measured by the Patient Health Questionnaire, in people aged 15 or over in South Australia in 1998, 2004 and 2008 (Goldney et al., 2010). This study found an increase in prevalence of depression in males aged 15–29 and females aged 30–49, but no change in other age groups. The third study used K10 screening test data from the 1997 and 2007 National Surveys of Mental Health and Wellbeing, and from the 2001 and 2004/5 National Health Surveys (Reavley et al., 2011). Results showed a significant increase in anxiety symptoms for females aged 30–49 between 1997 and 2007, but no difference for males or for females in other age groups. Depression symptoms did not change over this period. Despite the differences in methodology and time periods studied, these three studies are consistent in finding no overall improvement in mental health in Australia, but rather deterioration in some sub-groups of the population.
The purpose of this paper is to report data from a 2011 national survey of mental health literacy which extends observations previously reported for 1995 and 2003–04 (Jorm and Butterworth, 2006). The 16 years from 1995 to 2011 cover a period of considerable change in Australian mental health care, with increases in the provision of psychological, pharmacological and population interventions. There were major increases in the provision of psychological therapies through the Better Outcomes in Mental Health Care scheme introduced in 2001, and the Better Access to Psychiatrists, Psychologists and General Practitioners scheme introduced in 2006 (Bassilios et al., 2010; Jorm, 2011; Pirkis et al., 2011a, 2011b, 2011c), and the introduction of freely available self-help therapy via the internet (Bennett et al., 2010). There were also continuing increases in the use of antidepressant medication over this period (Hollingworth et al., 2010). The public mental health system underwent significant reform, with a shift towards community-based care and a reduction in in-patient care (Short et al., 2010). Population interventions received a boost with the start of the National Suicide Prevention Strategy in 1999 and beyondblue: the national depression initiative in 2000. It might be expected that these changes would improve the mental health of the population.
Methods
Survey methods
The methods of the 1995 and 2003–04 household surveys have been described in detail previously (Jorm et al., 1997, 2005). Briefly, the 1995 survey involved a national sample of 2031 people aged 18–74 years, while the 2003–04 survey involved 3998 people aged 18 years or over. The 2011 survey differed from the early ones in that it covered ages 15 and over, and interviews were carried out with 6019 people by telephone based on random digit dialling of both landlines and mobile phones (Reavley and Jorm, in press). To allow direct comparison of 5-year age groups, we used the data from 20–24 years to 70–74 years from each survey. This selection gave 1964, 3507 and 5131 participants, respectively. All three surveys were primarily concerned with mental health literacy. The second survey contained the same questions as the first, but with some additional ones added. Similarly, the third survey contained the same questions as both the first and the second, but with some additional ones.
Measure of psychological distress
Toward the end of the surveys, the participants were given the 4-NS (Henderson et al., 1981) as a measure of psychological distress. This questionnaire asks: “In the past month have you suffered from any of the following: colds, sore throats, headaches, dizziness, palpitations, breathlessness, backache, flu, anxiety, depression, tiredness, irritability, nervousness”, with response options of “yes”, “no” or “don’t know”. The 4-NS score is the sum of “yes” responses to the four symptoms of anxiety, depression, irritability and nervousness. The 4-NS was developed in Australia, but is not widely used. It has not been validated against clinical diagnosis, but has a correlation of 0.62 with the total score of the clinician-administered Present State Examination (Henderson et al., 1981). The 2011 survey included the more widely used K6 (Furukawa et al., 2003) as an additional measure of psychological distress, allowing an examination of the correlation between the two measures.
Statistical analysis
The reliability of the 4-NS was assessed at each time point using Cronbach’s alpha. Pearson’s r was used to examine the correlation of the 4-NS with the K6 in 2011. For descriptive analysis of changes over time, means on the 4-NS were graphed for each age and gender group in the three surveys. The data were also analysed using negative binomial regression for men and women separately. The negative binomial model was used because of the negative skew. In these analyses, age, survey occasion, and age-by-occasion were used as predictors of 4-NS score. Age group was dummy coded using the median age group (45–49 years) as the reference category. Survey occasion was also dummy coded using 1995 as the reference year. Data were weighted using survey weights to give better population estimates and to control for possible differences across surveys in response rates and representativeness. Geographical clustering in the 1995 and 2003–04 samples was ignored in view of evidence that area clustering effects are minor with mental health measures (Butterworth et al., 2006; Weich et al., 2003).
To check whether there were any differences across surveys in the prevalence of high scores, the analysis was also carried out using binary logistic regression with a cut-point 2/3 on the 4-NS. The prevalence of high distress with this cut-point was approximately 15%.
The 0.05 alpha level was used in the regression analyses. Analysis was carried out using SPSS Statistics 19 for Cronbach’s alpha and Intercooled Stata 10 for regressions.
Results
Cronbach’s alpha for the 4-NS was 0.64 in 1995, 0.70 in 2003–04 and 0.63 in 2011. The correlation between the 4-NS and the K6 in 2011 was 0.49.
Figure 1 shows mean 4-NS scores by gender and age groups across the three surveys. Regression analyses showed no significant overall difference between years. In the negative binomial regression analysis, there was an age-by-year interaction effect for 20–24-year-old males in 2003–04 which approached statistical significance (p = 0.053). This interaction effect reached statistical significance in the logistic regression analysis (p = 0.011). This effect can be seen in Figure 1, where 20–24-year-old males showed a higher mean score in 2003–04 compared to 1995. However, the 2011 mean for males in this age group did not differ from 1995.
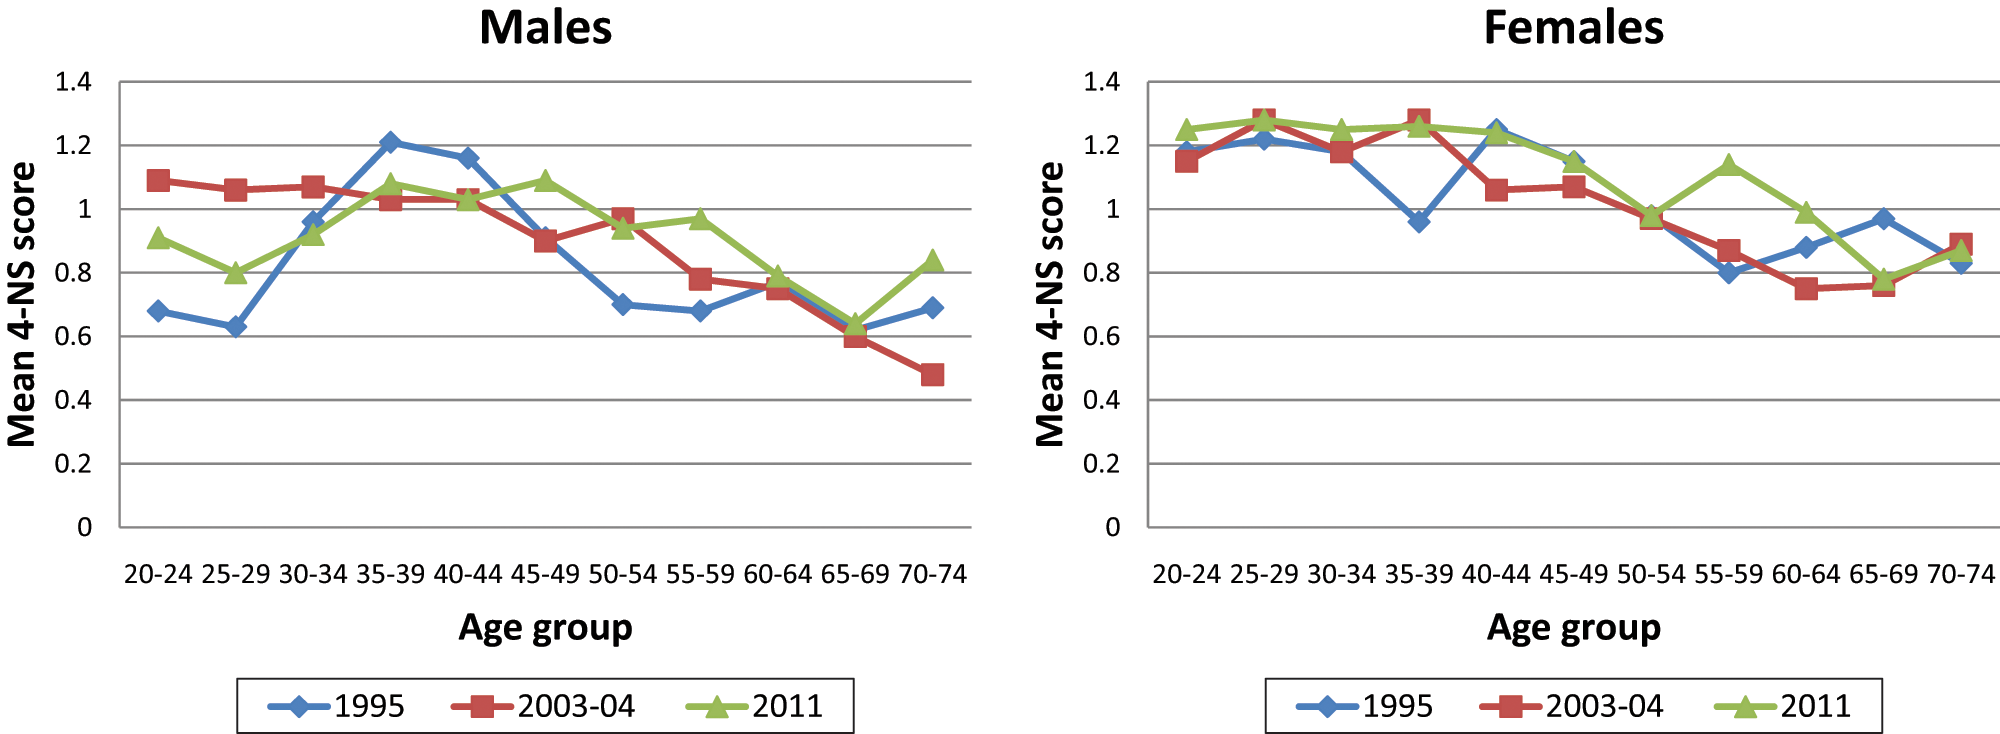
Mean 4-NS score by gender and age group for three survey time points
Discussion
The data show no overall change in psychological distress between 1995, 2003–04 and 2011. As previously noted, there was an increase in distress in young men between 1995 and 2003–04 (Jorm and Butterworth, 2006), but this had reduced by 2011. The results are consistent with previous studies which cover part of the same time period in showing no improvement in mental health (Goldney et al., 2010; Reavley et al., 2011).
By contrast, the Australian national suicide rate has shown changes, at least for males. The male suicide rate peaked in 1998 and then declined by 44% from 1999 to 2005 (Australian Government Department of Health and Ageing, 2008). Although it has been suggested that this decline could be an artefact of misclassification of suicides, changes have still been found after making allowance for misclassification (Page et al., 2010). More recent suicide statistics are consistent with this improvement (Australian Bureau of Statistics, 2011), but may be subject to future revision to allow for misclassification.
The lack of improvement in mental health is surprising given the increase in services and population interventions that has occurred over the period and the reduction in perceived unmet need for services that has been found between the 1997 and 2007 National Surveys of Mental Health and Wellbeing (Meadows and Bobevski, 2011). There are a number of possible reasons for a lack of improvement. One possibility is that real changes have occurred, but are too small to detect in community surveys using short screening measures. To investigate this possibility, a power analysis was carried out for the current data. Assuming a population prevalence of 15% for high psychological distress in 1995, the study had 61% power of detecting a 2% drop and 93% power of detecting a 3% drop by 2011. The power to detect changes between 2003–04 and 2011 was somewhat better due to the larger sample sizes, with 81% power to detect a 2% drop and 99% power to detect a 3% drop. However, if the drop in prevalence was only 1%, which still represents an important population impact, the study would not be likely to detect it, with power of only 20% between 1995 and 2011, and 29% between 2003–04 and 2011. The moderate reliability of the 4-NS is also a factor here, with error of measurement possibly reducing any real effects that existed.
There are other possible explanations for the lack of change over time. It is possible that the increase in services has had a positive impact, but was counteracted by other factors that increased prevalence. Prevalence of psychological distress is known to be associated with socioeconomic factors (Mackinnon et al., 2004) and may also be affected by environmental change (Albrecht et al., 2007). It is notable that major flooding was occurring in some parts of Australia at the time the 2011 survey was carried out. Another possible counteracting effect is changing response to screening tests over time. With increasing mental health literacy (Jorm et al., 2006), the population may have become more aware of symptoms and more willing to report them than previously, which could counterbalance any true reduction in symptom prevalence.
Another possibility is that while the number of services has improved, the quality has not. A number of pieces of evidence support this possibility. An analysis of perceived unmet need in the 1997 and 2007 National Surveys of Mental Health and Wellbeing found that while unmet need declined, fully met need did not improve, indicating that the number, but not the quality, of services had increased (Meadows and Bobevski, 2011). Similarly, while antidepressant use has increased substantially in Australia, many users do not appear to have a mental disorder (Harris et al., 2011a) and the peak age of use (90–94 years) does not correspond to the peak age of prevalence of depression and anxiety disorders (under 50 years), indicating that these medications are being used for non-approved purposes (Hollingworth et al., 2010). Psychological therapies have also increased substantially, with 1 in every 19 Australians receiving at least one Better Access service in 2009 (Pirkis et al., 2011a). However, there is some evidence that users of these services are often receiving psychoeducation and non-specific counselling rather than the more evidence-based cognitive-behaviour therapy (Harris et al., 2011b).
Finally, it is possible that reducing prevalence requires greater emphasis on the social determinants of mental health (Fisher and Baum, 2010) and taking preventive action (Brugha et al., 2004). Prevalence is a function of incidence and duration of disorders. Whereas services mainly reduce duration of episodes, prevention is aimed at reducing incidence. While preventive programmes have become more available in Australia, mainly in school settings, these have received far fewer resources than treatment services, particularly for adults.
While these findings apply specifically to Australia, the data available from other countries are consistent in showing no detectable population effect of increases in services. In the USA, analysis of data from National Comorbidity Surveys showed no change in prevalence of mental disorders between 1990 and 2003 in the population aged 18–54 years, despite an increase in the rate of treatment from 12.2% to 20.1% (Kessler et al., 2005). Other US survey data have shown that the prevalence of major depression increased over the period 1991–92 to 2001–02 (Compton et al., 2006). Similarly, in Great Britain, comparison of national survey data in 1993, 2000 and 2007 showed no change in the prevalence of depressive episodes, mixed anxiety and depression states and suicidal ideations in 16–64-year-olds, despite an increase in the prevalence of antidepressant treatment from 1.1% to 4.9% and an increase in psychotherapy/counselling from 1.6% to 3.0% (Brugha et al., 2004; Compton et al., 2006; Kessler et al., 2005; Mojtabai et al., 2011). In addition, studies from a number of countries have investigated whether increases in antidepressant use have affected national suicide rates (Baldessarini et al., 2007). However, the findings from these studies have been inconsistent.
In conclusion, the present data and those from other similar studies present a challenge in that they show no evidence of improvement in mental health in Australia in recent years. There is a need for governments to support regular population monitoring of mental health, just as they support the collection of mortality data, in order to identify emerging needs and to evaluate the impact of service improvements and preventive programmes.
Footnotes
Acknowledgements
Marie Yap provided helpful comments on the paper.
Funding
The study was funded by the Australian Government Department of Health and Ageing. The authors receive salary support from the National Health and Medical Research Council. Orygen Youth Health Research Centre is supported by the Colonial Foundation.
Declaration of Interest
The authors report no conflicts of interest. The authors alone are responsible for the content and writing of the paper.