
Abstract
Background
As cortisol and metanephrine are involved in the stress response, it is often recommended that individuals are relaxed at the time of venepuncture, however, evidence behind these recommendations is lacking. We investigated the effects of acute psychological stress on serum cortisol and plasma metanephrine concentrations in healthy individuals exposed to varying levels of psychological stress and compared these results to self-reported measures of stress.
Methods
Ten medical students completed two medical in-person simulations (one low-complexity, one high-complexity) in a random order. At four times, participants completed the State-Trait Anxiety Inventory (STAI) and serum cortisol and plasma metanephrine/normetanephrine were tested.
Results
Median (interquartile range) STAI prior to the low-complexity simulation was 44 (18) versus 33 (13) afterwards (P = 0.050). STAI prior to the high-complexity simulation was 33 (10) versus 48 (17) afterwards (P = 0.007). Cortisol prior to the low-complexity simulation was 272 nmol/L (115) versus 247 (115) afterwards (P = 0.333). Prior to the high-complexity simulation, cortisol was 246 (70) versus 261 (137) afterwards (P = 0.859). Metanephrine prior to the low-complexity simulation was 242 pmol/L (79) versus 247 (93) afterwards (P = 0.515). Metanephrine prior to the high-complexity simulation was 220 (81) versus 251 pmol/L (120) afterwards (P = 0.074). Normetanephrine prior to the low-complexity simulation was 593 pmol/L (247) versus 682 (281) afterwards (P = 0.047 for the difference). Normetanephrine prior to the high-complexity simulation was 696 (123) versus 705 pmol/L (224) afterwards (P = 0.169).
Conclusions
The trend in cortisol levels largely reflected changes in STAI. We outline some implications of these findings for current practice and future research.
Introduction
The laboratory measurement of cortisol and catecholamine metabolites (metanephrines) is frequently required in endocrinology practice. Cortisol estimation is necessary in the evaluation of hypo- and hyper-secretory disease states; measurement of metanephrines is undertaken in patients with suspected or proven phaeochromocytoma or paraganglioma. As with all measurands, the total testing process for such laboratory analysis can be considered in three phases: pre-analytical, analytical and post-analytical. Pre-analytical errors include inappropriate requesting, mislabelling of a sample and inappropriate patient preparation. When sampling for blood cortisol or metanephrine analysis, there are a number of additional factors to consider, particularly in relation to the timing of the sample for cortisol (given the normal circadian rhythm pertaining to its release) and the avoidance of various medications and foodstuffs for metanephrines (due to effects on secretion and interferences with analysis). Given that both cortisol and metanephrines are involved in the body’s response to ‘stress’, it is often recommended that individuals are in a relaxed state at the time of venepuncture when these tests are being performed.
For cortisol analysis, very few studies have investigated the effect of psychological stress in detail. In the psychological literature, however, cortisol is sometimes measured as a surrogate marker of psychological stress. For example, one group showed that a cognitive behavioural stress management intervention could lower cortisol after many months. 1 In a more acute setting, Raff et al. investigated the effects of watching a sporting event on cortisol, one and 9 hours after a match, and report that even though the event triggered a high level of excitement in 15 individuals (all of whom where fans of one of the teams playing), all but one had no significant change in cortisol. 2 Some authors therefore feel that the importance of relaxing an individual prior to sampling may have been exaggerated. 3 Even if phlebotomists try to minimise the effects of stress on sampling, there is very little helpful guidance on how to do this effectively. 4 Although being measured in a different matrix, salivary cortisol may be lower if measured at midnight in an asleep and ‘unstressed’ individual. 5 Newell-Price et al. (1995) recommend testing midnight cortisol within five to 10 minutes of waking or by collecting blood via an indwelling catheter, with the catheter being a requirement for children. 6 Others recommend that checking a sleeping midnight cortisol requires inpatient admission for at least 48 hours to avoid false-positive responses due to the stress of hospitalisation. 7
False elevations of plasma metanephrines are particularly problematic as affected individuals will often be subjected to more invasive testing for a catecholamine secreting tumour. Eisenhofer reports that continuous stressful daily activity and mental stress/anxiety can exert a weakly positive influence on metanephrine and a mild influence on normetanephrine. 8 Goldstein et al. report than performing a mental challenge increases norepinephrine release, but that regional changes in blood flow may mean that such changes are not reflected in blood collected from a peripheral vein. 9 It has also been shown that insertion of an intravenous cannula causes no meaningful change in metanephrine concentrations over a period of 2 hours, implying that there is no problem with immediate sampling after needle insertion. 10
In this study, we sought to investigate the effects of acute psychological stress on serum cortisol and plasma metanephrine concentrations in healthy individuals exposed to varying levels of psychological stress. We additionally sought to compare these results to self-reported measures of experienced stress. We have previously articulated how medical simulation environments have excellent potential for studying, in a controlled way, human stress responses, 11 so in this study utilised medical simulation scenarios of varying difficulty as a novel means of inducing stress in a controlled and graded way in a group of healthy medical students.
Methods
Participants
Students in the final year of the undergraduate medical programme at Queen’s University Belfast (QUB) were invited to take part. The study was conducted in a Highly Immersive Virtual Environment (HIVE) known as ‘The Cave’, within the KN Cheung SK Chin InterSim Centre (a purpose-built state of the art healthcare simulation facility at QUB). The Cave employs a multi-projector system that casts panoramic footage onto the surrounding walls, creating a high-fidelity visual simulation of a chosen environment (in this case an inpatient hospital bay). In addition, audio can also be played to create a soundscape of a hospital environment. The study was approved by the University Faculty of Medicine, Health and Life Sciences research ethics committee (Ref: MHLS 22_67). As an exploratory study, we aimed to recruit 20 participants.
Exclusion criteria
To minimise effects on measurands, participants were excluded from the study if they were taking medications that can affect autonomic nervous system activity and/or immune system responsivity, namely: tricyclic antidepressants, selective serotonin reuptake inhibitors, serotonin/noradrenaline reuptake inhibitors, α-adrenergic receptor blockers, β-adrenergic receptor blockers, calcium-channel blockers, monoamine-oxidase inhibitors, dopa-related drugs, stimulant/sympathomimetic drugs or oral oestrogen. Due to the impact of caffeine, exercise, and certain foods on the autonomic nervous system (ANS), participants were asked to refrain from consuming caffeine-containing food items, as well as participation in vigorous exercise, for 12 hours prior to the study.
Study design
Participants completed their involvement in the study during one visit, conducted between 09:00 and 12:00 to minimise the effects of diurnal variation. The study used a prospective, randomised, cross-over design. Participants completed two medical simulations (one low-complexity, one high-complexity) in a random order, in an attempt to subject them to a low-stress and a high-stress stimulus. Participants took on the role of a qualified doctor during the scenarios. A stratified randomisation program was designed and used to determine which simulation participants undertook first. The low-complexity scenario involved participants treating a patient suffering from a mild asthma exacerbation; the high-complexity scenario involved participants treating a patient suffering from life-threatening asthma. The same two facilitators ran all the scenarios by taking on the role of a simulated nurse who portrayed patient distress and conveyed a sense of urgency by following a loose script that followed the same course for each participant. Those in group A began with the low-complexity simulation, whereas those in group B began with the high-complexity simulation.
Psychological evaluation
Participants completed the State-Trait Anxiety Inventory (STAI) at four time points during the study to capture a measure of experienced stress before and after each simulation. The STAI is a validated 40-item questionnaire evaluating the current state/trait anxieties of an individual and was selected as a measure of subjective stress due to its successful use in studies investigating the impact of stressful environments on self-reported stress.12–15
Biochemical evaluation
Venepuncture was performed from the antecubital fossa with subjects in the seated position at four time points during the study; an indwelling catheter was not employed. The phlebotomist was an experienced operator, and all samples but one were obtained on the first pass of the needle; on one occasion a second pass was required. 4 mL venous blood was collected into a tube with clot activator (for serum cortisol analysis) and 4 mL venous blood into a tube containing ethylenediaminetetraacetic acid (EDTA) (for plasma metanephrines analysis) on each venepuncture. Samples were transported to the local hospital (Belfast Health and Social Care Trust) laboratory within 2 hours; cortisol samples were kept at room temperature, metanephrine samples were kept on ice in an insulated box. Cortisol samples were analysed on the day of collection on a Cobas C8000 analyser using an electrochemiluminescence immunoassay (Roche Diagnostics Ltd, Burgess Hill, UK). The in-house analytical coefficient of variation (CV) for cortisol at similar levels to those measured here is 1.3%. Metanephrine samples were frozen at −20°C and transferred to a referral laboratory (Newcastle upon Tyne Hospitals NHS Foundation Trust) where analysis was performed using high performance liquid chromatography-tandem mass spectrometry (HPLC-MS/MS). Both laboratories utilised are UKAS-accredited, and the sample handling and analytical methods used mimic those in routine use for patient management in this locality. The in-house analytical coefficient of variation (CV) for metanephrine and normetanephrine at similar levels to those measured here is 8.4% and 9.1%, respectively. Samples were analysed once only on the day of collection; there was no batching of samples.
Order of events
This is illustrated in Figure 1. Participants were asked to complete the STAI after arrival in the department. Venepuncture was then undertaken. The participant was then directed to the simulation room and began their first simulation. Immediately after simulation one, participants again completed the STAI, and venepuncture was performed. Participants were then debriefed by the researcher who completed the simulation. Participants were then allocated a private room and asked to remain seated for a fifteen-minute intermission period. On completion of the intermission period, participants completed the STAI and venepuncture was performed. Participants then engaged in their second simulation. Immediately after this, they again completed the STAI, and blood was drawn. Flow diagram showing order of events.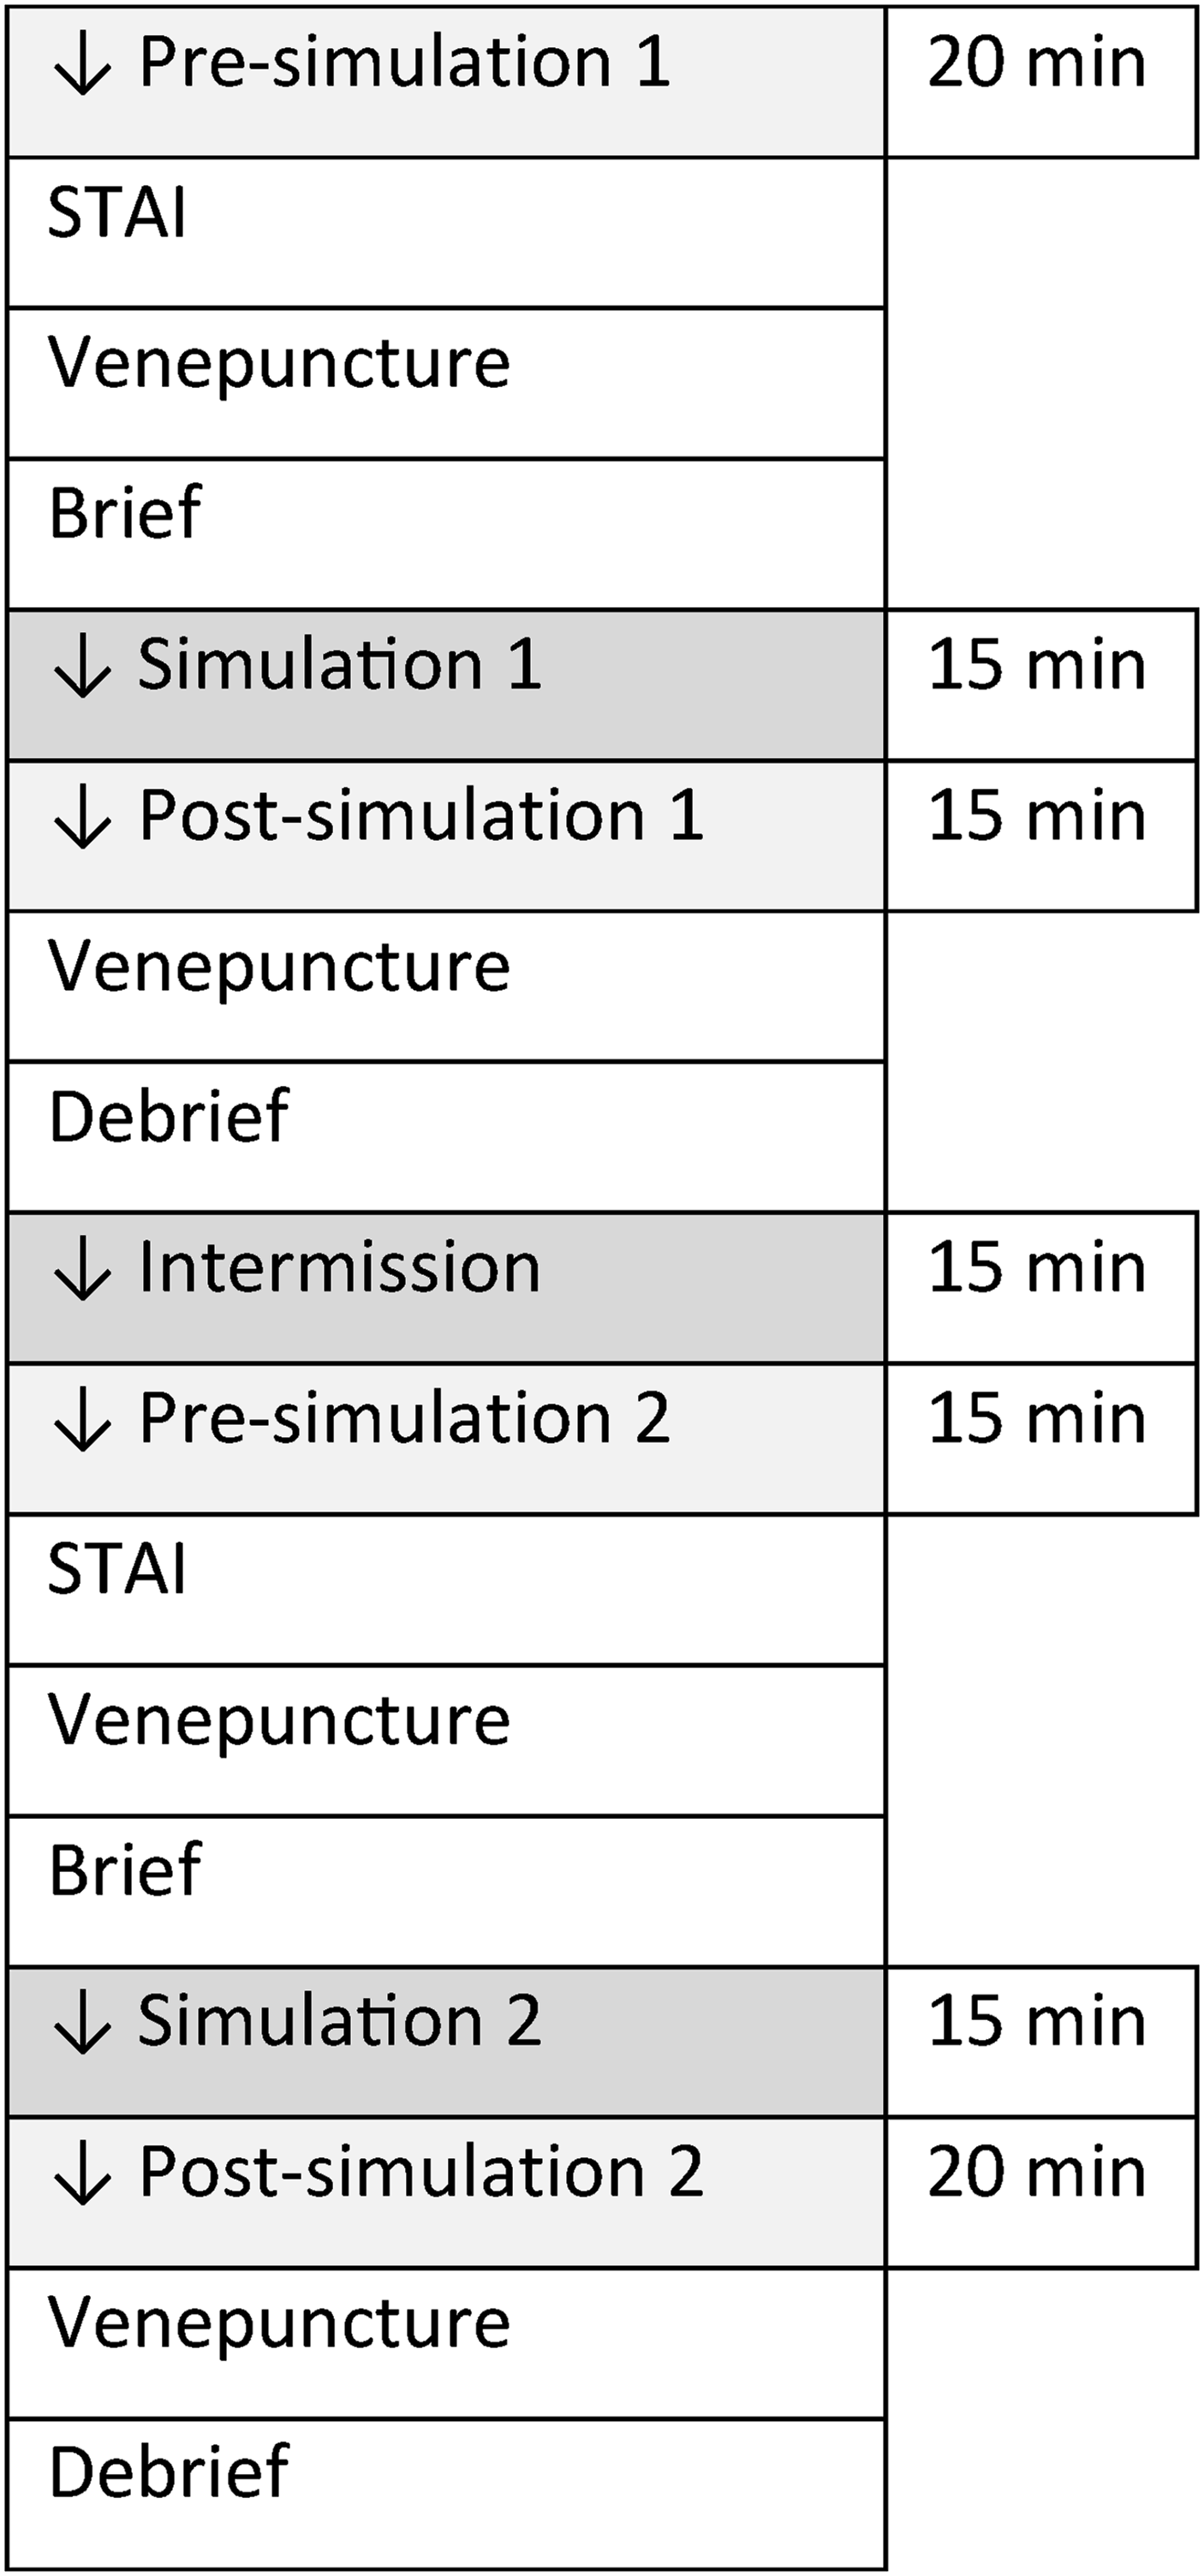
Statistical analysis
Data analyses included descriptive statistics and Wilcoxon signed-rank tests – which were conducted to assess median differences between data obtained for low- and high-complexity simulations. P values less than 0.05 were considered to indicate statistical significance; all tests were two-tailed. Analyses were performed using SPSS/PC (Version 27, SPSS Inc., Chicago, USA).
Results
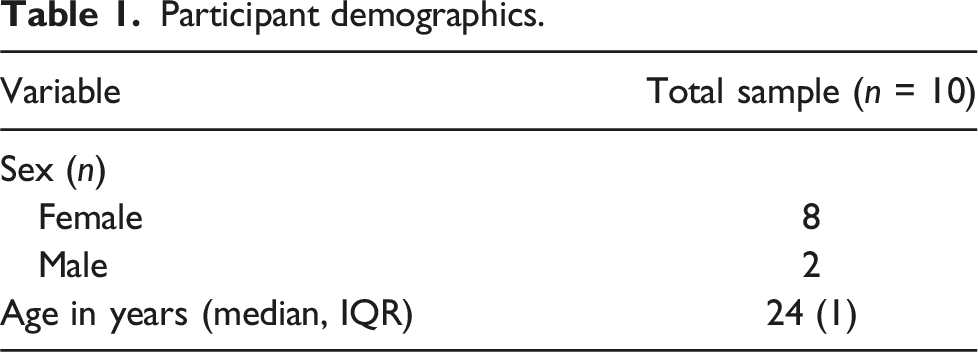
Participants
Participant demographics.
Results before and after simulations, organised by order of complexity (IQR, Interquartile Range). Group a performed the low-followed by high-complexity simulation. Group B performed the high-followed by the low-complexity simulation.
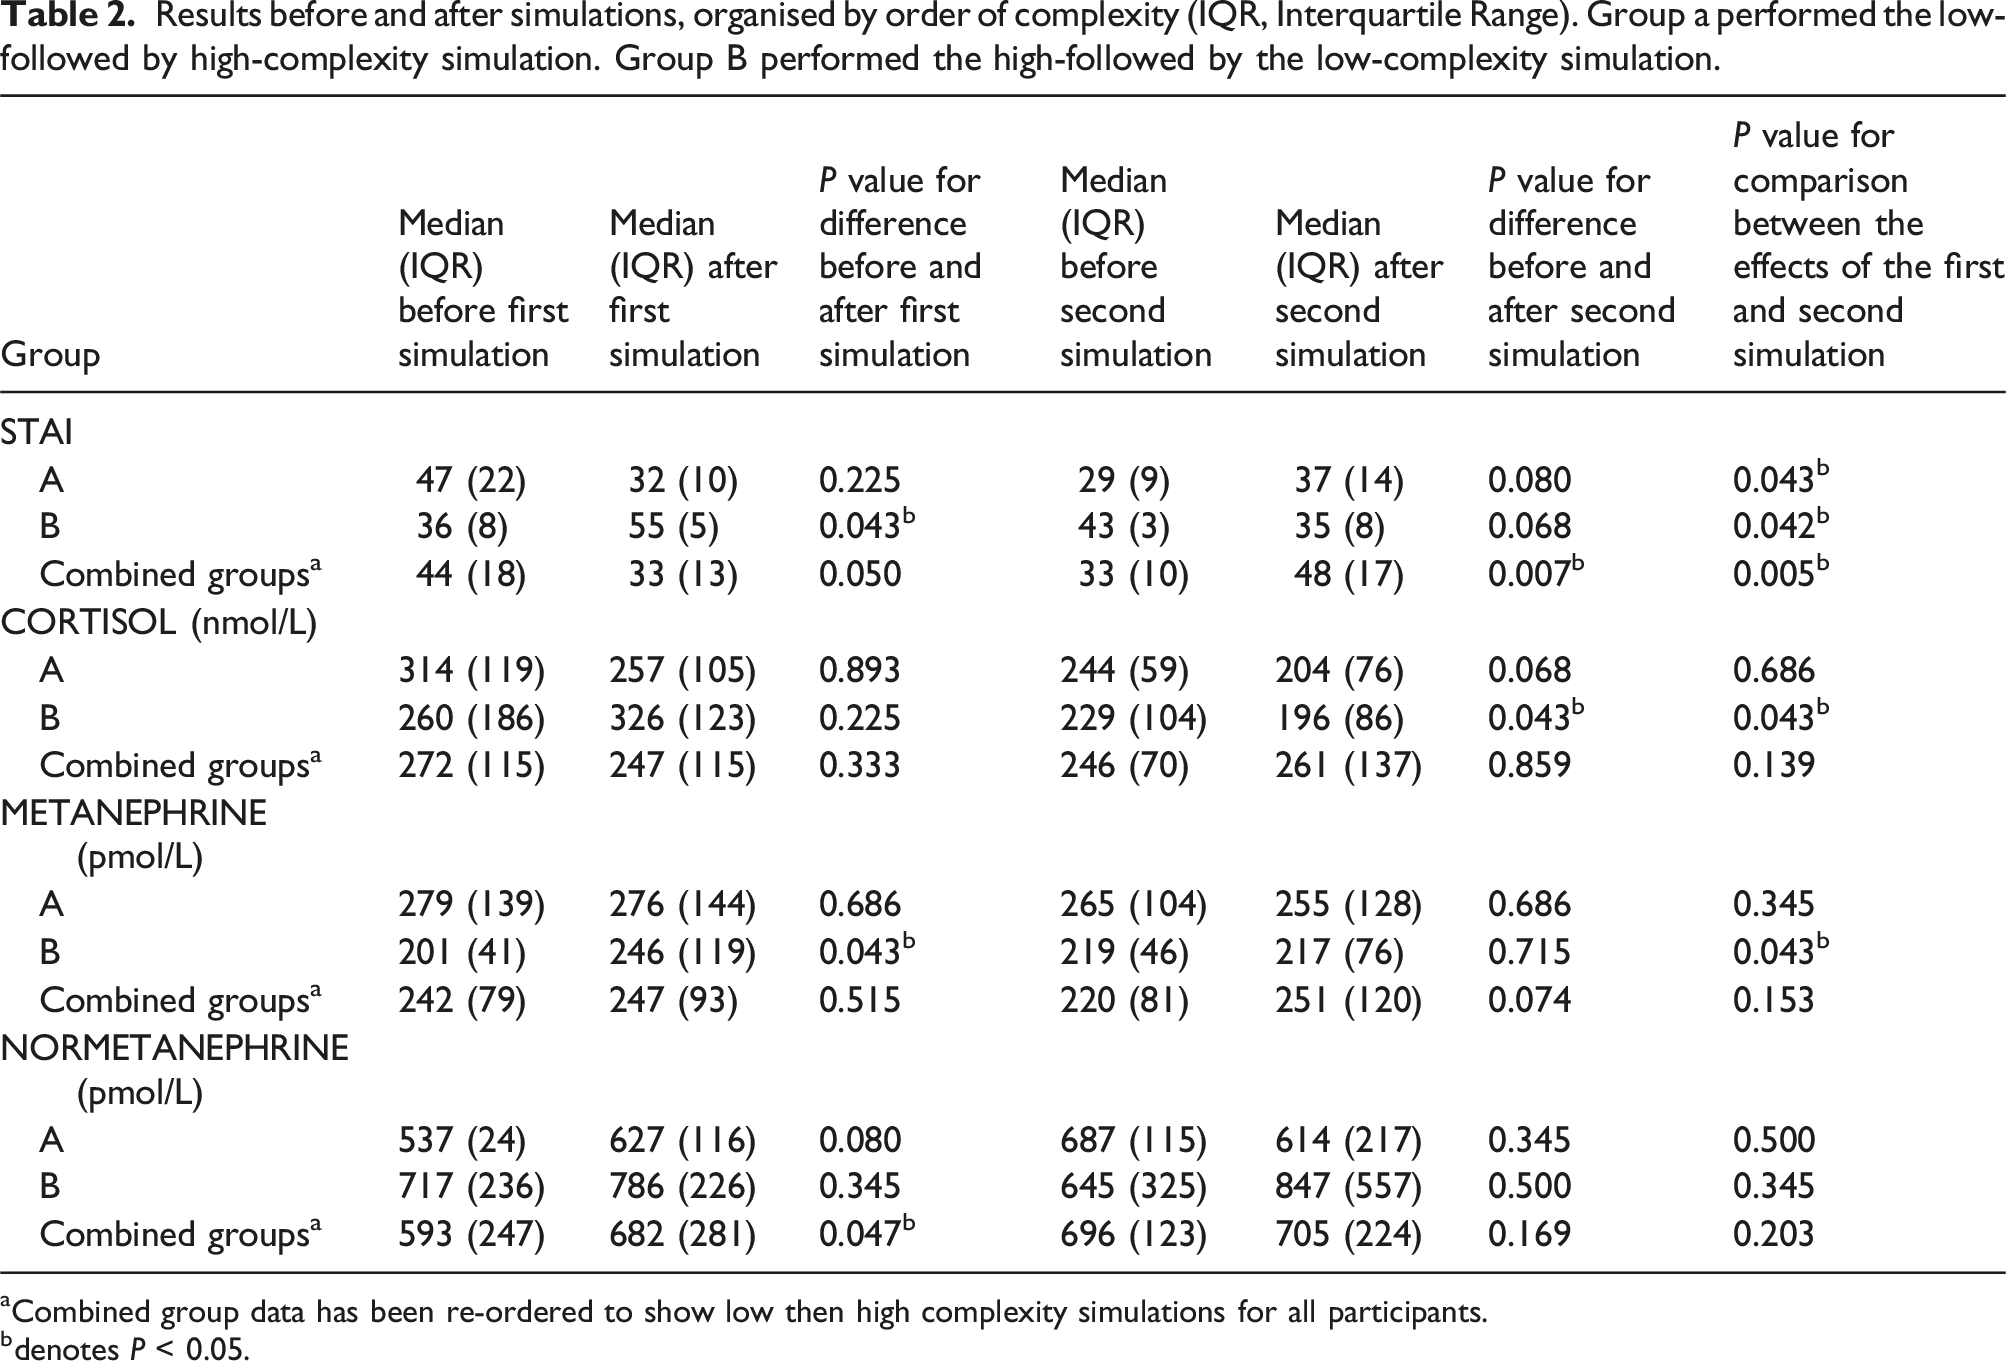
aCombined group data has been re-ordered to show low then high complexity simulations for all participants.
bdenotes P < 0.05.
Psychological measures
For group A (low-complexity simulation first, high-complexity simulation second), median (interquartile range) STAI prior to the low-complexity simulation was 47 (22) versus 32 (10) afterwards (P = 0.225 for the difference). STAI prior to the high-complexity simulation was 29 (9) versus 37 (14) (P = 0.00.08 for the difference). The change in STAI (delta) brought about by the two simulations was significantly different in this group (P = 0.043).
For group B (high-complexity simulation first, low-complexity simulation second), median (interquartile range) STAI prior to the high-complexity simulation was 36 (8) versus 55 (5) afterwards (P = 0.043 for the difference). STAI prior to the low-complexity simulation was 43 (3) versus 35 (8) afterwards (P = 0.068 for the difference). The change in STAI (delta) brought about by the two simulations was significantly different in this group (P = 0.042).
Combining both groups, median (interquartile range) STAI prior to the low-complexity simulation was 44 (18) versus 33 (13) afterwards (P = 0.050 for the difference). STAI prior to the high-complexity simulation was 33 (10) versus 48 (17) afterwards (P = 0.007 for the difference). The change in STAI (delta) brought about by the two simulations was significantly different in this group (P = 0.005).
Biochemical analysis
Cortisol
For group A (low-complexity simulation first, high-complexity simulation second), median (interquartile range) cortisol prior to the low-complexity simulation was 314 nmol/L (119 nmol/L) versus 257 nmol/L (105 nmol/L) afterwards (P = 0.893 for the difference). Cortisol prior to the high-complexity simulation was 244 nmol/L (59 nmol/L) versus 204 nmol/L (76 nmol/L) afterwards (P = 0.068 for the difference).
For group B (high-complexity simulation first, low-complexity simulation second), median (interquartile range) cortisol prior to the high-complexity simulation was 260 nmol/L (186 nmol/L) versus 326 nmol/L (123 nmol/L) afterwards (P = 0.225 for the difference). Cortisol prior to the low-complexity simulation was 229 nmol/L (104 nmol/L) versus 196 nmol/L (86 nmol/L) afterwards (P = 0.043 for the difference). The change in cortisol (delta) brought about by the two simulations was significantly different in this group (P = 0.043).
Combining both groups, median (interquartile range) cortisol prior to the low-complexity simulation was 272 nmol/L (115 nmol/L) versus 247 nmol/L (115 nmol/L) afterwards (P = 0.333 for the difference). Prior to the high-complexity simulation, cortisol was 246 nmol/L (70 nmol/L) versus 261 nmol/L (137 nmol/L) afterwards (P = 0.859 for the difference).
Metanephrine
For group A (low-complexity simulation first, high-complexity simulation second), median (interquartile range) metanephrine prior to the low-complexity simulation was 279 pmol/L (139 pmol/L) versus 276 pmol/L (144 pmol/L) afterwards (P = 0.686 for the difference). Metanephrine prior to the high-complexity simulation was 265 pmol/L (104 pmol/L) versus 255 pmol/L (128 pmol/L) afterwards (P = 0.686 for the difference).
For group B (high-complexity simulation first, low-complexity simulation second), median (interquartile range) metanephrine prior to the high-complexity simulation was 201 pmol/L (41 pmol/L) versus 246 pmol/L (119 pmol/L) afterwards (P = 0.043 for the difference). Metanephrine prior to the low-complexity simulation was 219 pmol/L (46 pmol/L) versus 217 pmol/L (76 pmol/L) afterwards (P = 0.715 for the difference). The change in metanephrine (delta) brought about by the two simulations was significantly different in this group (P = 0.043).
Combining both groups, median (interquartile range) metanephrine prior to the low-complexity simulation was 242 pmol/L (79 pmol/L) versus 247 pmol/L (93 pmol/L) afterwards (P = 0.515 for the difference). Metanephrine prior to the high-complexity simulation was 220 pmol/L (81 pmol/L) versus 251 pmol/L (120 pmol/L) afterwards (P = 0.074 for the difference).
Normetanephrine
For group A (low-complexity simulation first, high-complexity simulation second), median (interquartile range) normetanephrine prior to the low-complexity simulation was 537 pmol/L (24 pmol/L) versus 627 pmol/L (116 pmol/L) afterwards (P = 0.080 for the difference). Normetanephrine prior to the high-complexity simulation was 687 pmol/L (115 pmol/L) versus 614 pmol/L (217 pmol/L) afterwards (P = 0.345 for the difference).
For group B (high-complexity simulation first, low-complexity simulation second), median (interquartile range) normetanephrine prior to the high-complexity simulation was 717 pmol/L (236 pmol/L) versus 786 pmol/L (226 pmol/L) afterwards (P = 0.345 for the difference). Normetanephrine prior to the low-complexity simulation was 645 pmol/L (325 pmol/L) versus 847 pmol/L (557 pmol/L) afterwards (P = 0.500 for the difference).
Combining both groups, median (interquartile range) normetanephrine prior to the low-complexity simulation was 593 pmol/L (247 pmol/L) versus 682 pmol/L (281 pmol/L) afterwards (P = 0.047 for the difference). Normetanephrine prior to the high-complexity simulation was 696 pmol/L (123 pmol/L) versus 705 pmol/L (224 pmol/L) afterwards (P = 0.169 for the difference).
Combined findings
Psychological and biochemical data were normalised to allow visual comparison of trends during the study. Figure 2(a) depicts normalised data for participants in group A (low-complexity simulation first, high-complexity simulation second). Figure 2(b) depicts normalised data for participants in group B (high-complexity simulation first, low-complexity simulation second). (a): Normalised median values of five participants from the group A (low-complexity simulation first, high-complexity simulation second). Error bars signify 1st and 3rd quartiles. To ‘normalise’ biochemical data, serum cortisol values were divided by 5, plasma metanephrine values were divided by 3.5, and plasma normetanephrine values were divided by 5.5. STAI values did not require mathematical manipulation. Cort = cortisol, Met = metanephrine, Nmet = normetanephrine, STAI = State-Trait Anxiety Inventory. A = before first simulation, B = after first simulation, C = before second simulation, D = after second simulation and (b): Normalised median values of five participants from the group B (high-complexity simulation first, low-complexity simulation second). Error bars signify 1st and 3rd quartiles. To ‘normalise’ biochemical data, serum cortisol values were divided by 5, plasma metanephrine values were divided by 3.5, and plasma normetanephrine values were divided by 5.5. STAI values did not require mathematical manipulation. Cort = cortisol, Met = metanephrine, Nmet = normetanephrine, STAI = State-Trait Anxiety Inventory. A = before first simulation, B = after first simulation, C = before second simulation, D = after second simulation. * represents P < 0.05 versus the preceding value.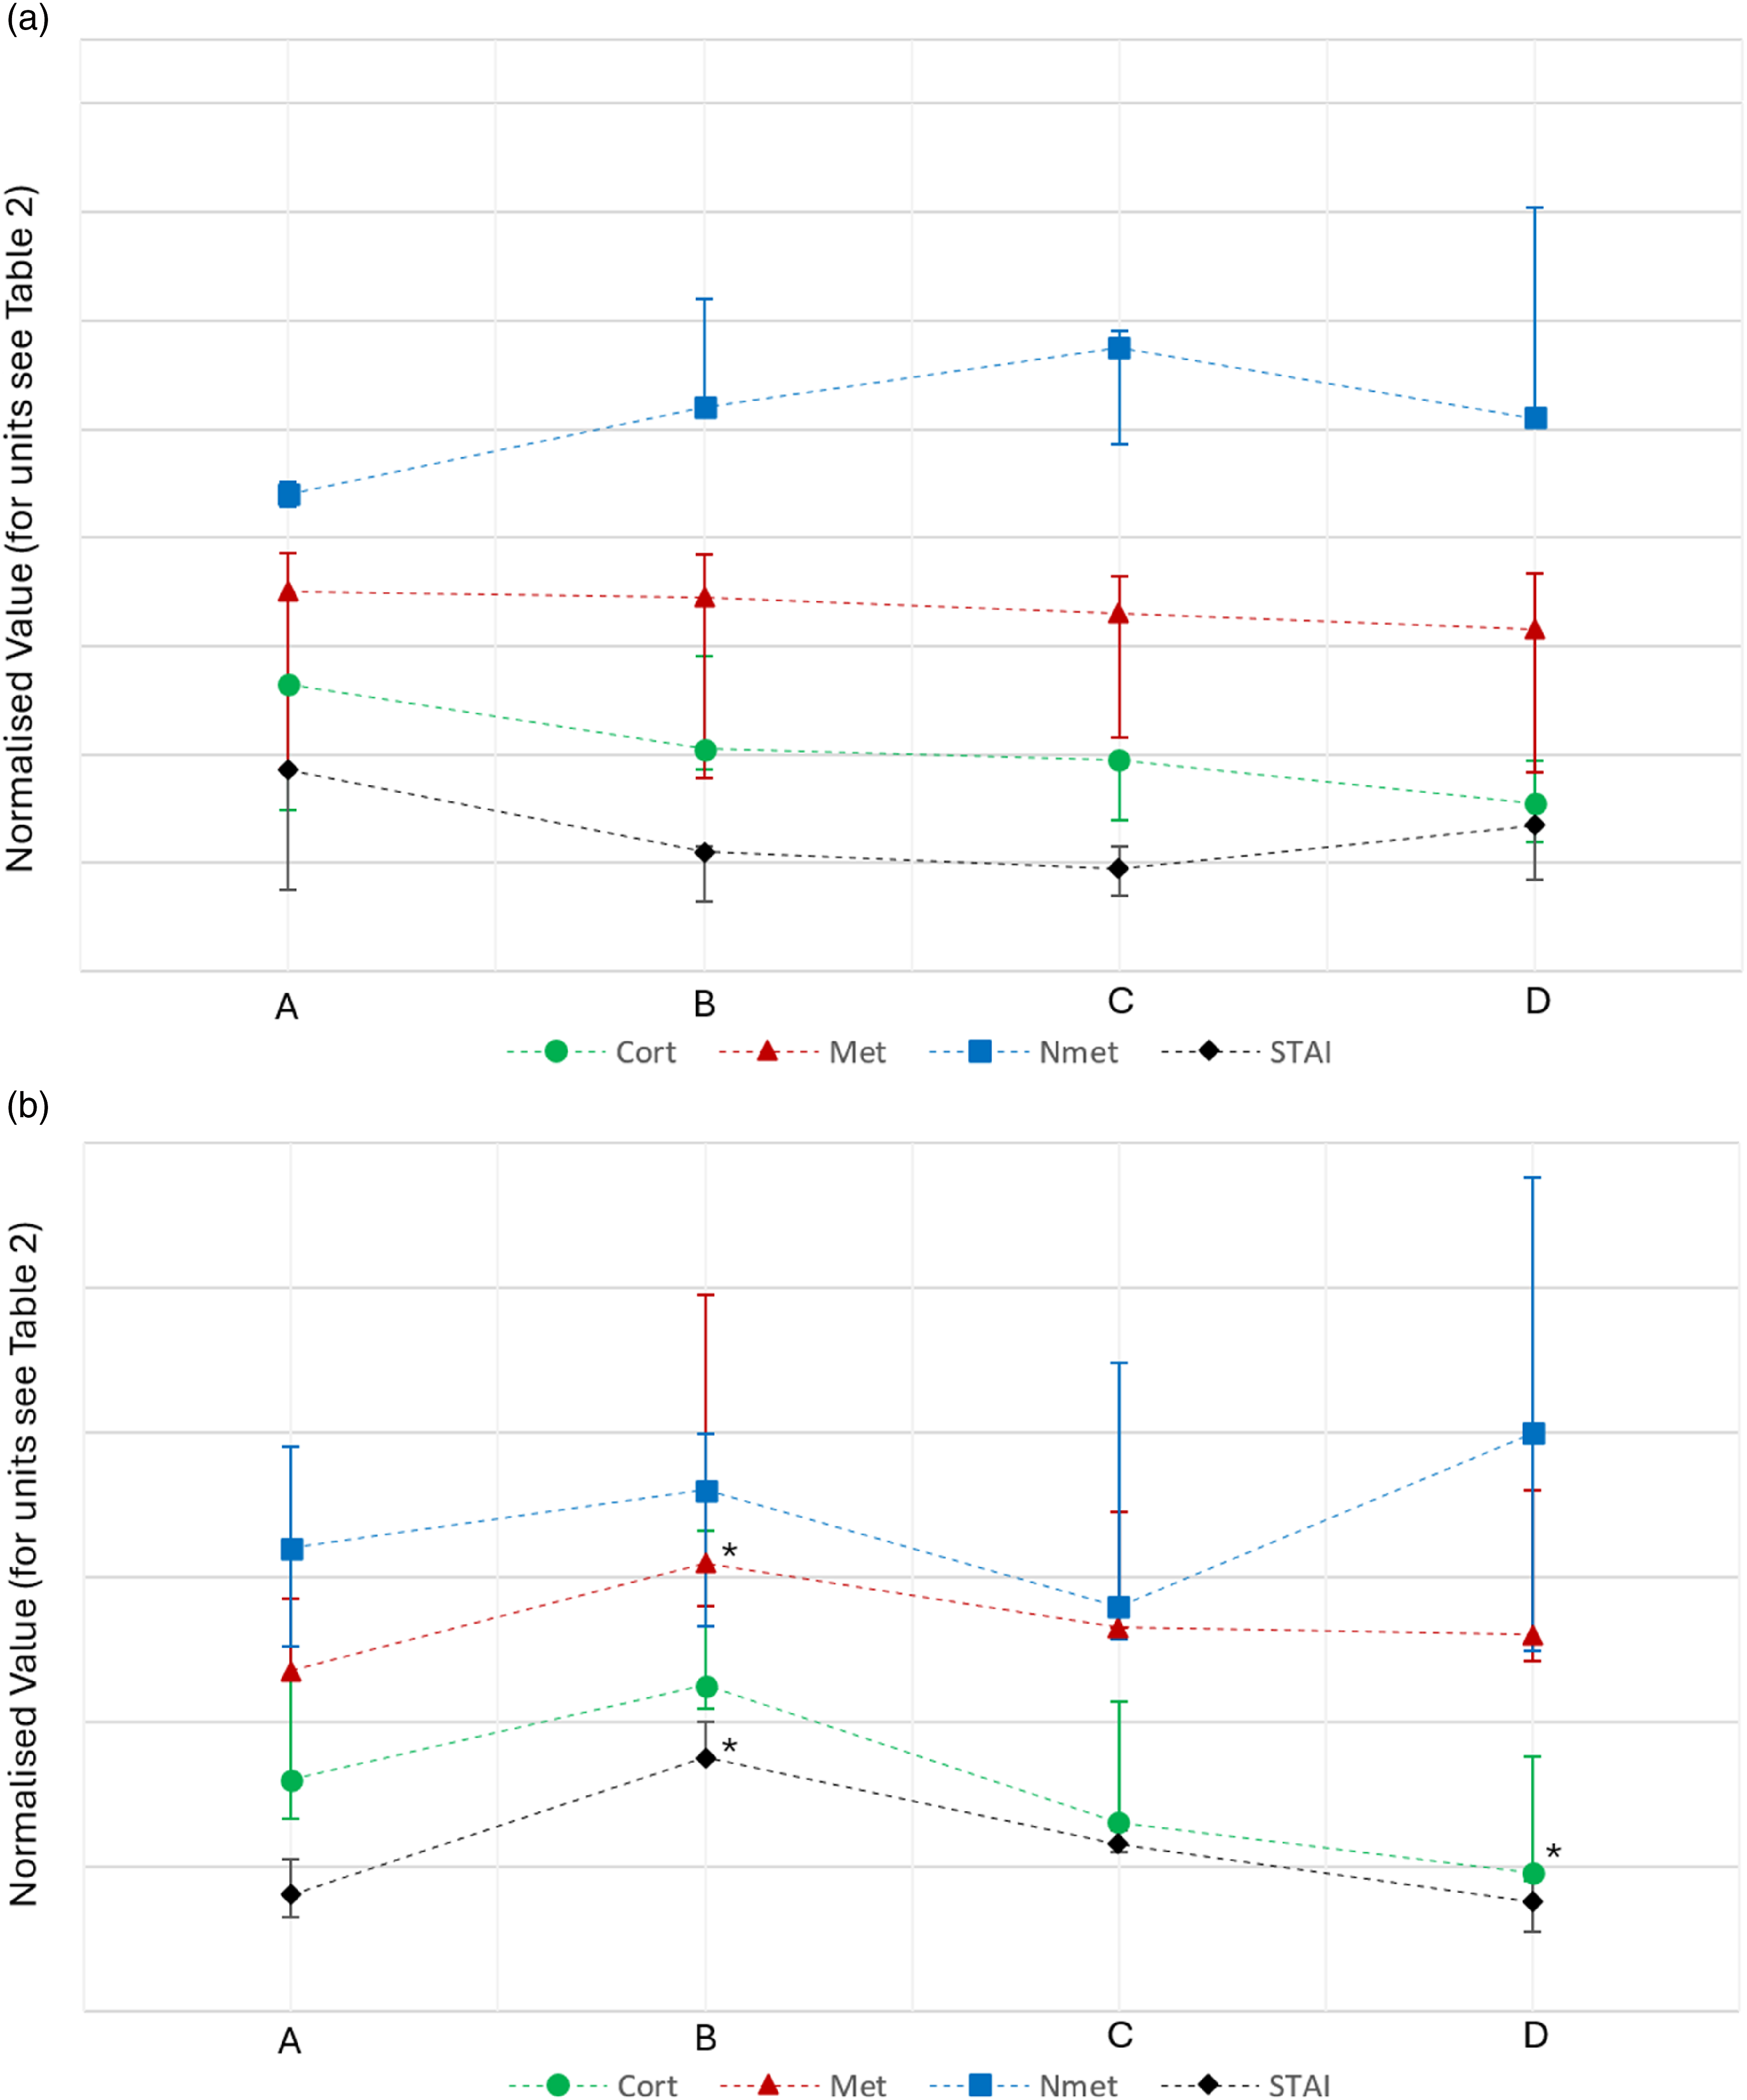
Discussion
It is crucial to acknowledge the limitations of our study, particularly the low sample size, which was a result of stringent inclusion criteria, the exploratory nature of our research and the need to terminate the study early on account of two of the participants having metanephrine results outside the reference range. While this limits the generalisability of our findings, the trends observed offer valuable insights into the complex dynamics of stress responses. The authors fully accept that the patterns observed in the hormones measured should be interpreted with caution, and the detailed discussion that follows must be read with this in mind. Future studies with larger cohorts and varied designs are necessary to further elucidate the intricate relationships between psychological and biochemical responses to stress. Furthermore, we acknowledge the potential of a carry-over effect between the two simulations carried out. We aimed to minimise this by having a 15 min intermission; longer than this may have introduced further complicating factors when interpreting cortisol results due to diurnal rhythm.
Our findings suggest that the experimental setup was successful in inducing psychological stress in a graded manner, as evidenced by the significant increases in STAI scores following high-complexity simulations in both group B (who tackled the high-complexity simulation first) and the composite of all 10 students treated together. Significant differences between the effects of the simulations were detected in both groups. This effect was more pronounced when participants were ‘thrown in at the deep end’ with high-complexity simulations first, leading to a notable increase in STAI scores compared to when they started with low-complexity simulations. This pattern could indicate that initial exposure to high-stress scenarios primes participants for a heightened stress response, aligning with the notion that first impressions or initial conditions can strongly influence psychological outcomes.16,17 It is also interesting that STAI scores fell after the low-complexity situation, albeit non-significantly. This seems to be in keeping with a ‘calming down’ effect.
Our findings on cortisol dynamics offer intriguing insights, albeit not achieving statistical significance. Notably, the direction of change in cortisol levels, although varied, showed a trend largely reflective of changes in STAI scores. For instance, in Group B, where participants first underwent the high-complexity simulation, a non-significant increase in cortisol was noted after the first simulation, followed by a significant decrease after the second simulation, following the trends seen in STAI scores. However, this was not always the case as cortisol levels fell in group A following their second simulation even though STAI scores increased. This discrepancy highlights the complex interplay between perceived psychological stress and physiological responses. We acknowledge that a degree of the variation in cortisol observed in this experiment may reflect diurnal variation during the course of the study. To minimise this, the duration of the study was kept to a minimum for each participant (see Figure 1).
The implications of these findings are twofold. First, they suggest that with a sufficiently powered study, significant relationships might be uncovered. The lack of statistical significance in our results may be attributed to our small sample size rather than a definitive lack of correlation. Therefore, future studies should consider a larger cohort to explore these dynamics more robustly. Such research could provide clearer evidence to support or refute the use of serum cortisol as a reliable biomarker of acute psychological stress. Secondly, the observed trends suggest that cortisol measurements may still hold value in clinical practice, particularly in contexts where understanding a patient’s stress response is crucial. Given the variability in cortisol responses, it would be prudent for future research to also consider factors such as individual differences in stress reactivity, the time of day, and the conditions under which cortisol is sampled. While our study does not establish a clear-cut relationship between cortisol levels and psychological stress, it opens the door for further investigation into how this biomarker might be effectively utilised in both research and clinical settings. The nuanced understanding that emerges from such studies could significantly enhance our ability to assess and manage stress-related conditions, paving the way for more targeted and effective interventions.
The behaviour of metanephrine largely mirrored that of cortisol, with minimal significant changes observed throughout the simulations. Of note, the group that was subjected to the high-complexity simulation first exhibited a significant rise in metanephrine as a result of the exercise. Again, we acknowledge the small number of participants and are cautious not to read into these results overly. Taken at face value, however, this parallel trend further complicates our understanding of the biochemical underpinnings of stress, suggesting a potential buffering or regulatory mechanism at play that maintains metanephrine levels even under varying stress conditions. 18 Given the consistent pattern between cortisol and metanephrine responses, our study reinforces the complexity of the stress response system, which may not always align straightforwardly with psychological stress markers. The only significant change in normetanephrine was unexpected: levels were seen to rise after the low-complexity simulation in the pooled group.
The observed attenuation of biochemical stress responses following initial ‘priming’ with a low-complexity simulation suggests a potential strategy for clinical settings where stress measurements are critical. For instance, a preliminary non-invasive procedure or a preparatory session could be used to reduce the impact of acute stress on biochemical measurements subsequently taken for diagnostic purposes. Additionally, close monitoring of both psychological and biochemical markers during stress assessments could provide a more comprehensive understanding of an individual’s stress response, which could be crucial for accurate diagnosis and management of stress-related conditions. 19
Although the study numbers are low and generalisability of these findings is impossible, the results are nonetheless very interesting. Self-reported anxiety changed in an entirely predictable manner during the experiment and, in fact, undertaking a low-stress task seemed to exert a calming influence. Changes in cortisol tended to mimic changes in anxiety. This raises the possibility of asking individuals to evaluate their anxiety levels prior to venepuncture for cortisol analysis, and only performing venepuncture when they are in a relatively calm state. In contrast, no consistent significant findings were observed in the measures of metanephrine and normetanephrine. It is probable that an individual’s precise biochemical response to stress is nuanced and determined by a variety of factors including genetic predisposition, personal experiences, overall health, and sleep patterns. For example, genetic variations may influence how cortisol is synthesised and metabolised, potentially affecting an individual’s sensitivity to stress. Experiences, such as previous exposure to stressful situations, can also alter physiological stress responses, possibly through mechanisms like sensitisation or desensitisation. 20 General health status or the presence of chronic conditions can alter the baseline and reactive levels of stress hormones. Additionally, sleep quality and duration have been shown to impact cortisol rhythms and stress reactivity. 21 In practical terms, when collecting blood in clinical settings for these measurands, a ‘one size fits all’ approach is likely to be overly simplistic. Whilst some individuals might benefit from a period of acclimatisation, others may not. The paucity of evidence in this area is testament to the difficulty of performing stress-inducing experiments in a controlled manner, but we have additionally demonstrated in this study that a medical simulation environment is ideally suited to this task.
Using the locally calculated uncertainty of measurement values for the assays used in this work (2.74% for cortisol, 16.5% for metanephrine and 17.8% for normetanephrine), the statistically significant changes here reported could theoretically correspond with a maximal potential delta change of −19% for cortisol (group B, comparing before and after the second simulation), +71% for metanephrine (group B, comparing before and after the first simulation) and +65% for normetanephrine (combined groups, comparing before and after the first simulation). The assessment of true change normally relies on the comparison of observed change with calculated reference change values (RCVs). We acknowledge that in this study, the changes observed do not exceed the RCV. However, reliance on this threshold is problematic here because of the fact that RCVs are partially dependent on biological coefficient of variation. Very large biological coefficients of variation have been reported for measurands examined in this study (e.g. 32% for normetanephrine 22 and 13% for cortisol 23 ), presumably partly because of the pre-analytical issue that this study was set up to examine (‘stress' in the examined subject). It is hoped that follow-on work in this field will pave the way for a reduction in pre-analytical intra-individual variability and a reduction in this measure of variation.
Footnotes
Acknowledgements
The authors gratefully acknowledge the participants who took part in the study and the contributions of Dr Gary McKeown who provided general support.
Declaration of conflicting interests
The author(s) declared no potential conflicts of interest with respect to the research, authorship, and/or publication of this article.
Funding
The author(s) disclosed receipt of the following financial support for the research, authorship, and/or publication of this article: This work was supported by the Northern Ireland Department for the Economy PhD Studentship.
Ethical approval
The ethics committee of Queen’s University Belfast Faculty of Medicine, Health and Life Sciences approved this study (Ref: MHLS 22_67).
Guarantor
PH.
Contributorship
All authors researched literature and conceived the study. AV and PH were involved in protocol development, gaining ethical approval, patient recruitment and data analysis. AV wrote the first draft of the manuscript. All authors reviewed and edited the manuscript and approved the final version of the manuscript.