
Abstract
Background
Clinical laboratories frequently implement the same tests and internal quality control (QC) rules on identical instruments. It is unclear whether individual QC targets for each analyser or ones that are common to all instruments are preferable. This study modelled how common QC targets influence assay error detection before examining their effect on real-world data.
Methods
The effect of variable bias and imprecision on error detection and false rejection rates when using common or individual QC targets on two instruments was simulated. QC data from tests run on two identical Beckman instruments (6-month period, same QC lot, n > 100 points for each instrument) determined likely real-world consequences.
Results
Compared to individual QC targets, common targets had an asymmetrical effect on systematic error detection, with one instrument assay losing detection power more than the other gained. If individual in-control assay standard deviations (SDs) differed, then common targets led to one assay failing QC more frequently. Applied to two analysers (95 QC levels and 45 tests), common targets reduced one instrument’s error detection by ≥ 0.4 sigma on 15/45 (33%) of tests. Such targets also meant 14/45 (31%) of assays on one in-control instrument would fail over twice as frequently as the other (median ratio 1.62, IQR 1.20–2.39) using a 2SD rule.
Conclusions
Compared to instrument-specific QC targets, common targets can reduce the probability of detecting changes in individual assay performance and cause one in-control assay to fail QC more frequently than another. Any impact on clinical care requires further investigation.
Introduction
The internal quality control (QC) processes recommended for clinical laboratories to ensure analytical quality have largely been designed with a single instrument in mind. However, for service capacity and resilience purposes, many laboratories implement the same tests on two or more identical instruments but whose analytical performance can nonetheless be slightly different, even with the same reagents and calibrators. 1 How the internal QC of these multiple instruments should best be managed is recognized as an important research question, 2 but one where the most appropriate answer is still not clear. 1 An appealing approach is to consider the multiple analysers as a single unit (since a patient sample could feasibly be tested on any of them) and to therefore somehow combine their means and standard deviations (SDs) into common targets to be used across all instruments. Quality controlling multiple instruments in this way has four main permutations in total, namely, that any QC rule(s) be determined from either (1) individually derived means and standard deviations for each instrument, (2) use of a common, fixed mean for all instruments, but with SDs established individually, (3) use a common, fixed SD but individually determined means, or (4) use of both common fixed means and SDs for all instruments. 1
There is currently debate regarding which of these options is most preferable, with differing views and no firm consensus. Even where QC developments are more accepted, such as the use of patient-based real time QC (PBRTQC) 3 or even the well-established practice of varying the QC control rule according to the sigma of the test, 4 the QC practice of many clinical laboratories does not seem to have kept pace. This was demonstrated when a 2018 survey of 21 academic centres in the United States found that 16 solely used a ±2SD (12s) control rule for all their core chemistry and immunoassay testing and one used a 3SD rule (13s) throughout, leaving only four who had implemented any more than one rule. 5 Just one of the centres had implemented PBRTQC at that time. It therefore appears that many laboratories continue to control the day-to-day quality of their testing by simply comparing their assay performance to locally derived 2SD QC targets.
With this in mind, the current study has sought to establish how combining instrument means and SDs in different ways might influence the detection of analytical bias compared to using individual means and SDs for each instrument. The analysis takes two forms: firstly through a simulation involving two instruments and then from real-world QC data collected from two analysers performing the same tests in the same laboratory.
Methods
Simulation study
The simulation was of two theoretical instruments performing the same assay with their own mean and SD. Formulae were used to combine assay means and SDs from each instrument into a common (or combined) mean and common SD. 6 These formulae derive the same means and SDs as if the individual instruments had their QC datapoints merged into one. It was assumed that the assay workload was the same through each instrument.
Power function curves were constructed to assess the effect on systematic error detection of using common means, common SDs, or both when compared to using individual means and SDs for each analyser. 4 An arbitrary 1.5 SD difference between instrument assay means – but with the same individual assay SD – was used to illustrate this effect, as was a 1.5-fold difference between individual assay SDs when using the same assay means. For the main analysis, the number of QC run ‘samples’ was assumed to be two and the control rule 12s. Any differences when using three samples or a 13s control rule were also examined.
The data was also used to compare false detection rates, that is, the probability of detection (QC failure) when no systematic error exists.
Real-world study
The influence of using both a common mean and common SD was applied to two Beckman AU instruments which were analysing the same tests in the same laboratory with all having acceptable College of American Pathologists (CAP) Proficiency Testing performance. Individual instrument QC means and SDs for each assay were calculated from QC data collected during a 6 month period, using the same lot of QC material and where each instrument’s test had at least 100 QC results for each level. Reagent lots could change during the period, but usually any change on one instrument was joined by the other instrument soon after. Calculation of the common means and SDs used the same formulae as the simulation study but, rather than assuming the workload for a test was the same through each instrument, this time account was taken of differences in the number of QC samples tested on each instrument.
From this data, the ability of each test to identify a systematic (bias) error was calculated, by convention, as being the assay bias (expressed as a multiple of the individual QC’s SD from its own mean) whereby there would be a 90% probability of error detection (Ped = 0.90) from a single QC run. 4 This bias was calculated when applying both a 12s and 13s control rule to the individual assay QC means and SDs as well as to the combined means and SDs. Any difference between the test biases detectable by using common as opposed to individual QC targets on the same instrument was calculated as the ‘lost sigma’.
To graphically demonstrate the concept of Ped = 0.90 and ‘lost sigma’, an example of serum calcium was used from the two instruments using their individual and combined means and SDs at each of their three QC levels.
When comparing false detection rates, the ratio of the false detection rate for each test on one instrument to that of the other instrument when using combined means and SDs was calculated, with the numerator always being the highest rate.
Statistical analysis
Excel spreadsheets were used to calculate and plot each power function curve at different SD biases, based around the NORM.DIST function.
The Ped = 0.90 for the two instruments’ real-world assays were calculated by applying an increasing bias to each of the test’s two or three levels of QC (the bias being the same increasing number of single-instrument SDs respective to each QC level) until the combined probability of at least one QC failure exceeded 0.9 using either the 12s or 13s control rule. The same process – including the use of a single instrument’s QC SDs – was used to establish the Ped = 0.90 for each analyser’s tests when using common QC targets. If the bias (number of SDs) required to meet Ped = 0.90 for one instrument was greater using common than individual instrument targets, then the difference was recorded as the assay’s ‘lost sigma’.
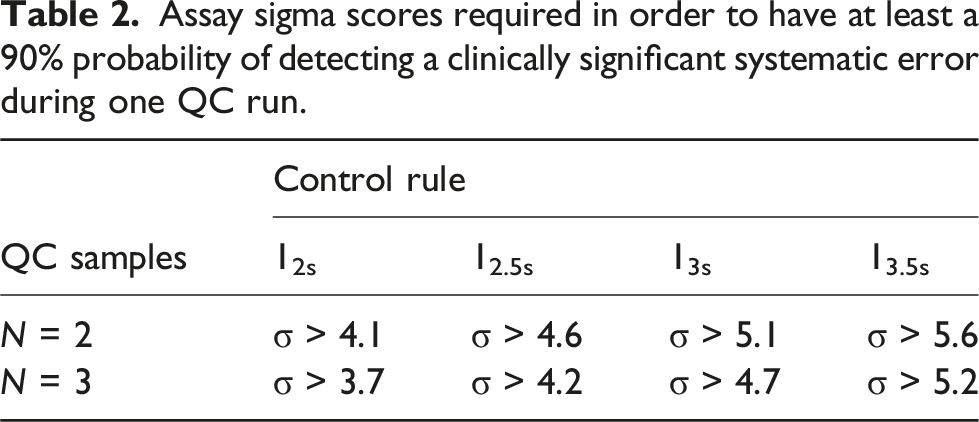
To quantify potentially significant degrees of ‘lost sigma’, the reduction in any assay’s sigma score required to either consider increasing the number of QC samples run together, for example, from 2 to 3, or tightening the control rule used, for example, from 13s to 12.5s, was calculated from the differences in respective sigma scores, each calculated as the number of SDs to achieve Ped = 0.90 + 1.65. 7
False detection rates were calculated in the simulation and real-world studies as being the probability of there being least one QC level failure when there was no assay bias, that is, when the test was performing exactly as expected.
Results
Simulation study
Figure 1 shows the effect on 12s assay error detection (n = 2 QC samples) of using both common (combined) means and common SDs (panel A), common means but individual assay SDs (panel B), and common SDs but individual assay means (panel C), compared to individual assay means and SDs when one instrument assay has a 1.5 SD mean bias compared to the other but each has identical SDs. Simulated systematic error power function curves for two instruments where one has a 1.5 SD bias, each using a 12s control rule, two control samples per QC run and individual QC targets (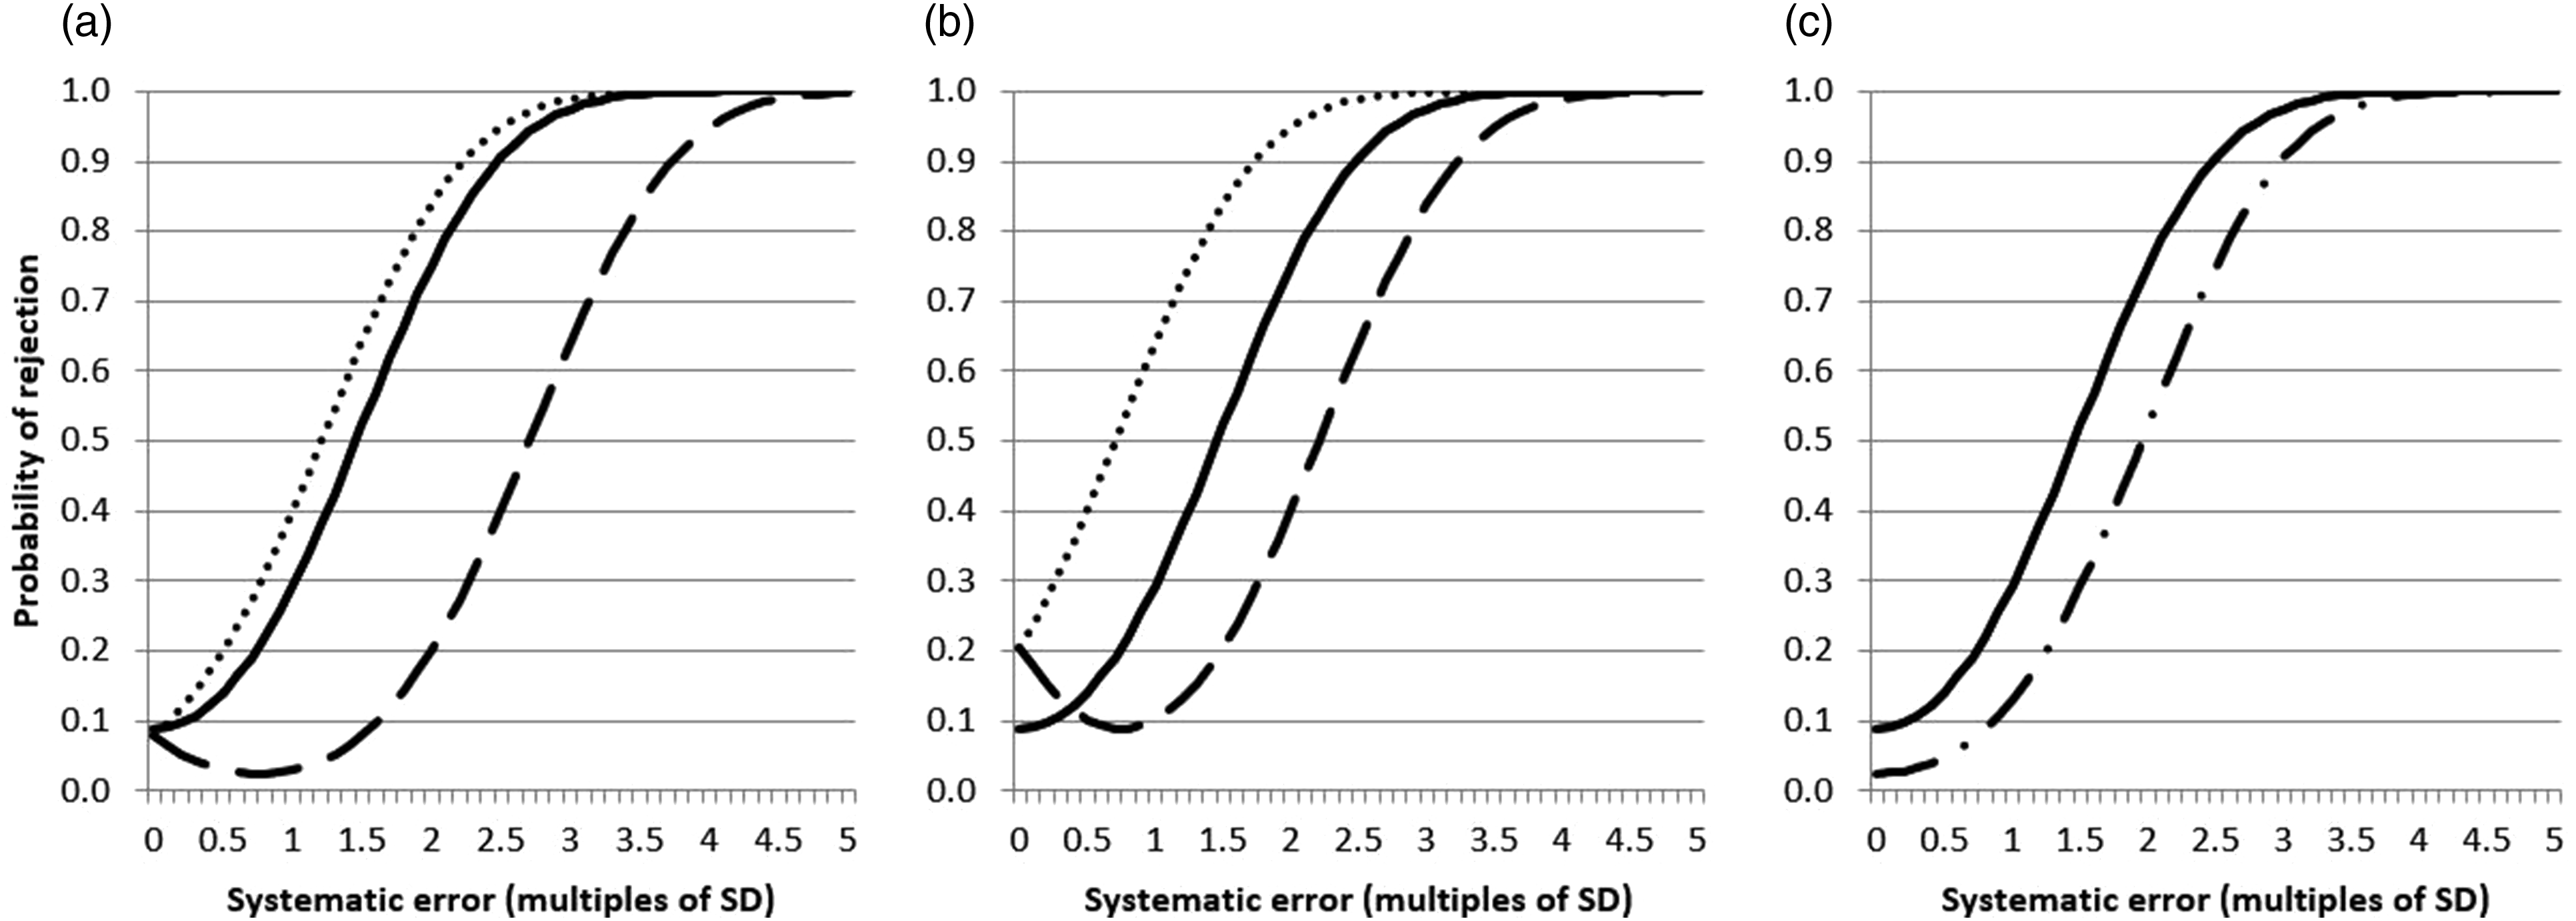
It can be seen that using common means and common SDs (panel A) has an asymmetrical effect on the error detection of one instrument compared to the other such that there is a modest improvement over using individual instrument means and SDs for one instrument, but a marked reduction for the other. In addition, for this latter instrument, an increasing bias initially leads to a paradoxical reduction in the likelihood of the systematic error being detected. Using just a common mean with individual SDs (panel B) leads to a more even influence on error detection with one assay improving its detection power to the same as degree as another reduced, but the false rejection rate in this situation for both of these instruments increases from 8.9% to 20.6%. Combining just the assay SDs (panel C) leads to a modest reduction in detection power of both instruments accompanied by a reduction in the false rejection rate to 2.5%.
Using three QC ‘samples’ rather than two showed similar trends (Supplemental Figure 1) as did using a 13s rather than a 12s control rule (Supplemental Figure 2).
Figure 2(a)–(c) describes the same scenarios as in Figure 1 except that one instrument assay now has an SD that is 1.5 times that of the other while the individual assay means are the same. There is a degree of uneven error detection in panels A (common means and common SDs) and C (common SDs and individual means) but with these two scenarios the main influence is on the false rejection rates which are 2.2% for one instrument and 17.1% for the other, whereas they are both 8.9% when using individual means and SDs. Again similar trends were found using three samples or a 13s control rule (Supplemental Figures 3 and 4). Simulated systematic error power function curves for two instruments where one has an assay SD 1.5 greater than the other, each using a 12s control rule, two control samples per QC run and individual QC targets (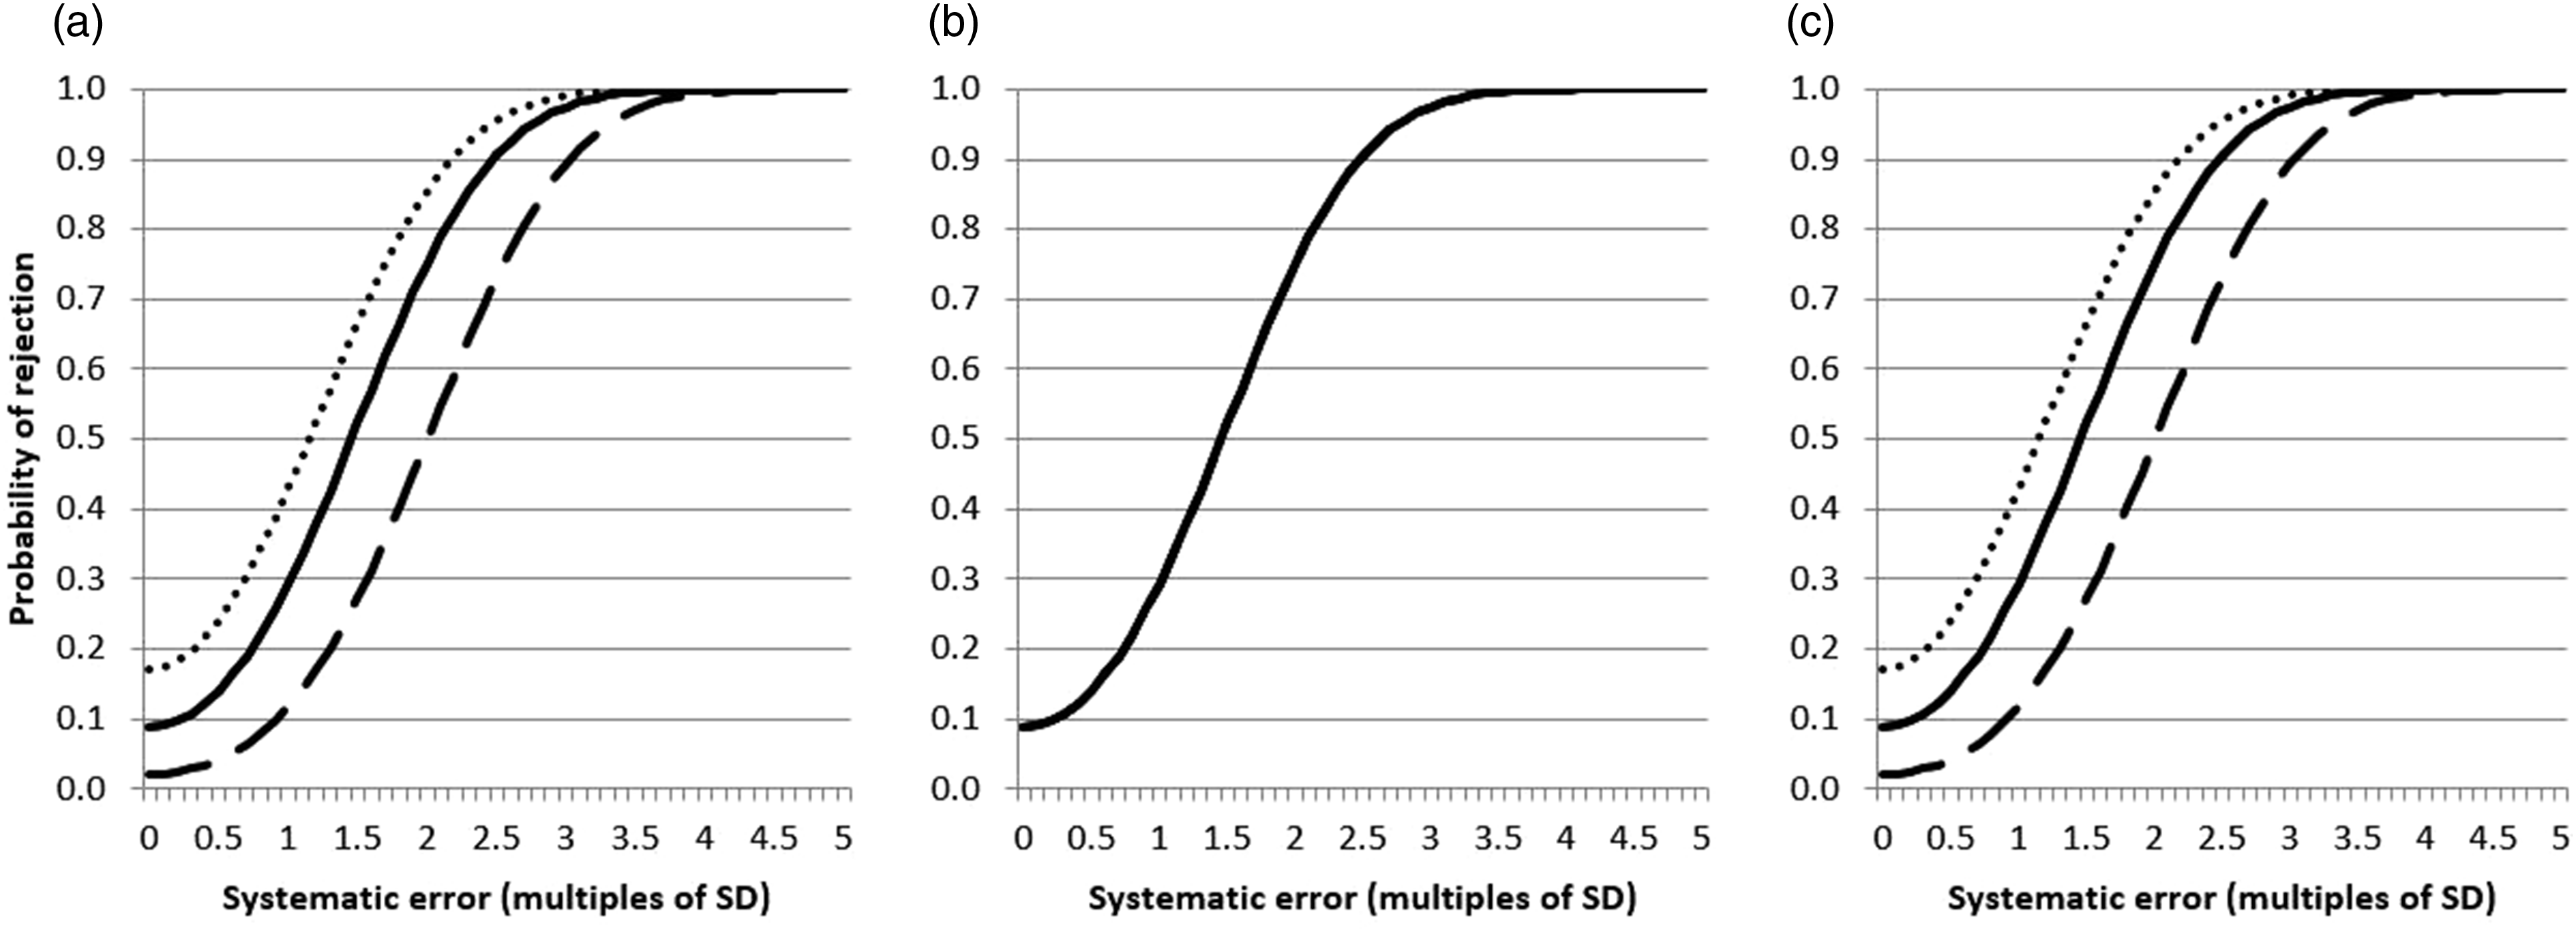
Real-world study
There were 95 QC levels from 45 tests which met the data collection criteria on both instruments (40 tests with two QC levels and five with three, a mixture of core blood tests including electrolytes, liver, renal, bone and lipids, as well as urine and CSF analyses).
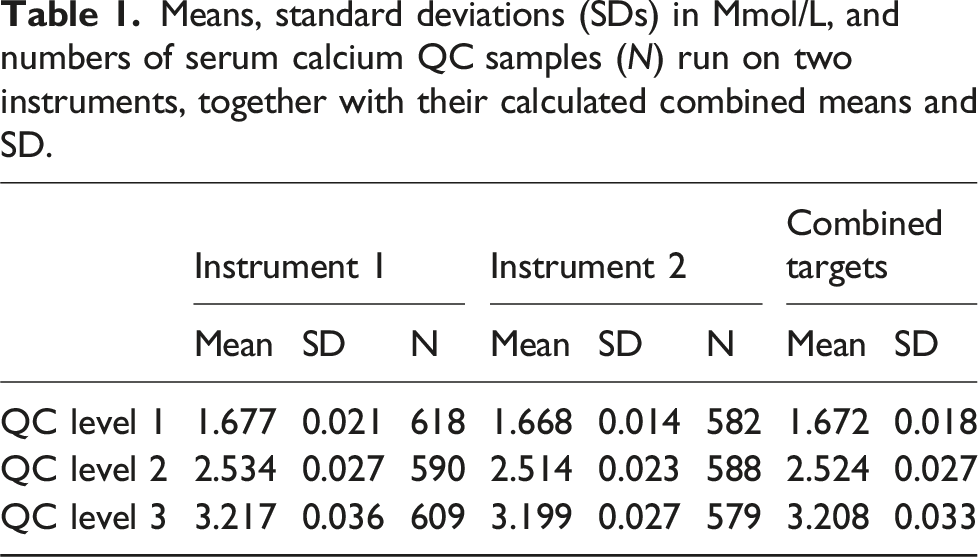
Means, standard deviations (SDs) in Mmol/L, and numbers of serum calcium QC samples (N) run on two instruments, together with their calculated combined means and SD.
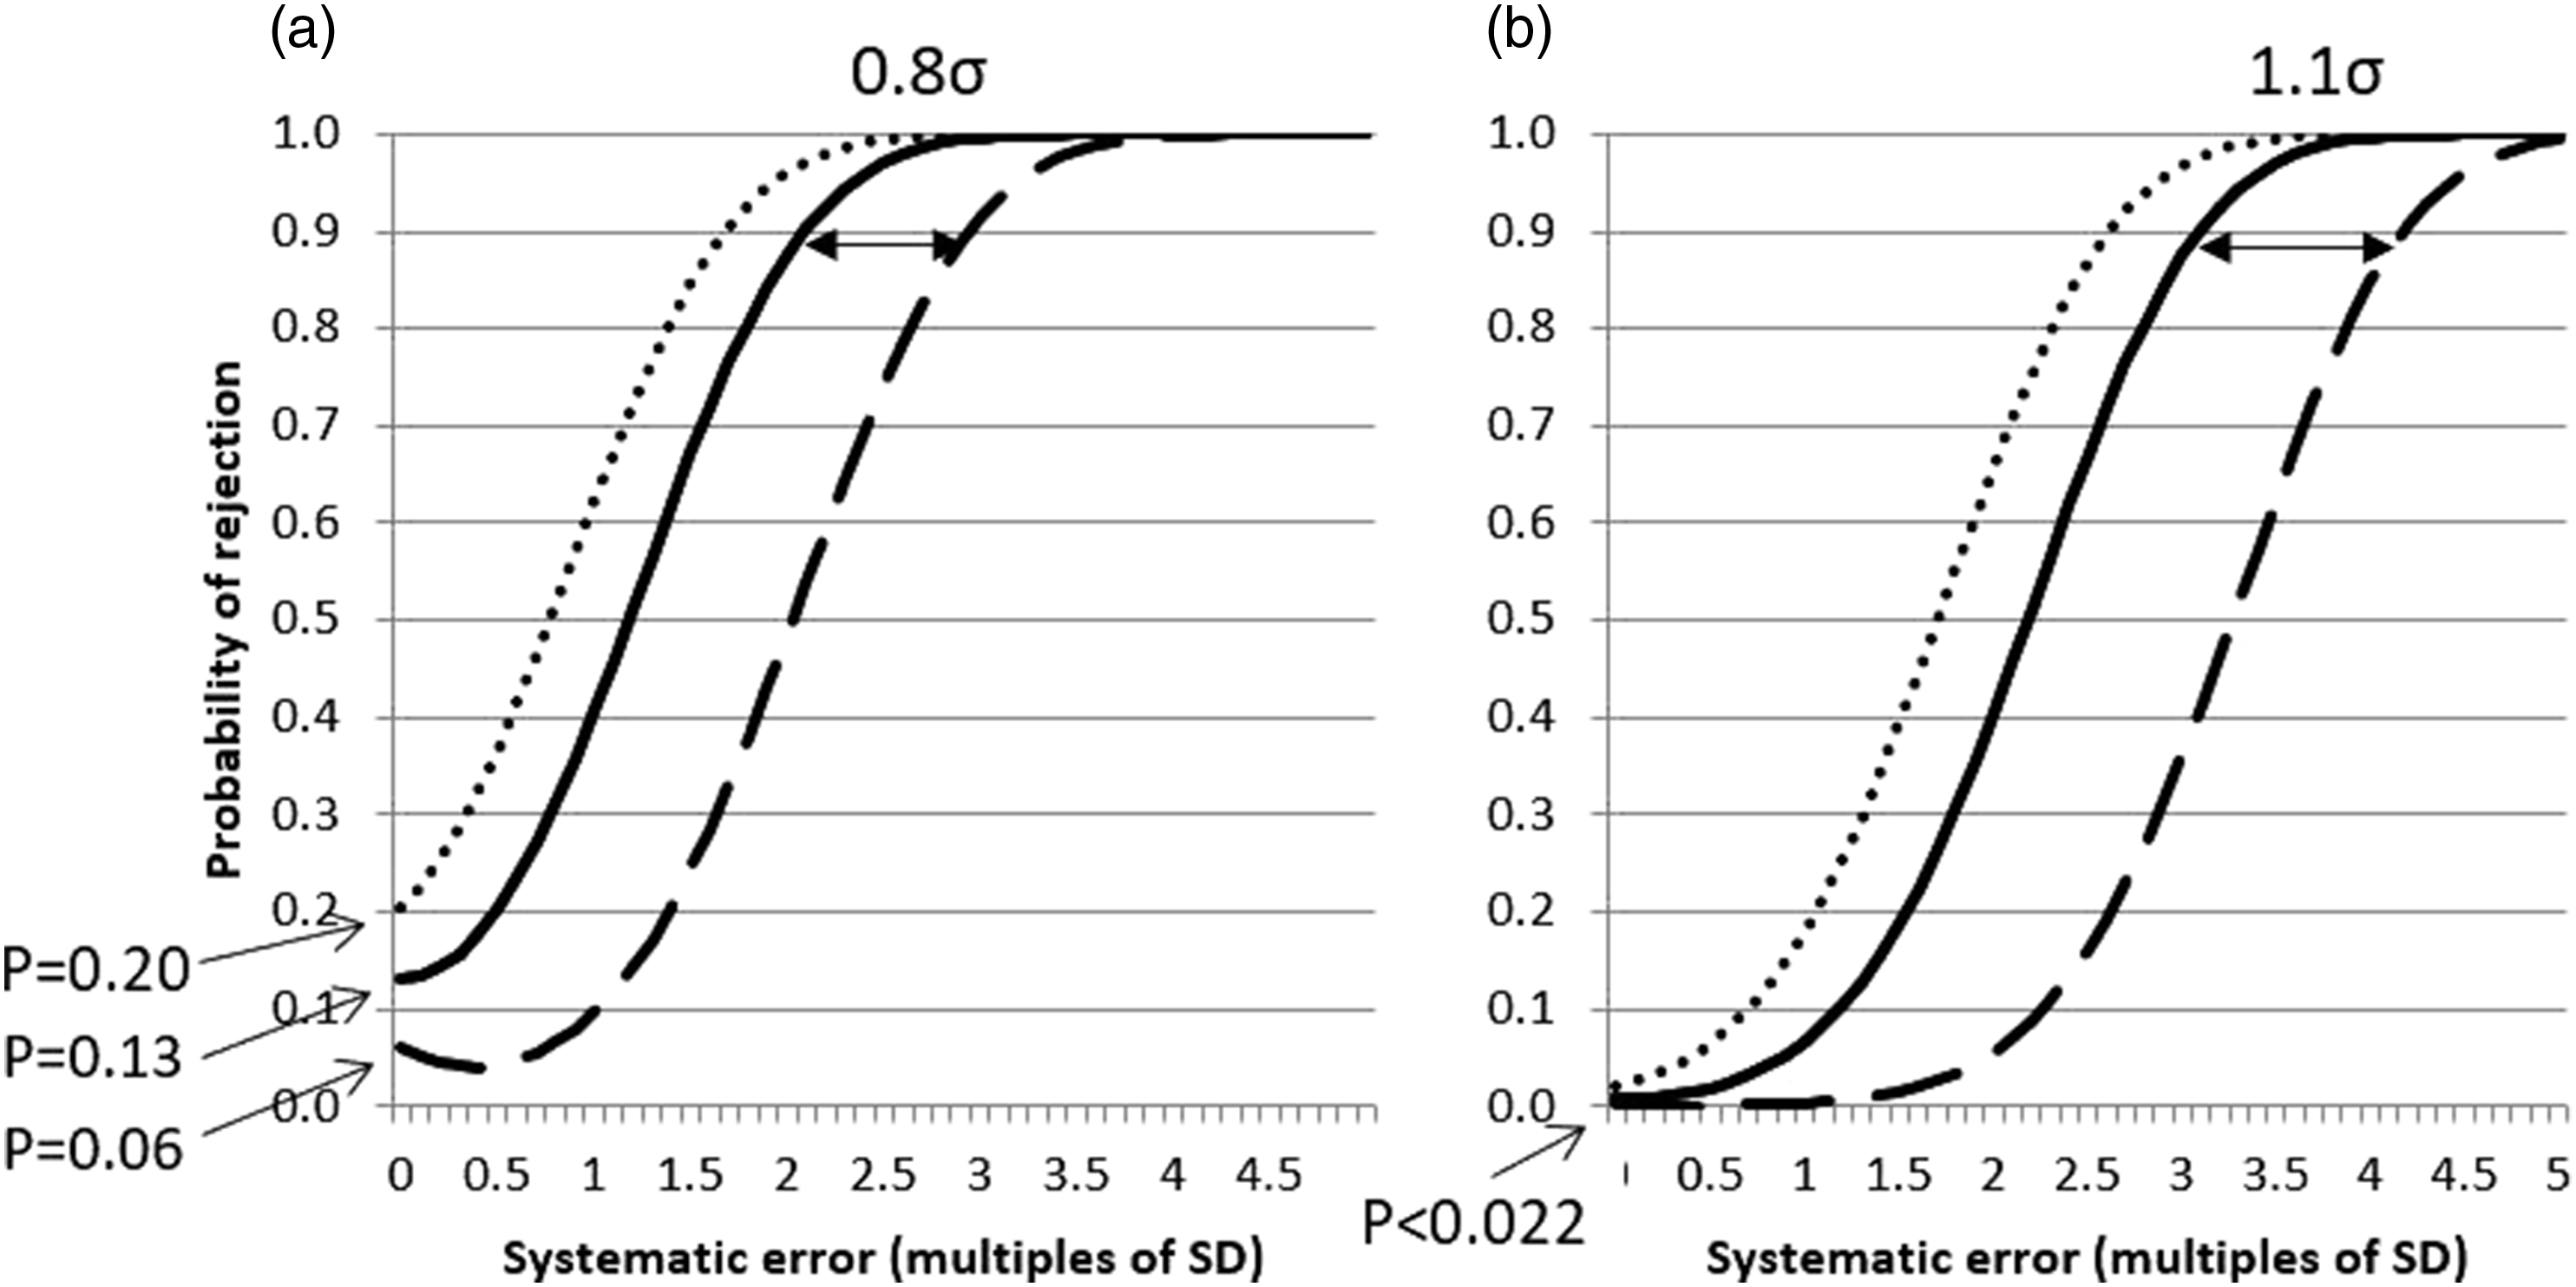
Real-world systematic error power function curves for two identical instruments measuring serum calcium over a 6 month period, each using either a 12s control rule (Panel A) or a 13s control rule (Panel B), three control samples per QC run and either individual QC targets (
Figure 4 shows the distribution of lost sigma at Ped = 0.90 by one of the two instruments for all 45 tests, using 12s (panel A) and 13s (panel B) control rules. Distributions of ‘lost sigma’ for 45 assays on two real-world instruments when using common rather than individual QC targets using either a 12s control rule (Panel A) or a 13s control rule (Panel B).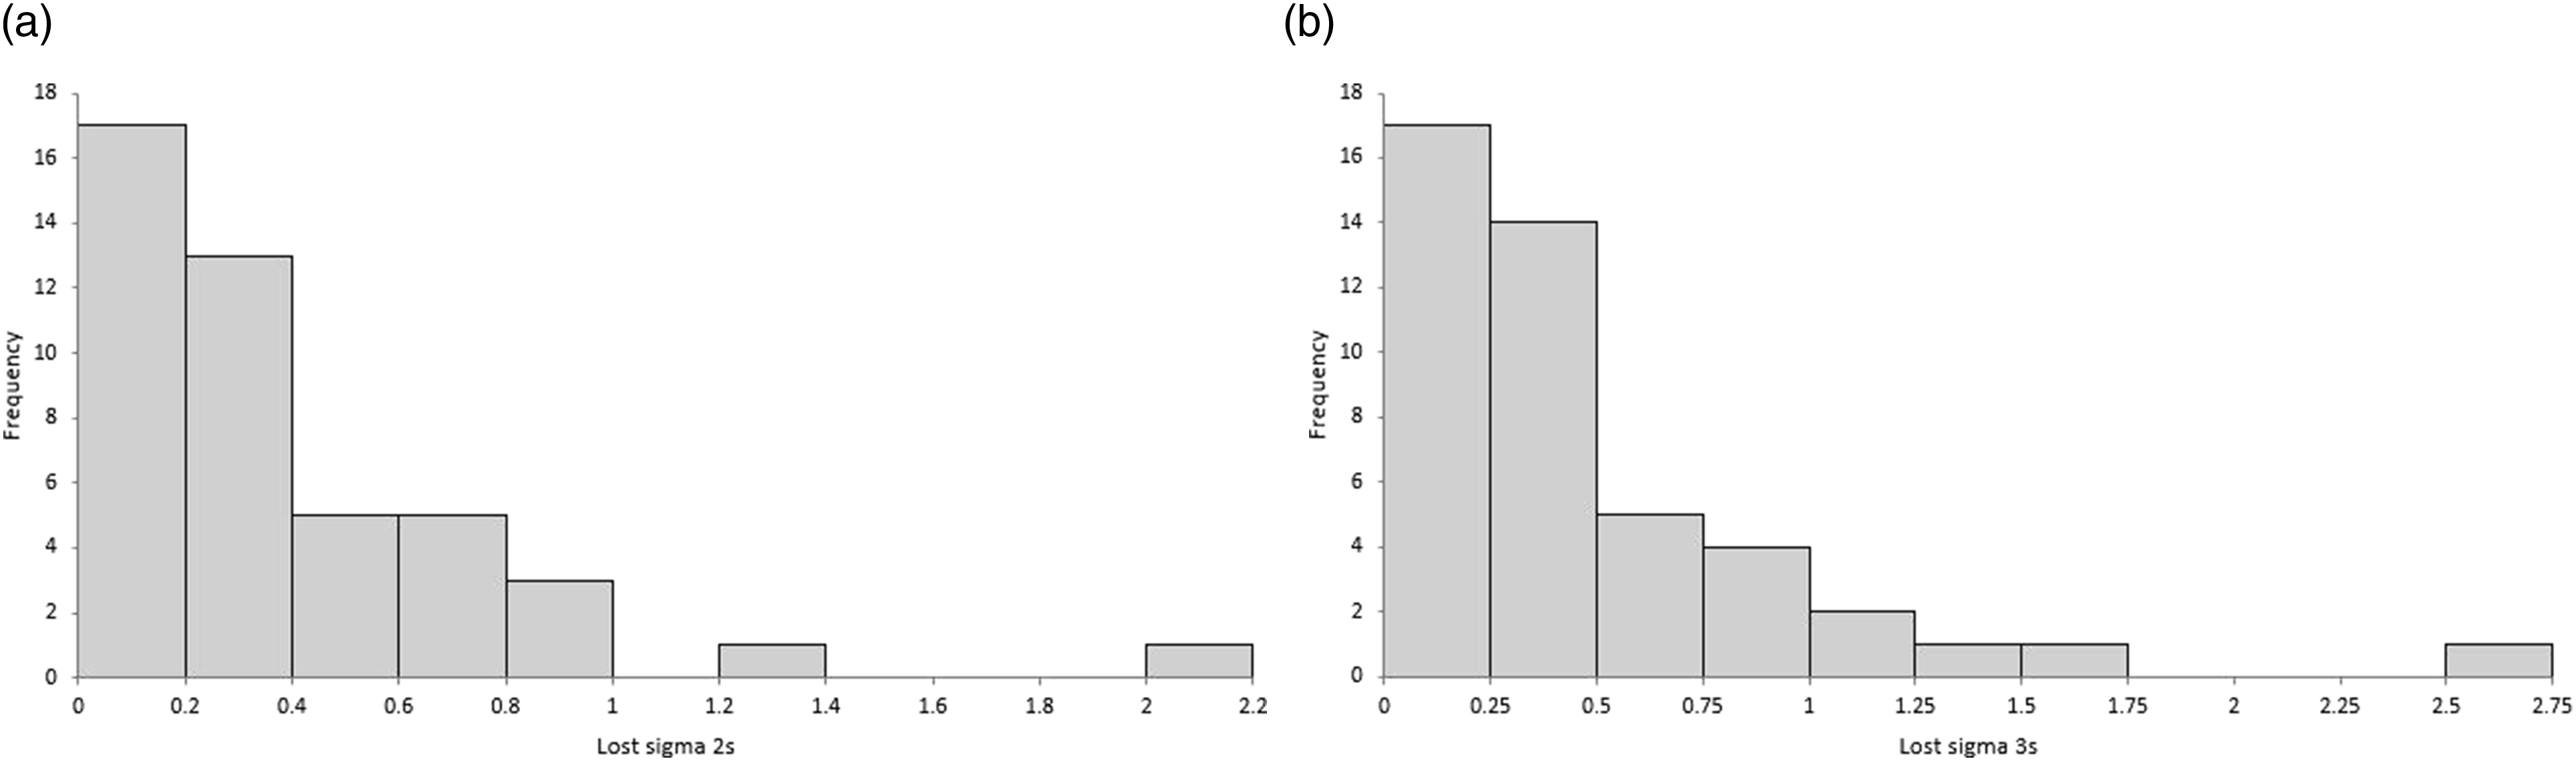
Assay sigma scores required in order to have at least a 90% probability of detecting a clinically significant systematic error during one QC run.
When applying a 12s control rule, in 15/45 (33%) of assays, one instrument lost ≥0.4σ and 11/45 (24%) lost ≥0.5σ. For 13s, this corresponded to 24/45 (53%) losing ≥0.4σ and 14/45 (31%) losing ≥0.5σ.
The false failure ratio between the two instruments if common means and SDs were applied to the 45 tests using a 12s control rule was a median of 1.62 (IQR 1.20 to 2.39). Thus, in 14/45 (31%) of assays, using common means and SDs resulted in one instrument failing QC more than twice as often as the other even if they were both individually in perfect historic control. Eight of the tests (18%) would fail at least three times as often. Using a 13s control rule, the median ratio was higher at 2.79 (IQR 1.48 to 6.82) with 28/45 assays (62%) failing at least twice as often (22/45 [49%] at least 3 times as often) on one instrument as the other. By definition, this ratio would be one for all tests if using individual instrument means and SDs.
Discussion
This study has shown that if the purpose of a laboratory’s internal quality control testing is to detect when an assay is outside of its expected normal control, then combining the non-identical QC targets of two analysers so they are common across both instruments can lead to an overall loss of systematic (bias) error detection. In addition, even when they are both individually performing as expected, common targets can lead to one assay failing its QC much more frequently than the other.
The analysis simulating purely an increasing assay bias in both instruments (identical SDs) showed that having both a common mean and common SD led to an asymmetrical effect on error detection compared to individual instrument targets, with one instrument tending to lose much more error detection power than the other gained (Figure 1(a)). This was presumably because one instrument assay will always have to move across most of the width of the common target’s wider range before being identified as failing, with the same happening to the other instrument if the assay bias was in the opposite direction. It also explains the curious effect whereby the instrument whose assay lost error detection power also went through a stage where the initial changing bias led to a reduced likelihood of the QC failing compared to when no bias existed, because the assay firstly moves closer to the common mean before moving further away as the bias increases further.
Combining just the means to be identical on both instruments but keeping the SDs individual had its largest influence on the false rejection rate, in this situation more than doubling for both assays than individual targets (Figure 1(b)). Lastly, combining the SDs (widened because the means are different) to be identical but having individual assay means traded some detection power for a lower false rejection rate (Figure 1(c)).
When individual assays had the same means but different SDs, the main feature of combining means and SDs was to make one instrument assay have a higher false rejection rate than the other (Figure 2).
Applying these simulated findings to real-world data indicated they remained relevant to a typical clinical laboratory where there can still be differences in bias and imprecision between instruments of the same type. Using the data that would commonly be used to establish control limits and collected over a period which would hope to include many sources of analytical variation (QC lot excepted) showed that implementing both common means and common SDs to two instruments would potentially lead to a reduction in error detection in one or other instrument (depending on the direction of assay bias) by 0.4σ or greater in around a third of assays and by 0.5σ or greater in approximately a quarter when using a 12s control rule. The proportions increased to approximately a half and a third of tests using a 13s rule. These sigma thresholds were specifically chosen as they indicate a potential need to increase the number of QC samples run with each assay from two to three (0.4σ) or to tighten the control rule (0.5σ) in order to assure analytical quality.
While this loss of error detection power may not be readily apparent to an operator of the instruments, a difference in how often QC failed using the same test on one analyser compared to another more likely would. If a 12s rule were applied across all the real-world data collected here, then by using common means and SDs it can be predicted that in nearly a third of tests one instrument or the other will fail more than twice as often as its partner even when both are individually in perfect historic control. This could prove especially frustrating if it led to troubleshooting an assay in an instrument that was actually performing as expected. Moreover, this analyser with the ‘troublesome’ assay would, in actual fact, be the one of the two that is most likely to sooner detect a systematic error (Figure 2(a)), assuming that its QC failure was not more likely to be ignored. The disparity between assay QC failure rates was larger again using the 13s control rules although in absolute terms both instruments would still be failing much less frequently than if a 12s rule were used.
Looking at the superficially unremarkable example of serum calcium (Table 1 and Figure 3) it can be seen that with use of either a 12s or 13s control rule, one instrument will ‘lose’ 0.9σ or 1.1σ, respectively, using common as opposed to individual QC targets, with their in-control QC failure rates being 3.4-fold (12s) or 13.4-fold (13s) different between analysers.
There are limitations to this study in regards to its findings. One is whether an individual assay ‘losing’ sigma is likely to be of clinical relevance. For example, when using CLIA (Clinical Laboratory Improvement Amendments) performance criteria in the serum calcium example given, 8 the lowest test sigma for the two instruments is 12 compared to its peer group, so losing 0.8σ or 1.1σ is unlikely to impact on patients, albeit that the warning of an analytical issue could be delayed. Related to this, the simulated and real-world analysis concentrated on the 12s or 13s control rules habitually used by many laboratories, but if individual control rules were based more closely on the sigma for each assay then this may have had a different influence on sigmas lost and QC false failure rates. Next, laboratories may not combine means and SDs using the formal statistical formulae used here and instead, for example, determine common SD from the arithmetic average SD or from the SD of the instrument with the largest imprecision. Lastly, the analysis has only been based on two instruments and so it is not known if the conclusions would be reinforced or weakened if further instruments were added.
Existing literature on the topic of quality controlling multiple instruments is not extensive and there is currently no method which is obviously preferable. 1 One simulation study suggested that a common mean and common SD could minimize the number of clinically significant errors an out of control assay might report by effectively averaging the risk over all analysers. 9 However, this approach has since been questioned for fear it could lead to a worsening of error detection in an individual instrument with an existing true assay bias. 10 To assess this true bias, the reference concentration of the QC sample needs to be known, either through methods such as being traceable to a reference method or by deriving it from a large group of peers. 10 There is currently an emerging consensus that knowledge of such a reference concentration or mean value could be key to combining QC targets from multiple instruments, but even this proposal has the caveats that should the bias estimate not be completely reliable, or such samples not be completely commutable, then it could, in fact, be more detrimental to use than not. 10
Regardless of this ongoing debate, it is likely that most laboratories currently using or considering using common QC targets are doing so by setting them based on combining instrument targets in some way rather than being in relation to reference means. They may also have yet to make the leap to base their individual assay control rules on the likelihood of reporting clinically significantly erroneous results. For them especially, this study combining simulation with real-world data has shown that when the same test is run on two instruments the use of common QC targets can lead to a disparity in each analyser’s rate of false QC failure and/or their ability to detect systematic assay error. Therefore, until consensus on the best way forward is reached, caution may need to be exercised when using common QC targets between multiple analysers of the same type, particularly with low sigma tests that demonstrate clinically or statistically significant differences between their instrument means and SDs.
Supplemental Material
Supplemental Material - Assay error detection when using common quality control targets across multiple instruments: An analysis using simulated and real-world data
Supplemental Material for Assay error detection when using common quality control targets across multiple instruments: An analysis using simulated and real-world data by Eric S Kilpatrick in Annals of Clinical Biochemistry.
Footnotes
Acknowledgements
Thanks are due to the laboratory team at Sidra Medicine in providing the QC data.
Declaration of conflicting interests
The author(s) declared no potential conflicts of interest with respect to the research, authorship, and/or publication of this article.
Funding
The author(s) received no financial support for the research, authorship, and/or publication of this article.
Ethical approval
None required.
Guarantor
ESK.
Contributorship
ESK helped conceive the idea, performed the statistical analysis, and wrote the paper.
Supplemental material
Supplemental material for this article is available online.
References
Supplementary Material
Please find the following supplemental material available below.
For Open Access articles published under a Creative Commons License, all supplemental material carries the same license as the article it is associated with.
For non-Open Access articles published, all supplemental material carries a non-exclusive license, and permission requests for re-use of supplemental material or any part of supplemental material shall be sent directly to the copyright owner as specified in the copyright notice associated with the article.