
Abstract
Background
Plasma amino acid analysis is key to the diagnosis and monitoring of inherited disorders of amino acid synthesis, catabolism and transport. Ion exchange chromatography (IEC) is widely accepted as the gold standard method of analysis, but with the introduction of liquid chromatography tandem mass spectrometry (LC-MS/MS) and liquid chromatography mass spectrometry (LC-MS) methods, this should now be questioned.
Methods
The analytical performance of three commercially available reagent kits, Waters AccQ Tag™ ULTRA LC-MS, SpOtOn Amino Acids LC-MS/MS and Chromsystems MassChrom® Amino Acid Analysis LC-MS/MS, were evaluated and compared with Biochrom Physiological Amino Acids ion exchange chromatography. Correlation with IEC was assessed by Passing-Bablok regression, concordance correlation coefficients (CCC) and Bland-Altman analysis for 21 common amino acids. Calculation of the total error from imprecision and bias was also used to benchmark performance.
Results
The MassChrom® and SpOtOn kits demonstrated acceptable inter-batch imprecision (CV < 10%) and accuracy (mean bias < 10%), whereas the AccQ Tag™ ULTRA kit did not. Good correlation (CCC > 0.95) with Biochrom IEC was demonstrated for 10/21 analytes in both the MassChrom® and SpOtOn kits and 6/21 in the AccQ Tag™ ULTRA kit.
Conclusions
The LC-MS assay demonstrated variable analytical performance and correlated poorly with ion exchange chromatography. Both LC-MS/MS assays demonstrated comparable analytical performance and reasonable correlation with ion exchange chromatography. They also confer practical advantages which cannot be realized by ion exchange chromatography, superior specificity and significantly faster analysis time, suggesting that ion exchange chromatography should no longer be described as the gold standard method for plasma amino acid analysis.
Background
Measurement of plasma amino acids is essential for the diagnosis and monitoring of inherited defects of amino acid metabolism. The requirement to measure >20 analytes, at concentrations spanning three orders of magnitude, all with adequate sensitivity and specificity, is a challenge. Several methods have been described,1,2 and traditionally IEC of deproteinized plasma with post column ninhydrin detection has been considered the gold standard method by clinical laboratories.3–5 IEC detects all clinically relevant amino acids in a single chromatographic separation with good sensitivity and reproducibility. However, this is a legacy method, remaining essentially unchanged since its introduction over 40 years ago, and lacks specificity. All ninhydrin-positive compounds are detected, several clinically relevant amino acids co-elute with interfering compounds on most systems and resolution of the early eluting acidic compounds is challenging. Furthermore, quantification is generally based on a single analogue IS, analysis time is lengthy (>2 h per sample) and as a result calibration tends to be minimal, infrequent and single point, typically at 250 or 500 μmol/L. 6
The limitations of IEC are reflected by the number of laboratories moving to LC-MS/MS. In 2007, 147/178 of participants in the European Research Network for evaluation and improvement of screening, Diagnosis and treatment of Inherited disorders of Metabolism (ERNDIM) Quantitative Amino Acids External Quality Assessment (EQA) scheme utilized IEC and only 5/178 LC-MS/MS. By 2019, the number of laboratories using LC-MS/MS had increased to 69/272, whereas those using IEC had decreased to 147/272. 7 Reversed Phase High Performance Liquid Chromatography is used by 34/272 participants and 8/272 use LC-MS. Although there has been widespread adoption of LC-MS/MS, a technology generally considered to be the gold standard for the analytical measurement of small molecules, many laboratories continue to use IEC despite its limitations. The UK has been particularly slow to respond to these changes with only the authors’ laboratory routinely using LC-MS/MS for plasma amino acid analysis. This may reflect the difficulties associated with establishing in-house methodologies: traceability/standardization, availability and cost of stable isotope IS, user expertise, the need for derivatization and/or ion pair reagents, implications associated with accreditation status, the limited availability and paucity of information relating to the performance characteristics and robustness of commercial reagent kits.
For the clinical laboratory, one of the primary drivers to move away from IEC is the potential for a faster analysis time. This is key to enabling the real-time analysis of clinically urgent samples and improves the efficiency of the routine laboratory workflow. As such, sample preparation will ideally be quick and simple, without the need for derivatization or extensive sample clean up. In recent years, several diagnostic companies including Agilent, ABSciex, Waters, Kairos and SpOtOn Clinical Diagnostics, have launched commercial reagent kits for plasma amino acid analysis. These kits are designed to be used with mass spectrometry, primarily utilize sample derivatization prior to analysis and provide commercial calibrators and stable isotope internal standards (ISs). The aim of this study was to compare the analytical performance of three commercial kits, two underivatized LC-MS/MS kits and one derivatized LC-MS kit, with an established IEC assay for the measurement of 21 common amino acids and to evaluate the applicability of each assay. The commercial kits evaluated were: Biochrom Physiological Amino acids (Cambridge, UK), Waters AccQ Tag™ LC-MS kit (Milford, USA), Chromsystems MassChrom® Amino Acid Analysis in plasma/serum underivatized LC-MS/MS kit (Munich, Germany) and SpOtOn Clinical Diagnostics Amino Acids underivatized LC-MS/MS kit (London, UK).
Methods
Study design
Lithium heparin plasma samples were randomly selected from routine amino acid requests. These samples were observed to contain a reasonable range of amino acid concentrations as measured by IEC. Samples were stored at −20°C prior to analysis. Twenty-one amino acids were measured by the Waters AccQ Tag™ LC-MS kit (n = 68), SpOtOn Clinical Diagnostics Amino Acids underivatized LC-MS/MS kit (n = 57) and Chromsystems MassChrom® Amino Acid Analysis in plasma/serum underivatized LC-MS/MS kit (n = 98) and the results compared with IEC. The first two kits are commercially available, and the Chromsystems kit was a premarket evaluation (Lot V1918) which has since undergone further refinement. Measurements were performed in a blinded fashion with a different operator for each method. As samples were analysed by IEC first and underwent subsequent freeze/thaw cycles prior to the next analysis, an acknowledged limitation of this study is that degradation artefacts were present: deamination of glutamine to glutamic acid and pyroglutamic acid, arginine to ornithine and asparagine to aspartate. By comparing the sum of glutamine and glutamic acid (∑G&G), it was possible to largely correct for glutamine breakdown.
Inter-assay imprecision was assessed by replicate analysis (n = 20) of two plasma IQC materials on different days. The IQC materials were prepared in-house from lithium heparin plasma. The ‘low’ IQC was endogenous. The ‘high’ IQC was spiked with a solution of L-amino acids. 8 IQC samples were aliquoted and stored at –80°C prior to use.
Bias was assessed by analysis of ERNDIM Quantitative Amino Acid EQA samples (n = 7) and comparison to the all laboratory mean value.
The principles of each kit evaluated are described below. Full details regarding instrument settings, calibrators and IS are provided in the supplemental material.
IEC Biochrom 30+ Amino Acid Analyser physiological system
IEC with post column-ninhydrin derivatization was performed with a Biochrom 30+ Amino Acid Analyser (Cambridge, UK) using the manufacturer’s method for physiological amino acids. Sulphosalicylic acid (5% w/v, 100 μL), containing 250 μmol/L aminoethylcysteine IS, was added to 100 μL of plasma, IQC or calibrator. Samples were vortex mixed and stored at 5°C for 30 min prior to centrifugation (13,000 g × 10 min). The injected volume was 70 μL. A single point calibration at 250 μM was used for all analytes. Total analysis time was 120 min.
LC-MS AccQ Tag™ ULTRA Reagent Kit
Samples, calibrators and IQC (50 μL) were pipetted into 1 mL Eppendorf® 3810X tubes. 10% w/v sulphosalicylic acid (100 μL), containing 50 μM stable isotope IS mix, and water (50 μL) were added, samples were vortex mixed for 30 s then centrifuged (3000 g, 15 min). Supernatant (10 μL) was removed and mixed with reaction buffer (70 μL) and kit reagent (20 μL) prior to heating at 55°C for 10 min. Samples (2 µL) were injected into a Waters QDa® mass detector using an ACQUITY UPLC® H-Class system (Waters Corp., Milford, USA). Gradient chromatography was performed on a Cortecs UPLC® BEH C18 column (1.6 µm, 2.1 × 150 mm) maintained at 55°C. Initial conditions were 99% mobile phase A (0.1% formic acid in water) and 1% mobile phase B (0.1% formic acid in acetonitrile), flow rate 500 µL/min. A linear gradient (curve 6) was applied to 87% A at 2 min, followed by 85% A at 5.5 min and 5% A at 6.5 min before returning to the initial conditions between 7.6 and 9 min. Mass spectrometer settings were capillary voltage 0.8 kV, source block temperature 120°C, desolvation temperature 650°C, cone gas 150 L/h and cone voltage 10 V. Data were acquired by Selected Ion Monitoring (SIM) using positive ionization mode. Sampling rate was 6.25 Hz. Data in 7-time functions were acquired and processed using MassLynx 4.1 and TargetLynx™ software (Waters Corp., Milford, USA). A seven-point calibration curve was used for all analytes. Total analysis time was 9 min. Calibrator concentrations were 1, 5, 10, 50, 100, 250 and 500 μM. The IS concentration was 50 μM. Additional details of the method are provided in the supplemental material.
LC-MS/MS SpOtOn Amino Acids Kit
Samples, calibrators and IQC (10 μL) were pipetted into 1 mL Eppendorf® 3810X tubes. A fixed amount of working IS mix (150 μL) was added, samples were vortex mixed for 10 s, then centrifuged to precipitate proteins (13,000 g × 10 min). Supernatant (100 μL) was transferred into a 96 deep well plate and diluted with MeCN:H2O 50:50 (vol/vol) containing 0.025% formic acid (400 μL). Samples (3 μL) were injected into a Xevo TQ-S™ mass spectrometer using an Acquity I Class UPLC® system with autosampler (Waters Corporation, Milford, USA). Isocratic chromatography was performed on an ASTEC Chirobiotic T column (5 μM, 2.1 × 250 mm) maintained at ambient temperature using MeCN:H2O 50:50 (vol/vol) containing 0.025% formic acid, at a flow rate of 200 μL/min. Mass spectrometer settings were capillary voltage 3.5 kV, source block temperature 150°C, desolvation temperature 400°C, desolvation gas flow 800 L/h and cone gas 150 L/h. Cone voltage and collision energy were optimized for each analyte (see supplemental material). Data were acquired by selected reaction monitoring (SRM) using positive ionization mode for all analytes except phosphoethanolamine and sulphocysteine, which were acquired in negative ionization mode. Dwell times were 20 ms for all analytes apart from glycine (100 ms) and alanine/sacrcosine (40 ms). Data in six-time functions, five in positive ionization mode, one in negative, were acquired and processed using MassLynx 4.1 and TargetLynx™ software (Waters Corporation, Milford, USA). A three-point calibration curve was used for all analytes. Total analysis time was 15 min. Full details of this method have been published elsewhere. 8
LC-MS/MS MassChrom® Amino Acid analysis in plasma/serum kit
Samples, calibrators and IQC (25 μL) were pipetted into 1 mL Eppendorf® 3810X tubes and IS mix (50 μL) was added. Precipitation reagent (400 μL) was added, and samples were vortex mixed for 30 s then centrifuged to precipitate proteins (13,000 g × 5 min). Supernatant was transferred into a 96 deep well plate (Waters Corp., Milford, USA). Samples (5 μL) were injected into a Xevo TQ-S™ mass spectrometer using an Acquity UPLC® system with autosampler (Waters Corp., Milford, USA). Gradient chromatography was performed on the kit supplied analytical column maintained at 25°C. Initial conditions were 100% mobile phase A, flow rate 800 µL/min (see supplemental material). Mass spectrometer settings were capillary voltage 3.0 kV, source block temperature 150°C, desolvation temperature 250°C, desolvation gas flow 650 L/h, cone voltage 30 V and cone gas 150 L/h. Collision energy was optimized for each analyte (see supplemental material). Data were acquired by SRM using positive ionization mode for all analytes. Dwell times varied from 10 to 30 ms. Data in five-time functions were acquired and processed using MassLynx 4.1 and TargetLynx™ software (Waters Corp., Milford, USA). A four-point calibration curve was used for all analytes. Total analysis time was 19 min. Reagents were from pre-release kit Lot V1918. Additional details of the method, including calibrator concentrations, are provided in the supplemental material.
Statistics
Passing–Bablok regression and the CCC were used to determine whether there was correlation between methods. Bland–Altman plots were used to evaluate whether there was agreement between methods. The results of the plasma samples were analysed using MedCalc version 19.1 and Analyse-it software.
The CCC9,10 is used to evaluate the degree to which pairs of observations fall on the 45° line through the origin. It contains a measurement of accuracy (bias correction factor [Cb]) and precision (Pearson correlation coefficient, r) and is calculated as follows: CCC = Cb × r. The Pearson correlation coefficient measures how far each observation deviates from the best-fit line. The Cb measures how far the best-fit line deviates from the 45° line through the origin. Interpretation of CCC results was as follows: > 0.95, good agreement; between 0.90 and 0.95, moderate agreement; < 0.9 poor agreement.
Passing–Bablok Regression calculates a regression equation (y = a + bx) including 95% confidence interval (CI) for the constant (a) and proportional (b) bias. 11 This procedure requires continuous variables and a linear relationship between the two methods. The assumption of linearity was tested using the cumulative sum linearity test (cusum linearity test). The cusum test is used to assess whether residuals are randomly scattered above and below the regression line and do not exhibit any distinct trend. A P value < 0.05 indicates a significant deviation from linearity.
Results
Example chromatograms from each method showing the isobaric BCAA, leucine, isoleucine and alloisoleucine, are shown in Figure 1.
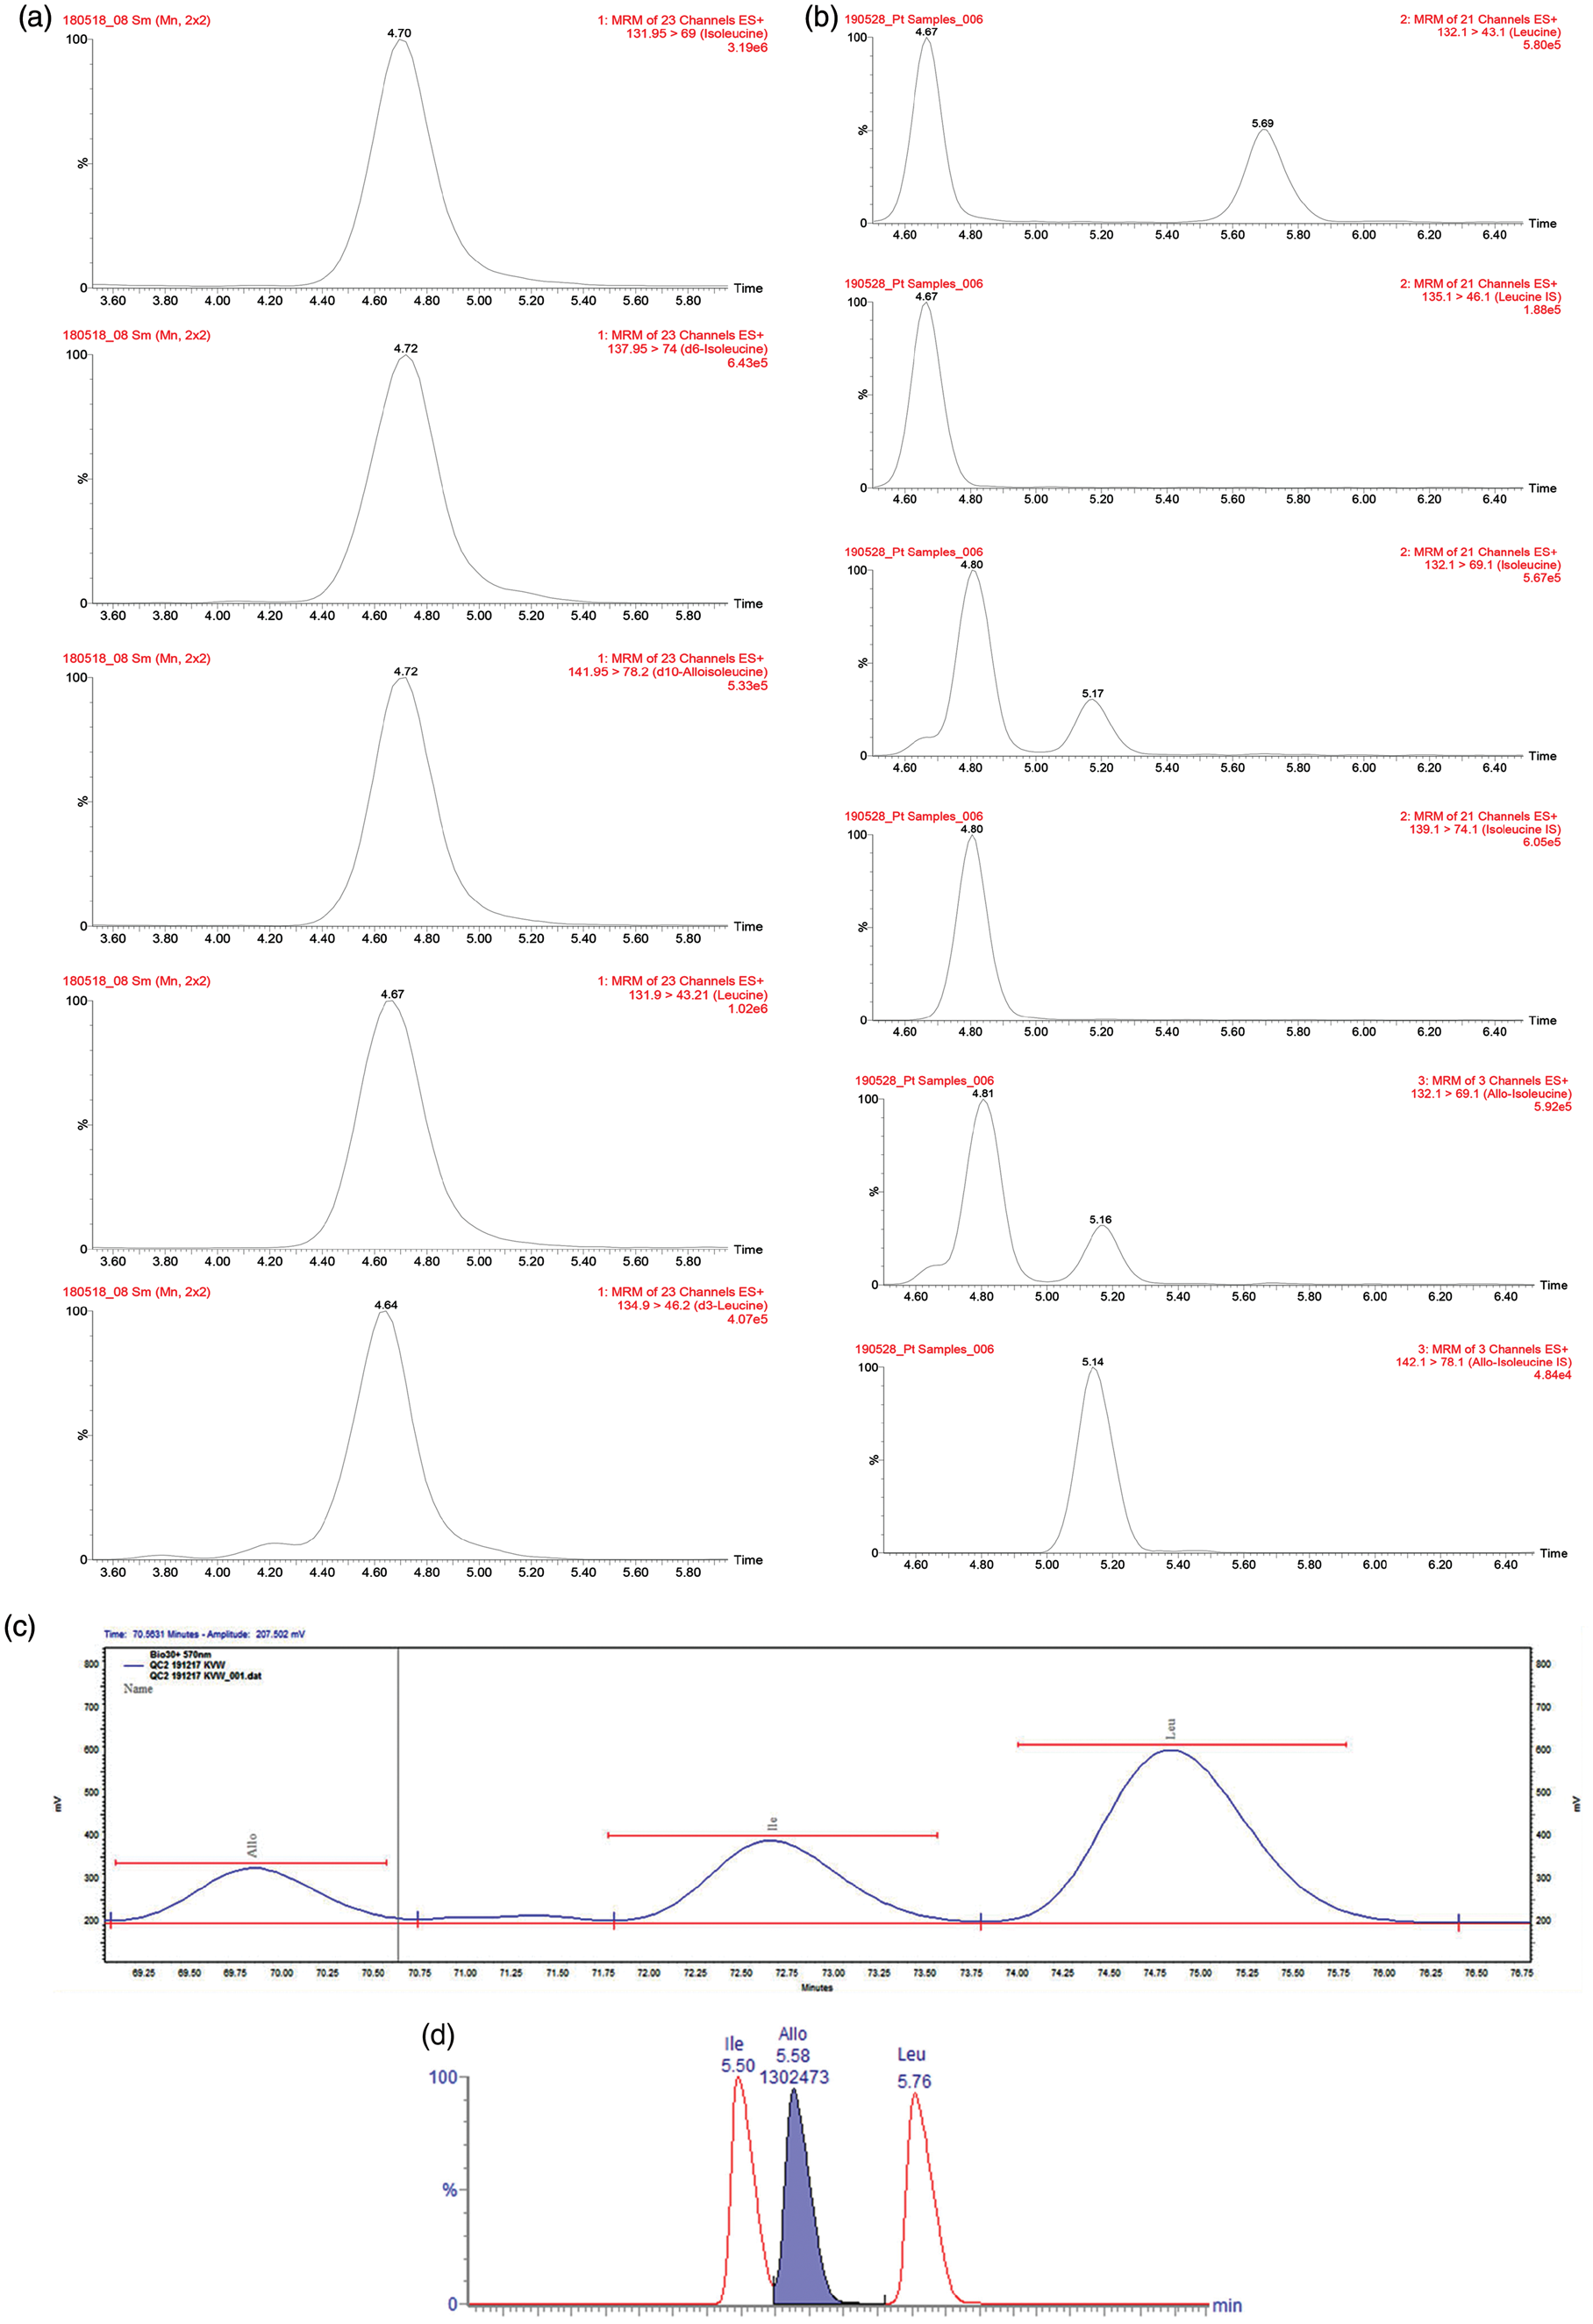
Example chromatograms from each method depicting leucine, isoleucine and alloisoleucine. (a) IEC Biochrom 30+ Amino Acid Analyser Physiological System, (b) LC-MS AccQ Tag™ ULTRA reagent kit, (c) LC-MS/MS SpOtOn Amino Acids kit and (d) LC-MS/MS MassChrom® Amino Acid Analysis in plasma/serum kit.
LC-MS AccQ Tag™ ULTRA Reagent Kit vs. IEC
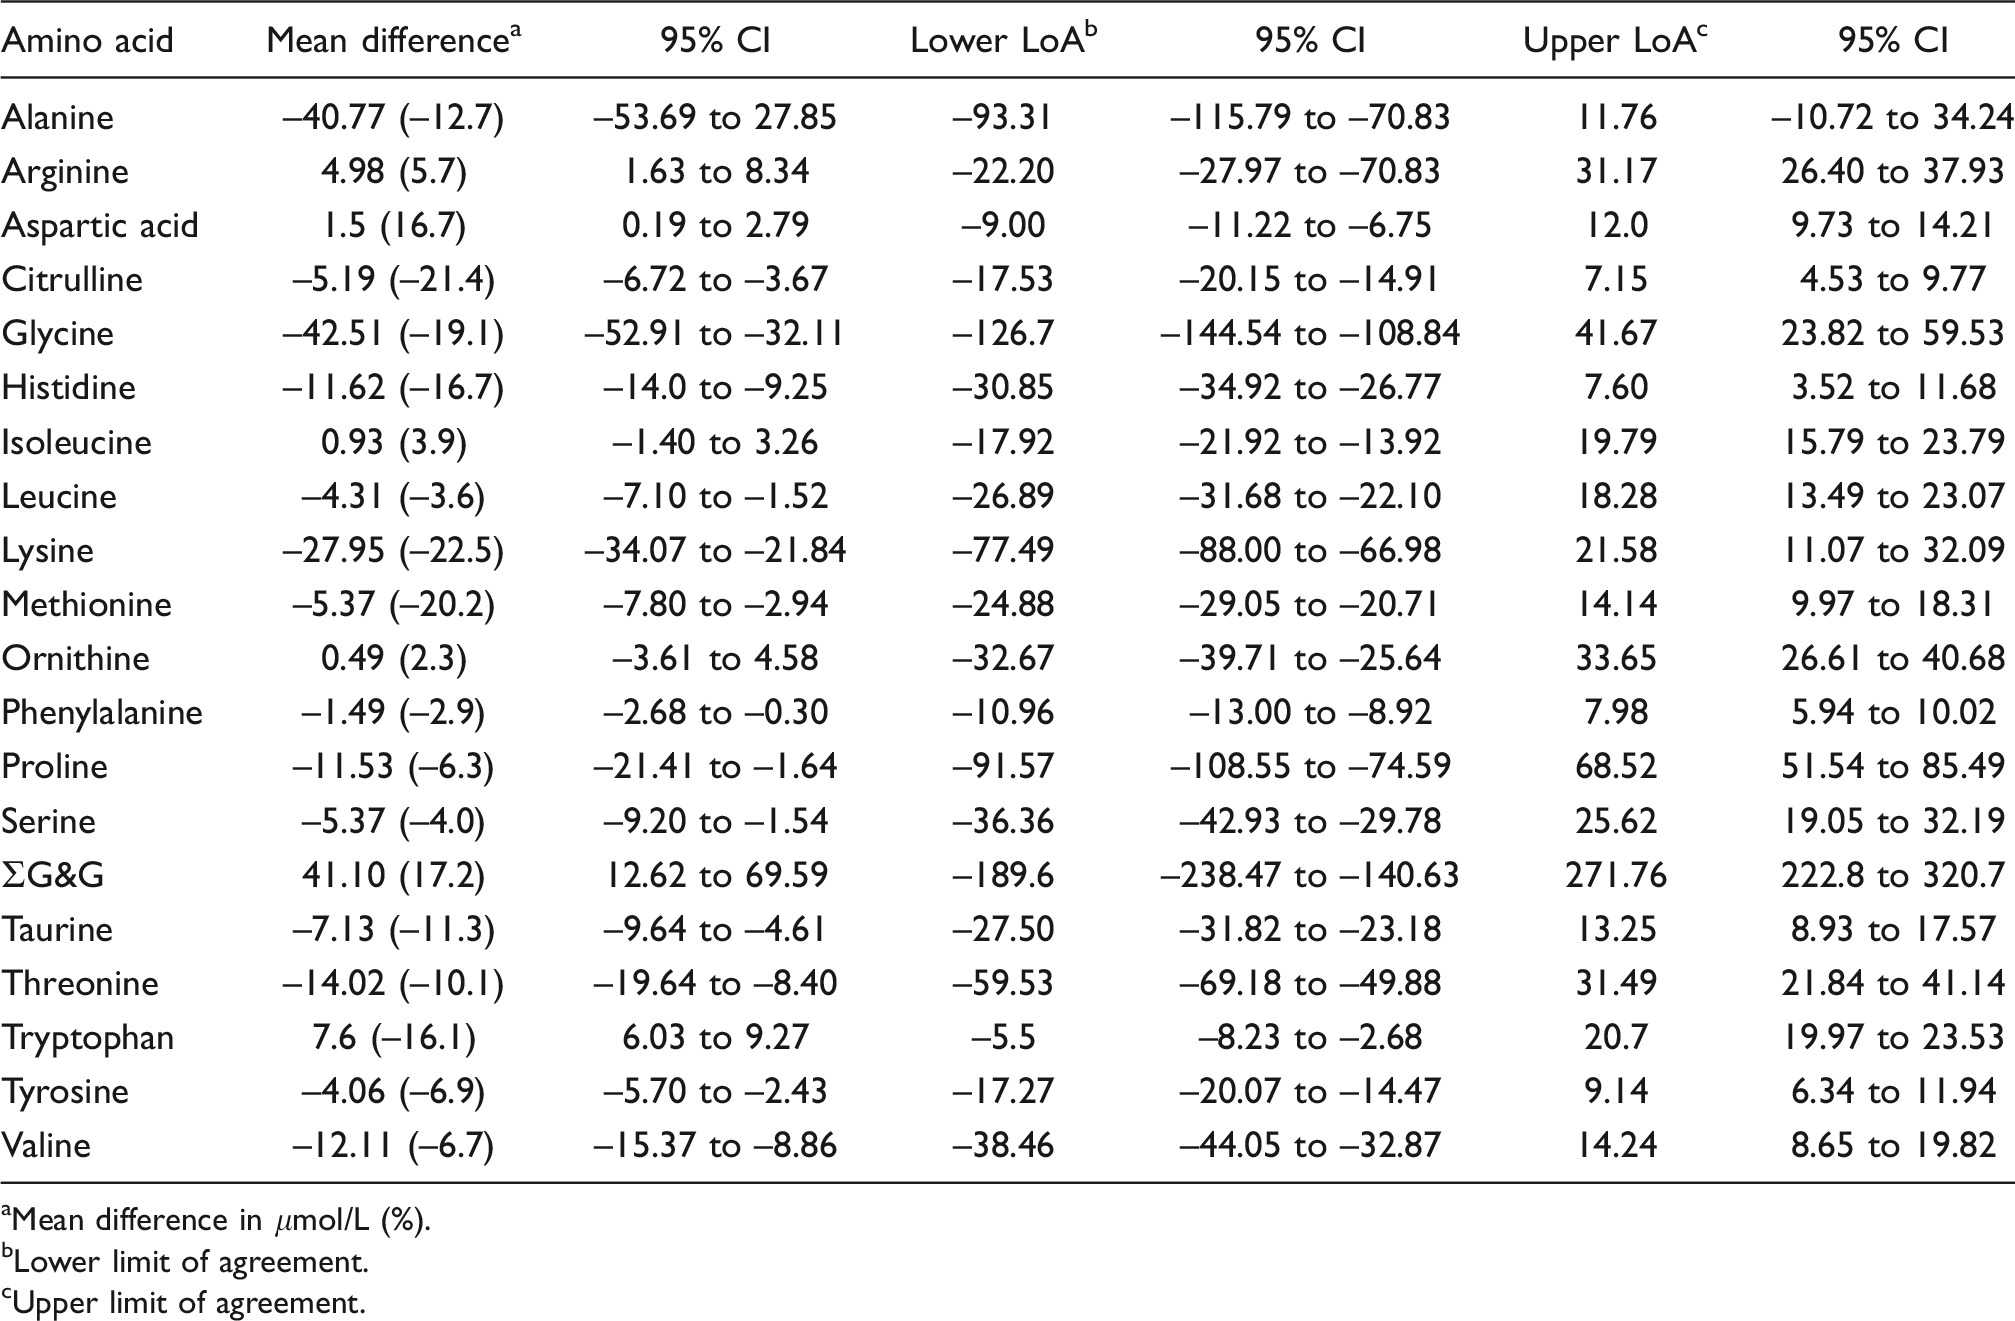
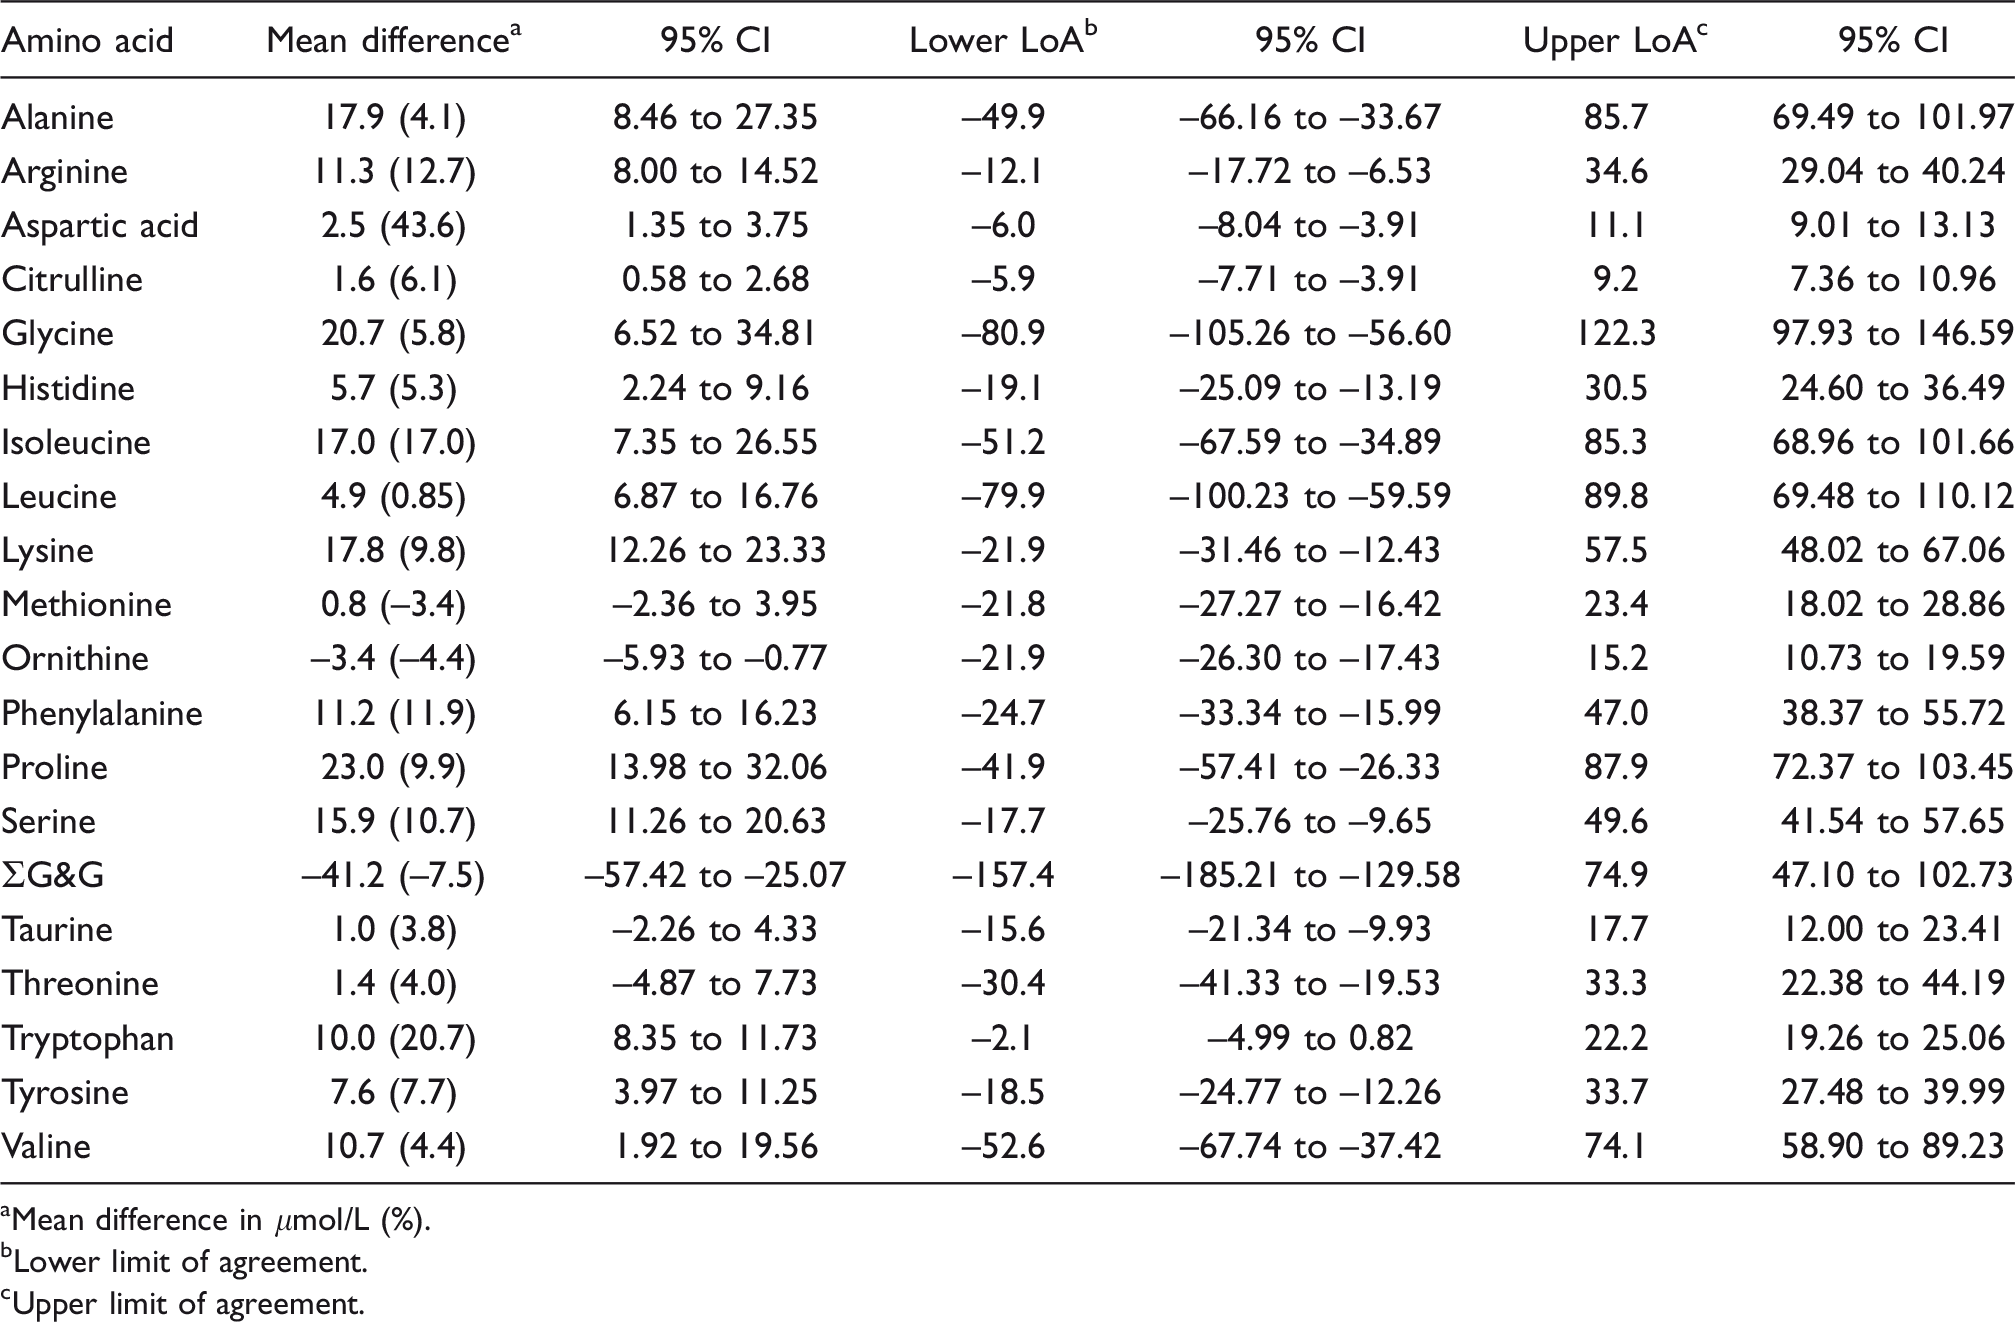
Performance characteristics of the method are summarized in the supplemental material. Nine amino acids measured by LC-MS had CCC < 0.90, five between 0.90 and 0.95 and 6 > 0.95 (Table 1). Passing–Bablok regression analysis indicated that tryptophan, lysine, citrulline, arginine and taurine had significant proportional error and alanine, histidine and lysine had significant constant error. Bland–Altman analysis showed the mean bias for all analytes was –6.8 μmol/L (median –5.3, range –42.5 to +41.1) with four analytes having a bias > |20| μmol/L (41.1, –28.0, –42.5 and –40.8 μmol/L for ∑G&G, lysine, alanine and glycine, respectively) (Table 2). Inter-assay imprecision was satisfactory (<10%) for most analytes in the high IQC material, notable exceptions being citrulline, glutamate, lysine and taurine (20.3, 14.6, 10.9 and 16.2%, respectively). Imprecision was unsatisfactory (>10%) in the low IQC material. Results did not compare well with the ERNDIM quantitative amino acid scheme. Compared with the median of all other participants, 8/15 analytes had a mean bias > 10% (see supplemental material).
Passing–Bablok regression and concordance correlation analysis: Waters AccQ Tag™ ULTRA LC-MS kit vs. IEC.
aμmol/L.
Bland–Altman summary: Waters AccQ Tag™ ULTRA LC-MS kit vs. IEC.
aMean difference in μmol/L (%).
bLower limit of agreement.
cUpper limit of agreement.
LC-MS/MS SpOtOn Amino Acids Reagent Kit vs. IEC
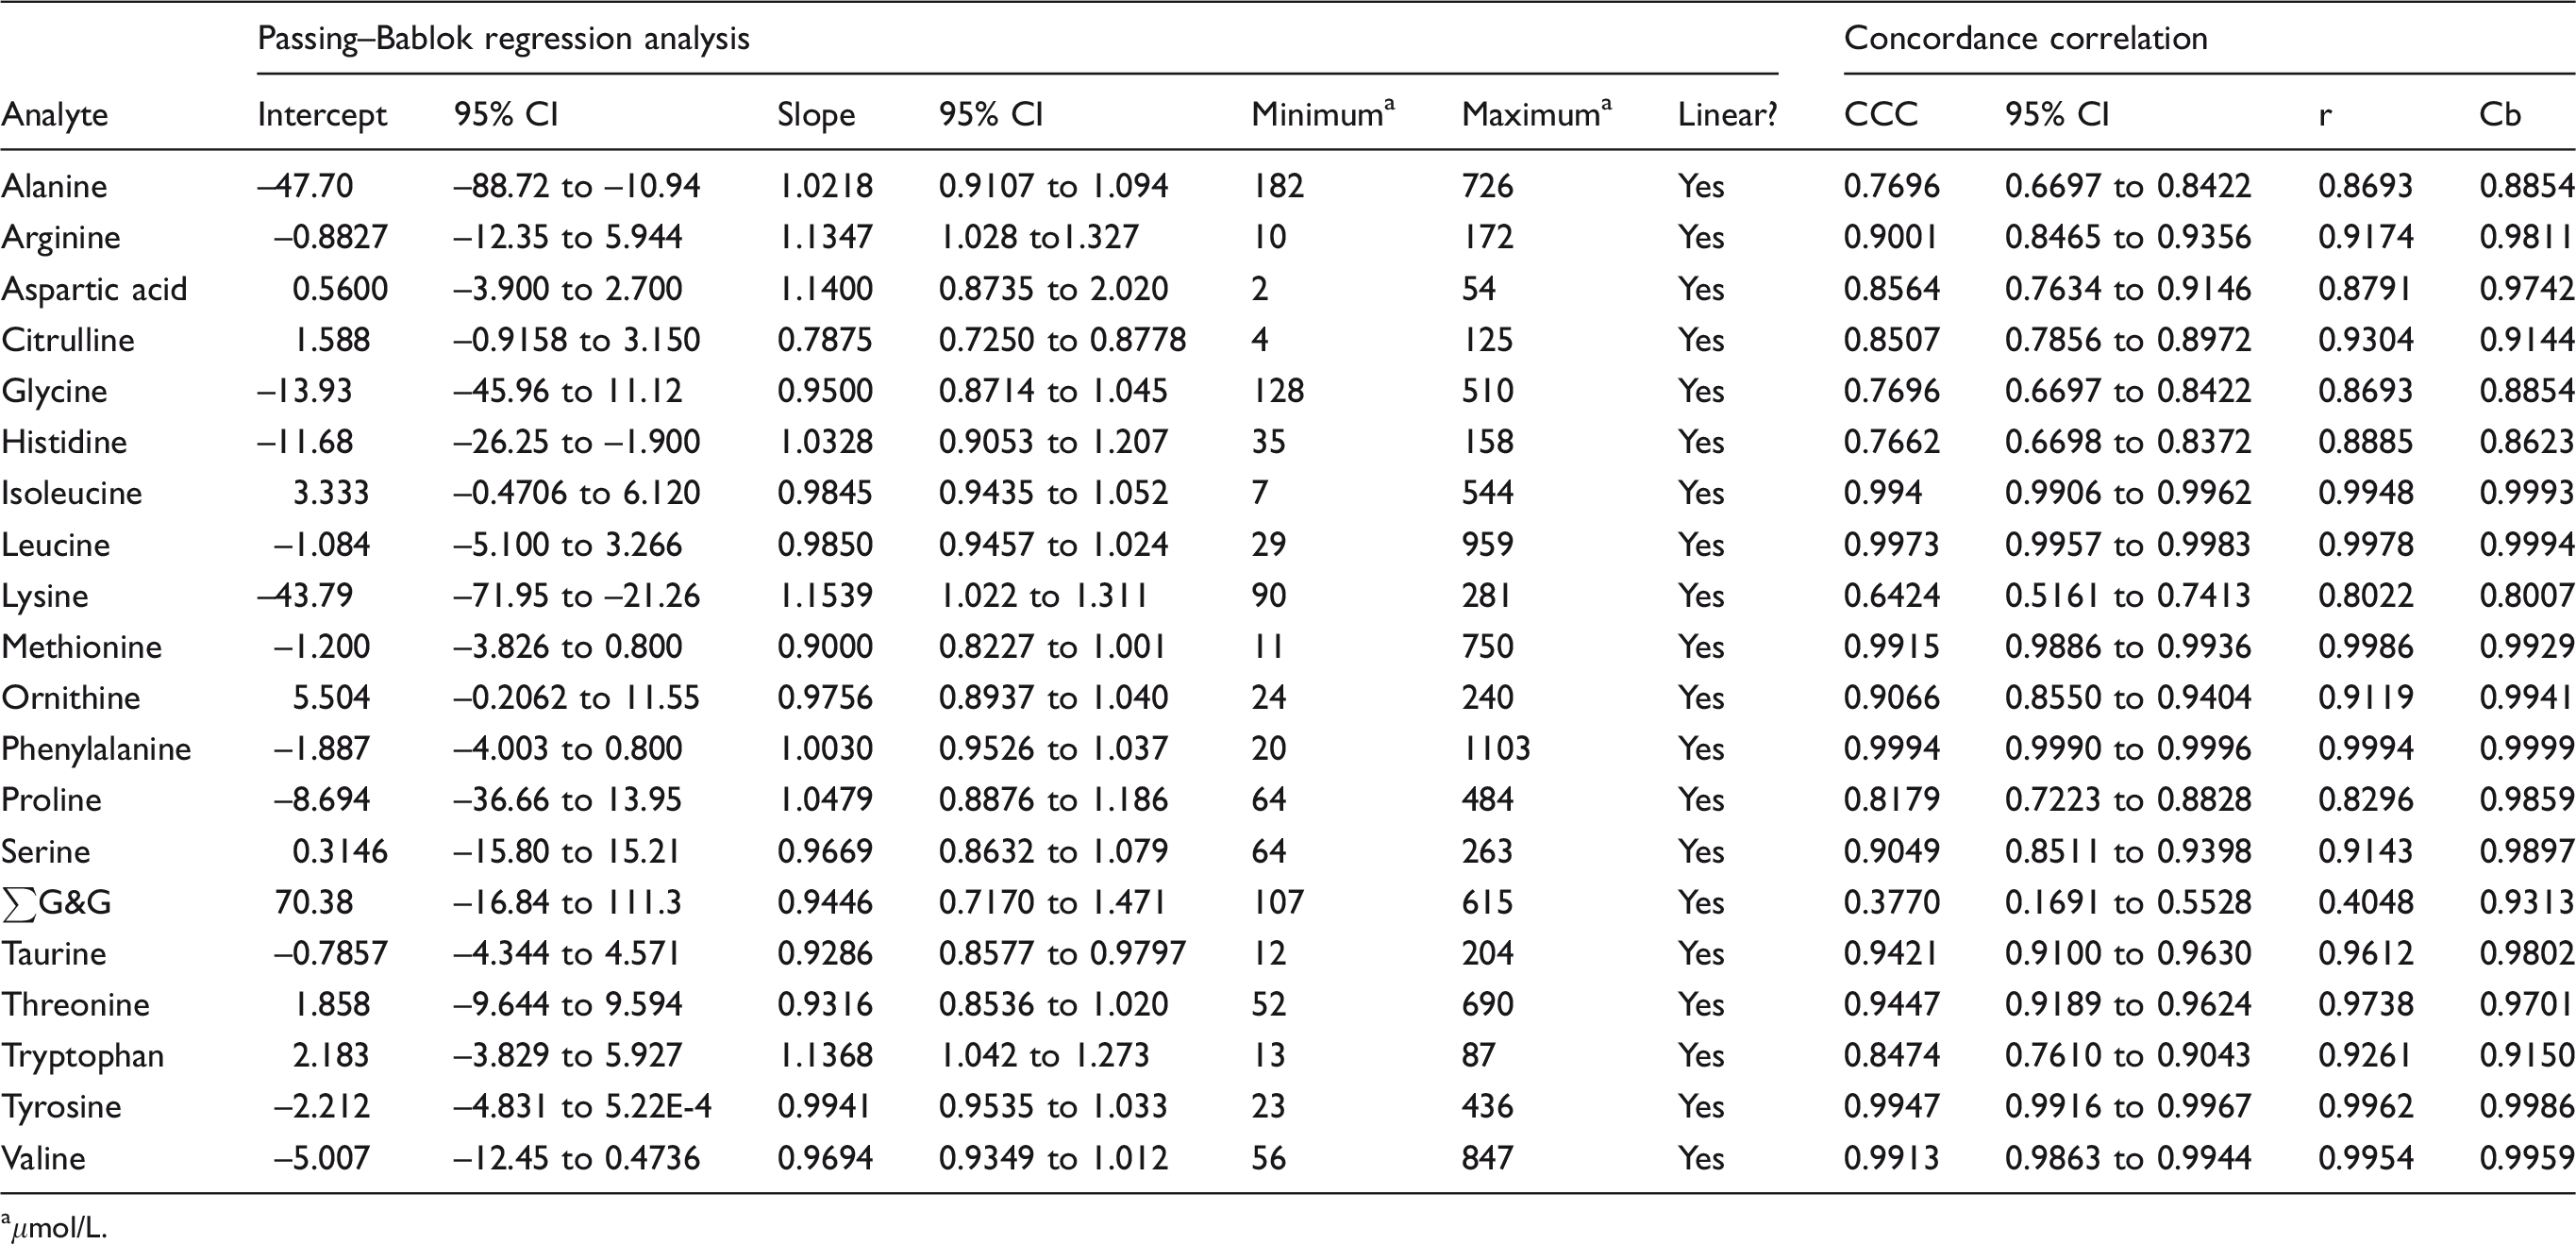
Performance characteristics of the method have been reported in detail elsewhere. 8 Eight amino acids measured by SpOtOn LC-MS/MS had CCC < 0.90, 2 between 0.90 and 0.95 and 10 > 0.95 (Table 3). Passing–Bablok regression analysis indicated that histidine, arginine, alanine and proline had both proportional and constant error; tryptophan, phenylalanine, tyrosine, isoleucine, glycine and serine had proportional error; aspartate and ∑G&G had constant error. Bland–Altman analysis showed the mean bias for all analytes was +6.6 μmol/L (median +8.8, range –41.0 to +23) with three analytes having a bias > |20| μmol/L (–41.0, +20.7, +23.0 for ∑G&G, glycine and proline, respectively) (Table 4). Inter-assay imprecision was satisfactory (<10%) for all analytes in both IQC materials except for glycine (12.2%). Results compared well with the ERNDIM quantitative amino acid scheme. Compared with the median of all other participants, 4/15 analytes had a mean bias > 10% (see supplemental material).
Passing–Bablok regression and concordance correlation analysis: SpOtOn LC-MS/MS kit vs. IEC.
aμmol/L.
Bland-Altman summary: SpOtOn LC-MS/MS kit vs. IEC.
aMean difference in μmol/L (%).
bLower limit of agreement.
cUpper limit of agreement.
LC-MS/MS with MassChrom® Amino Acid Analysis in plasma/serum kit vs. IEC
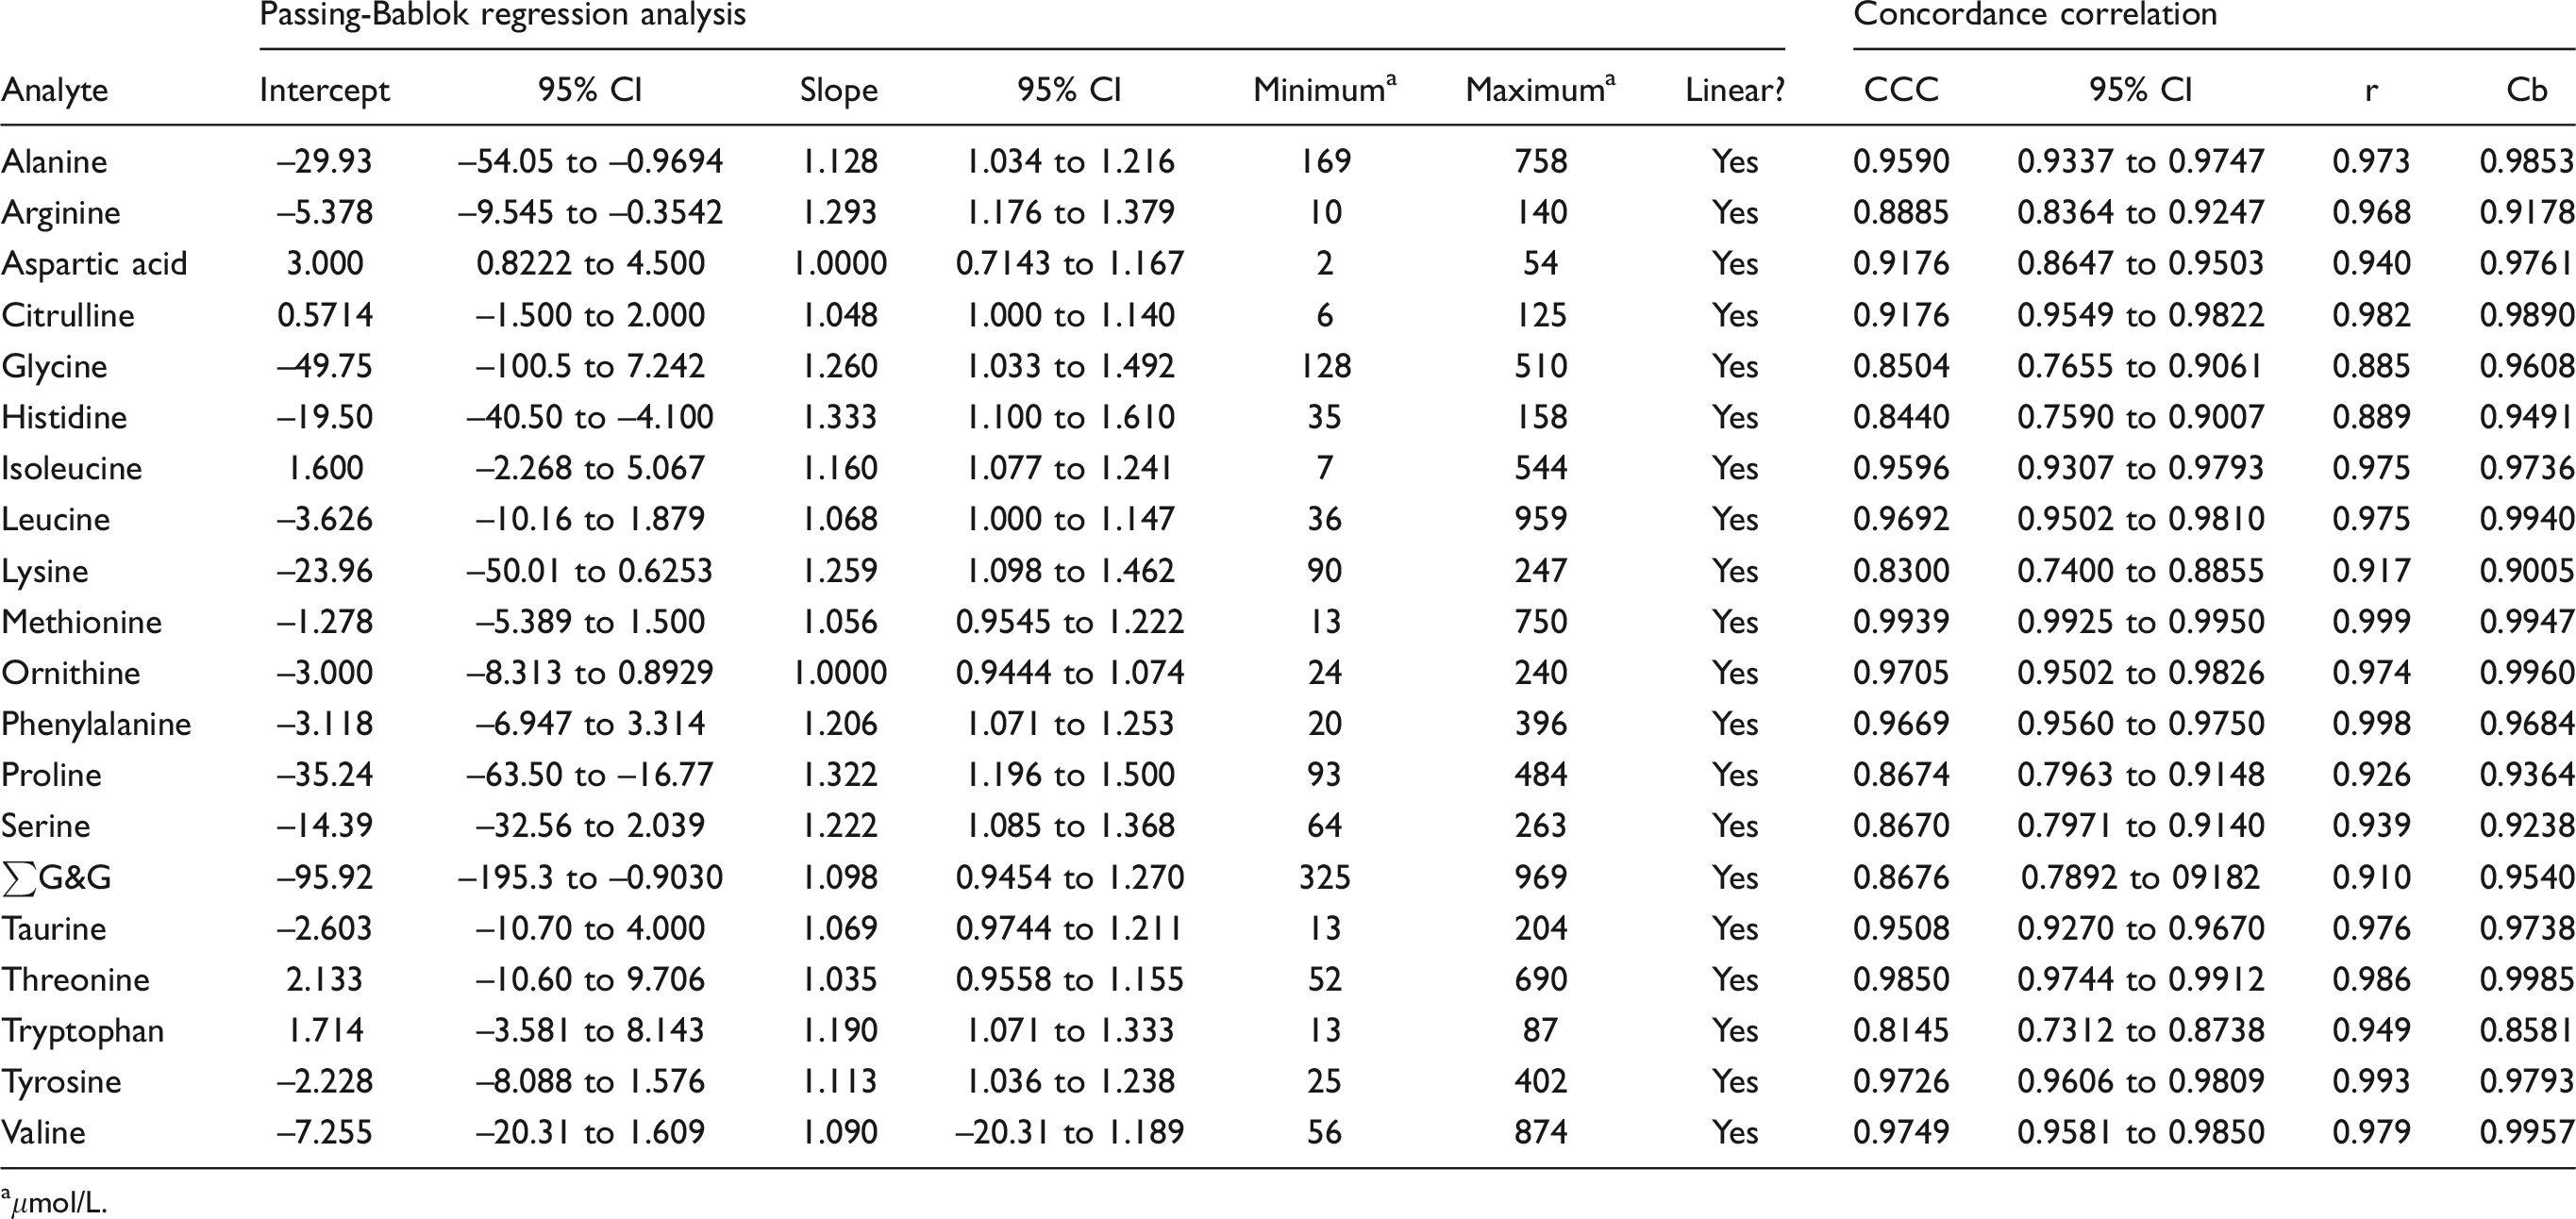
Performance characteristics of the method are summarized in the supplemental material. Seven amino acids measured by Chromsystems LC-MS/MS had concordance correlation coefficients (CCC) < 0.90, 3 between 0.90 and 0.95 and 10 > 0.95 (Table 5). Passing–Bablok regression analysis indicated that valine, serine and leucine had both proportional and constant error; citrulline, isoleucine, methionine and threonine had constant error; alanine, glycine, lysine, ornithine, phenylalanine and tryptophan had significant proportional error. Bland–Altman analysis showed the mean bias for all analytes was +15.7 μmol/L (median +9.4, range –1.8 to +60.5) with five analytes having a bias > |20| μmol/L (+24.3, +25.2. +41.8, +50.1, +60.5 for histidine, threonine, glycine, alanine and serine, respectively) (Table 6). Inter-assay imprecision was satisfactory for all analytes (<10%) in the high IQC material. Results compared well with the ERNDIM quantitative amino acid scheme. Compared with the median of all other participants, 3/15 analytes had a mean bias > 10% (see supplemental material).
Passing-Bablok regression and concordance correlation analysis: LC-MS/MS MassChrom® Amino Acid Analysis in plasma/serum kit vs. IEC.
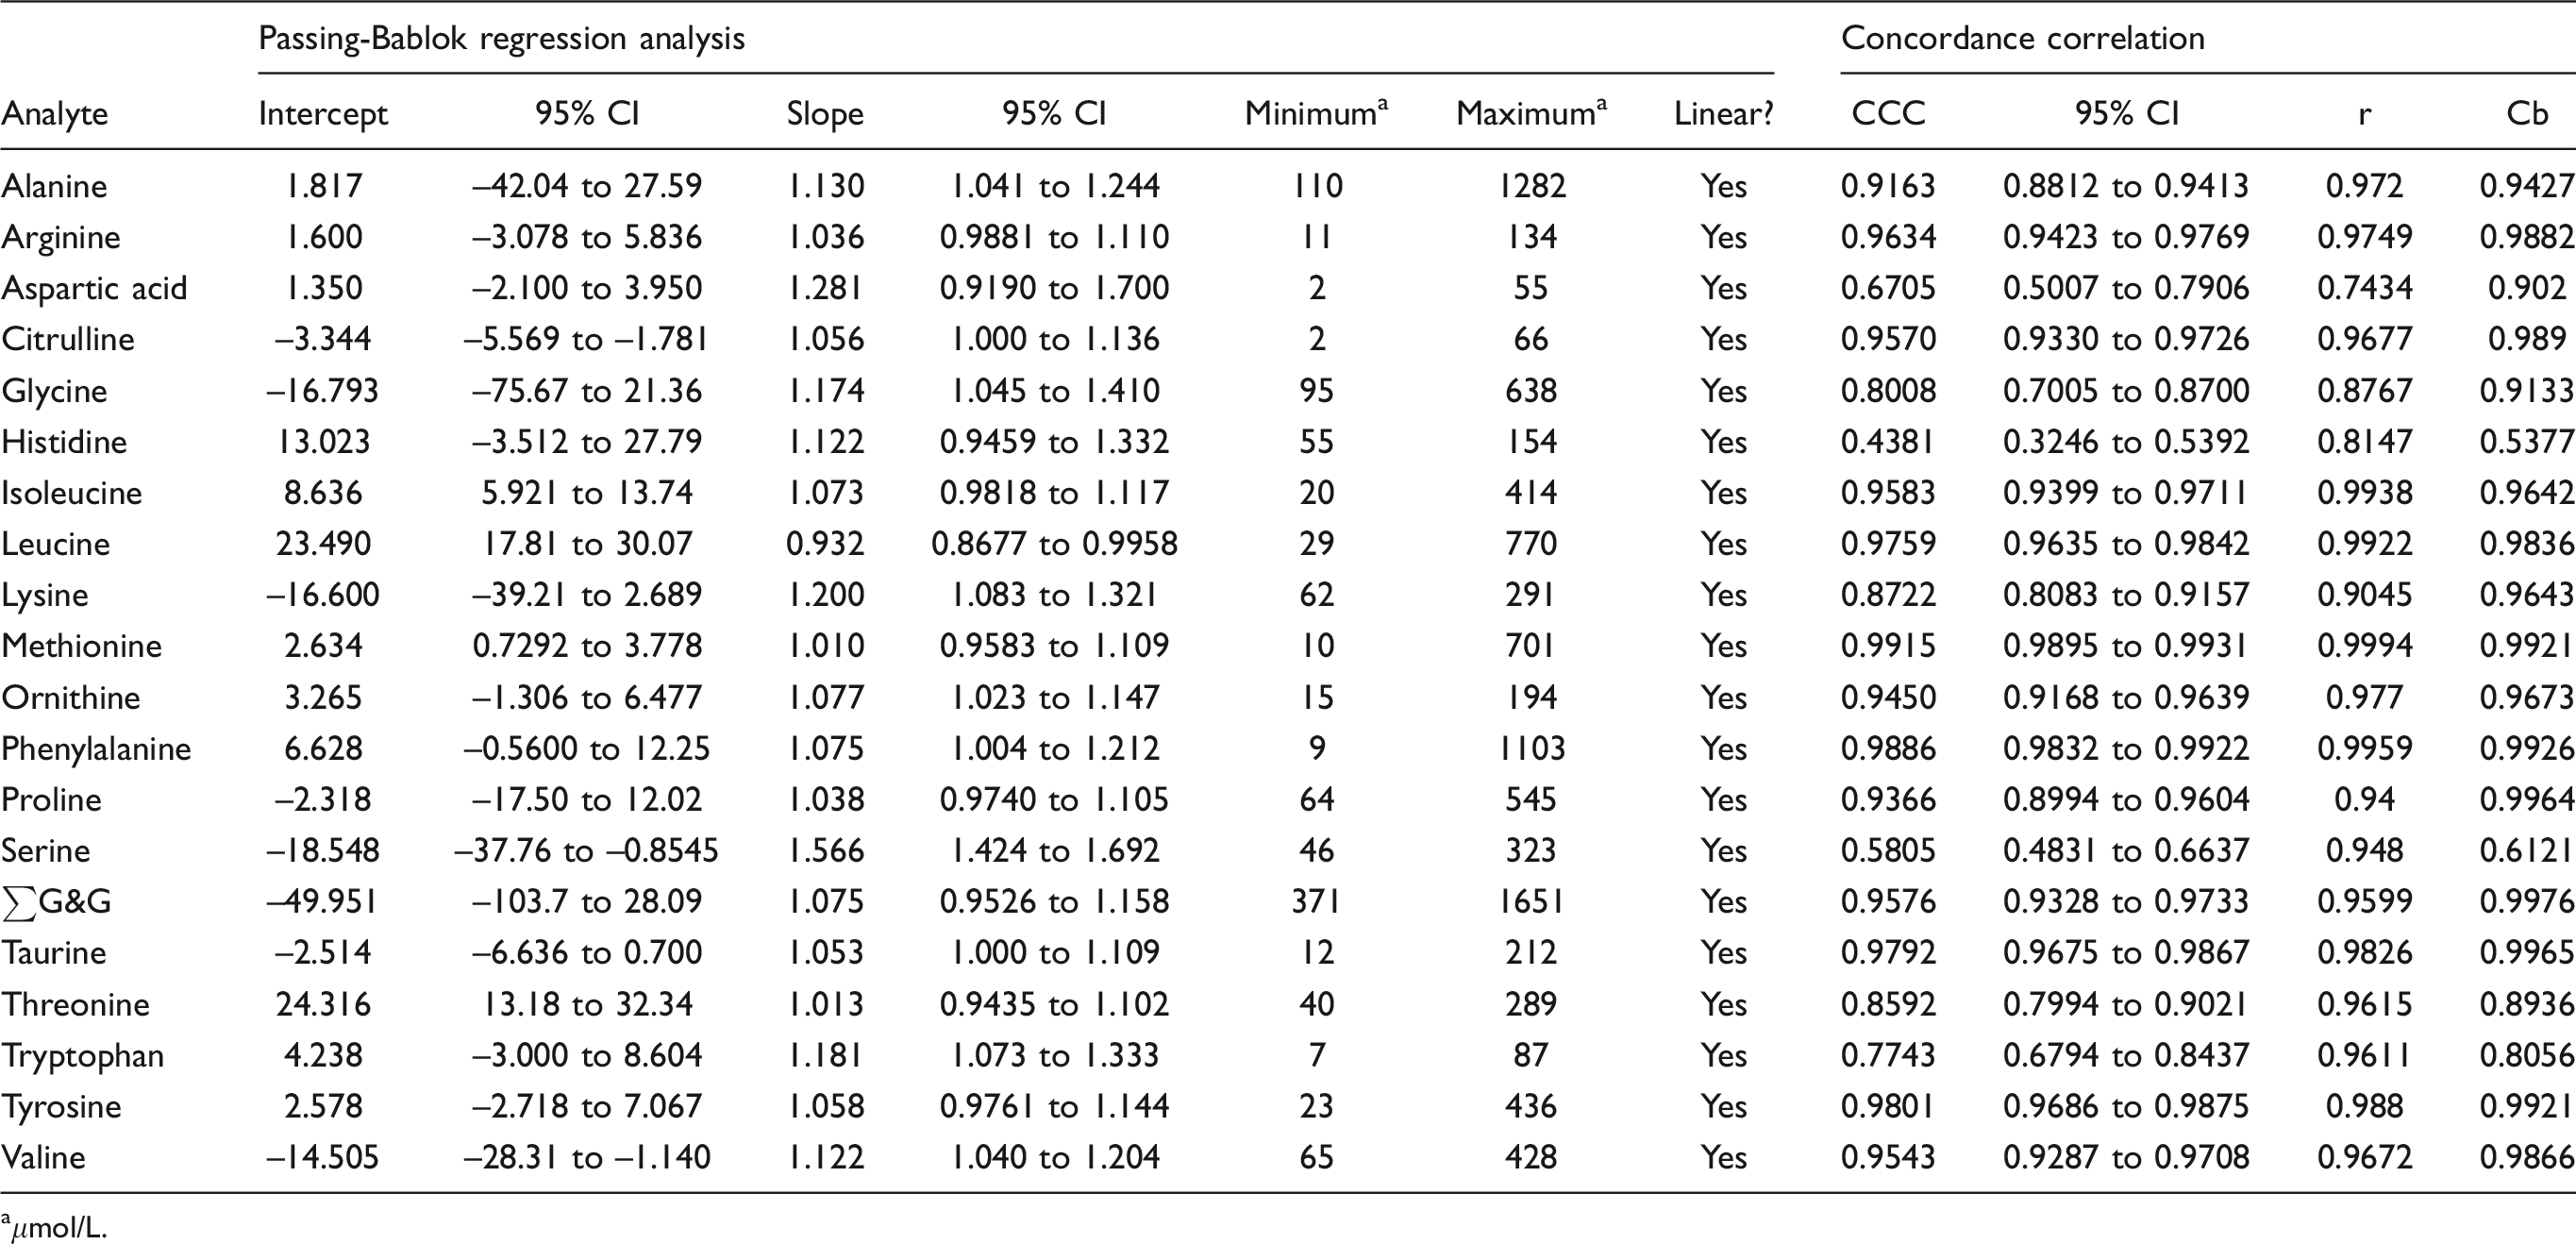
aμmol/L.
Bland–Altman summary: Chromsystems MassChrom® Amino Acid Analysis LC-MS/MS kit vs. IEC.
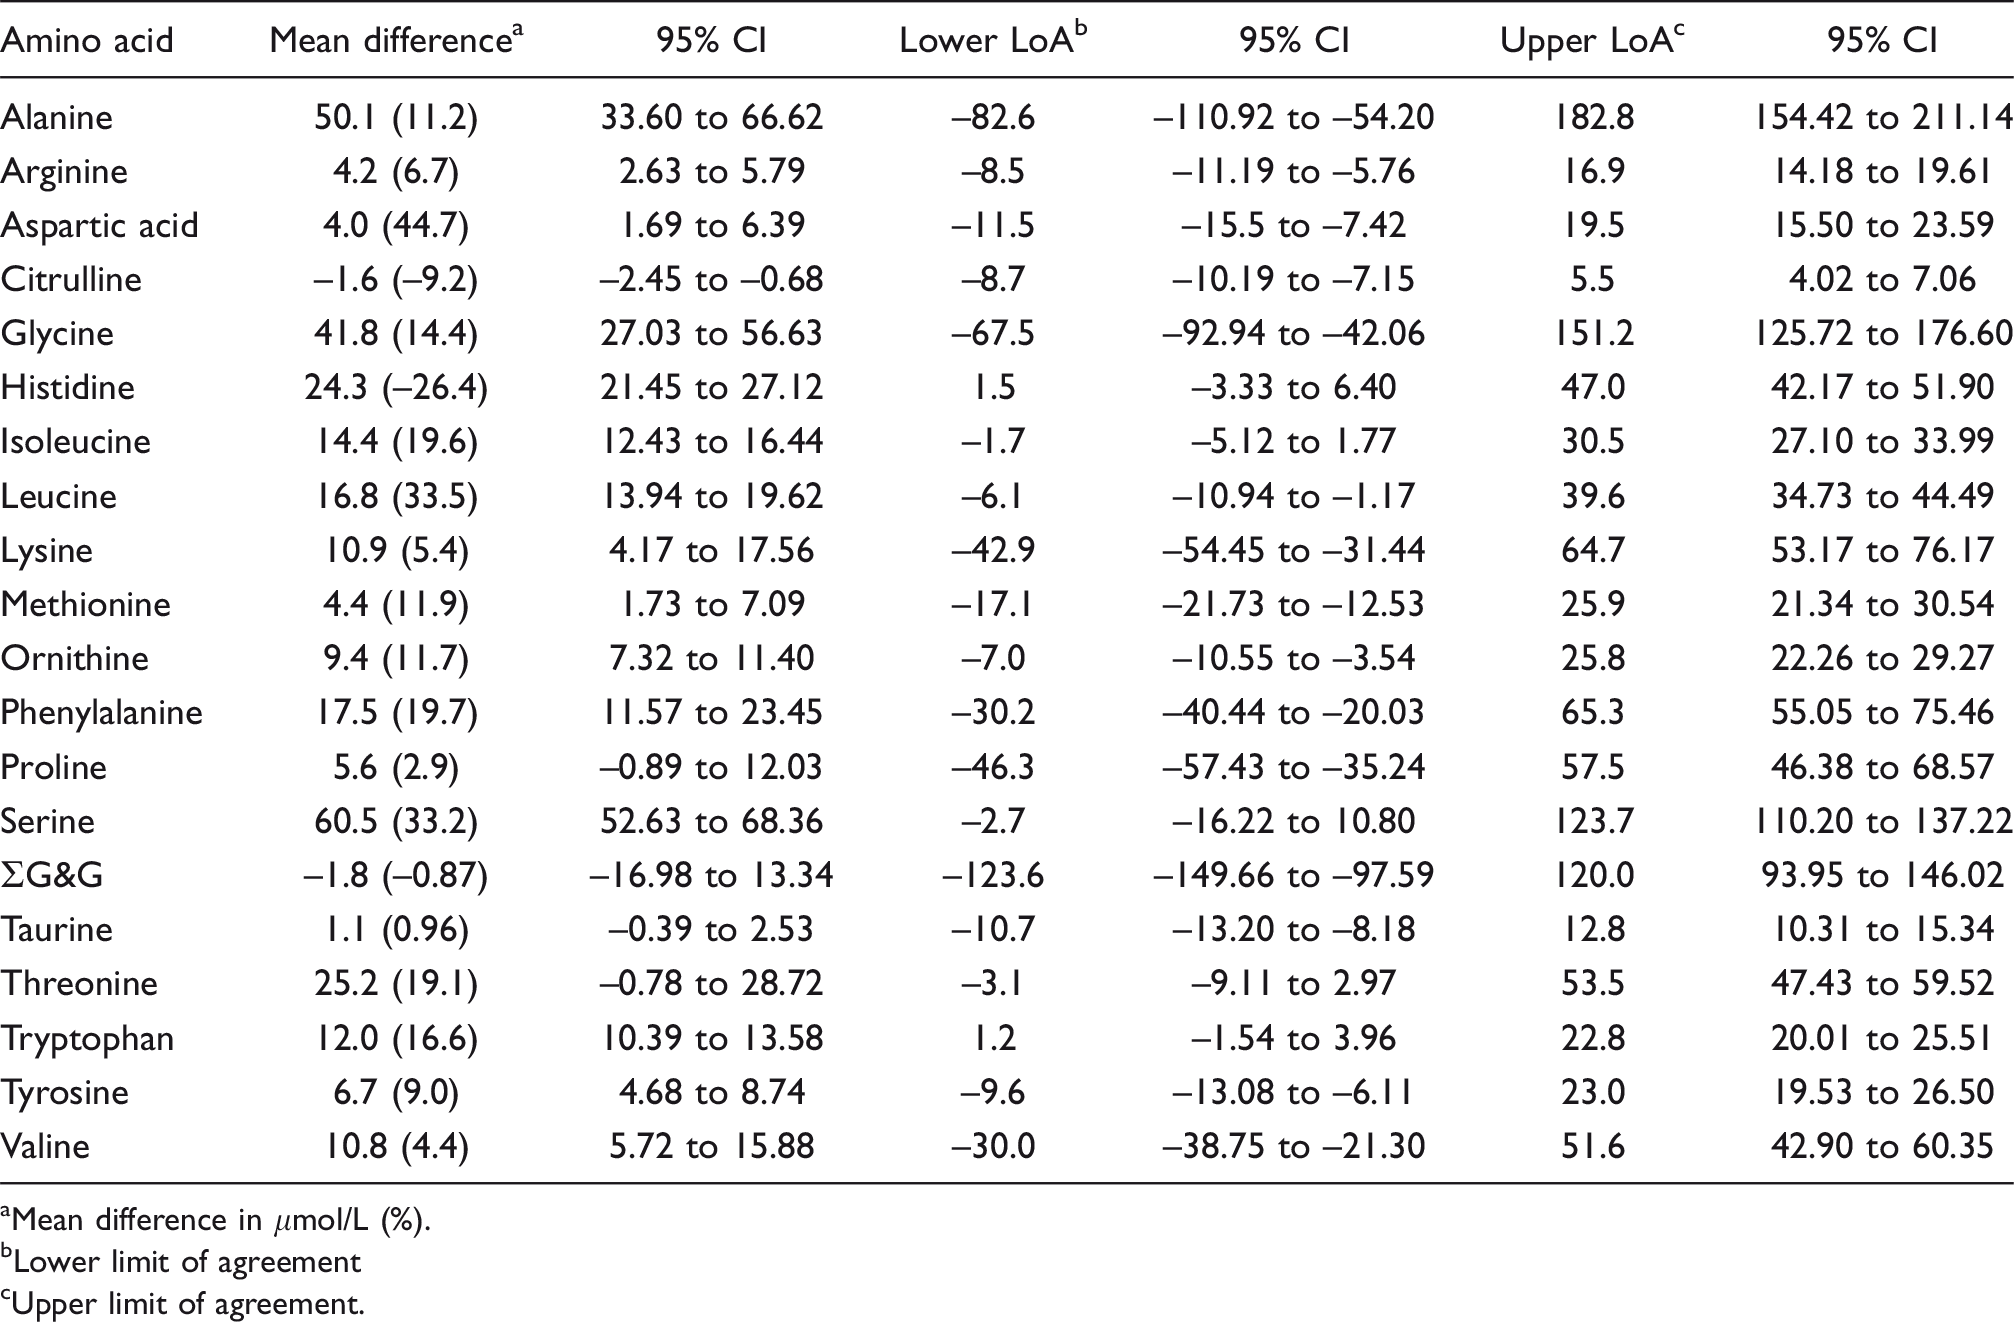
aMean difference in μmol/L (%).
bLower limit of agreement
cUpper limit of agreement.
Discussion
One of the challenges with plasma amino acid analysis is the requirement to measure multiple analytes at concentrations ranging over three orders of magnitude in a single analysis. For example, a patient with ornithine transcarbamylase deficiency may present with citrulline <10 μmol/L and glutamine >1500 μmol/L. As such, the sensitivity and specificity of some amino acids tend to be sacrificed to enable measurement of a clinically useful profile. It is important that laboratories understand the limitations of their methodology and how this may impact on method comparison. This is an advantage of IEC which has been widely used in clinical laboratories for over 40 years. There is significant experience with the technique and its limitations are well described: long analysis time, lack of specificity, use of a single, analogue IS, single point and infrequent calibration, infrequent IQC, poor retention of acidic compounds and the requirement for subsequent analysis with modified programmes to overcome some of these issues. In comparison, there is significantly less experience with mass spectrometry-based methods and, dependent on a laboratory’s expertise, perhaps a tendency to focus on the reported limitations, of which there were many when amino acid analysis by tandem mass spectrometry was first described.12,13 Technology has improved since then and modern mass spectrometers scan faster and rapidly switch polarity. These changes, coupled with the introduction of ultra high-performance liquid chromatography (UHPLC), have seen various methods and approaches described, 2 which can be classified by the requirement for derivatization14–17 or utilization of ion pair reagents.18–20 Derivatization can improve chromatographic separation and mass spectrometric properties of small m/z species, for example, glycine, proline and alanine, measurement of which presents a specific challenge for LC-MS-based methods.21,22 Disadvantages include poor reproducibility of the derivative yield, variable derivatization efficiency of different amino acids and the instability of the derivatives.23,24 Ion pair reagents negate the need for derivatization and facilitate good chromatographic separation.20–26 However, they are prone to retention time instability and reagents may foul the LC components, ion source and mass spectrometer causing signal suppression in subsequent analysis and diminished column performance. This lack of robustness and efficiency limits routine utility and, more recently, methods have been described which negate the need for derivatization or ion pair reagents.7,27
The criteria for acceptability of a method depend on both analytical performance and applicability. Acceptability requirements may differ dependent upon the intended use of the test, for example diagnosis vs. monitoring. Performance considers the type and magnitude of error and tends to be evidence based; applicability is more subjective, considering sample size, speed of analysis, equipment, reagents, personnel, cost, etc. Acceptable performance can be judged as the amount of analytical error allowable without affecting use or interpretation of test results; hence, clinical laboratories should use performance goals based on biological variation.28,29 Corte and Venta generated biological variation data for free plasma amino acids and used this to derive objective quality specifications for imprecision (I), bias (B) and total error (TE). 30 As imprecision and bias had been determined for each kit, the TE could be calculated using the equation TE = I + (1.65 × B), providing an additional way to benchmark analytical performance of the three kits. A limitation of this study is that the assessment of bias did not include aspartate, glutamate, glutamine, serine, methionine or tryptophan, the first five due to instability, the latter not being present in the ERNDIM samples.
The LC-MS AccQ Tag™ ULTRA reagent kit provides good chromatographic resolution of all analytes, including the isobaric-branched chain amino acids (BCAA) and detects all analytes of interest within a 9-min analysis. The specificity of the assay is achieved through chromatographic resolution and SIM. The measuring range of all analytes is adequate and reagents, calibrators, stable isotopes and analytical column is provided, and the LC-MS system is relatively inexpensive. However, the analytical performance of the kit was inferior to the others tested. Only 6/21 analytes correlated with IEC; citrulline, glutamine, ornithine, taurine, tryptophan, alanine, aspartate, glycine, histidine, glutamate, arginine, lysine, serine and proline did not. The first five analytes lacked a stable isotope IS which was probably a major contributing factor; the scatter around the regression line for citrulline, glutamine and taurine indicated significant random error. It is postulated that derivatization efficiency/variability and the lack of specificity resulting from SIM were also important factors, the latter evidenced by reports that the AccQ Tag™ ULTRA reagent kit performs better if used with a tandem mass spectrometer, albeit for the measurement of amino acids in tissue homogenate. 31 In view of this, it is surprising that the manufacturer markets the kit for use with LC-MS. From the practical perspective, the AccQ Tag™ ULTRA kit is also disadvantaged by the additional time required for derivatization (approx. 60 min), thus limiting the possibility of real-time analysis. The authors understand that the manufacturer is working to resolve these issues and is exploring the introduction of additional stable isotope ISs.
The specificity of the SpOtOn reagent kit is achieved through a combination of chromatographic resolution and SRM. However, it should be noted that the kit does not resolve the isobaric BCAA, isoleucine and alloisoleucine, reporting instead ‘total isoleucine’. This is a pragmatic approach given that most patient samples do not contain alloisoleucine. Samples with an increased concentration of ‘total isoleucine’ are referred for second line testing. The kit detects all analytes of interest within 15 min, including sulphocysteine, argininosuccinic acid (ASA), homocitrulline, sarcosine and homocystine. The kit also provides the analytical column, stable isotope IS mix and three levels of calibrator. Both IS and calibrators are at appropriate concentrations for the required analytical ranges. A stable isotope IS is provided for all analytes except for ASA. No other reagents or IQC material are provided. The chirobiotic column produces stable retention times and is capable of > 6000 injections. 8 The underivatized approach means that sample preparation is quick and simple, taking approximately 20 min, and the 15-min analysis time enables the real-time analysis of clinically urgent samples in real time. However, it also makes the measurement of analytes with small m/z more challenging, evident from the relatively poorer sensitivity of glycine, alanine, serine and proline. While performance of these analytes is clinically acceptable, it is important that laboratories are aware of these limitations.
Analytical performance of the SpOtOn kit is comparable with IEC and the kit has the advantage of superior specificity. Although there is evidence of greater imprecision at lower concentrations, this will not impact clinically. Thirteen of 21 analytes correlated with IEC. However, ∑G&G, serine, tryptophan, arginine, glycine, histidine, lysine and proline did not. As all samples were analysed by IEC first and underwent freeze–thaw cycles prior to analysis by LC-MS/MS, degradation of the sample explains the mean negative bias of 41.2 μmol/L observed for ∑G&G. Likewise, serine had a mean positive bias of 15.9 μmol/L which is probably due to a combination of instability, serine having been reported to increase in samples at room temperature, 32 and the presence of a poorly resolved isobaric compound in some patient samples. The poor correlation for tryptophan was expected because accurate measurement by IEC is hampered by under-recovery due to acid hydrolysis 33 and poor resolution from histidine and 3-methylhistidine. The other five analytes demonstrated positive proportional bias compared with IEC, and it is hypothesized that this is due to calibration differences: sporadic single point at 250 μmol/L for IEC vs. daily three-point curve. Visual inspection of the Passing–Bablok plots showed significant scatter around the regression line for glycine, in keeping with the greater imprecision associated with its measurement and contributing to the poorer correlation. There was less scatter for the other analytes but again evidence that random error was probably a contributing factor. This could be explained by inaccuracies due to integration of chromatographic peaks on IEC and/or interference from isobaric compounds with the LC-MS/MS assay.
The specificity of the Chromsystems MassChrom® Amino Acid Analysis kit is achieved through a combination of chromatographic resolution and SRM and, unlike the SpOtOn assay, chromatographic separation of the isobaric BCAA is achieved, negating the need for second line testing. The kit detects all analytes of interest within 19 min, including sulphocysteine, ASA, homocitrulline, alloisoleucine, sarcosine and homocysteine, 48 compounds in total. The analytical column and all necessary reagents including mobile phase, rinsing solution and precipitation reagent are provided along with three levels of calibrator and three levels of lyophilized IQC material, both containing 37 analytes of interest. The availability of a commercial CE-IVD compliant reagent kit can simplify reagent management procedures required for accreditation to UKAS standards. The benefit of this in the routine clinical laboratory should not be underestimated. The kit also includes a stable isotope IS for every analyte. Sample preparation is quick and simple, taking approximately 20 min and utilizing sensible volumes for a manual assay. As with the SpOtOn kit, the underivatized approach has an impact on the sensitivity of analytes with a small m/z.
The concentrations of the calibrators and IQC supplied in the evaluation kit Lot V1918 were not reflective of the measuring range required clinically, which was a major limitation. However, it was possible to demonstrate that the assay was linear to higher concentrations, and the reagent kit that was released to the market in February 2020 has revised calibrator concentrations, suitable for clinical use. The column was prone to retention time instability, which is a disadvantage especially for a multi-analyte method with several time function windows. It may also limit the potential for real-time analysis against a previous calibration. The manufacturer reports that this issue can be resolved by back flushing the column in 11% mobile phase B during shutdown. It is worth noting that due to limitations with software, certain mass spectrometers may require workarounds for quantification with this reagent kit. Waters MassLynx software contains a limited number of ‘conc’ fields in which calibrator concentrations can be programmed. Once these are exceeded, raw data must be reprocessed separately using a different file. The Chromsystems assay required three processing files which is a limitation when in routine use. The authors understand from Waters that an imminent software update for TargetLynx will resolve this issue.
Analytical performance of the kit is comparable with IEC, although there is evidence of greater imprecision at lower concentrations. Thirteen of 21 analytes correlated with IEC, but serine, tryptophan, threonine, aspartate, glycine, histidine and lysine did not. The manufacturer acknowledged an issue with serine in the evaluation kit Lot V1918 and the assay has since been modified. Data provided by the manufacturer demonstrated agreement with IEC (n = 120, slope = 0.95, 95% CI 0.93–0.98). Tryptophan was not expected to correlate well with IEC as discussed above. Threonine had a constant positive bias of 24 μmol/L, pointing to a specific issue with one of the methods. However, there was no evidence of either background or isobaric interference with threonine or IS on the LC-MS/MS method. The other four analytes demonstrated positive proportional bias compared with IEC and again it is hypothesized that this is due to calibration differences: sporadic single point at 250 μmol/L for IEC vs. daily three-point curve. Visual inspection of the Passing–Bablok plots showed scatter around the regression line for tryptophan, histidine, aspartate and lysine, indicating that random error is also a contributing factor. This could be explained by inaccuracies due to integration of chromatographic peaks on IEC and/or interference from isobaric compounds with the LC-MS/MS assay. As some samples were analysed by IEC first and underwent freeze–thaw cycles prior to analysis by LC-MS/MS, degradation of asparagine could also be a factor for aspartate.
Benchmarking analytical performance of the three kits against objective quality goals verified the findings described above. There were 17 analytes where it was possible to benchmark analytical performance, but the acknowledged instability of methionine and serine in the ERNDIM EQA material mean these analytes had to be excluded due to significant bias. For the remaining 15 analytes, the SpotOn kit performed well with only three analytes failing the criteria for TE. For glycine this reflected imprecision, TE = 22.5% vs. the goal of 20.2%, whereas for phenylalanine and histidine it was predominantly a reflection of bias, TE = 21.3% vs. 18.2% goal and 27.6% vs. 15.2% goal respectively. Likewise, the Chromsystems MassChrom® Amino Acid Analysis kit performed well with only two analytes failing the TE criteria. Histidine had a TE of 42.8% vs. 15.2% goal which was due to a combination of bias (mean bias 26.2% vs. 7.2% goal) and imprecision (10.1% vs. 4.9% goal), whereas the TE for serine was 22.7%, just 1% greater than the goal. Conversely, 6/15 analytes in the AccQ Tag™ kit failed to meet the required specification for TE. Four of 6 analytes exhibited a TE between 1.5 and 2 times greater than the goal (alanine, histidine, lysine and taurine) due to a combination of bias and imprecision.
It is important to note that using ERNDIM Quantitative Amino Acids EQA material to establish bias is potentially a major limitation. The bias of each kit has been determined by comparison of results to a derivation of the ERNDIM all laboratory trimmed mean, not a true target value. As such, the bias determined here is not a measure of absolute accuracy. It is simply a measure of performance relative to peers. To put this in perspective, in 2017, the inter-laboratory variation in the ERNDIM Quantitative Amino Acids EQA scheme of the 21 amino acids measured here ranged from 7.5% for threonine to 16.1% for aspartate (mean 10.2%, median 10.1%). However, when results were compared with the nominal target values, significant bias was evident for some analytes. For example, in sample 2017.6 the average bias for taurine was 12.8%, range 9.2–16.8%, at target concentration of 50 μmol/L and for methionine the average bias was 33.8%, range 28.5–41.4%, at target concentration of 20 μmol/L. The ERNDIM scheme distributes n = 8 samples each year and is the only amino acid EQA scheme in Europe. In the absence of a commercially available, matrix-matched standard reference material for the amino acids routinely measured in the clinical environment, absolute accuracy is an issue pertinent to all methods.
Conclusions
The SpOtOn Amino Acid kit and the Chromsystems MassChrom® Amino Acid Analysis premarket evaluation kit both demonstrated analytical performance comparable with that of IEC and acceptable correlation for the majority of analytes. For those analytes which did not correlate well, there is no evidence to indicate that measurement by IEC confers a truer result and the inferior specificity and limitations of the calibration would in fact indicate the opposite. In conclusion, although the Chromsystems kit has the advantage of greater applicability, in the authors’ opinion, both kits are suitable for use in the routine clinical laboratory and provide many advantages over IEC.
Supplemental Material
sj-pdf-1-acb-10.1177_0004563220933303 - Supplemental material for Challenging the status quo: A comparison of ion exchange chromatography with liquid chromatography–mass spectrometry and liquid chromatography–tandem mass spectrometry methods for the measurement of amino acids in human plasma
Supplemental material, sj-pdf-1-acb-10.1177_0004563220933303 for Challenging the status quo: A comparison of ion exchange chromatography with liquid chromatography–mass spectrometry and liquid chromatography–tandem mass spectrometry methods for the measurement of amino acids in human plasma by Rachel S Carling, Benjamin AC McDonald, Donna Austin, Deborah Burden, Joana Correia, Jenny Leung, Beverley Mayers and Catharine John in Annals of Clinical Biochemistry
Footnotes
Acknowledgements
Reagent kits were provided free of charge by the manufacturers.
Declaration of conflicting interests
The author(s) declared no potential conflicts of interest with respect to the research, authorship, and/or publication of this article.
Funding
The author(s) received no financial support for the research, authorship, and/or publication of this article.
Ethical approval
Not applicable.
Guarantor
RSC.
Contributorship
RSC conceived the study and undertook the statistical analysis. BACM, JL, DA, BM, JC and CJ performed the sample analysis. RSC prepared the article. All authors reviewed and edited the article and approved the final version.
Supplemental material
Tables summarizing the performance parameters, calibrator concentrations and instrument settings for the Chromsystems MassChrom® Amino Acid Analysis kit, the performance parameters and instrument settings for the LC-MS AccQ Tag™ ULTRA reagent kit and the mean bias of each analyte compared with the ERNDIM quantitative amino acids all laboratory mean value. Supplemental material for this article is available online.
References
Supplementary Material
Please find the following supplemental material available below.
For Open Access articles published under a Creative Commons License, all supplemental material carries the same license as the article it is associated with.
For non-Open Access articles published, all supplemental material carries a non-exclusive license, and permission requests for re-use of supplemental material or any part of supplemental material shall be sent directly to the copyright owner as specified in the copyright notice associated with the article.