
Abstract
Background
Even when a laboratory analyte testing process is in control, routine quality control testing will fail with a frequency that can be predicted by the number of quality control levels used, the run frequency and the control rule employed. We explored whether simply counting the number of assay quality control run failures during a running week, and then objectively determining if there was an excess, could complement daily quality control processes in identifying an out-of-control assay.
Methods
Binomial statistics were used to determine the threshold number of quality control run failures in any rolling week which would statistically exceed that expected for a particular test. Power function graphs were used to establish error detection (Ped) and false rejection rates compared with popular control rules.
Results
Identifying quality control failures exceeding the weekly limit (QC FEWL) is a more powerful means of detecting smaller systematic (bias) errors than traditional daily control rules (12s, 13s or 13s/22s/R4s) and markedly superior in detecting smaller random (imprecision) errors while maintaining false identification rates below 2%. Error detection rates also exceeded those using a within- and between-run Westgard multirule (13s/22s/41s/10x).
Conclusions
Daily review of tests shown to statistically exceed their rolling week limit of expected quality control run failures is more powerful than traditional quality control tools at identifying potential systematic and random test errors and so offers a supplement to daily quality control practices that has no requirement for complex data extraction or manipulation.
Introduction
Clinical biochemistry laboratories can frequently be testing more than 100 different analytes on their general chemistry and immunoassay platforms, with many of these tests also being duplicated over additional instruments within the same laboratory or network. While an individual quality control (QC) run rule might lead to the identification – and apparent immediate resolution – of a particular assay problem, there is a real challenge in being able to continually review the ongoing QC performance of every test, to catch developing issues, to objectively identify repeatedly troublesome assays and to recognize patterns where a number of assays might have started performing poorly because of a common problem. To help ensure this oversight happens, some accreditation bodies formally mandate that internal QC reviews of all assays are performed at least monthly, 1 but this process can be time consuming and if any quality issues are identified then they may already have been in place for several weeks before being recognized. Ideally, therefore, a strategy to supplement daily QC that used readily collected data and could reliably identify recent but smaller systematic and/or random errors with few false alerts could be of value.
The hypothesis of this study was that counting the number of QC-run failures for an assay during the previous running week and then, on a daily basis, determining if there had been an objective excess of them might be one such strategy. In a similar way that the weekly number of QC-run failures with an in-control assay can be predicted – based on the frequency of each run (e.g. every 8 h), the number of QC samples in each run (e.g. n = 2 or 3) and the performance rule(s) employed (such as 12s, 12.5s or 13s) – so too can the number which would be statistically unexpected from an assay that is still performing satisfactorily. This study therefore sought to establish how the error detection of such an approach performed in comparison with several commonly used or recommended quality control rules.
Methods
Definition of a QC failure event
A QC failure event was defined as there being one or more QC concentration level failures on an initial QC run. This would be recorded as just one event irrespective of what further action was taken subsequently to resolve the finding.
Determination of QC failure limits over one week
Binomial distribution statistics were used to calculate the number of QC-run failures which would be unexpectedly high for each assay in a week. This unexpectedly high sum of events was defined as the number which would correspond to there being a less than 2% probability that they occurred due to chance if the assay was in-control; in other words, the false rejection rate was set at <2%. This threshold of 2% was chosen, as it most closely matched the false rejection rate of existing rules such as 13s, and Westgard within-/between-run multirules. 2
For example, for an assay where three levels of QC are run every 4 h and which employs a 12s rule, the probability of at least one QC level failure in a run is 1 minus the probability of all three levels passing, which, for 12s, is 1–(0.954 × 0.954 × 0.954) = 0.13. As there will be 168 h/4 h runs per week (42), there would be 5.5 QC failure events (0.13 × 42), expected per week. Using binomial statistics, it transpires there is a probability of 0.016 that an in-control assay would have 11 or more events in any running week, which is the first QC event threshold where this probability falls below the previously defined 2%. By comparison to this 12s rule, the corresponding weekly limit for a 13s rule is three or more events. These limits initially required to be established for each test but would subsequently only need recalculated if the QC control rules, testing frequency or number of QC levels changed. Supplementary Table 1 describes the threshold number of QC failure events in a week for a variety of QC levels, rules and frequency.
Comparison of error detection power
Power function curves were constructed to compare the performance of the QC failures exceeding the weekly limit (QC FEWL) strategy to that of several commonly used or recommended control rules. The QC FEWL analysis included the scenarios where QC is measured at 4 h, 8 h, 12 h or 24 h intervals and with either two or three QC samples used in each run. The comparators were the 12s and 13s rules as well as the ‘1:2 s Repeat Sampling Strategy Rule 4’ described by Parvin et al. 2 This latter rule looked at the power of repeat QC testing following an initial 12s QC-run failure and was used here because it was found to be superior to the Westgard 13s/22s/R4s within-run rule. There was also a comparison made with the more comprehensive Westgard 13s/22s/41s/10x multirule which combines data from current and previous QC runs. 3
Most power function curves were constructed from statistical equations (12s, 13s rules, ‘Repeat Sampling Strategy Rule 4’, QC FEWL) and either verified from existing literature (12s, 13s rules, ‘Repeat Sampling Strategy Rule 4’) 2 or using a model involving 100,000 simulated QC runs of randomly generated QC data (QC FEWL). The Westgard 13s/22s/41s/10x curves were constructed solely from the simulated QC runs.
By convention, the ability to detect a systematic or random error with 90% probability (Ped = 0.90) 4 was used to compare the power function curves and there were also comparisons made of the false detection rates, i.e. the probability of detection when no systematic or random error exists.
Results
Table 1 shows the systematic error (expressed as multiples of standard deviation (SD)) and random error (expressed as multiples of an in-control SD) that can be detected with 90% probability using the QC FEWL strategy when two QC samples are measured in each run and where a 12s rule is employed. This is compared with the four comparator control rules. Also included is each rule’s respective false detection rate and, for the QC FEWL strategy, the threshold number of QC failure events per week which triggers the rule. Table 2 shows the equivalent when three QC samples are used in each run.
Detection of systematic and random error with QC FEWL strategy applied to a 12s assay, compared with traditional QC rules (two samples per QC run).
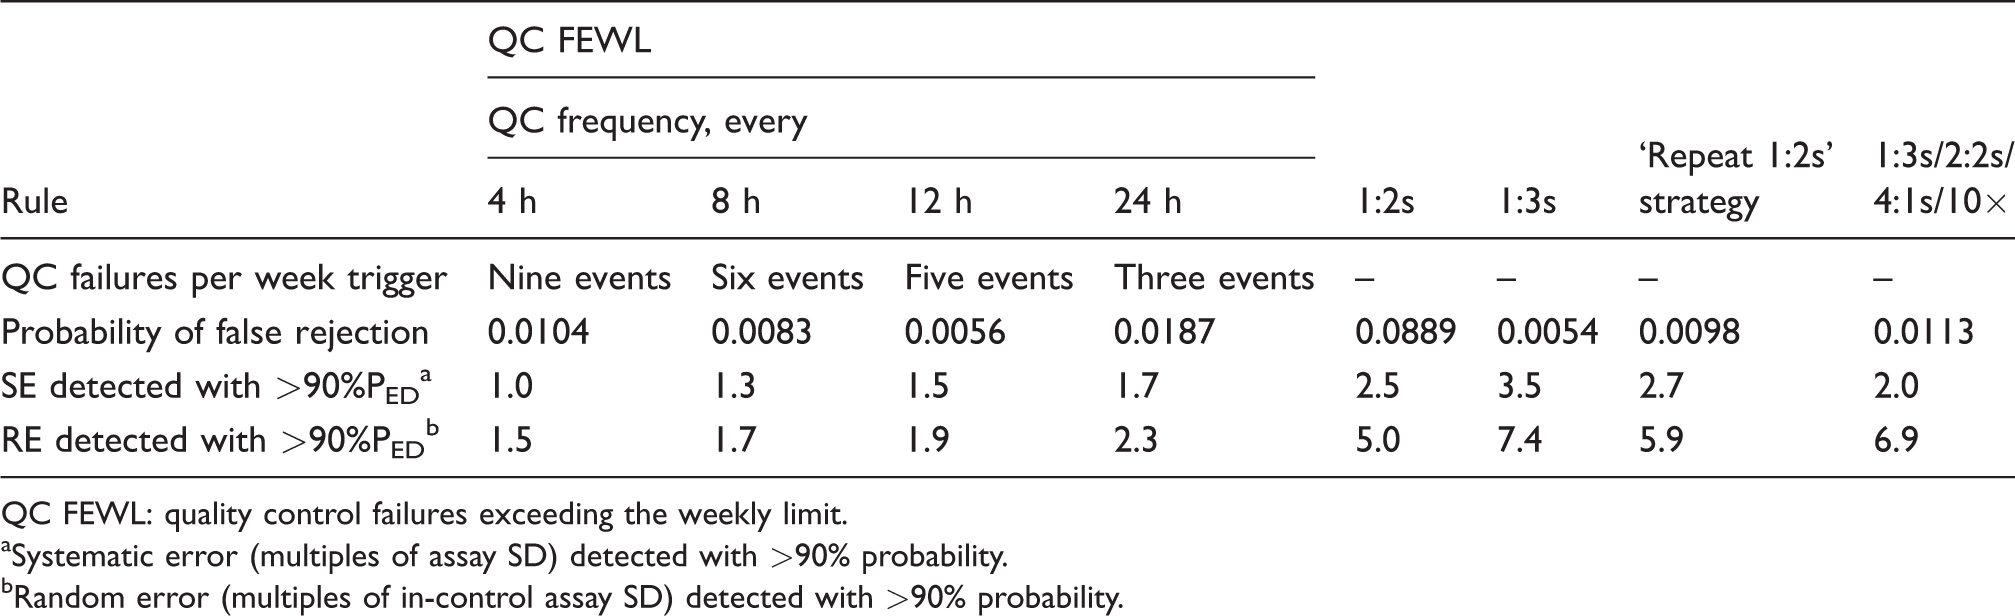
QC FEWL: quality control failures exceeding the weekly limit.
aSystematic error (multiples of assay SD) detected with >90% probability.
bRandom error (multiples of in-control assay SD) detected with >90% probability.
Detection of systematic and random error with QC FEWL strategy applied to a 12s assay, compared with traditional QC rules (three samples per QC run).
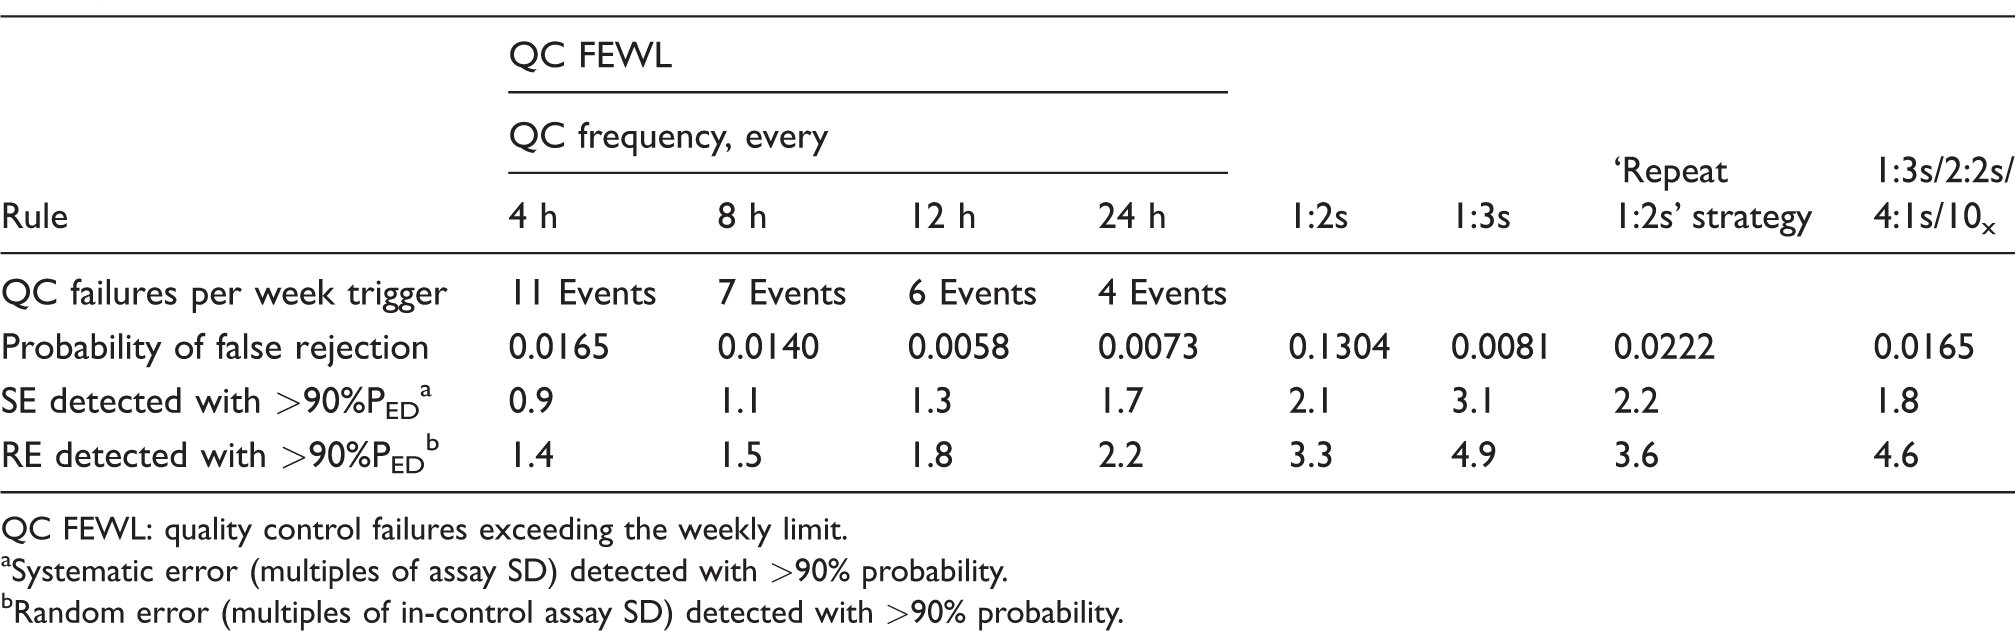
QC FEWL: quality control failures exceeding the weekly limit.
aSystematic error (multiples of assay SD) detected with >90% probability.
bRandom error (multiples of in-control assay SD) detected with >90% probability.
As further illustration, Figure 1 shows the systematic error power function curves for the QC FEWL strategy applied to a 12s assay for n = 2 QC samples per run compared with the comparator rules, and Figure 2 shows the equivalent random error power function curve.
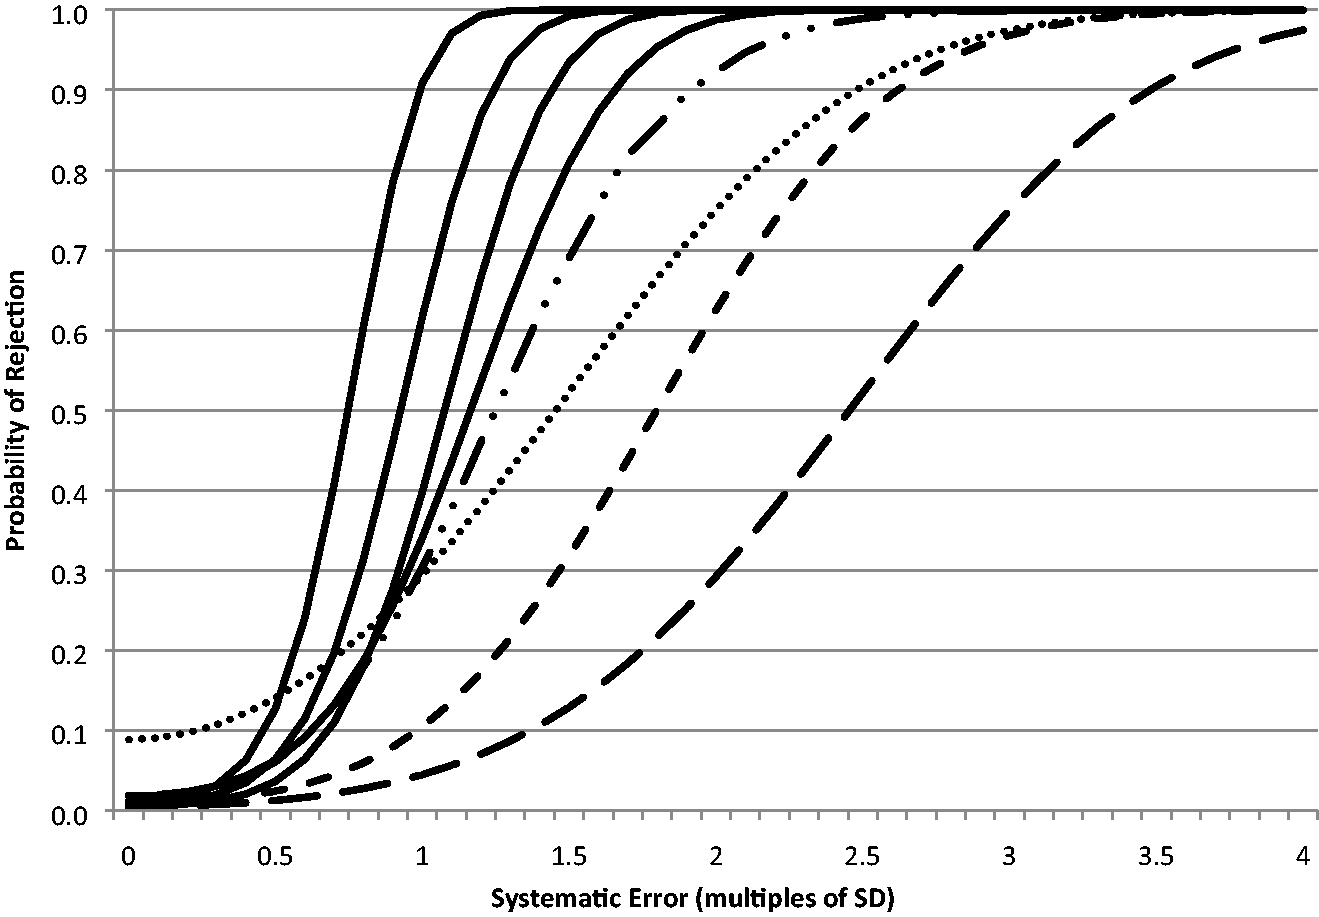
Systematic error power function curves for QC FEWL strategy (
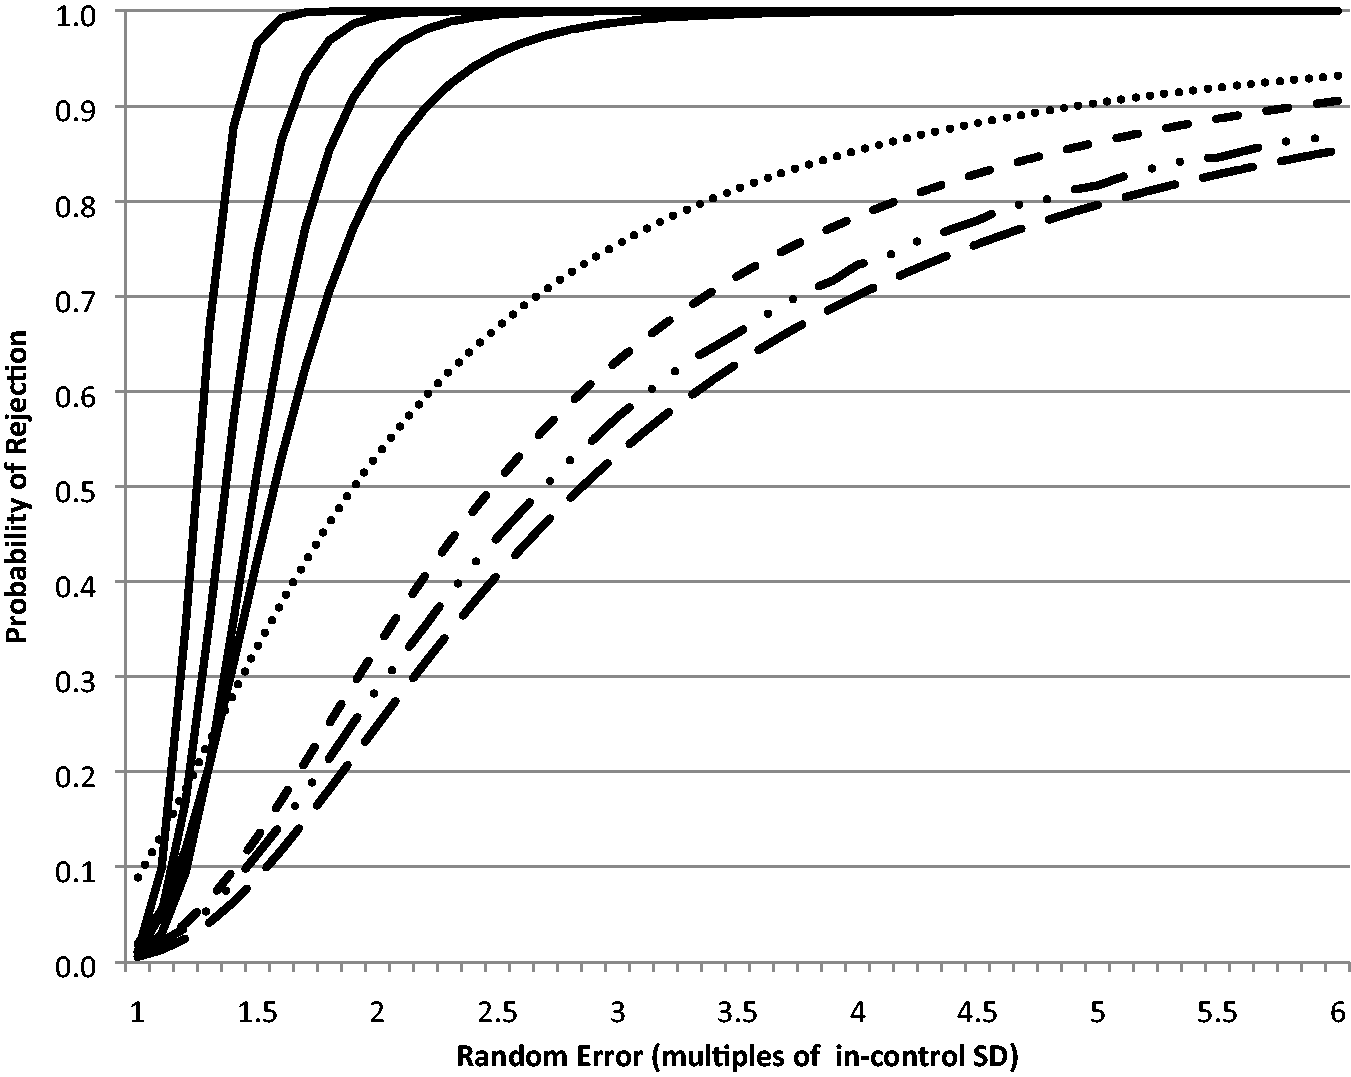
Random error power function curves for QC FEWL strategy (
Applying the same QC FEWL strategy to tests with 12.5s and 13s rules necessarily meant that fewer failure events were required per week to trigger compared with a 12s.assay. Nonetheless, when either two or three QC samples were run, QC FEWL still identified smaller systematic errors than any of the four comparator rules with >90% probability (data not shown) apart from QC run at 24 h frequency where the 13s/22s/41s/10x multirule identified marginally smaller errors (0.1 to 0.4 SDI) than two or three QCs run with the 13s rule or three QCs run with the 13s rule. However, QC FEWL remained markedly superior to all comparator rules at identifying random errors, at worst identifying a 2.7-fold widening of assay SD (24 h frequency using a 13s rule), while all other rules at best identified a 5.0-fold SD widening (12s) when n = 2. When n = 3, QC FEWL identified a 2.3-fold SD widening at worst compared with 3.3-fold at best using all other rules.
Discussion
This study has shown that simply counting the number of times the QC run of an analyte has failed in the previous week can identify systematic biases and random errors in a way that is superior to traditional daily QC strategies as well as a recommended multirule which assesses both within- and between-run QC data. For example, an excess of QC failures using two QC concentration levels per run can, with greater than 90% probability, identify an assay bias between 1.0 and 1.7 standard deviations (SDI) from the in-control mean, depending on whether QC is run every 4 or 24 h or somewhere in-between (Table 1). This compares with an SDI of 2.5 to 3.5 with common daily QC strategies and 2.0 SDI using the more complex within- and between-run 13s/22s/41s/10x multirule. None of the commonly used comparator control rules described here are adept at identifying random error, presumably because between-run rules such as 41s and 10x are designed to identify systematic errors instead. For example, again using two QC samples per run as an example, an assay needs to expand its SD by at least five times what is normal before there is a >90% chance of any of these rules triggering (Table 1). By comparison, the QC FEWL strategy identifies random errors by the time an assay’s SD has exceeded 1.5 to 2.3 times normal. Thus, while QC FEWL certainly seems better at identifying systematic errors related to bias, it appears especially superior to traditional rules at detecting random errors related to imprecision. This is achieved while keeping the probability of falsely identifying assay problems to under 2%, which compares favourably to existing control rules, especially 12s where this is 8.9% with two control samples per run and 13% for three samples. 2
Much of the analysis presented in this paper has used a limit for QC failures based on an assay whose daily QC control rule is 12s, but generally similar performance was shown to be the case using assays whose daily control is either 12.5s or 13s. In a 2018 survey of 21 clinical laboratories in leading US academic medical centres, 5 16 solely employed the 12s rule across all their chemistry and immunoassay tests, 3 used mostly 12s, 12.5s or 13s and only 2 routinely applied Westgard rules. The 12s rule seems commonly used in the UK as well, with 55% of laboratories using just this rule in a 2011 survey. 6 It therefore implies that use of QC FEWL could be relevant to many laboratories, since it is common to already apply one of the rules tested in this current study.
The reasons why this QC FEWL tool seems to perform better than existing daily QC processes are likely to be multifactorial. However, the fact that much more QC data are being considered over the previous week than a single QC run is very likely to be one of them, as is, as noted above, that the between-run element of the Westgard 13s/22s/41s/10x multirule does not focus on random errors.
The principle behind the method described here for identifying analytical error is not dissimilar to that underlying the suggestion by Badrick and colleagues using patient data. 7 They counted a change in the number of results exceeding a truncated range of patient values for a test (prostate-specific antigen (PSA) in their example) and intervened when an excess was identified. Both theirs and this QC FEWL method found that more subtle systematic and random errors could be readily identified. 8 An advantage to Badrick’s suggestion is that this could be applied to test concentrations where QC material was not readily available (such as very low PSA values) but readily acknowledged that their proposal was most suitable for high volume assays on relatively stable population groups. 9 The QC FEWL strategy depicted here has its own advantages of not having the latter requirements and uses data which is already routinely being collected.
In the author’s laboratory, the QC FEWL approach was implemented in mid-2018 in the form of two spreadsheets which are completed with the number of QC failure events each of the 178 assays recorded from the previous day. The spreadsheets have allowed for a more targeted and efficient daily discussion of QC by automatically highlighting the tests needing extra attention (by exceeding their rolling weekly limit) to the staff’s morning Huddle, who report back the same or following day with their investigation and any actions. Therefore, in our practice, identification of a highlighted test does not necessarily mean its immediate discontinuation but does trigger prompt review. The general consensus in the laboratory is that QC FEWL is a tool which rarely highlights tests that do not need this review and can catch assay performance changes before they become a persistent or larger problem, including where an intervention following daily QC failure has not been completely successful, where recalibration is needed ahead of time, where a reagent lot change has had a larger impact on QC values than anticipated or where a more complex assay issue is present. There have also been occasions when several tests on the same instrument highlight at similar times, with the spreadsheet cluster of visual cues pointing towards a possible common cause for the multiple alerts. As a support for monthly QC reviews, the spreadsheet also includes an indication as to whether an assay has exceeded the number of QC failures expected during the entire calendar month.
Disadvantages to using the tool include those that are inherent to other QC control rules, such as the requirement to have reliable mean and SD values established for each test, especially following changes in QC or reagent lot. Also like most other QC control rules, this approach does not take account of the magnitude to which a QC value has exceeded its control limit nor does it immediately indicate the type of error (systematic and/or random), any direction of a systematic error or whether one or more QC levels are at fault. In addition, as the tool is intended to supplement rather than replace daily QC, it is by definition an additional task for laboratory staff, albeit one which seems to provide benefit. A specific observation we have had using the tool is that an assay can still alert as requiring review in the days following implementation of a successful corrective action, purely because QC failure events in the days immediately prior to the intervention are still being counted in the weekly total, so it is usually wise to recognize this as a possibility.
In conclusion, the QC FEWL tool does not require complex data extraction or manipulation but is more powerful at identifying smaller systematic and/or random test errors than many traditional daily QC practices. Together, they may therefore complement one another in giving greater daily assurance of assay quality.
Supplemental Material
Supplemental material for Quality control failures exceeding the weekly limit (QC FEWL): a simple tool to improve assay error detection
Supplemental Material for Quality control failures exceeding the weekly limit (QC FEWL): a simple tool to improve assay error detection by Eric S Kilpatrick in Annals of Clinical Biochemistry
Footnotes
Acknowledgements
Thanks are due to the laboratory team at Sidra Medicine who have helped implement and hone the QC FEWL tool.
Declaration of conflicting interests
The author(s) declared no potential conflicts of interest with respect to the research, authorship, and/or publication of this article.
Funding
The author(s) received no financial support for the research, authorship, and/or publication of this article.
Ethical approval
Not applicable.
Guarantor
ESK.
Contributorship
ESK helped conceive the idea, developed the concept, performed the statistical analysis and wrote the paper.
References
Supplementary Material
Please find the following supplemental material available below.
For Open Access articles published under a Creative Commons License, all supplemental material carries the same license as the article it is associated with.
For non-Open Access articles published, all supplemental material carries a non-exclusive license, and permission requests for re-use of supplemental material or any part of supplemental material shall be sent directly to the copyright owner as specified in the copyright notice associated with the article.