
Abstract
Background
The widely accepted practice of not reporting any results from ethylenediaminetetraacetic acid (EDTA) contaminated samples necessitates repeat phlebotomy and could delay clinical management decisions. EDTA, however, interferes variably or not at all in assays. EDTA concentration in contaminated samples, like serum indices, therefore, could be used to selectively report the result of analytes not affected at measured EDTA concentration.
Methods
A serum pool, level 1 and level 3 internal quality control materials were spiked with tripotassium-EDTA to create samples with EDTA concentration up to 6.0 mmol/L. EDTA and 45 common and critically important analytes were measured on Abbott Architect to identify EDTA concentrations for analytes where the change in concentration exceeded their respective reference change value (RCV) for unidirectional change at 95% probability.
Results
Serum potassium increased and calcium decreased exceeding RCV at 0.17 mmol/L EDTA. Alkaline phosphatase (ALP) decreased exceeding RCV at EDTA >1.86 mmol/L. The decrease in iron did not exceed a wide RCV of 61.9% until maximum spiked EDTA but exceeded the desirable specification for allowable total error (30.7%) at EDTA >1.86 mmol/L. The small decrease in magnesium did not exceed RCV. EDTA up to the concentration in blood collection tubes did not affect the results of any other measured analyte.
Conclusions
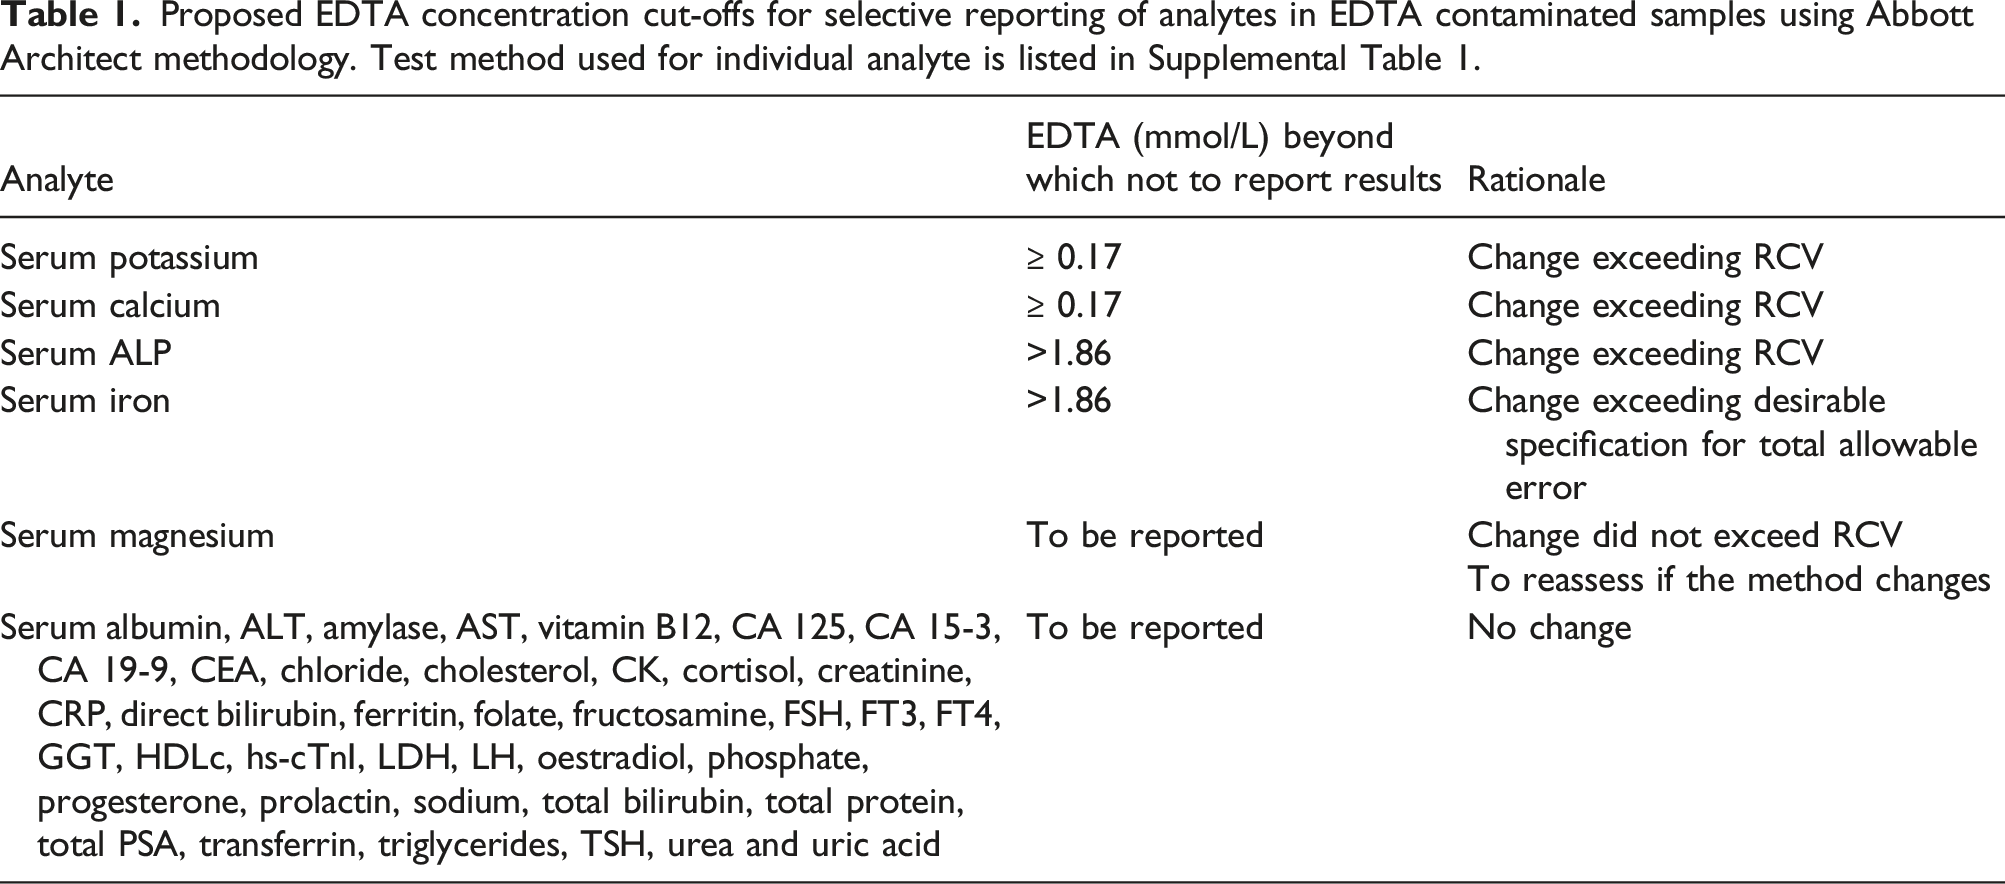
Only serum potassium, calcium, ALP and iron studies, of the 45 analytes studied, should not be reported in EDTA contaminated samples. EDTA concentration cut-offs for selective reporting would further facilitate reporting of these analytes in EDTA contaminated samples.
Background
Ethylenediaminetetraacetic acid (EDTA) is a polyprotic acid containing four carboxylic acid and two amine groups. Each EDTA amine group has a non-bonding electron pair that can chelate calcium, magnesium and other metal ions. 1 Many enzymatic reactions including those of the coagulation cascade require divalent metal ions and, therefore, EDTA is a useful anticoagulant.1,2 EDTA is the preferred anticoagulant for most haematology tests as it preserves cellular morphology. EDTA sample tubes are also preferred for many other analytes including amino acids, proteins, drugs and for molecular biology. 1 Serum, however, is the preferred sample for most chemistry and immunology assays. Collection of serum and EDTA tubes during the same phlebotomy is common. K3EDTA sample tubes are more commonly used in the United Kingdom and the United States, whereas K2EDTA is more commonly used in other European countries and Japan. 1
Interference in laboratory assays due to haemolysis, icterus or lipaemia (HIL) is common. 3 Major analysers have, therefore, incorporated quantification of HIL by spectrophotometric analysis to identify significant assay interference and prevent the reporting of erroneous results. 3 Each common laboratory assay has a cut-off HIL index beyond which results are not reported. In 2019, for example, the authors’ laboratory did not report 5129 and 27 serum potassium results due to haemolysis and lipaemia, respectively. In comparison, at least 250 samples every year from 2015 to 2019 had EDTA contamination. EDTA contaminated samples are detected by reflexing EDTA when serum potassium is ≥6.0 mmol/L and the H-index is <1.25 (equivalent to 1.25 g/L haemoglobin which is the laboratory’s cut-off for not reporting potassium from haemolysed samples). 4
Ethylenediaminetetraacetic acid interference is, therefore, not uncommon. The reported rates of EDTA contaminated samples range from non-significant to up to 0.46% and may be dependent on phlebotomy devices, blood tubes, phlebotomy training and practice, and method of contamination detection.5–8 Gross EDTA contamination is easily identified using surrogate markers, that is unexpected marked hyperkalaemia and hypocalcaemia accompanied by hypomagnesaemia and hypophosphatasia5,9 and has been estimated to affect 50 to 100 samples per annum. 10 Clinically significant spurious hyperkalaemia from small amounts of potassium EDTA (K-EDTA) is relatively common and may adversely affect patient care. This more subtle K-EDTA contamination is, however, often unrecognised since the surrogate markers are neither sensitive nor specific for its identification and it may only be reliably detected by directly measuring EDTA.4–7
Limited data on a few analytes indicate that EDTA contamination interferes variably in different assays.4,9 EDTA may not interfere in some assays and, indeed, EDTA plasma is an accepted sample type for some assays. Our laboratory’s current practice, however, is not to report any results in samples with EDTA concentration ≥0.20 mmol/L and this is consistent with other laboratories where EDTA contamination is identified with surrogate markers. 10 This may be unnecessary and requires repeat phlebotomy to obtain results of analytes unaffected or less affected by EDTA contamination, delaying decision-making owing to the removal of clinically important results. Therefore, EDTA interference at varying concentrations on the results of important and common biochemical parameters was studied to identify analyte-specific EDTA concentration cut-offs at which the interference exceeds the respective reference change value (RCV), in order to facilitate the reporting of results below this cut-off. These data would facilitate the use of EDTA concentration, in the same way as HIL indices, preventing the release of erroneous results whilst allowing unaffected analyte results to be reported. 3
Methods
Serum was pooled from routine samples after the conclusion of the requested tests. Visually haemolysed, lipaemic or icteric samples were not included. The pool was tested for serum indices (haemolysis index 0.02 representing g/L of free haemoglobin, lipaemic index 0.02 representing mmol/L of intralipid lipaemia, and icteric index 18 representing μmol/L of bilirubin) and EDTA (0.04 mmol/L). A sub-pool with 6.0 mmol/L EDTA was prepared by dissolving K3EDTA.2H20 (CAS Number: 65501-24-8, MW 442.54 g/mol, Sigma-Aldrich BioUltra). Serum samples with EDTA concentrations of 0.0 mmol/L, 0.1 mmol/L, 0.15 mmol/L, 0.2 mmol/L, 0.35 mmol/L, 0.5 mmol/L, 1.0 mmol/L, 2.0 mmol/L, 4.0 mmol/L and 6.0 mmol/L were prepared by mixing the 6.0 mmol/L EDTA serum stock with the pooled serum.
Similarly, K3EDTA.2H20 was added to level 1 (low concentration of most analytes) and level 3 (high concentration of most analytes) internal quality control (IQC) materials (Technopath Multichem S Plus level 1 lot number 10210201 and level 3 lot number 10210203) to prepare level 1 and level 3 IQC stocks containing 6.0 mmol/L EDTA. The 6.0 mmol/L EDTA IQC stocks were mixed with respective IQC material to prepare samples with 0.0 mmol/L, 0.1 mmol/L, 0.2 mmol/L, 1.0 mmol/L, 4.0 mmol/L and 6.0 mmol/L EDTA.
Ethylenediaminetetraacetic acid spiked pooled serum, level 1 IQC and level 3 IQC samples were analysed, in duplicate, on the same day on Abbott Architect c16000 and i2000 analysers (Abbott Laboratories, USA) for EDTA, sodium, potassium, chloride, total calcium, phosphate, magnesium, urea, creatinine, uric acid, total protein, albumin, total bilirubin, conjugated bilirubin, alanine aminotransferase (ALT), aspartate aminotransferase (AST), alkaline phosphatase (ALP), lactate dehydrogenase (LDH), gamma-glutamyl transferase (GGT), amylase, creatine kinase (CK), iron, total cholesterol, HDL cholesterol, triglycerides, fructosamine, C-reactive protein (CRP), cortisol, oestradiol, progesterone, thyroid stimulating hormone (TSH), free T4, free T3, prolactin, ferritin, transferrin, folate, vitamin B12, high sensitivity cardiac troponin-I (hs-cTnI), prostate-specific antigen (PSA), carcinoembryonic antigen (CEA), cancer antigen 125 (CA125), CA15-3, CA19-9, follicular stimulating hormone (FSH) and luteinising hormone (LH).
Validation of the in-house EDTA assay has been published previously. 4 EDTA results higher than the highest EDTA calibrator (0.5 mmol/L) were measured with 1:4 or 1:12 onboard dilution with saline. The fructosamine assay used on the Abbott Architect c16000 is provided by Roche diagnostics. The rest of the assays are provided by Abbott laboratories. Assay methods are included in Supplemental Table 1.
Internal quality control was performed using in-house fresh frozen plasma-based controls for the EDTA assay and commercial QC materials for the rest of the assays. All assays had satisfactory IQC performance on the days of the experiment and satisfactory precision during the previous month. There is no available external quality assurance (EQA) or sample exchange scheme for the EDTA assay and it is not International Organization for Standardization (ISO) accredited. All the other assays had satisfactory EQA performance in the month of the study and were ISO 15189 accredited by the United Kingdom Accreditation Service (UKAS).
The mean of the duplicate measurements was used provided the results were within an arbitrary cut-off of 15%. If not, a third measurement would have been obtained and the closest two results averaged. This, however, was not required. Data were analysed and figures were prepared in Excel 2019 (Microsoft Corp.) and Analyse-it version 5.60 (Analyse-it Software Ltd., UK).
A change exceeding the reference change value (RCV) for unidirectional change with 95% probability was considered significant. EDTA spiked pooled serum results were used to determine the cut-offs. The results of EDTA spiked low- and high-IQC were used for comparison of the degree of change. The RCV was calculated by formula [21/2 * 1.65 * (CVa2 + CVi2)1/2]. 11 The lowest coefficient of variation (CV) of the preceding month’s three-level IQC (two levels for fructosamine) was taken as CVa (Supplemental Table 1). The median within-subject biological variation from the EFLM biological variation database (EFLM BVD) was taken as CVi. 12 EFLM BVD CVi used in the study were derived by meta-analysis except for serum progesterone. Where within-subject biological variation was unavailable in the EFLM database, within-subject biological variation from the Ricos et al. biological variation database was used.13,14 The source of CVi for the individual analytes is specified in Supplemental Table 1.
Results
The RCVs for analytes included in the study are presented in Supplemental Table 1.
Measured EDTA concentration correlated well with spiked concentration (Supplemental Figure 1). The EDTA assay over-recovered at concentrations below 0.20 mmol/L and under-recovered at higher concentrations. For samples with EDTA from 0.15 mmol/L to 6.0 mmol/L, the measured concentration was within ±11% of the spiked concentration.
Serum potassium in pooled serum increased by 6.5%, 9.1% and 11.2% at EDTA concentrations of 0.13 mmol/L, 0.16 mmol/L and 0.20 mmol/L, respectively. The degree of increase in potassium with an increase in EDTA concentration was similar in spiked pooled serum, level 1 and level 3 IQC samples irrespective of baseline serum potassium concentration (Figure 1(a), Supplemental Tables 2 and 3). From regression, the increase in potassium in pooled serum exceeded RCV of 9.8% at 0.17 mmol/L K3EDTA. Serum potassium increased by 3.2 mmol/L per 1.0 mmol/L K3EDTA (Figure 1(b)). (a) Serum potassium in EDTA spiked pooled serum (o), level 1 (●) and level 3 (□) IQC samples. (b) Increase in serum potassium with EDTA spike (all samples combined).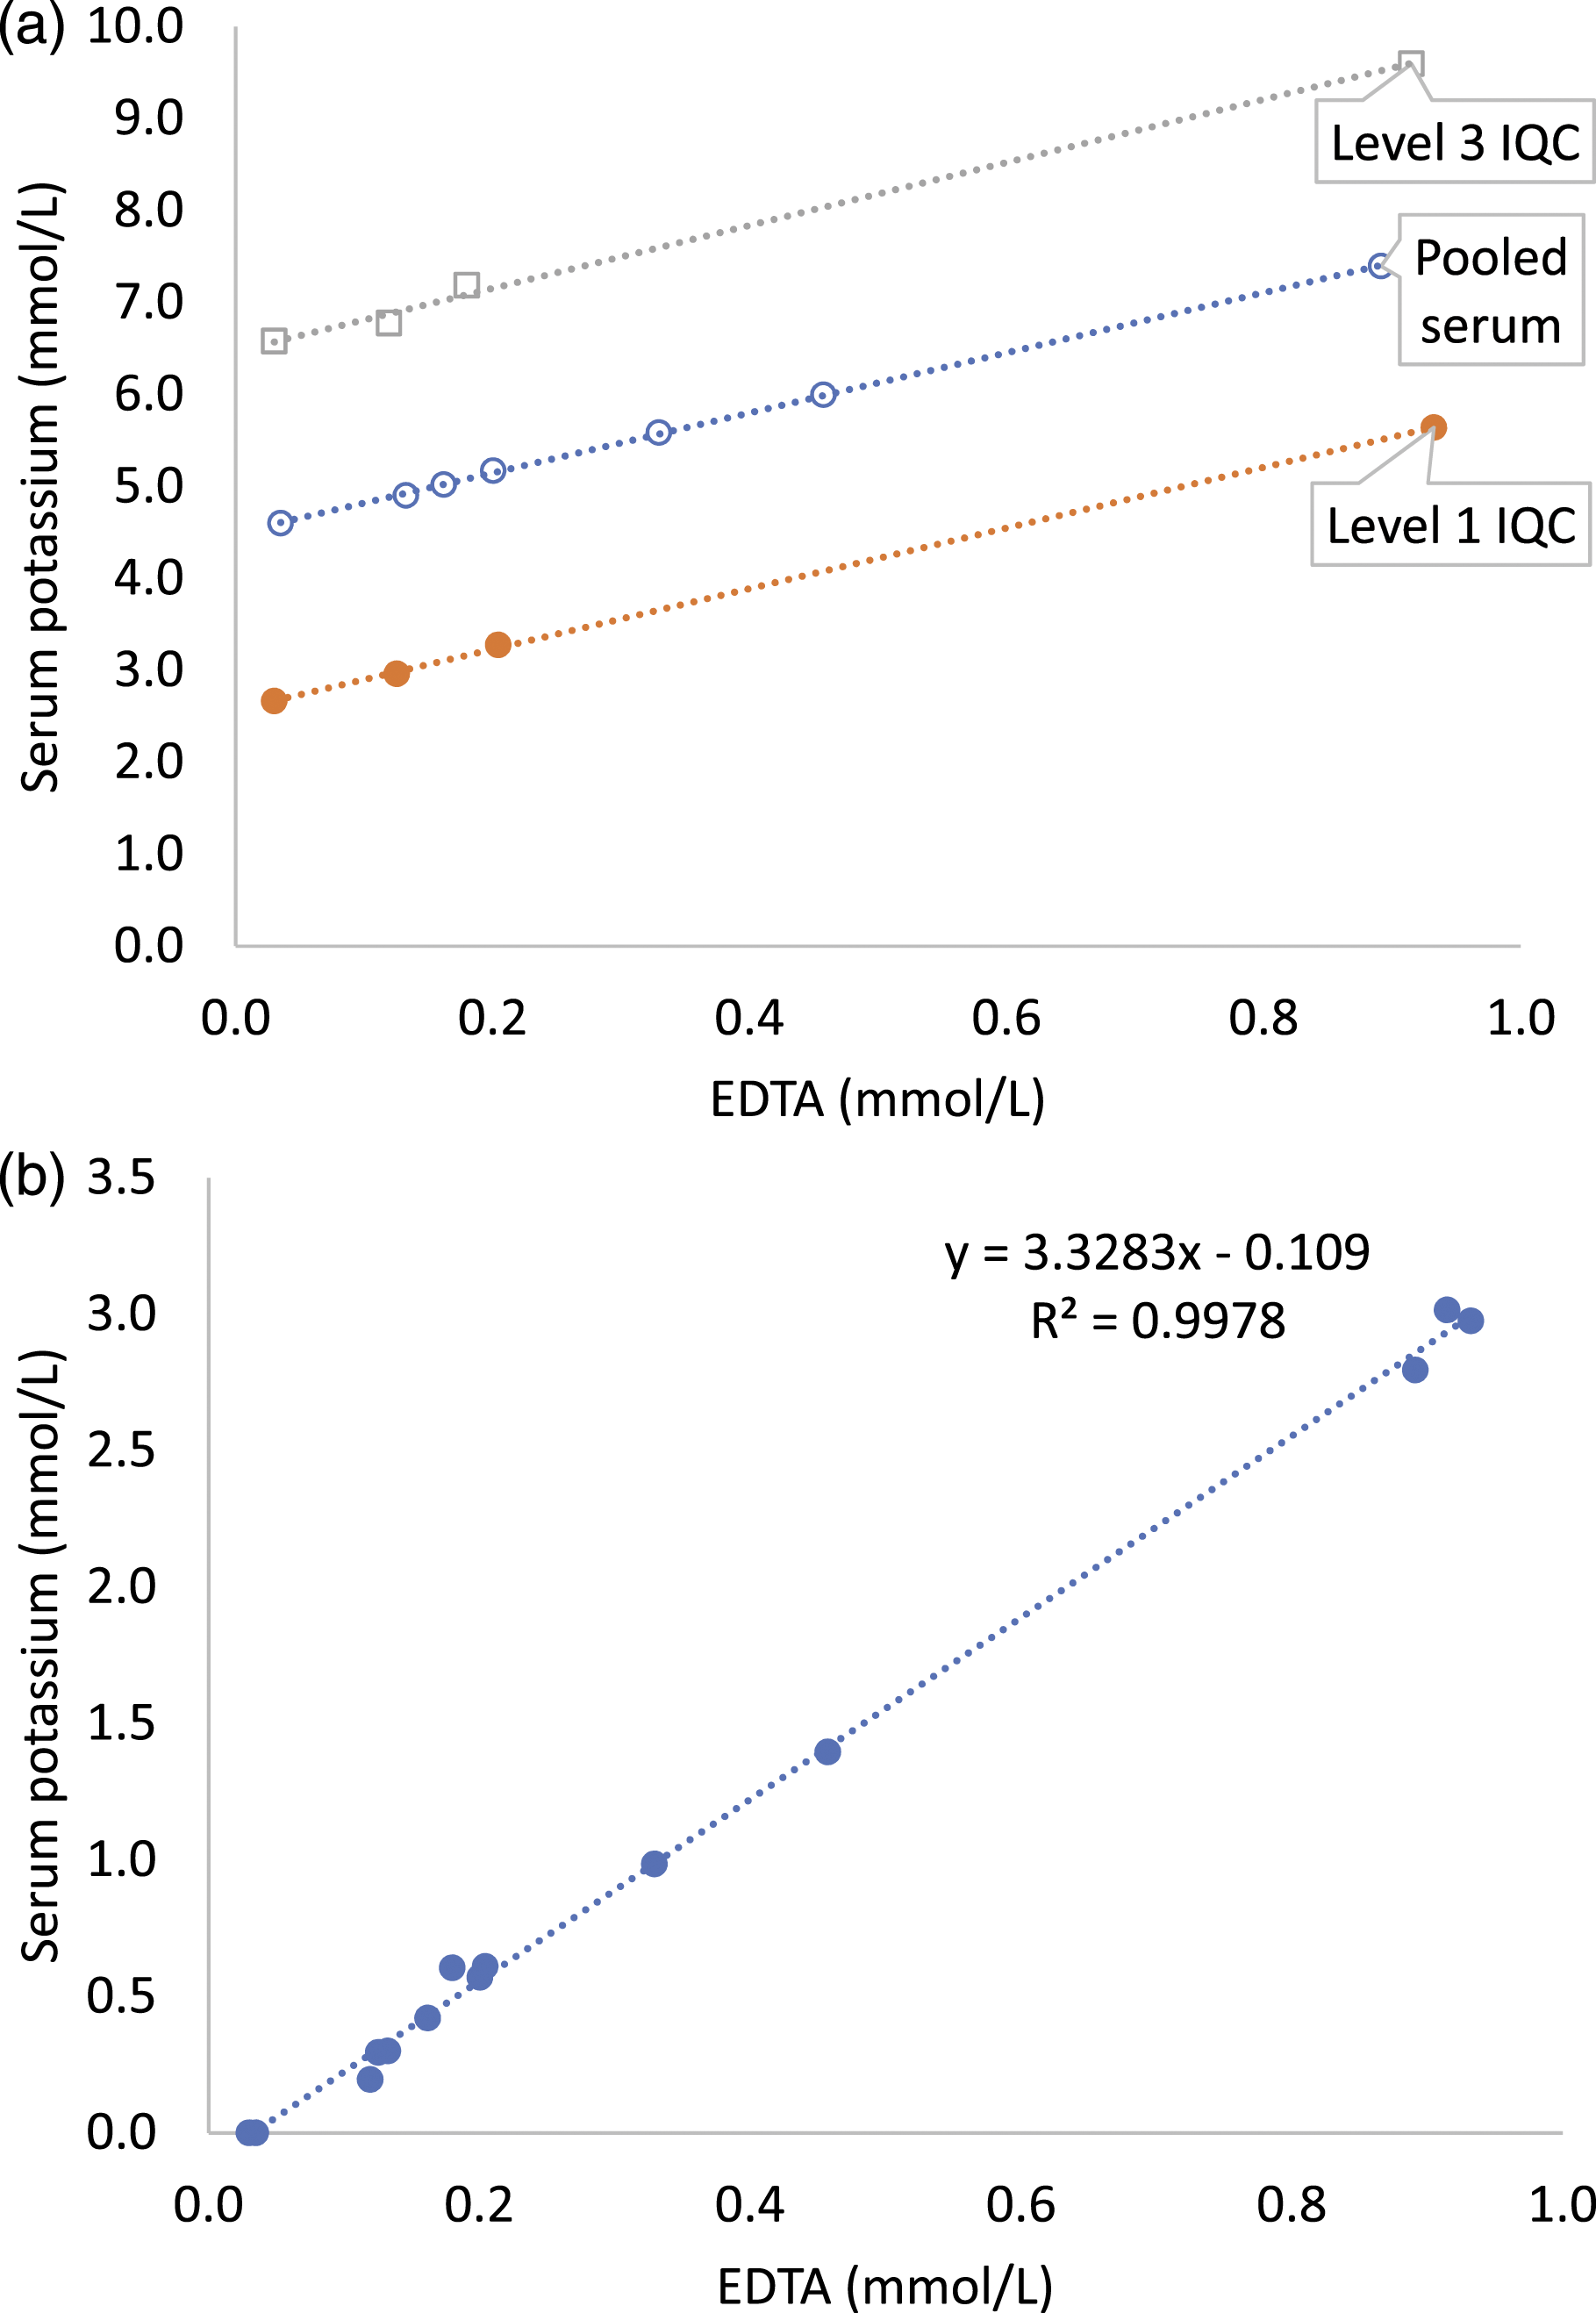
Serum calcium in pooled serum decreased by 4.21%, 5.06% and 7.17% at EDTA concentrations of 0.13 mmol/L, 0.16 mmol/L and 0.20 mmol/L, respectively, (Figure 2(a), Supplemental Table 2). From regression, the decrease in serum calcium exceeded RCV of 5.2% at 0.17 mmol/L EDTA and the decrease in serum total calcium was 0.78 mmol/L per 1.0 mmol/L EDTA in EDTA spiked pooled serum, level 1 IQC and level 3 IQC (Figure 2(b)). (a) Serum total calcium in EDTA spiked pooled serum (o), level 1 (●) and level 3 (□) IQC samples. (b) Decrease in serum calcium with EDTA spike (all samples combined).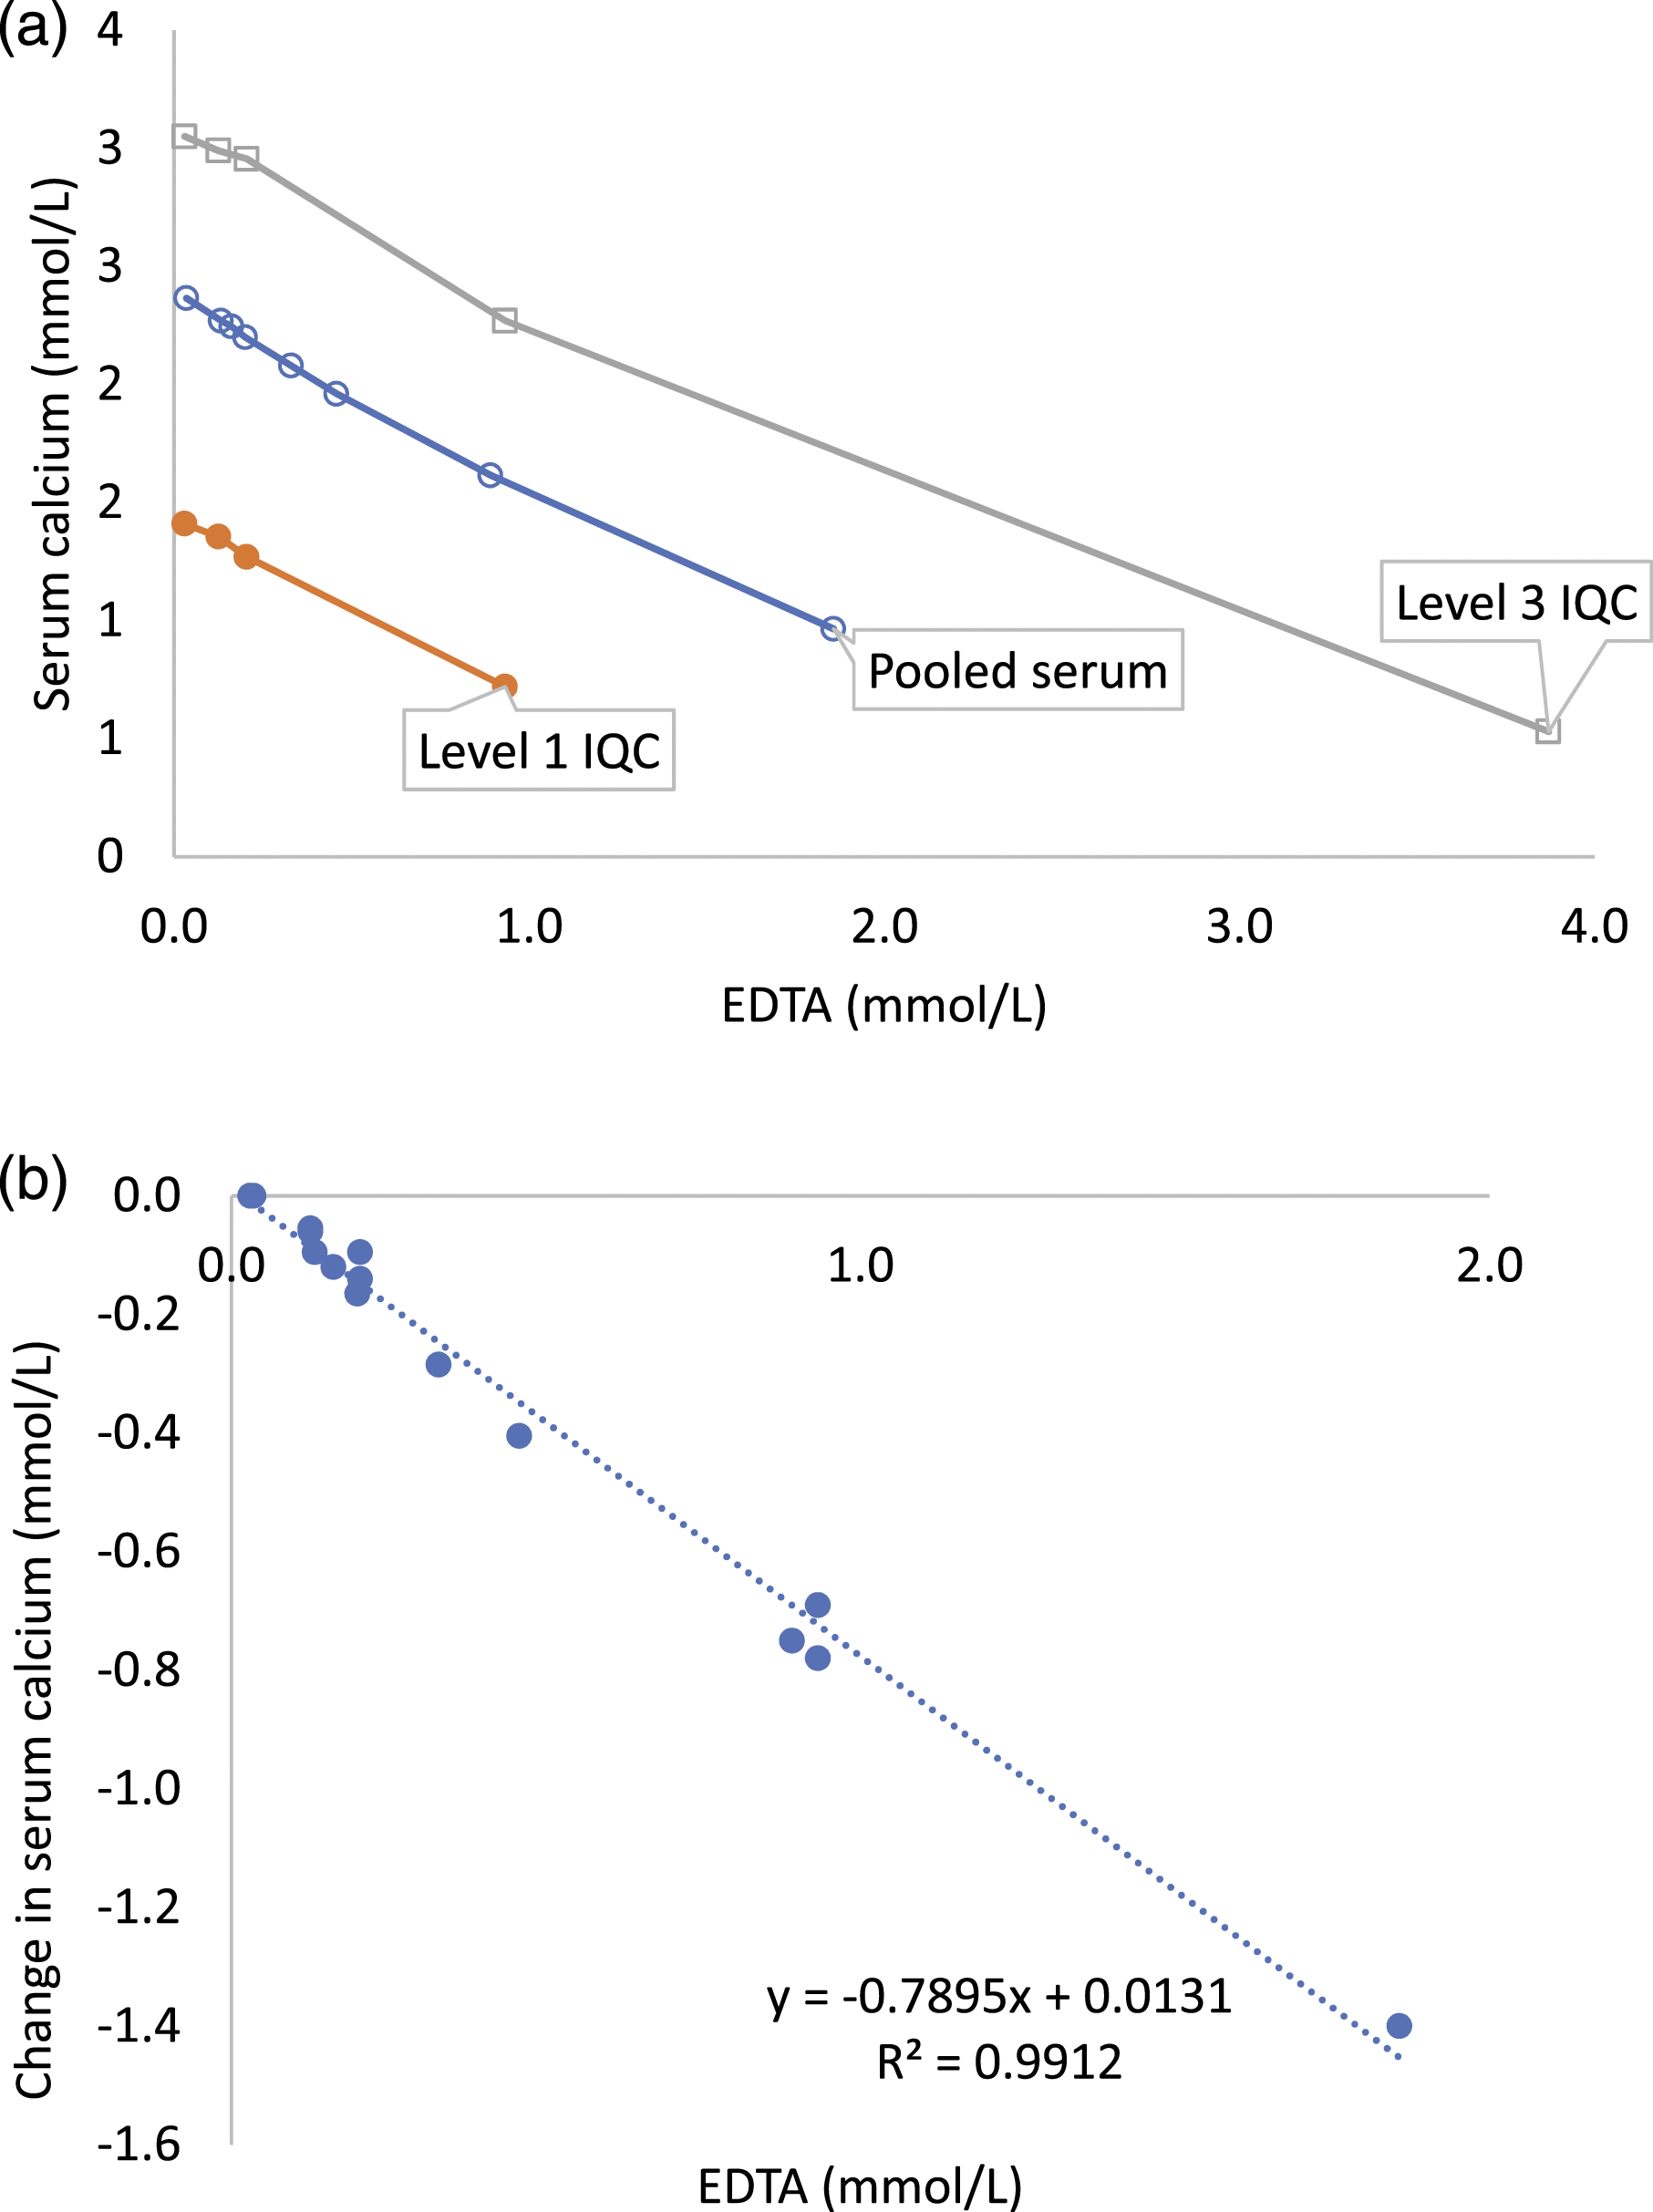
Serum iron decreased by 14.6%, 33.5% and 50.6% in pooled serum at EDTA concentration 1.86 mmol/L, 3.66 mmol/L and 5.60 mmol/L, respectively. The change in serum iron did not exceed RCV of 61.9% until the maximum tested EDTA concentration of 5.60 mmol/L (Figure 3, Supplemental Table 2). Absolute change in serum iron was highest in the sample with maximum serum iron (level 3 IQC). Proportionate change in serum iron was similar in all three samples (Supplemental Tables 2 and 3). Serum iron in EDTA spiked pooled serum (o), level 1 (●) and level 3 (□) IQC samples.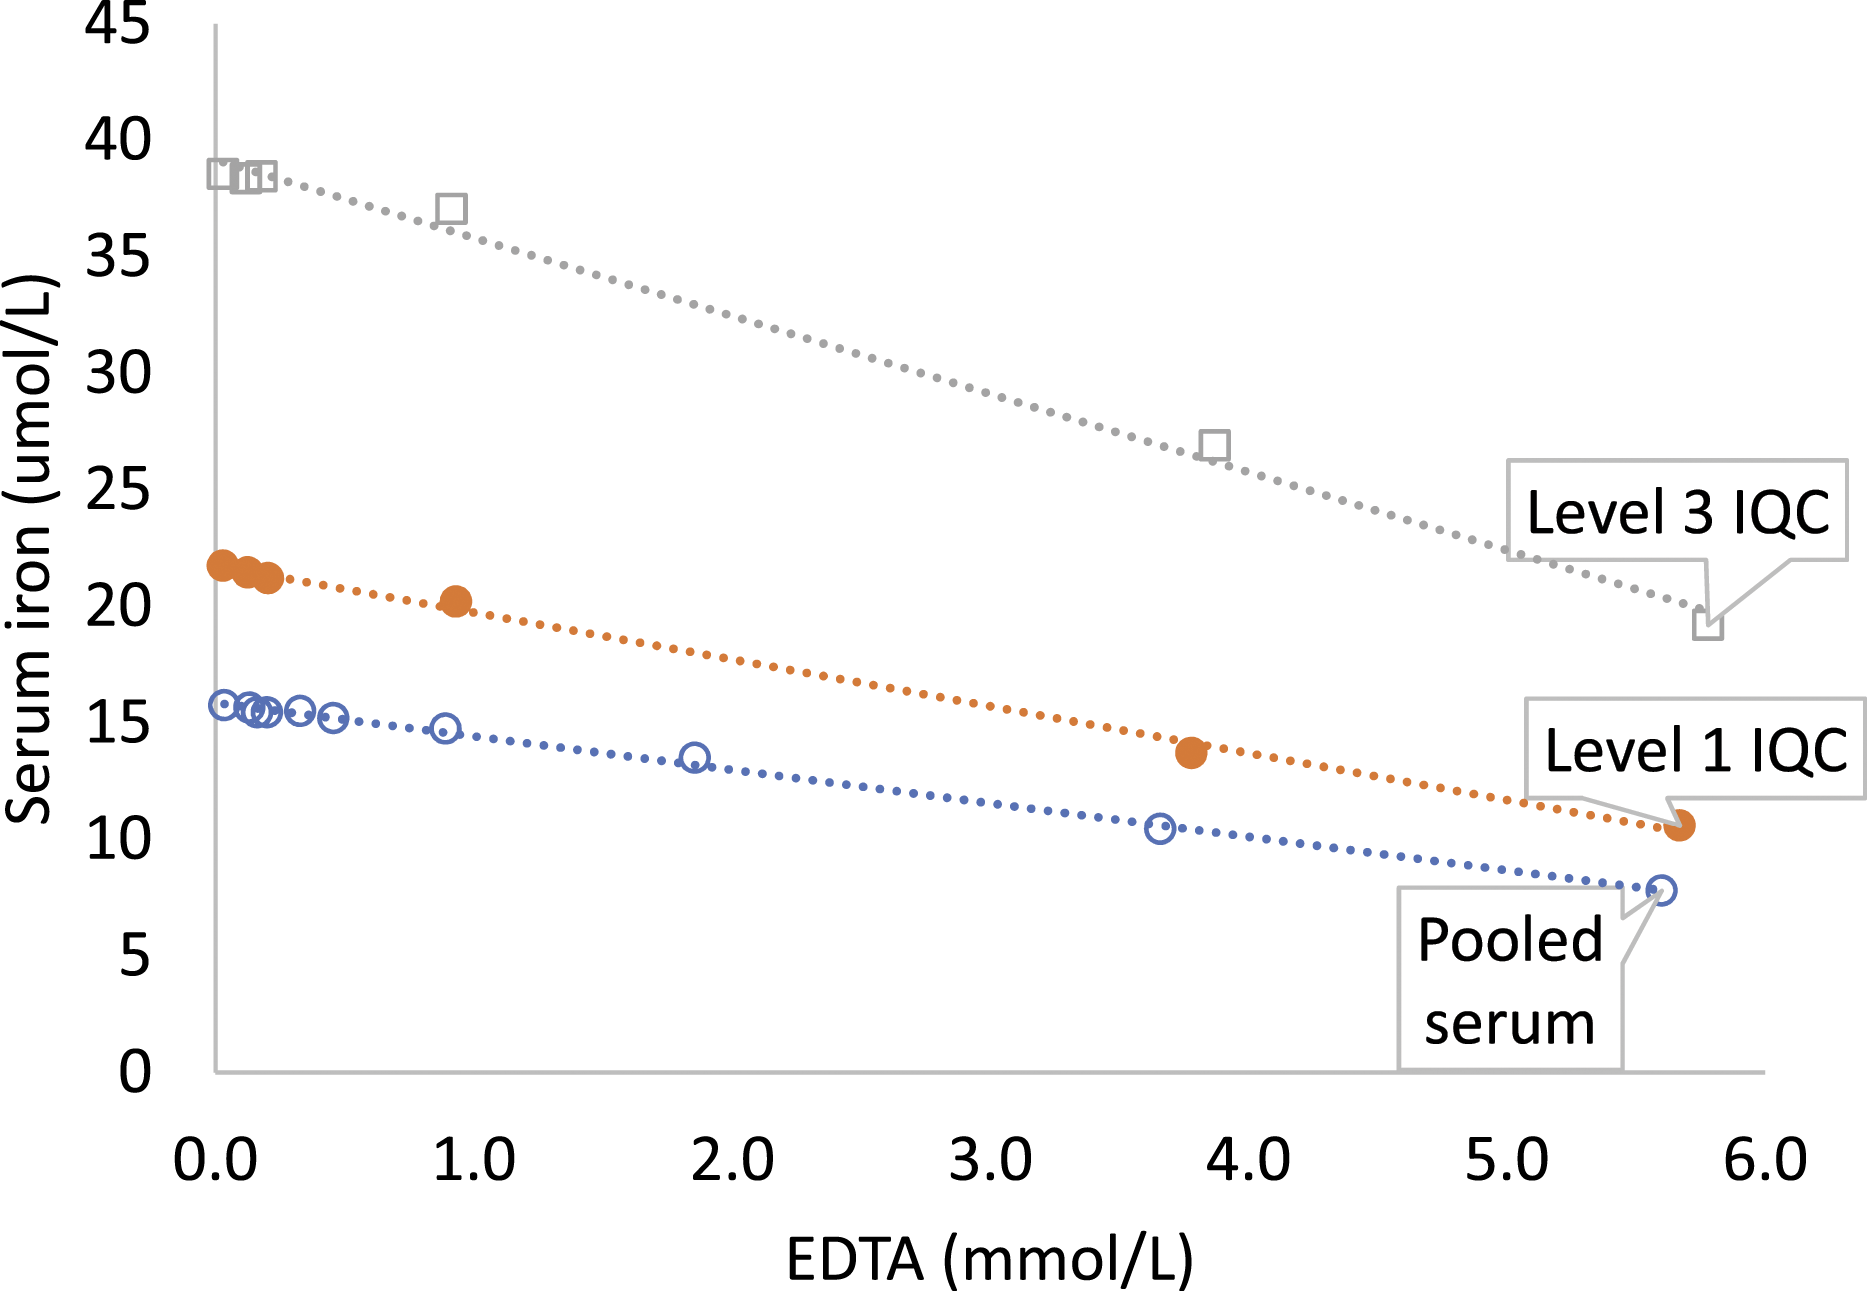
Serum magnesium decreased by 4.8% and 7.2% in pooled serum at EDTA concentrations of 3.66 mmol/L and 5.60 mmol/L, respectively. The change in serum magnesium did not exceed RCV of 8.4% (Supplemental Table 2).
Serum ALP did not change until 0.89 mmol/L EDTA (Supplemental Table 2). Serum ALP decreased by 7.1% and 54.1% in pooled serum at EDTA concentrations of 1.86 mmol/L and 3.66 mmol/L, respectively. Change in ALP was less in EDTA spiked level 3 IQC compared to pooled serum and level 1 IQC (Figure 4, Supplemental Tables 2 and 3). Serum alkaline phosphatase (ALP) in EDTA spiked pooled serum (o), level 1 (●) and level 3 (□) IQC samples.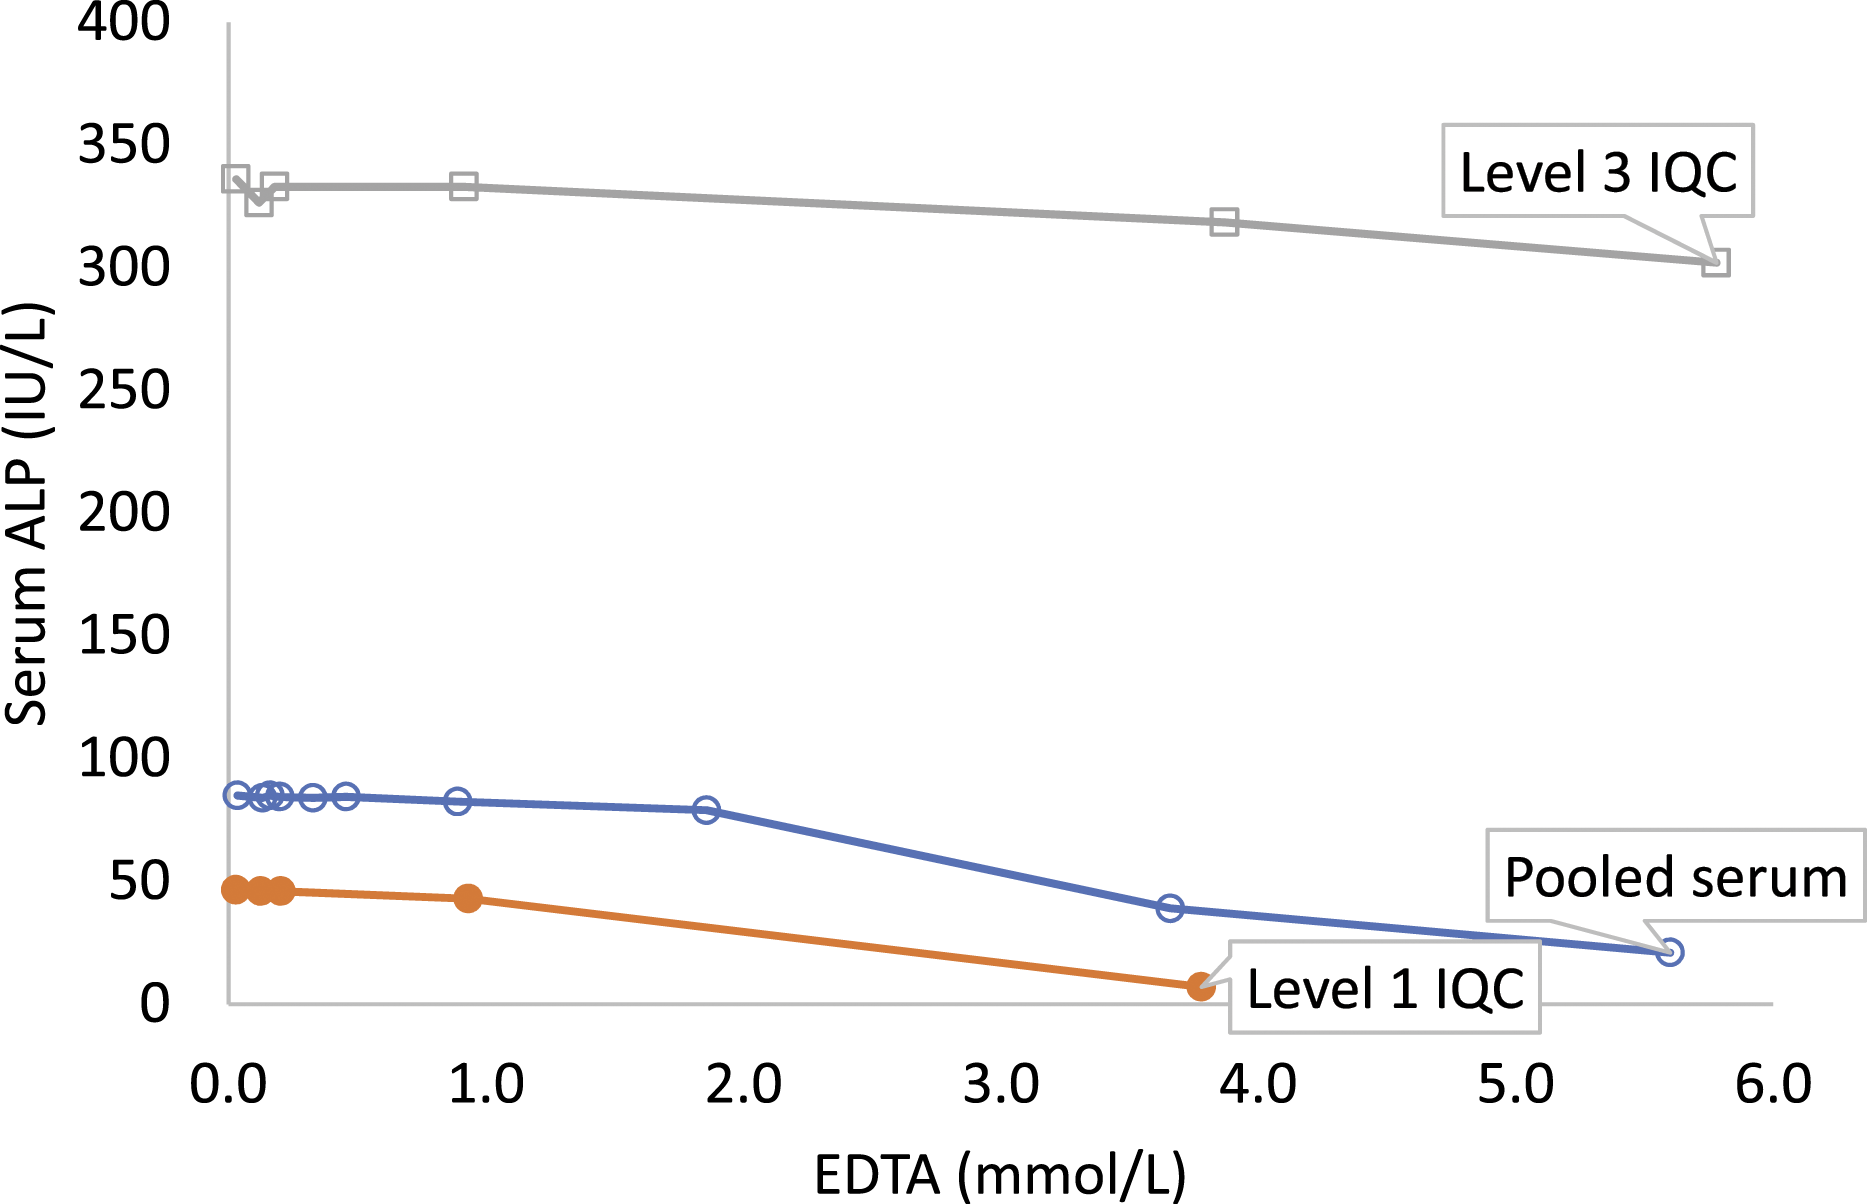
Serum albumin, ALT, amylase, AST, vitamin B12, CA 125, CA 15-3, CA 19-9, CEA, chloride, cholesterol, CK, cortisol, creatinine, CRP, direct bilirubin, ferritin, folate, fructosamine, FSH, FT3, FT4, GGT, HDLc, hs-cTnI, LDH, LH, oestradiol, phosphate, progesterone, prolactin, sodium, total bilirubin, total protein, total PSA, transferrin, triglycerides, TSH, urea, and uric acid did not change in EDTA spiked pooled serum, level 1 IQC and level 3 IQC samples until EDTA concentration >5.6 mmol/L (Supplemental Tables 2 and 3).
Discussion
Of the 45 commonly requested analytes studied using the Abbott Architect platform, only four were significantly affected by K-EDTA contamination up to the concentration of EDTA in blood collection tubes. These were potassium, total calcium, alkaline phosphatase and iron. At modest EDTA concentrations (0.17 mmol/L), serum potassium increased and total calcium decreased exceeding their respective RCV. At higher EDTA concentrations (>1.86 mmol/L), serum alkaline phosphatase decreased exceeding its RCV. Serum iron decreased but the change did not exceed the large RCV of iron. Although magnesium decreased, the change did not exceed its RCV at the concentrations studied.
The increase in serum potassium occurred at the lowest spiked EDTA concentration (0.13 mmol/L) and exceeded RCV of 9.8% in pooled serum at 0.17 mmol/L K3EDTA. Serum potassium increased by 3.2 mmol/L per 1.0 mmol/L K3EDTA in spiked pooled serum and both IQC samples and was consistent with the expected and previously reported increase. 9 Each K3EDTA molecule has three dissociable potassium ions and therefore each 1.0 mmol/L increase in EDTA would be expected to increase serum potassium by 3.0 mmol/L. Since inter-laboratory comparison or EQA are not available for the EDTA assay, this relationship of change in serum potassium per mmol/L EDTA may be used to verify measured EDTA results. The relationship, however, would depend on the EDTA salt (K2 or K3) and may not apply to EDTA contamination from fluoride-EDTA tubes. 9
Unlike colourimetry, calcium measured by atomic absorption spectrophotometry is not affected by EDTA contamination and the difference between calcium measured by colourimetry and atomic absorption spectrophotometry has been used to assess the accuracy of the EDTA assay. 15 In this study, change in serum total calcium measured colourimetrically using Arsenazo III dye method occurred at the lowest spiked EDTA concentration of 0.13 mmol/L. The decrease in serum calcium was similar in EDTA spiked pooled serum, level 1 and level 3 IQC samples and exceeded the RCV of 5.2% in pooled serum at 0.17 mmol/L EDTA. Serum calcium decreased by 0.78 mmol/L per 1.0 mmol/L EDTA increase and this is similar to that reported in previous studies on roche analysers using o-cresolphthalein complexone (OCPC) colourimetric method.9,15 The authors are not aware of any study assessing the magnitude of change with EDTA contamination in colourimetrically measured calcium using 5-nitro-5'-methyl-(1,2-bis(o-aminophenoxy)ethan-N,N,N',N'-tetraacetic acid (NM-BAPTA) as chromophore.
The concentration of EDTA (0.17 mmol/L) producing a change in potassium and calcium results that exceed the RCV is 1/20th to 1/36th of the EDTA concentration found in different manufacturers’ K3EDTA tubes. 16 These results emphasise that contamination of serum with a small quantity of EDTA or EDTA contaminated blood, as may happen with syringe or needle tip contamination while filling blood tubes in open phlebotomy, would significantly affect potassium and calcium results. Previous studies indicate syringe or needle tip contamination to be a more plausible mechanism of EDTA contamination than incorrect order of draw with closed phlebotomy.17–21
Serum ALP activity decreased significantly at EDTA concentrations >1.86 mmol/L. Marked hyperkalaemia and hypocalcaemia, however, occurred at much lower EDTA concentrations. ALP, therefore, only identifies gross EDTA contamination and may not identify less severe EDTA contamination causing clinically significant changes in potassium and calcium. ALP is, therefore, of limited value as a surrogate marker for EDTA contamination. 5 EDTA-mediated ALP inhibition is competitive in the presence of excess substrate at lower EDTA concentrations and becomes irreversible when EDTA concentrations are greater than 1.0 mmol/L and with time.22,23 EDTA susceptibility also depends on the tissue origin of ALP. 24 The effect of EDTA on ALP may also depend on the length of time taken for analysis after sample collection, in effect time of sample contamination. ALP has been reported to decrease by 14.8% and 70.5% at 20 min and 72 h, respectively, in the presence of 5.0 mmol/L EDTA. 9 In this study, samples were analysed within 8 h of preparation and the effect of time on EDTA-mediated ALP inhibition was not considered.
Magnesium and zinc are co-factors of ALP. Immediate ALP inhibition by EDTA is due to divalent metal, especially zinc, chelation.4,5,25 The International Federation of Clinical Chemistry and Laboratory Medicine (IFCC) method reagent for ALP contains magnesium and zinc. The reagent concentrations of magnesium, zinc and N-(2-hydroxyethyl)-ethylenediamine triacetic acid (HEDTA), however, vary in different manufacturer IFCC method ALP kits.26–28 Therefore, the decrease in ALP with EDTA contamination may differ between kits and our results may not be universally applicable. Notably, with increasing EDTA, the greatest change in serum ALP was seen in level 1 IQC, followed by pooled serum followed by level 3 IQC. This may be due to differences in magnesium and zinc concentrations in samples since magnesium and zinc concentrations (IQC package insert) in level 1 IQC and level 3 IQC were, respectively, low and high.
A decrease in serum magnesium with changes in potassium, calcium and ALP is often used as a surrogate marker of EDTA contamination. Serum magnesium, however, only decreased by 7.2% at 5.60 mmol/L EDTA and did not exceed RCV of 8.4%. Such small change may not be noticed when validating results. In a previous study on Abbott Architect (Arsenazo dye method), magnesium did not change until the EDTA concentration was 0.84 mmol/L. 4 Magnesium, however, decreased significantly with similar EDTA concentrations in other studies using the xylidyle blue method on Roche and Beckman platforms.5,7,9,20 Therefore, change in magnesium with EDTA contamination may be method dependent.
Even though serum iron decreased by 33.5% and 50.6% in the pooled serum at 3.66 mmol/L and 5.60 mmol/L EDTA, respectively, the change in serum iron did not exceed the RCV of 61.9% until the maximum tested EDTA concentration (5.60 mmol/L). This is due to a large intra-individual variability (CVi of 26.5%) of serum iron.13,29,30 CVi for serum iron was obtained from the Ricos et al. database 13 since it is not available yet in EFLM biological variation database. 12 Meta-analysis–based CVi estimates in the newer EFLM biological variation database are generally lower than respective estimates in the Ricos database. 31 This may be due to stringent study exclusion and weighting based on the Biological Variation Data Critical Appraisal Checklist (BIVAC) in the EFLM biological variation database. 31 Non-availability of meta-analysis–based CVi for serum iron may be due to the lack of BIVAC compliant biological variation studies using contemporary assays, and strict experimental and statistical protocols. The higher CVi leading to a higher RCV contributed to the decrease in serum iron not exceeding the RCV. Although not directly analysed in our laboratory, serum unsaturated iron-binding capacity (UIBC) is known to increase with EDTA contamination. 9
In this study, hypomagnesaemia or hypophosphatasia occurred at very high EDTA concentrations limiting their usefulness as surrogate markers of modest EDTA contamination. Of the commonly measured cations, EDTA has the highest metal-EDTA complex formation constant and therefore has the highest affinity for Cu2+, followed by Zn2+, followed by Ca2+ and finally Mg2+.32,33 Hypozincaemia on colourimetric assay has been reported as the most sensitive surrogate marker of EDTA contamination,4,5 however, not many laboratories measure zinc by colourimetric method on automated analysers and therefore serum zinc result is generally not available in real-time to be used as a surrogate marker. Copper and zinc are now commonly measured by inductively coupled plasma mass spectrometry (ICP-MS). Due to the destructive nature of the ICP ionization source, EDTA is unlikely to affect metal iron results by ICP-MS. 34 EDTA may, however, depending on the protocol used affect metal ion results by upcoming ion-exchange chromatography with inductively coupled plasma mass spectrometry (IC-ICP-MS) method since free metal and its complex may elute separately using this methodology. 34
Serum amylase did not change until the maximum spiked EDTA concentration of 5.78 mmol/L in this study where samples were analysed within 8 hours of spiking. Serum amylase did not change in the presence of 5.0 mmol/L EDTA at 20 min in a previous study but, like ALP, decreased by 34.3% after incubating for 72 h. 9
Serum copper (by colourimetry), angiotensin-converting enzyme (ACE) and ammonia are affected by EDTA contamination. 35 These were not included in the current study, since ACE is not routinely available, serum copper and zinc are analysed by ICP-MS and the study design was not suitable for ammonia.
In this study, samples were spiked with K-EDTA up to the EDTA concentration in K2- and K3EDTA blood collection tubes. 16 Serum albumin, ALT, amylase, AST, vitamin B12, CA 125, CA 15-3, CA 19-9, CEA, chloride, cholesterol, CK, cortisol, creatinine, CRP, direct bilirubin, ferritin, folate, fructosamine, FSH, FT3, FT4, GGT, HDLc, hs-cTnI, LDH, LH, oestradiol, phosphate, progesterone, prolactin, sodium, total bilirubin, total protein, total PSA, transferrin, triglycerides, TSH, urea, and uric acid were unaffected by EDTA in the concentrations studied. Results of these analytes, therefore, may be reported from EDTA contaminated samples.
Proposed EDTA concentration cut-offs for selective reporting of analytes in EDTA contaminated samples using Abbott Architect methodology. Test method used for individual analyte is listed in Supplemental Table 1.
Supplemental Material
Supplemental Material - Managing EDTA interference in EDTA contaminated samples – selectivity in reporting analytes
Supplemental Material for Managing EDTA interference in EDTA contaminated samples – selectivity in reporting analytes by Tejas Kalaria, Clare Ford and Rousseau Gama in Annals of Clinical Biochemistry
Footnotes
Acknowledgements
The authors thank biomedical scientists at New Cross Hospital, Mr Sunil Julka in particular, for their help with laboratory experiments.
Declaration of conflicting interests
The author(s) declared no potential conflicts of interest with respect to the research, authorship, and/or publication of this article.
Funding
The author(s) received no financial support for the research, authorship, and/or publication of this article.
Ethical approval
Not applicable.
Guarantor
TK.
Contributorship
TK and RG conceived the study. TK performed laboratory experiments, compiled and analysed the data, and wrote the first draft of the manuscript. All the authors contributed to data interpretation, critically reviewed and edited the manuscript and approved the final version.
Data availability
All data included in the manuscript and supplementary material.
Supplemental material
Supplemental material for this article is available online.
References
Supplementary Material
Please find the following supplemental material available below.
For Open Access articles published under a Creative Commons License, all supplemental material carries the same license as the article it is associated with.
For non-Open Access articles published, all supplemental material carries a non-exclusive license, and permission requests for re-use of supplemental material or any part of supplemental material shall be sent directly to the copyright owner as specified in the copyright notice associated with the article.