
Abstract
Background
The peptide hormone hepcidin-25 plays an important role in iron metabolism. Low or high levels of hepcidin-25 are associated with various iron disorders; therefore, hepcidin-25 is an important biomarker. This study describes an easy and fast analytical assay for the quantification of hepcidin-25 with liquid chromatography-tandem mass spectrometry (LC-MS/MS).
Methods
Sample preparation was performed by protein precipitation with trichloroacetic acid, and injection onto a LC-MS/MS was directly conducted from a LoBind 96-well plate.
Results
The concentration range covered by the quality control samples, ranged from 0.25 nmol/L (12.3% CV) to 11.9 nmol/L (CV < 9%). Matrix effect was limited (mean recovery of 99.9% with a CV of 6.4%). The assay was validated for serum, EDTA and heparin plasma. An international secondary reference material was used for calibration. The reference interval (90% CL) was estimated for hepcidin-25 by analysing serum and plasma samples from 156 healthy subjects with a lower limit: 0.12 (0.07–0.19) and upper limit: 11.2 nmol/L (9.5–13.0).
Conclusions
We present a fast and easy assay for the quantification of hepcidin-25 in serum and plasma samples. The assay was successfully used for the detection of various forms of hereditary haemolytic anaemias, to characterize the interplay between erythropoiesis and iron levels.
Highlights
Hepcidin-25 is an important biomarker for various iron disorders.
Sample preparation and injection was directly conducted from a 96-well plate.
Hepcidin-25 was analysed with LC-MS/MS with a Lower limit of quantification of 0.25 nmol/L.
The assay is suitable for serum, EDTA plasma and heparin plasma.
Introduction
The biological active peptide hormone hepcidin-25 is a C-terminal peptide originating from a 84 amino acid pre-propeptide and is synthesized in the liver. 1 Hepcidin-25 plays a major role in iron metabolism. The synthesis of hepcidin is increased when iron stores are full and the increased levels of hepcidin induces ferroportin degradation, which blocks iron absorption from the gut, iron excretion from macrophages and hepatocytes. 2 Increased levels of hepcidin-25 are found in patients with anaemia of chronic disease (ACD), 3 hereditary iron-refractory iron deficiency anaemia (IRIDA), 4 and hepcidin-producing hepatic adenomas. 5 Low levels of hepcidin-25 can be found in patients with hereditary haemochromatosis 6 and iron loading anaemias. 7 Recently it was shown in a large prospective observational cohort of patients on maintenance haemodialysis that low levels of hepcidin-25 (<31 ng/mL, or 11 nmol/L) had better survival outcomes than those with higher hepcidin-25 levels. 8 Multiple isoforms like hepcidin-20 and -22 are also present in serum and the ratio hepcidin-25/20 correlates by the ferritin levels in serum. 9 However, these isoforms have little or no biological activity. 10
The quantification of hepcidin-25 can be considered as an analytical challenge. Hepcidin-25 can be analysed with an ELISA assay, 11 but this analytical method shows an overestimation of the hepcidin-25 concentration in serum, due to cross-reactivity with other hepcidin-20 and hepcidin-22 isoforms. Recently, more selective mass spectrometric methods have been published, which selectively measure hepcidin-25 and show no cross-reactivity with the isoforms. However, previously published chromatographic assays pointed to the existence of some pitfalls in setting up a robust analytical method for the quantification of hepcidin-25.12,13 Hepcidin-25 has a strong tendency to adsorb to glass surfaces, resulting in a poor repeatability of the method. Therefore, it is important to avoid glassware during sample preparation and the use of silanized glassware has been suggested. 12 Not only sample clean-up is important for the stability of hepcidine-25, liquid chromatography conditions are also critical. The use of an appropriate buffer pH is essential for a stable charge state of hepcidin-25, either hepcidin-253+ or hepcidin-254+. 13
Previously described methods used laborious and extensive sample clean-up, such as solid phase extraction (SPE).14–18 A method published by Delaby et al., 19 used protein precipitation, with an additional pre-concentration step in combination with an online trapping column before injecting onto a nano-liquid chromatography-tandem mass spectrometry (LC-MS/MS) system. Two other methods based on protein precipitation have been published; one validated the assay with laborious self-made silanized vials, 12 whilst the other did not investigate the stability of the samples stored in the autosampler. 20
The purpose of this study was to develop and validate a straightforward, quick and easy protein precipitation procedure for serum and plasma samples. In addition, 156 serum samples from healthy subjects without iron disorders were analysed, to define the reference interval.
Materials and method
Chemicals reagents and materials
All reagents were purchased from Sigma-Aldrich (St Louis, MO, USA). Hepcidin-25, the internal standard (IS) 15N and 13C isotope labelled human hepcidin-25 were purchased from Peptide Institute (Osaka, Japan). Hepcidin calibrator set in serum was purchased from MCA laboratory/hepcidinanalysis.com (Nijmegen, the Netherlands). Serum and EDTA or heparin plasma from patients with no known iron deficiency or overload were randomly selected from residual material obtained in routine clinical analysis. Patients gave their informed consent for the use of remnant material. Samples from healthy subjects were obtained from volunteers by the MINI donor service at University Medical Center (UMC) Utrecht. After collection, serum and EDTA or heparin plasma samples were stored at minus 20°C before sample preparation. Polypropylene 96-well plate, LoBind 96-Deepwell plates (1 mL), 1.5 mL polypropylene tubes and protein LoBind tubes 1.5 mL were from Eppendorf (Merck, the Netherlands). Silanized 2 mL vials were from Supelco (Bellefonte, PO, USA), silanized 0.3 mL vials with insert were from Wheaton (Milville, NJ, USA), and a regular glass vial from Brown Chromatography Supplies (Wertheim, Germany).
Instrumentation
Samples were analysed with an Ultimate 3000 UHPLC Dionex (Sunnyvale, CA) coupled to a triple quadrupole TSQ Quantiva, Thermo Fisher Scientific (Waltman, MA, USA). The method was validated with the following settings: a 30 μL sample (autosampler temperature 15°C) was injected onto an Atlantis T3 (2.1 * 100 mm, 3 μm particle size) analytical column (column temperature 45°C), Waters (Milford, MA, USA).
Eluent A was 50 m
Hepcidin-25 was analysed by selected reaction monitoring with the following transitions: quantification mass 930.25 > 1145.1 m/z (31.4 collision energy (CE), 140 radio frequency (RF)), qualification mass 930.25 > 354.28 m/z (32.22 CE, 140 RF). Internal standard 937.25 > 1150.54 m/z (31.4 CE, 140 RF) and 937.25 > 354.27 m/z (37.52 CE, 140 RF). Hepcidin-25 was quantified with the following MS conditions: in positive mode (4500 V), ion transfer tube temperature at 200°C and vaporizer temperature at 400°C.
Sample preparation
Plasma samples (200 μL) were transferred into an Eppendorf LoBind 96-well plate, and 12.5 μL IS (dissolved in water 0.1% formic acid (FA):ACN 0.1% FA (70:30)) was added. The plate was vortexed for 60 s at 1600 rpm on a multivortex, followed by the addition of 200 μl 22% trichloroacetic acid (TCA):ACN (50:50) and vortexed for 120 s, and thereafter centrifuged for 5 min at 5929 g. After centrifugation, the supernatant was ready for injection directly from the 96-well plate onto the LC-MS/MS system.
Stability testing
The ability of hepcidin-25 to adsorb to surfaces was tested by adding 500 μL of a 19.8 nmol/L standard hepcidin-25 in 0.1% FA:ACN with 0.1% FA (70:30) to the following tubes: silanized vial with insert, silanized vial 2 mL, regular glass vial, polypropylene 96-well plate, Eppendorf Lowbind 96-well plate, Eppendorf 1.5 mL polypropylene tubes and Eppendorf protein LoBind tubes. The experiment was performed in duplicate and samples, stored at room temperature, were analysed at 2 h, 4 h, 6 h and 72 h. A standard directly prepared in a LoBind tube was used as reference t = 0.
Method validation
The calibration curve and samples were prepared in a LoBind 96-well plate. A 10 point calibration curve, was freshly prepared from a stock standard (stored at -20°C) before sample preparation in water with 0.1% FA and ACN with 0.1% FA (ratio 70:30) in a hepcidin-25 concentration range of 0.1–99 nmol/L.
For the estimation of precision and bias we used Clinical and Laboratory Standards Institute (CLSI) EP15 guidelines. 21 For the lower limit of quantitation (LLOQ), low, medium, and high quality control (QC) samples, pools were made from serum samples collected from residual material of routine patient samples. Average concentration for the LLOQ, low, median and high QC samples, analysed over 5 days and prepared in five replicates each day, were 0.25, 0.79, 3.3 and 11,9 nmol/L, respectively. The LLOQ criteria were Coefficient of variation or CV < 20%, and S/N ≥ 10. For the evaluation of linearity in serum, four samples having low concentrations were mixed with samples having high hepcidin-25 concentrations, in a ratio of 100:0, 75:25, 50:50, 25:75 and 0:100. The measurements were done in duplicate, respectively. Statistical analyses for within run coefficient of variation (CV), between run CV and overall CV were performed using one-way analysis of variance (ANOVA).
Matrix effects were investigated by determining the recovery of added hepcidin-25 as described by Hewavitharana. 22 Recovery was calculated as the spiked concentration of the analyte recovered ((sample + spike) – sample) divided by the analyte added known concentration * 100. In total, 10 different samples were spiked with 10 μL stock standard with a hepcidin-25 concentration of 198 nmol/L in 0.1% FA:ACN 0.1% FA (70:30). The final hepcidin-25 concentration in serum was 9.9 nmol/L.
Autosampler stability was tested by analysing in duplicate four pooled samples and a standard with a hepcidin-25 concentration of 19.8 nmol/L. Each sample was prepared in 14 aliquots and were repeatedly injected every 49 min over 24 h. Room temperature stability for hepcidin-25 in serum was tested by analysing 10 random selected samples in a concentration range from 0.97 nmol/L to 23 nmol/L, samples taken at 2 h, 4 h, 6 h and 26 h. Four freeze/thaw cycles were tested with four different serum samples with a hepcidin-25 concentration between 0.21 nmol/L and 13.1 nmol/L and with the standard sample of 19.8 nmol/L. Samples and standards were stored in an Eppendorf LoBind 1.5 mL tube. Long-term stability was tested with low, medium and high QC samples stored at -20°C, for 9 months (in duplicate).
Carry-over was tested by injecting multiple blank solvent samples and measured just after a high standard and/or high hepcidin-25 serum sample.
Clinical validation
To test the stability of hepcidin-25 in different matrices, serum samples were compared with EDTA plasma and heparin plasma. The international calibrator set (secondary reference material (sRM)), containing a low (0.95 ±0.11 nmol/L) medium (3.75 ±0.17 nmol/L) and high 9.07 ± 0.24 nmol/L) calibrator were prepared in single replicates and analysed in duplicates. The sRM set was the only commercially available calibrator set and results obtained by this study were not part of an international round robin test.
To define reference intervals for hepcidin-25, 57 serum samples from healthy subjects were obtained from healthy volunteers by the MINI donor service at UMC Utrecht (collected between April and May 2020), and 99 serum samples from residual material of patients without iron disorders obtained in routine clinical analysis (collected between July and September 2020 at UMC Utrecht, Central diagnostic laboratory). The reference interval has been calculated using the Reference Interval Estimation from EP Evaluator®. All 156 data were used and the central 95% interval was calculated using the Transformed Parametric method, which transformed the data into a Gaussian model.
Results
Method development
Recovery for hepcidin-25 stored in different (silanized) glass and (LoBind) polypropylene disposables at room temperature.
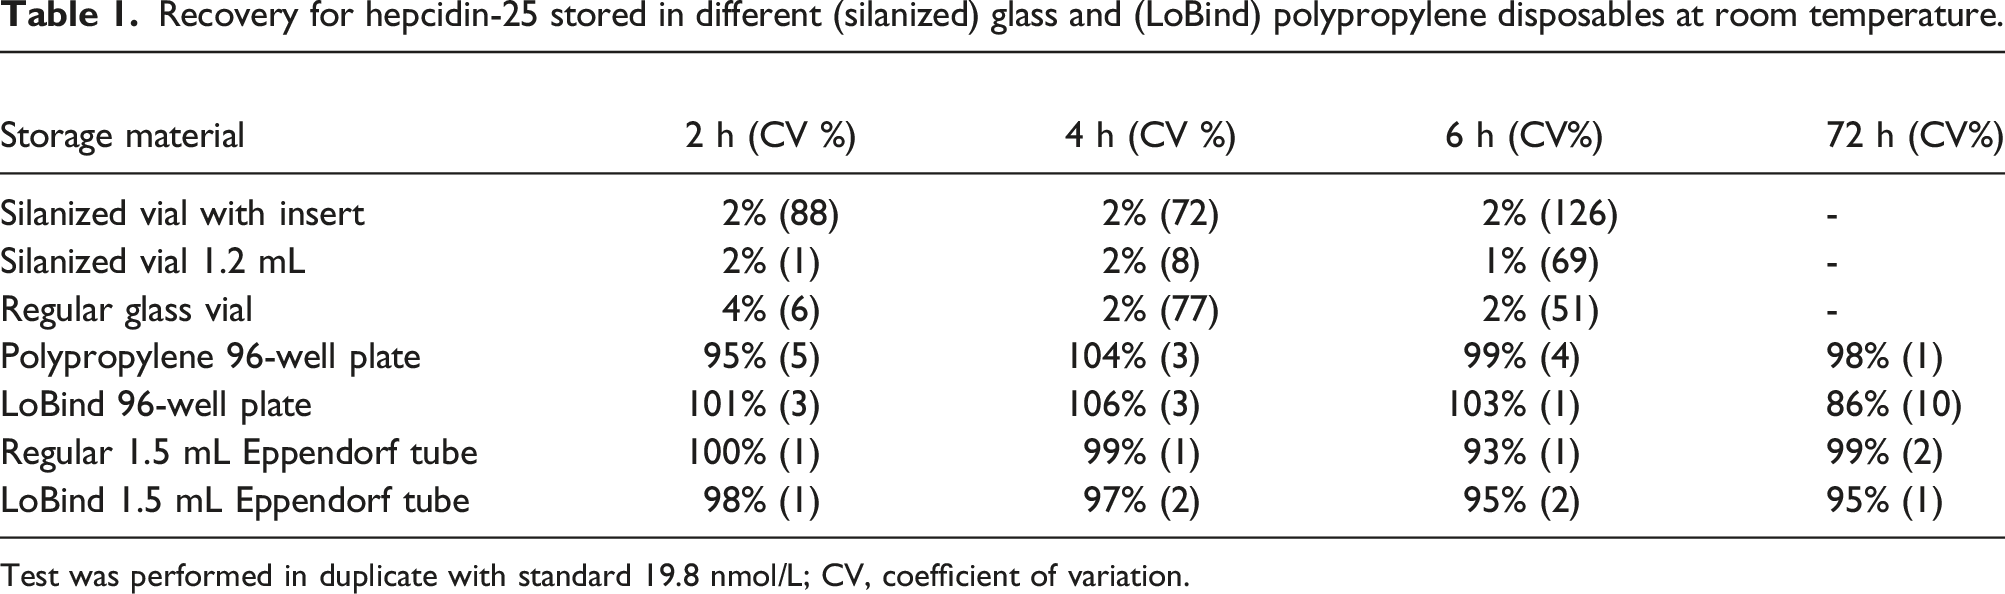
Test was performed in duplicate with standard 19.8 nmol/L; CV, coefficient of variation.
Method validation
Precision for pooled samples LLOQ, low, medium and high hepcidin-25 QC samples.
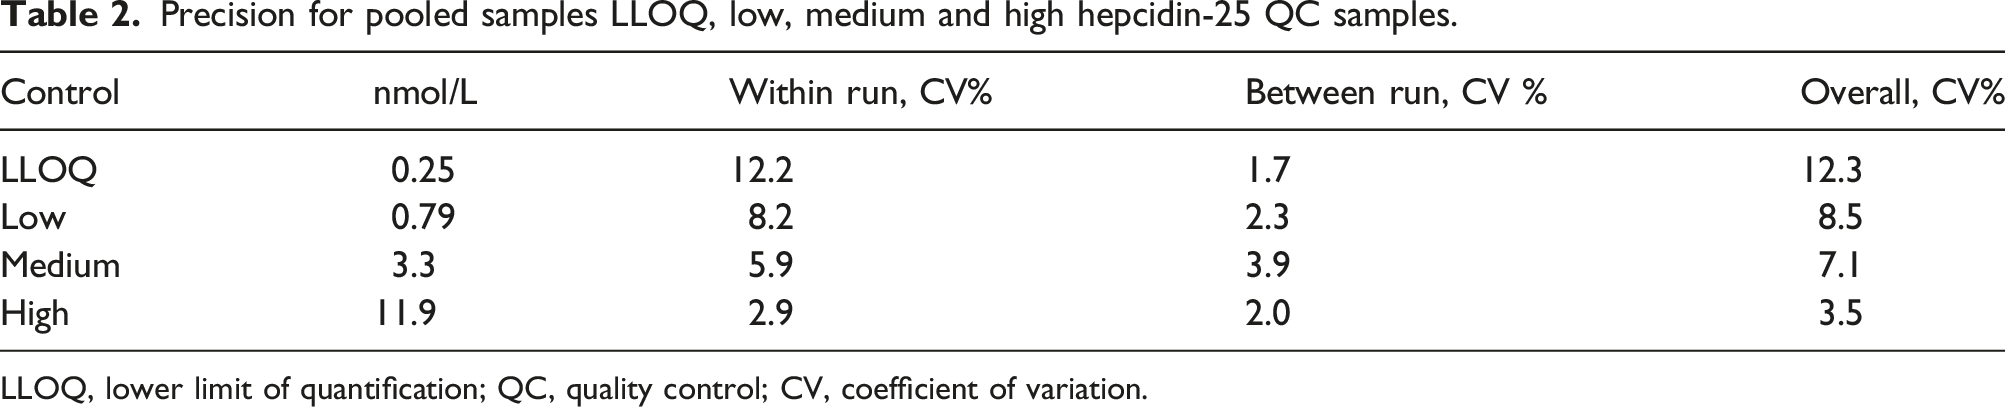
LLOQ, lower limit of quantification; QC, quality control; CV, coefficient of variation.
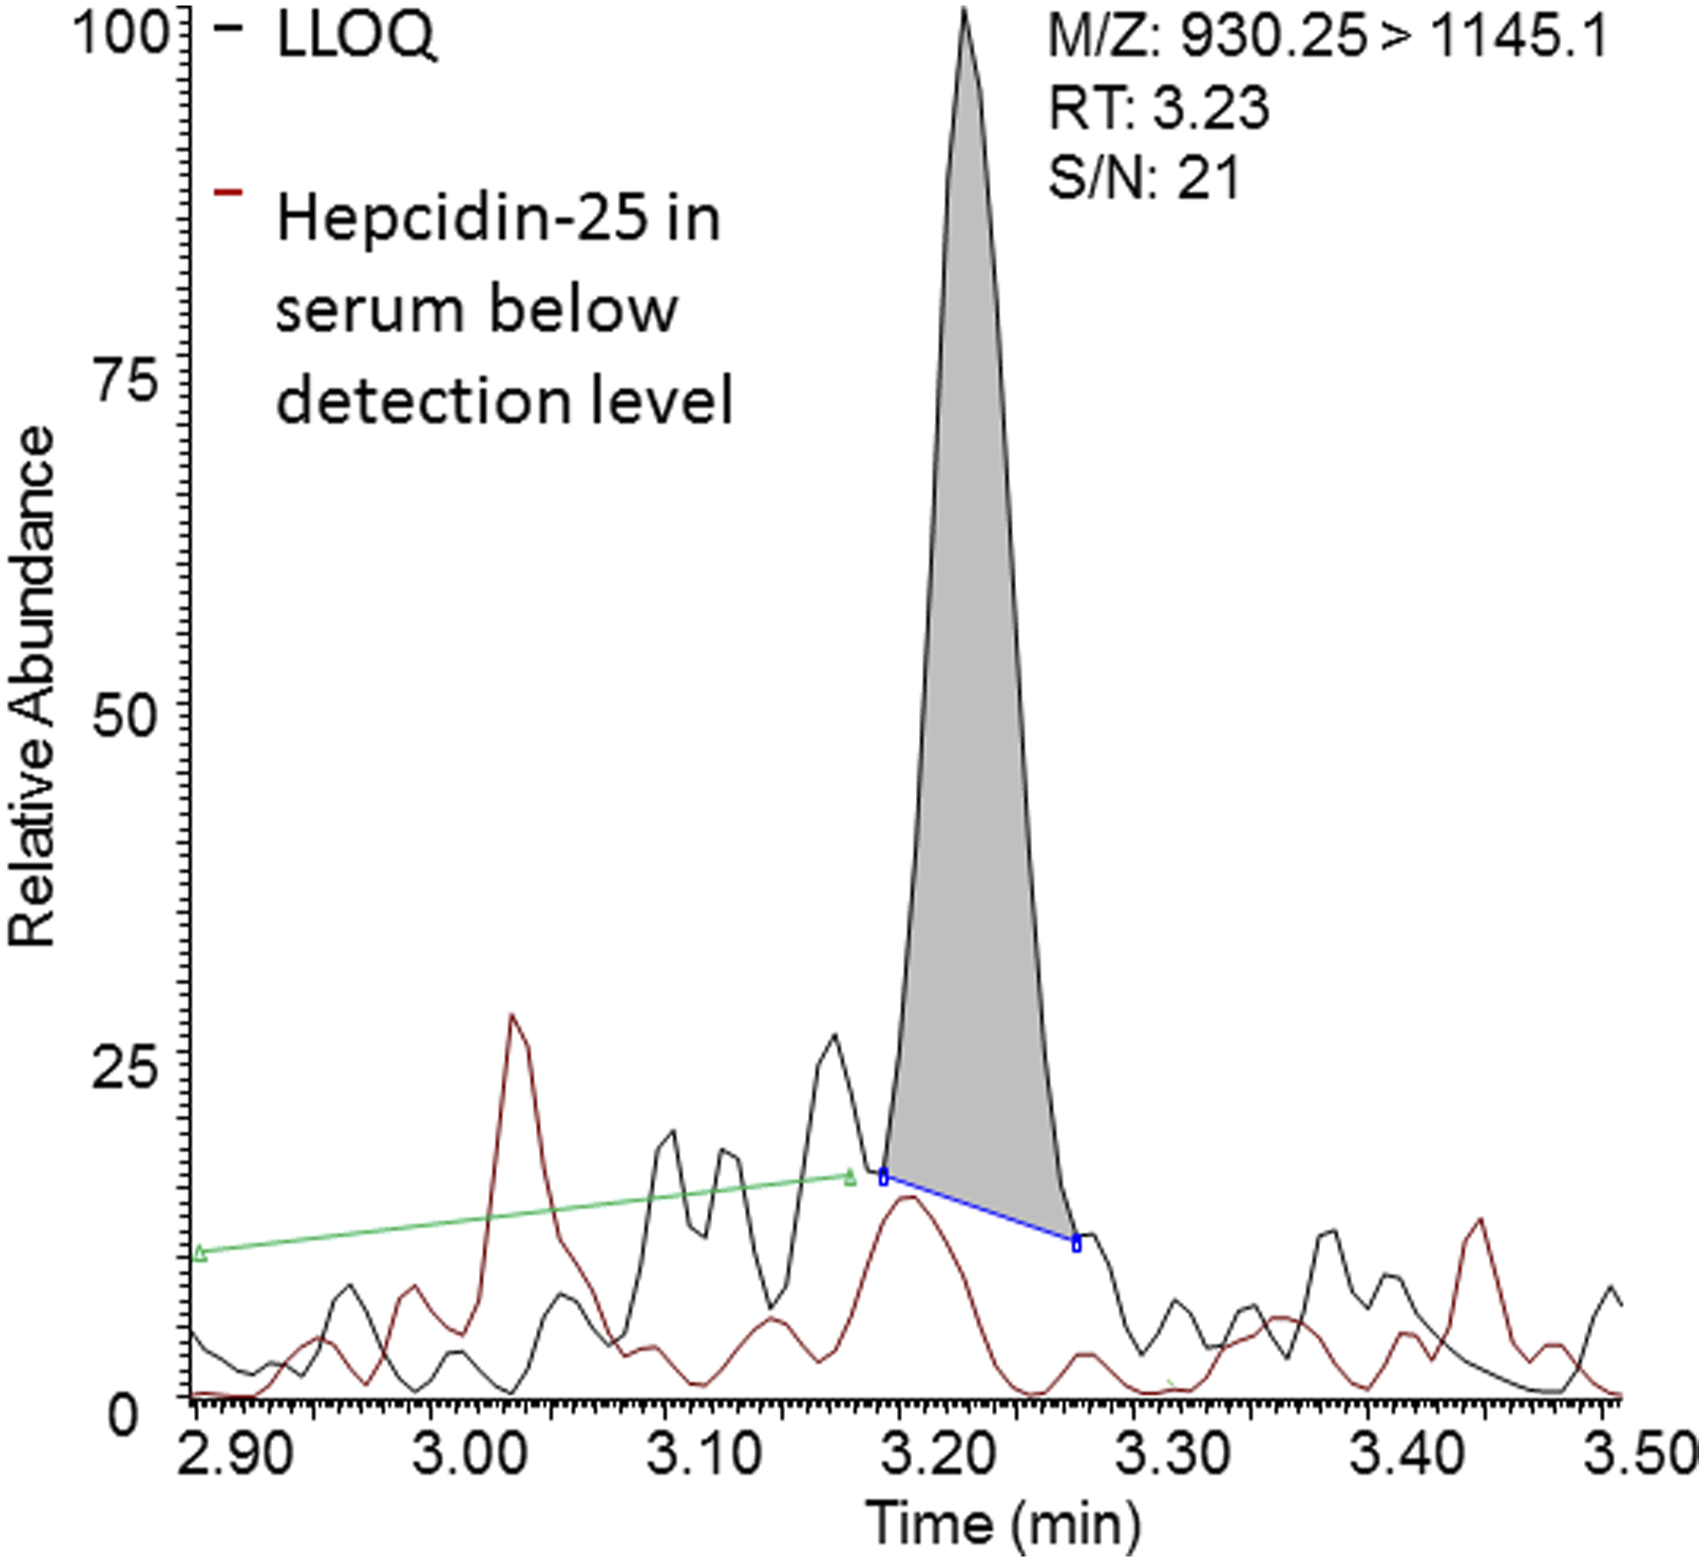
Chromatogram of hepcidin-25 in LLOQ sample (black) and hepcidin-25 in serum below detection level (red). Signal to noise region marked with green line.
The coefficient of determination (R2) for hepcidin-25 in serum was ranging from 0.988 to 0.999 (Figure 2). In addition to the linearity in matrix, matrix effect tested by spiking random serum samples had an average recovery of 99.9% with a CV of 6.4%. Linearity study. Coefficient of determination (R2) of hepcidin-25 in serum. Four different curves in duplicate were made with low concentration samples mixed in ratio 0:100, 25:75, 50:50, 75:25 and 100:0 with high concentration samples.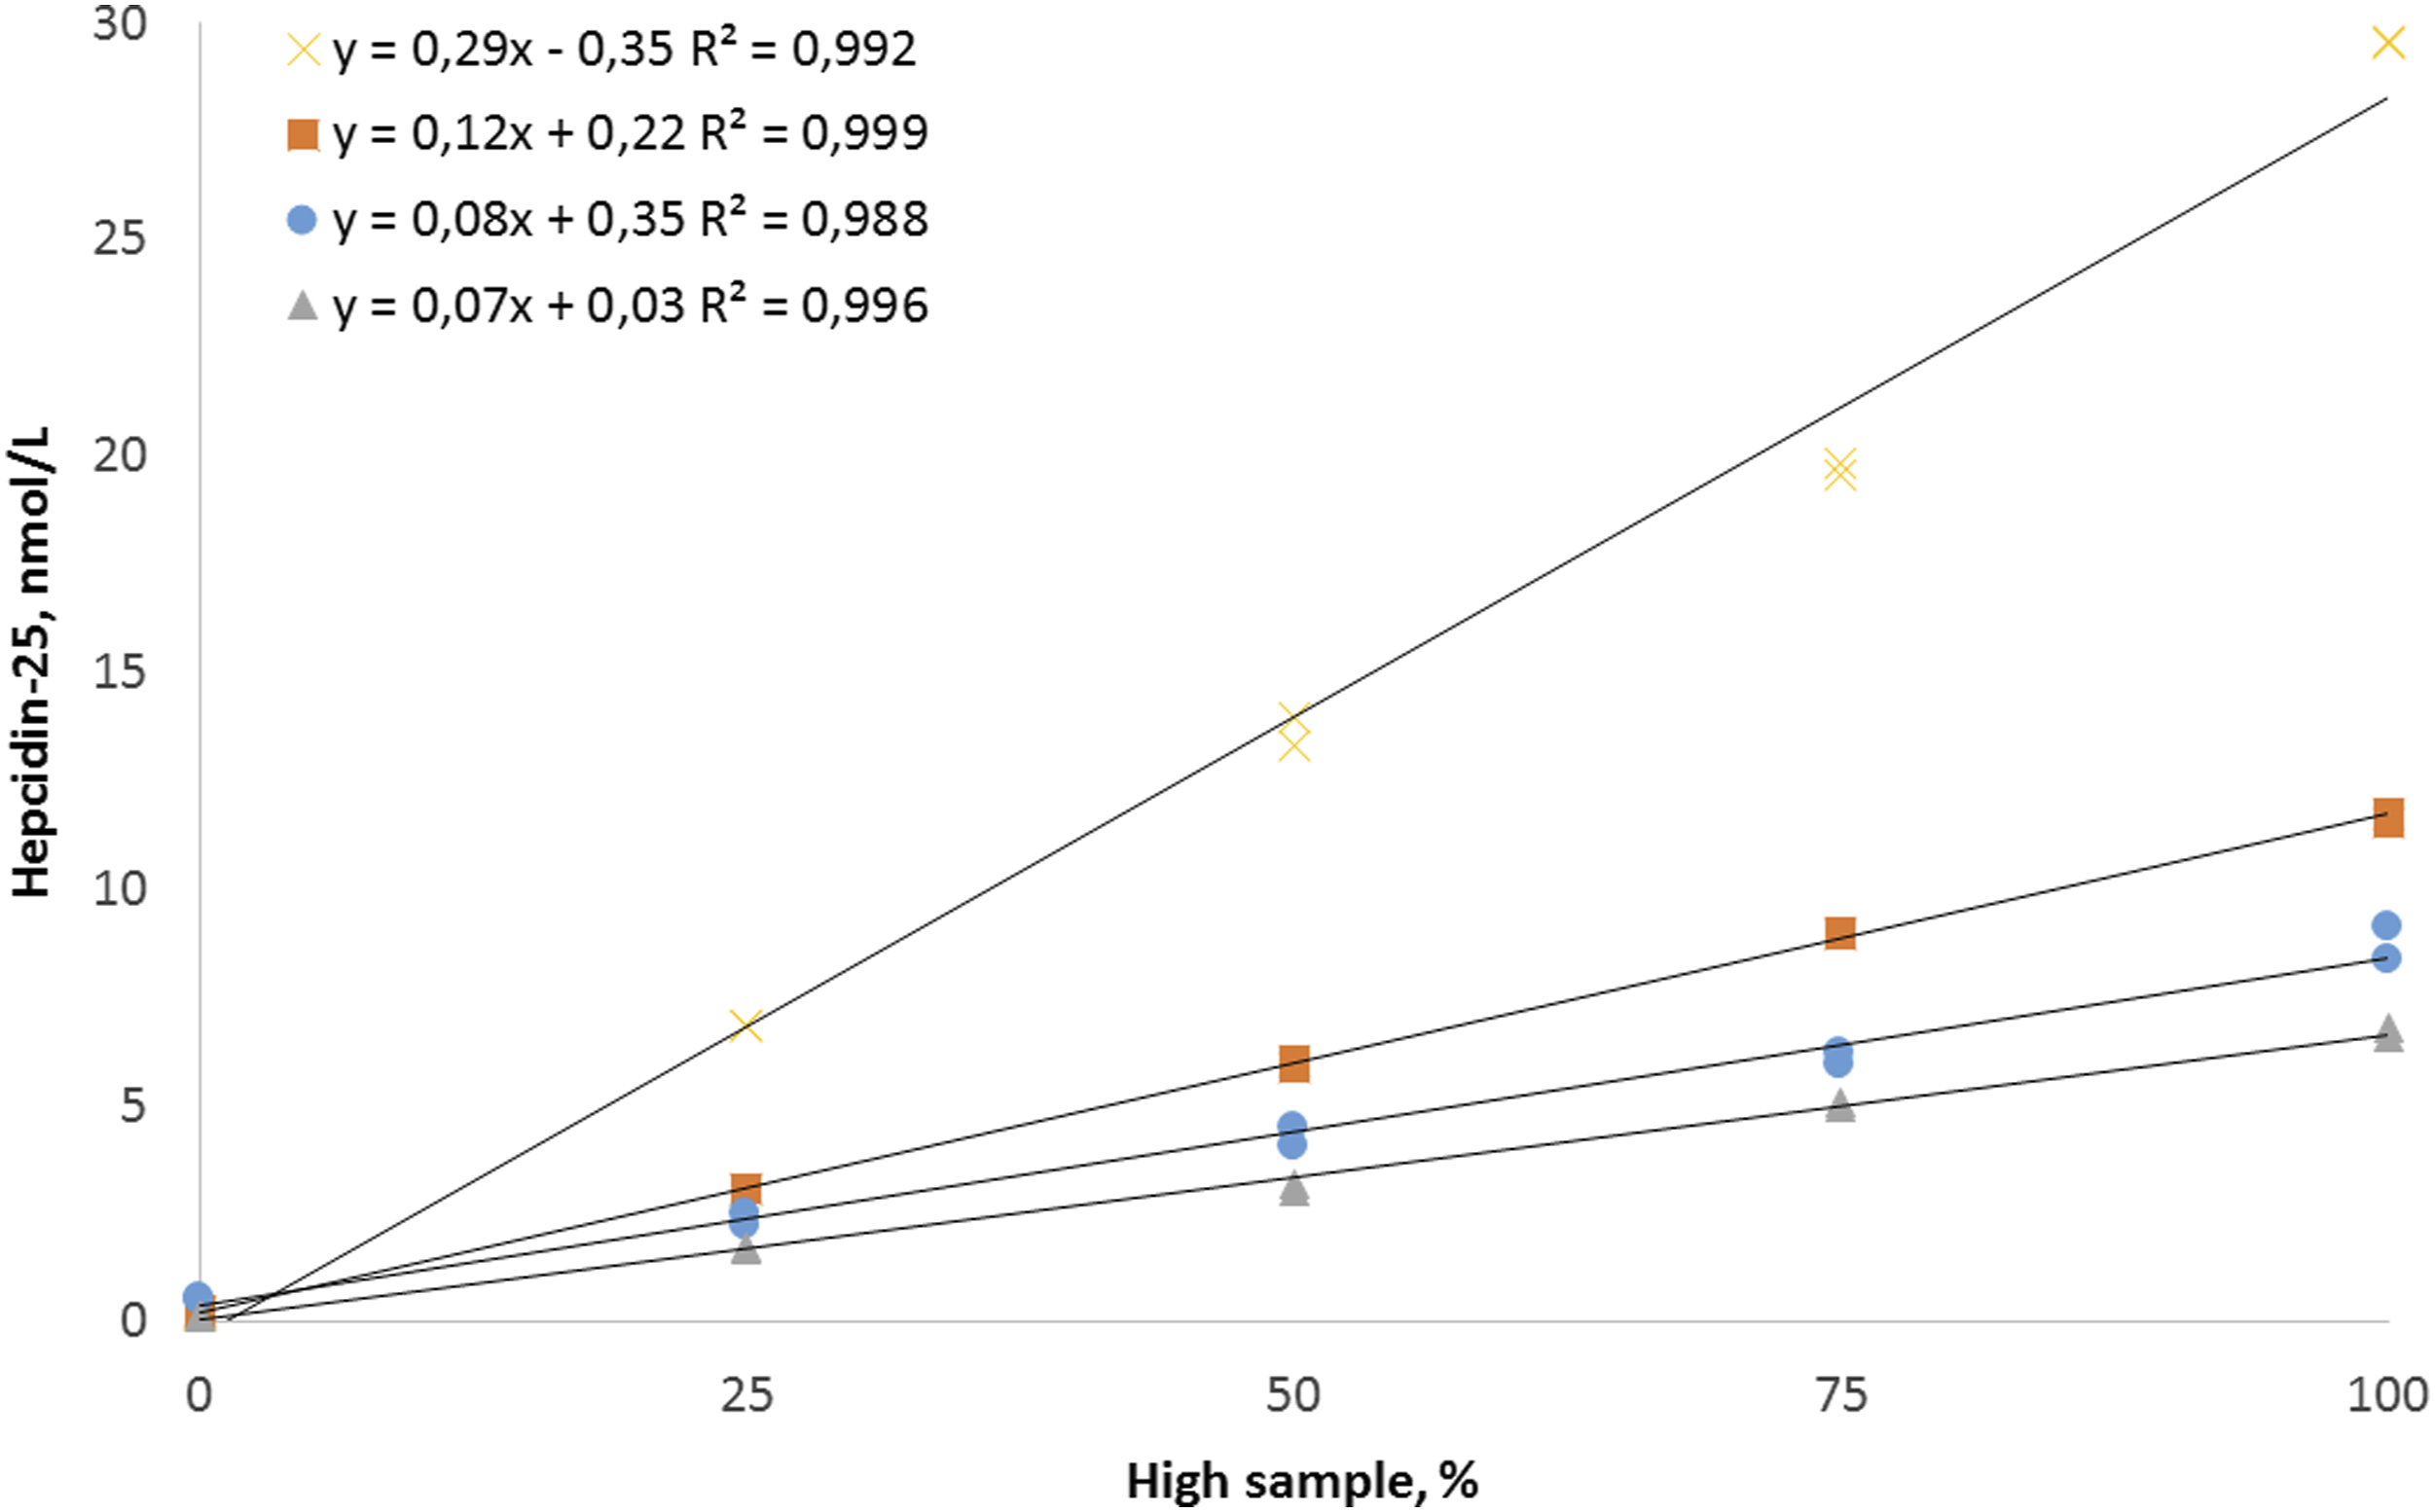
Autosampler stability was 8 h for the prepared samples (equal to 35 injections), with a decrease in area response of 16.5% compared to t=0 (CV ≤10.2%). After 8 h, the area response starts to degrade significantly with more than 79% decrease at 14 h (equal to 64 injections) compared to t = 0. Due to the use of a hepcidin-25 isotope labelled internal standard, the decrease in area response was corrected and after 14 h the average recovery was 98% and the CV calculated over 14 h was still ≤11.5%. Unlike the samples, there was no decrease in area for the hepcidin-25 standard and also for the IS which were stored in the autosampler. After 14 h the area response for hepcidin-25 was still 97.9% compared to t = 0 (CV 1.7%).
The concentration measured in serum after 26 h storage at room temperature ranged from 90% to 105% (CV ≤10.5%). The recovery of hepcidin-25 in serum samples and standard (19.8 nmol/L) after four freeze/thaw cycles, ranged from 90% to 110% with a CV ≤7.4% calculated over the four freeze/thaw cycles. For serum with a low concentration of 0.21 nmol/L (average S/N 19) close to the expected LLOQ of 0.25 nmol/L, the recovery was 103% after four cycles with a CV 19.1%. The recovery for the low, medium and high QC samples of hepcidin-25 stored for 9 months at -20°C ranged from 91% to 114% (CV ≤5.2%).
Finally, throughout the validation, no carry-over was observed.
Clinical validation
After the method validation, the assay was tested in a clinical validation. The slope and intercept between serum and EDTA plasma were 1.00 (95% confidence interval (95% CI), 0.93–1.08) and 0.14 (95% CI, -0.08–0.36) respectively. For serum compared to heparin plasma, the slope and intercept were 0.88 (95% CI, 0,8–0.95) and 0.03 (95% CI, -0.24–0.3), respectively (Figure 3). Values found for the sRM calibrator set were for low 1.4 nmol/L (150% of the target value), medium 4.5 nmol/L (120%) and for high 9.3 nmol/L (104%), with an average absolute bias of 0.5 ± 0.2 nmol/L. When correcting sRM values with 0.5 nmol/L, than the corrected values for low were 0.9 nmol/L (95% of the target value), medium 4.0 nmol/L (106%) and high 8.9 nmol/L (98%). Hepcidin-25 concentration in serum compared to EDTA plasma (green dots) and to heparin plasma (blue squares).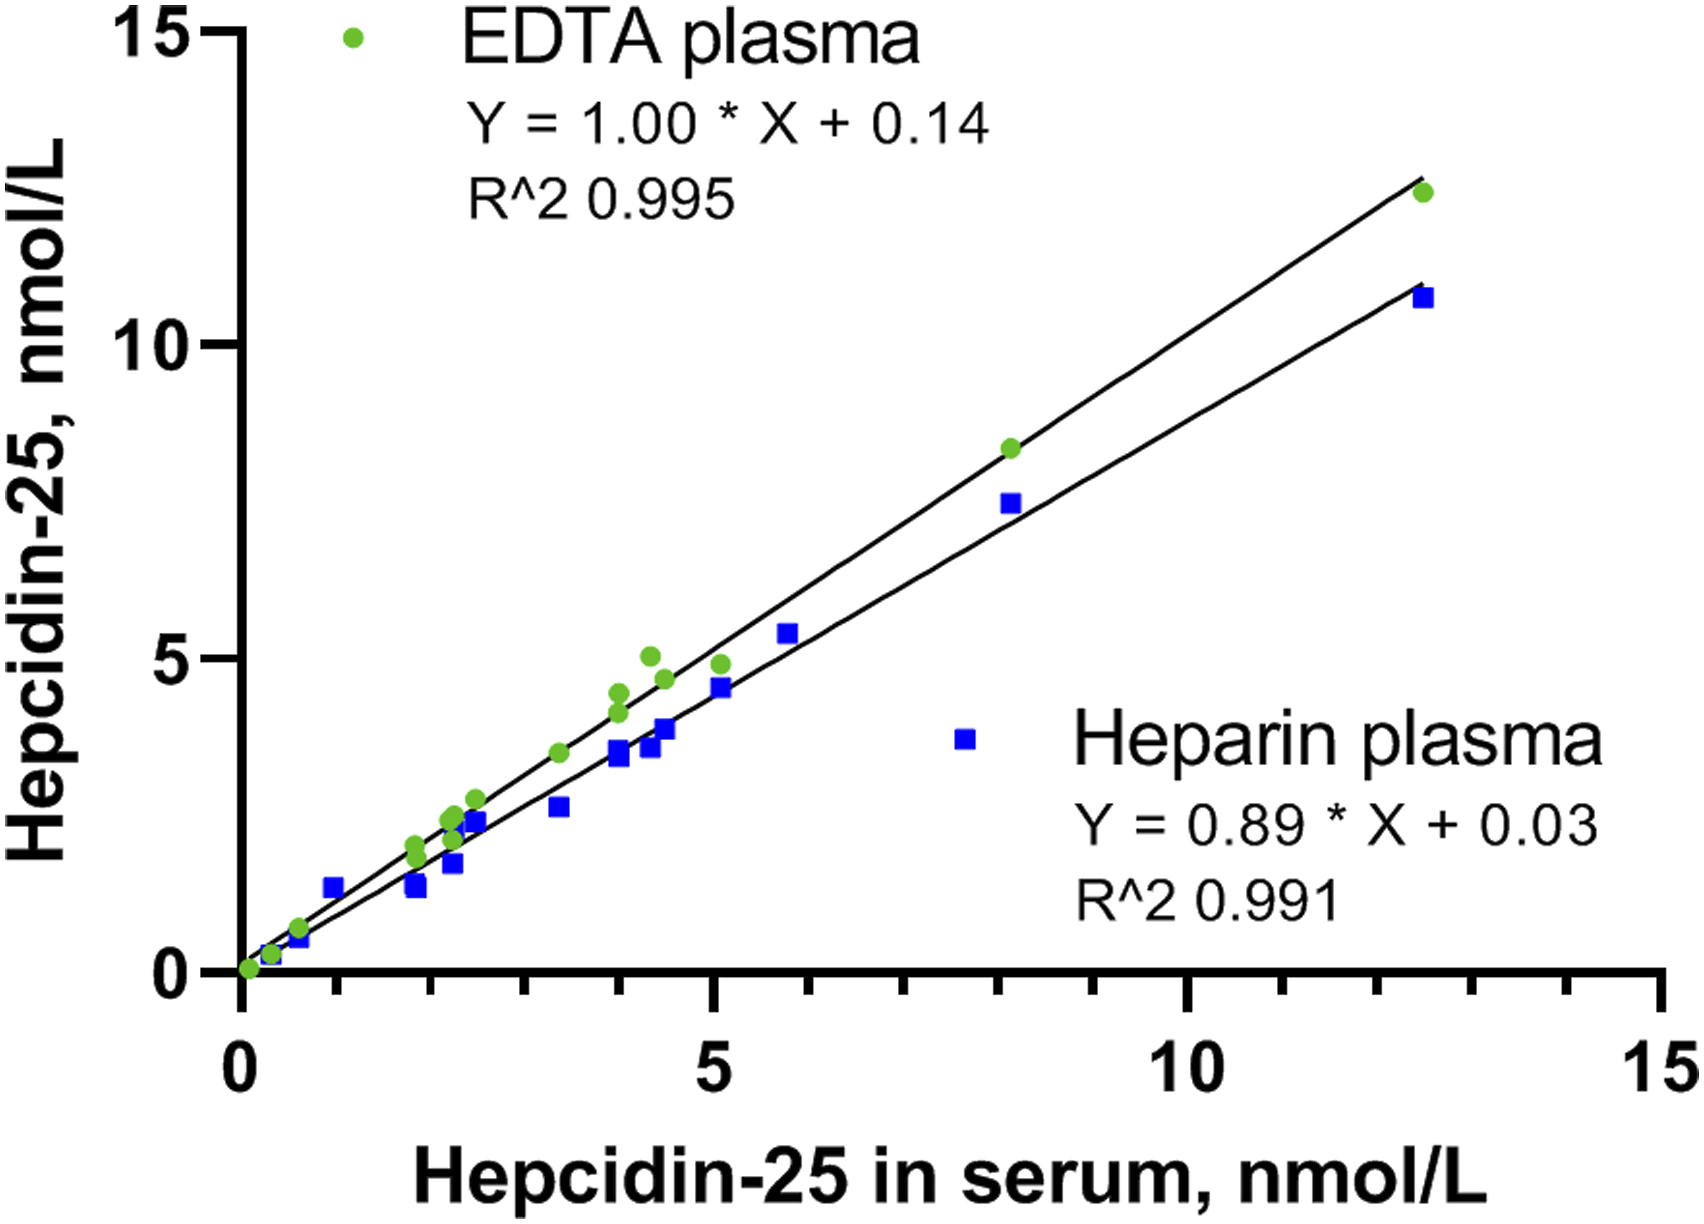
Results obtained by the analysis of hepcidin-25 in healthy subjects, the reference interval (90% CL) for 156 samples was: lower limit: 0.12 (0.07–0.19) and upper limit: 11.2 nmol/L (9.5–13.0). A frequency distribution curve for the 156 samples is presented in Figure 4. One sample was below the limit of detection (S/N <3) and two samples were found below the limit of quantification (S/N <10), with a concentration of 0.12 nmol/L and 0.13 nmol/L respectively. Histogram of hepcidin-25 concentration in samples from healthy subjects (n = 156).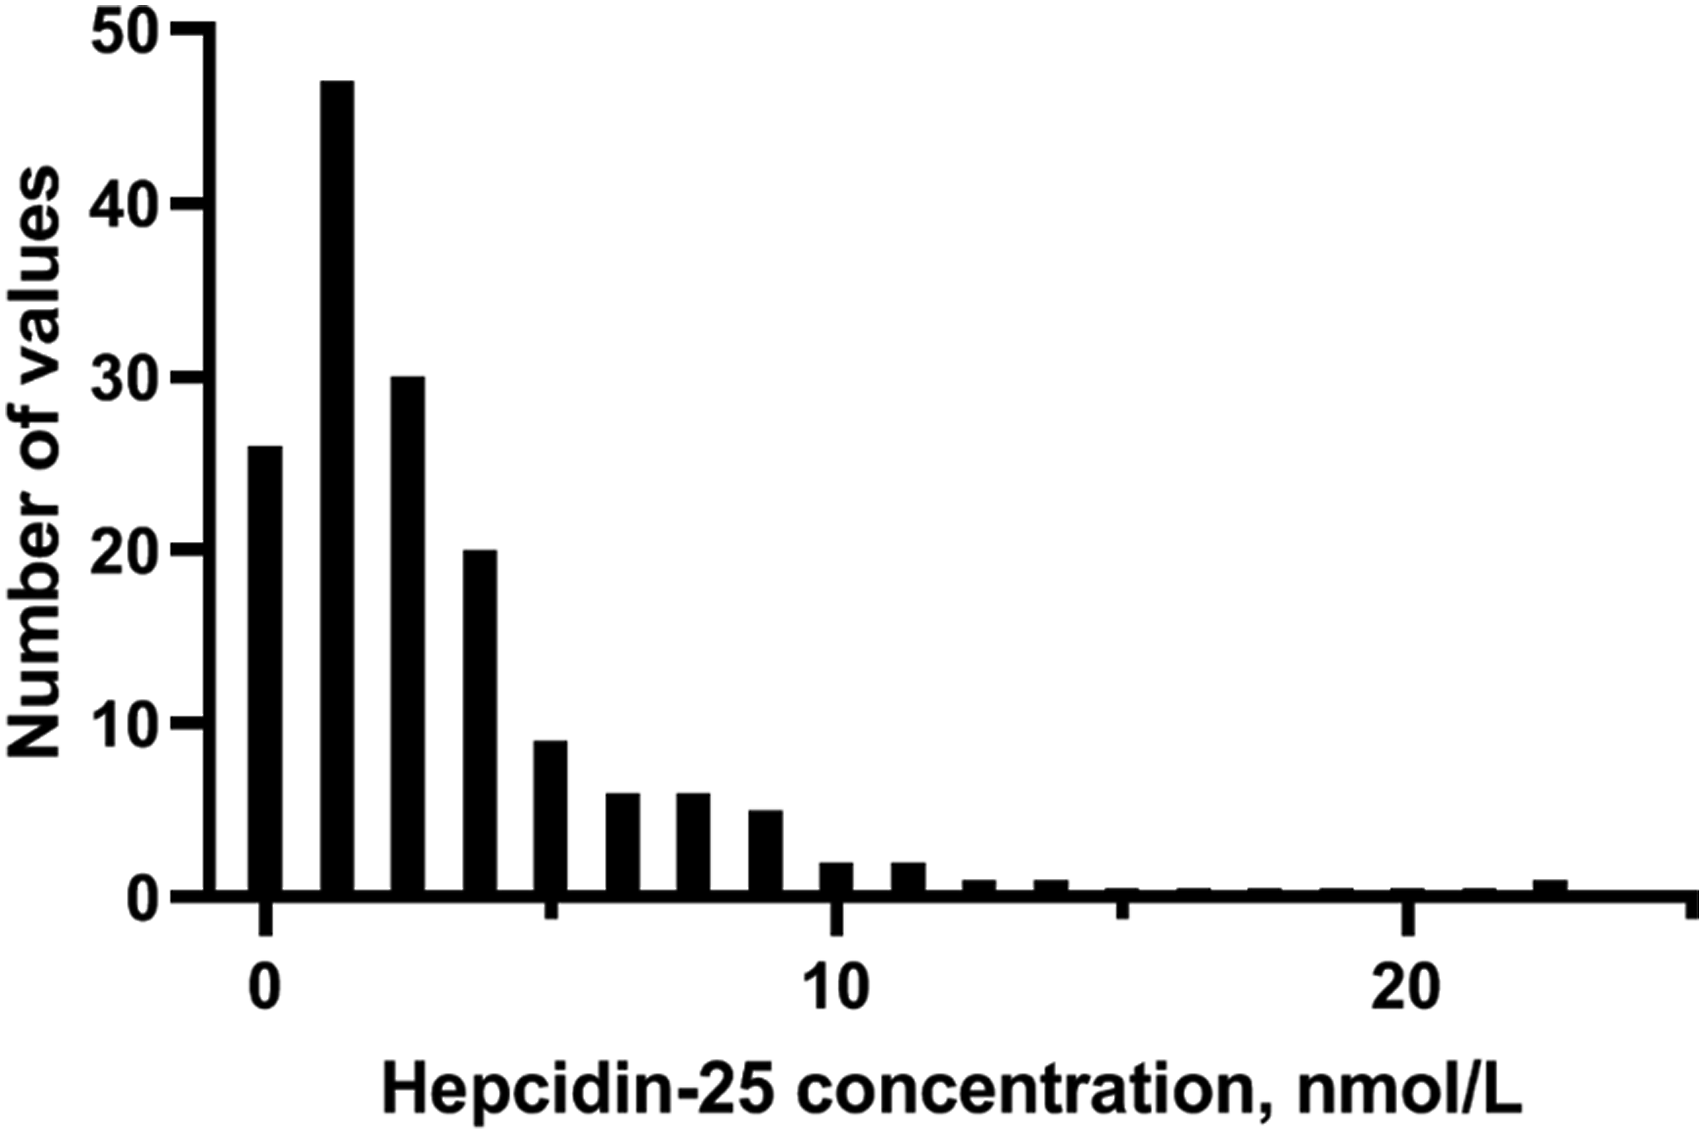
Discussion
Here we present an assay for the analysis of hepcidin-25 with an easy and fast sample preparation. The sample preparation took place in a LoBind 96-well plate and injection of the supernatant in the LC-MS/MS was done directly from this plate. Additional sample clean-up steps like evaporation to dryness and/or SPE could be avoided. An efficient protein precipitation solvent was selected, which is a critical step in the analysis of hepcidin-25. TCA is one of the most effective protein precipitation solvents compared to more commonly used solvents like ACN, methanol or zinc sulfate in solution. 23 Although TCA increases the hydrophobicity of peptides, leading to aggregation when using high hydrophilic solvents (like serum), 24 using a 50:50 mixture of 22% TCA/ACN, the aggregation of hepcidin-25 could be avoided. As a result, obtaining low detection levels of hepcidin-25 in serum was possible.
Sample stability in various disposable containers showed that polypropylene was a good alternative for (silanized) glassware. In addition, validation results showed that using silanized glassware does not automatically prevent non-specific binding of hepcidin-25, which is in contrast to published results where silanized glassware was preferred, instead of polypropylene. 12 The discrepant results with our findings can be explained by the availability of different methods to silanize glassware 25 and/or the combination of silanized glassware with different polarity of the solvent and/or pH (charge state of hepcidin) of the stock solution used. Based on the results of this study, we prefer the use of Lo Bind polypropylene. However, the stability of hepcidin-25 stored in regular polypropylene tubes and/or 96-well plates is no different from the storage in LoBind treated polypropylene. When controlling the conditions of the non-specific binding of hepcidin-25, it is possible to create a very fast and efficient sample preparation in a 96-well plate without use of laborious SPE and/or evaporation to dryness.
Despite the minimal sample clean-up, the preliminary LLOQ is comparable or even lower than recently published research with SPE or protein precipitation clean-up.12,14–18,20 Based on the CV and S/N of the samples with concentrations <0.25 nmol/L, used in the freeze/thaw test, and the dataset of 144 samples, the final LLOQ will indeed be lower than 0.25 nmol/L, but the precise value has to be determined with samples below 0.25 nmol/L. Matrix effects were limited with use of 22% TCA:ACN (1:1) as protein precipitation solvent. Furthermore, serum and EDTA plasma can be used interchangeably, but for heparin plasma a correction factor is needed when other sample types are not available.
Autosampler stability results showed a degradation of hepcidin-25 in pretreated sample material, but not in the pretreated standards. Signal response changes for both hepcidin-25 and the IS and the peak area of the IS.
The conditions for sample preparation and storage conditions in the autosampler were equal for standards and serum. This indicates that the low recovery of hepcidin-25 after 14 h is related to interaction of hepcidin-25 with serum compounds, which are still present after sample clean-up. The extent of instability for prepared hepcidin-25 could be related to the use of protein precipitation. One study in which protein precipitation was used did confirm the instability of hepcidin-25 in prepared samples 12 but another study with use of protein precipitation did not test it. 20 However, with use of SPE the prepared samples remained stable for 48 h when stored at 4–8°C in the autosampler vial.14,15
For the detection of low levels of hepcidin-25, caused by hereditary haemochromatosis or iron loading anaemias, the time to analyse a series of samples is limited to a duration of 8 h, in order to be able to guarantee reliable results at a concentration level around the LLOQ. For the detection of high levels of hepcidin-25 in serum caused by ACD, IRIDA, or Hepcidin-producing hepatic adenomas, this is less relevant and longer series of samples are possible. In a recent study we successfully used the assay for patients with various forms of hereditary haemolytic anaemias, to characterize the interplay between erythropoiesis and iron levels. 26 The calculated upper reference limit is 11.2 nmol/L. The lower reference limit, based on this data set is below the quality control samples used in this study. Although some differences were reported in hepcidin reference intervals in a previous study between male and female and with age and time of the day, the dataset in this study is too limited to further differentiate reference intervals between sex and age. 27 Diepeveen et al. 28 investigated the differences between several LC-MS/MS methods and concluded that standardization of hepcidin-25 between laboratories with use of the sRM calibrator set is highly recommended, due to significant difference between measurement procedures which is mostly caused by the calibrators used. In our study the calibrators deviate mostly in the lower concentration range (150% for low sRM and 104% for high sRM). After correction of the sRM values analysed by this study, the values were in agreement with the harmonization study. However, the international calibrator sRM used in this study, is a proposed set for international standardization. Therefore, the absolute correction of 0.5 nmol/L will be used when the sRM calibrators are internationally accepted.
The limitation of the study is that the stability of the samples in the Lo Bind 96-well plate is limited to 14 h at a maximum. This time is however sufficient to analyse 64 samples (singleton injection). Another limitation is the LLOQ, which appears to be higher than the lower limit of the reference interval.
Conclusion
We present a fast and easy assay for the quantification of hepcidin-25 in serum, EDTA plasma and heparin plasma, by TCA protein precipitation with use of a LoBind polypropylene 96-well plate. Furthermore, a reference interval was set for hepcidin-25 in serum and plasma.
Footnotes
Declaration of conflicting interests
The author(s) declared no potential conflicts of interest with respect to the research, authorship, and/or publication of this article.
Funding
The author(s) received no financial support for the research, authorship, and/or publication of this article.
Ethical approval
Not applicable.
Guarantor
AP.
Contributorship
AP designed the study, conducted the experiments and data analysis, reviewed literature and wrote the manuscript. JW conducted the experiments and data analysis. KE and AH reviewed and edited the manuscript. EL designed the study, reviewed literature, reviewed and edited the manuscript. All authors approved the final version of the manuscript.