
Abstract
Background
The iron-regulatory hormone hepcidin is a promising biomarker to differentiate anaemia of inflammation from iron deficiency. Plasma hepcidin concentrations increase substantially during inflammation, and the amount of smaller, non-biologically active isoforms of hepcidin increase in inflammatory conditions. These smaller isoforms are measured in some, but not all analytical methods. Thus, we evaluated the comparability of two analytical methods with different isoform selectivity during and after acute-phase pneumonia as a highly inflammatory model disease.
Methods
Blood samples from a cohort of 267 hospitalized community-acquired pneumonia patients collected at admission and a 6-week follow-up were analysed. Hepcidin was measured in plasma by an immunoassay, which recognizes all hepcidin isoforms, and a liquid chromatography tandem mass spectrometry (LC-MS/MS), which selectively measures the bioactive hepcidin-25. Additionally, a subset of serum samples was analysed by LC-MS/MS.
Results
Hepcidin measurements by immunoassay were higher compared with LC-MS/MS. The relative mean difference of hepcidin plasma concentrations between the two analytical methods was larger in admission samples than in follow-up samples (admission samples <200 ng/mL: 37%, admission samples >200 ng/mL: 78%, follow-up samples >10 ng/mL: 22%). During acute-phase pneumonia, serum concentrations were on average 22% lower than plasma concentrations when measured by LC-MS/MS.
Conclusions
Immunoassay measured higher hepcidin concentrations compared with LC-MS/MS, with more pronounced differences in high-concentration samples during acute-phase pneumonia. These findings should be considered in local method validations and in future harmonization and standardization optimization of hepcidin measurements.
Introduction
The iron-regulatory hormone hepcidin is emerging as a promising biomarker in several iron-related diseases, including differentiation between iron-deficiency anaemia and anaemia of inflammation, diagnosis of iron-refractory iron-deficiency anaemia as well as guidance of oral iron supplements. 1
Hepcidin is bioactive as a 25 amino acid polypeptide (hepcidin-25), but smaller isoforms (hepcidin-20, -22 and -24) are formed following N-terminal degradation. 2 Levels of degraded isoforms vary substantially in different studies,3–7 but high levels have in particular been detected in diseases with high hepcidin concentrations such as sepsis and kidney failure. 8 Yet, it has not been shown that these smaller isoforms have a significant biological function in iron regulation. 9
Circulating hepcidin can be measured by mass spectrometry or commercially available immunoassays (IAs). Liquid chromatography coupled with tandem mass spectrometry (LC-MS/MS) can selectively measure the biologically active hepcidin-25, whereas most IAs measure all isoforms. 2 Comparisons between these analytical principles have generally shown acceptable correlation but substantial differences in measured hepcidin concentrations.10–14 Mostly, immunoassays reported higher concentrations than MS-based methods. Also, strong correlations have been reported between serum and plasma concentrations,5,15,16 although one study reported higher concentrations in plasma. 16 Great efforts have been put into harmonization10–12 and standardization13,14 of the hepcidin analysis, but meanwhile, the lack of a unified approach to measure hepcidin concentrations complicates interpretation, use of international cutoffs, and universal reference ranges.
Because biologically inactive, smaller isoforms of hepcidin have been detected in conditions with high hepcidin concentrations, such as infections, the isoform selectivity of analytical methods could be important for the interpretation of hepcidin concentrations in these patients. As one of the most promising clinical applications for hepcidin measurements involves anaemia of inflammation, it is important to establish how different analytical methods perform during inflammation and infection. Thus, the aim of this study was to compare hepcidin analysis by IA (total isoform measurement) and LC-MS/MS (hepcidin-25 measurement) in acute and convalescent plasma and serum from patients hospitalized with community-acquired pneumonia.
Materials and methods
Biosamples from a prospective cohort of adult community-acquired pneumonia patients admitted to hospital between 1 January 2008 and 31 January 2011 were used (NCT01563315). Inclusion and exclusion criteria are previously described. 17 There were no exclusion criteria for the follow-up. Blood samples were obtained within 48 h of admission and at a follow-up (median 6 weeks, IQR 1 week, min. 3 and max. 23 weeks post-discharge). All samples were put on ice directly after blood draw, and refrigerated centrifugation at 2000g for 12 min was performed within 1 hour of sampling. Aliquots of both EDTA plasma and serum were stored at −80°C. Informed consent was obtained from all patients, and the study was approved by the Regional Committees for Medical and Health Research Ethics South East Norway (reference no. S-06266a).
Measurement procedures
Hepcidin concentrations were measured by two analytical methods from separate EDTA plasma vials for all available samples. Analytical specifications for both measurement procedures are detailed in the Supplemental material.
First, hepcidin-25 concentrations were measured in plasma by LC-MS/MS, and the results are previously published.18,19 In addition, a subset of serum samples from admission and follow-up was analysed by LC-MS/MS. For selection of these serum samples, CRP was used as a surrogate marker of inflammation, and the samples with the largest difference in CRP concentration between admission and follow-up were chosen, given that there was enough sample material left for analysis. Briefly, the LC-MS/MS method applies an isotope-labelled hepcidin-25 internal standard (Peptide Institute Inc., Osaka, Japan) and a straightforward protein precipitation, followed by reversed phase LC separation and MS/MS detection by multiple reaction monitoring (MRM). The method was initially validated according to Eurachem guidelines 20 and revalidated during participation in the Working Group on Clinical Quantitative Mass Spectrometry Proteomics of the International Federation of Clinical Chemistry (IFCC). Both plasma and serum samples for analysis by LC-MS/MS had been through one freeze-thaw cycle prior to analysis.
Second, hepcidin plasma concentrations were measured after converting an IA with antibodies and standards from R&D Systems (Minneapolis, MN) into a time-resolved immunofluorometric assay with plates, reagents, and a Victor2 platereader from PerkinElmer (Waltham, MA). Analyses of both patient samples and standards were performed in duplicates and the results are presented as the mean as recommended in the manufacturer’s instructions. The assay detects hepcidin-20, -22, -24 and -25, and the results were calibrated against synthetic human hepcidin-25 (R&D Systems, Minneapolis, MN). The samples used for IA analysis had been through three freeze-thaw cycles.
All sample results were included, although a few were below the lowest standard for the IA method (0.008 ng/mL) and below the lower limit of quantification for the LC-MS/MS (2 ng/mL), which increase the uncertainty of the reported concentration. For the purpose of this study, the exact concentrations in the low end of the scale were of less importance, and all results were included to avoid a selection bias in the comparison of admission and follow-up samples.
Data analysis
Coefficient of variation (%CV) for the IA method was calculated by the duplicate measurements according to the following equation:
21
Results
Of 267 patients, 17 a total of 222 admission samples and 208 follow-up samples were available for analysis by both methods, and a subset of 65 samples was used for sample material comparison. A short description of the cohort is provided in the Supplemental material. Eight patients were readmitted for various reasons at the time of the follow-up.
For the IA method, the CV was 4.7% for samples <20 ng/mL (n = 134), 5.1% between 20 and 100 ng/mL (n = 149), and 4.0% above 100 ng/mL (n = 153).
Comparison of analytical methods
At admission, the median plasma concentration was 135 ng/mL (IQR 201 ng/mL) measured by IA and 89 ng/mL (IQR 92 ng/mL) measured by LC-MS/MS (p < 0.001). At follow-up, the median concentration was 17 ng/mL (IQR 17 ng/mL) for the IA and 14 ng/mL (IQR 16 ng/mL) for the LC-MS/MS (p < 0.001). Scatterplots of hepcidin measurements by the two analytical methods at hospital admission and follow-up are shown in Figures 1(a) and (b). For admission samples, IA measured on average 37% higher hepcidin concentrations than LC-MS/MS for samples with a mean concentration up to 200 ng/mL (Figure 1(c)), and 78% higher hepcidin concentrations for mean concentrations above 200 ng/mL (Figure 1(e)). At the follow-up, IA measured on average 22% higher concentrations than LC-MS/MS for samples with a mean concentration above 10 ng/mL (Figure 1(d)). Analysis excluding the eight patients who were readmitted to hospital at the time of follow-up did not change the results (data not shown). Analytical method comparison of hepcidin measurements by immunoassay and LC-MS/MS in patients with community-acquired pneumonia at hospital admission and a follow-up after approximately 6 weeks. (a) Scatterplot with Passing–Bablok regression for admission samples. (b) Scatterplot with Passing–Bablok regression for follow-up samples. (c) Bland–Altman difference plot for admission samples up to a mean hepcidin concentration of 200 ng/mL. (d) Bland–Altman difference plot for follow-up samples above 10 ng/mL. (e) Bland–Altman difference plot for admission samples with mean concentrations above 200 ng/mL.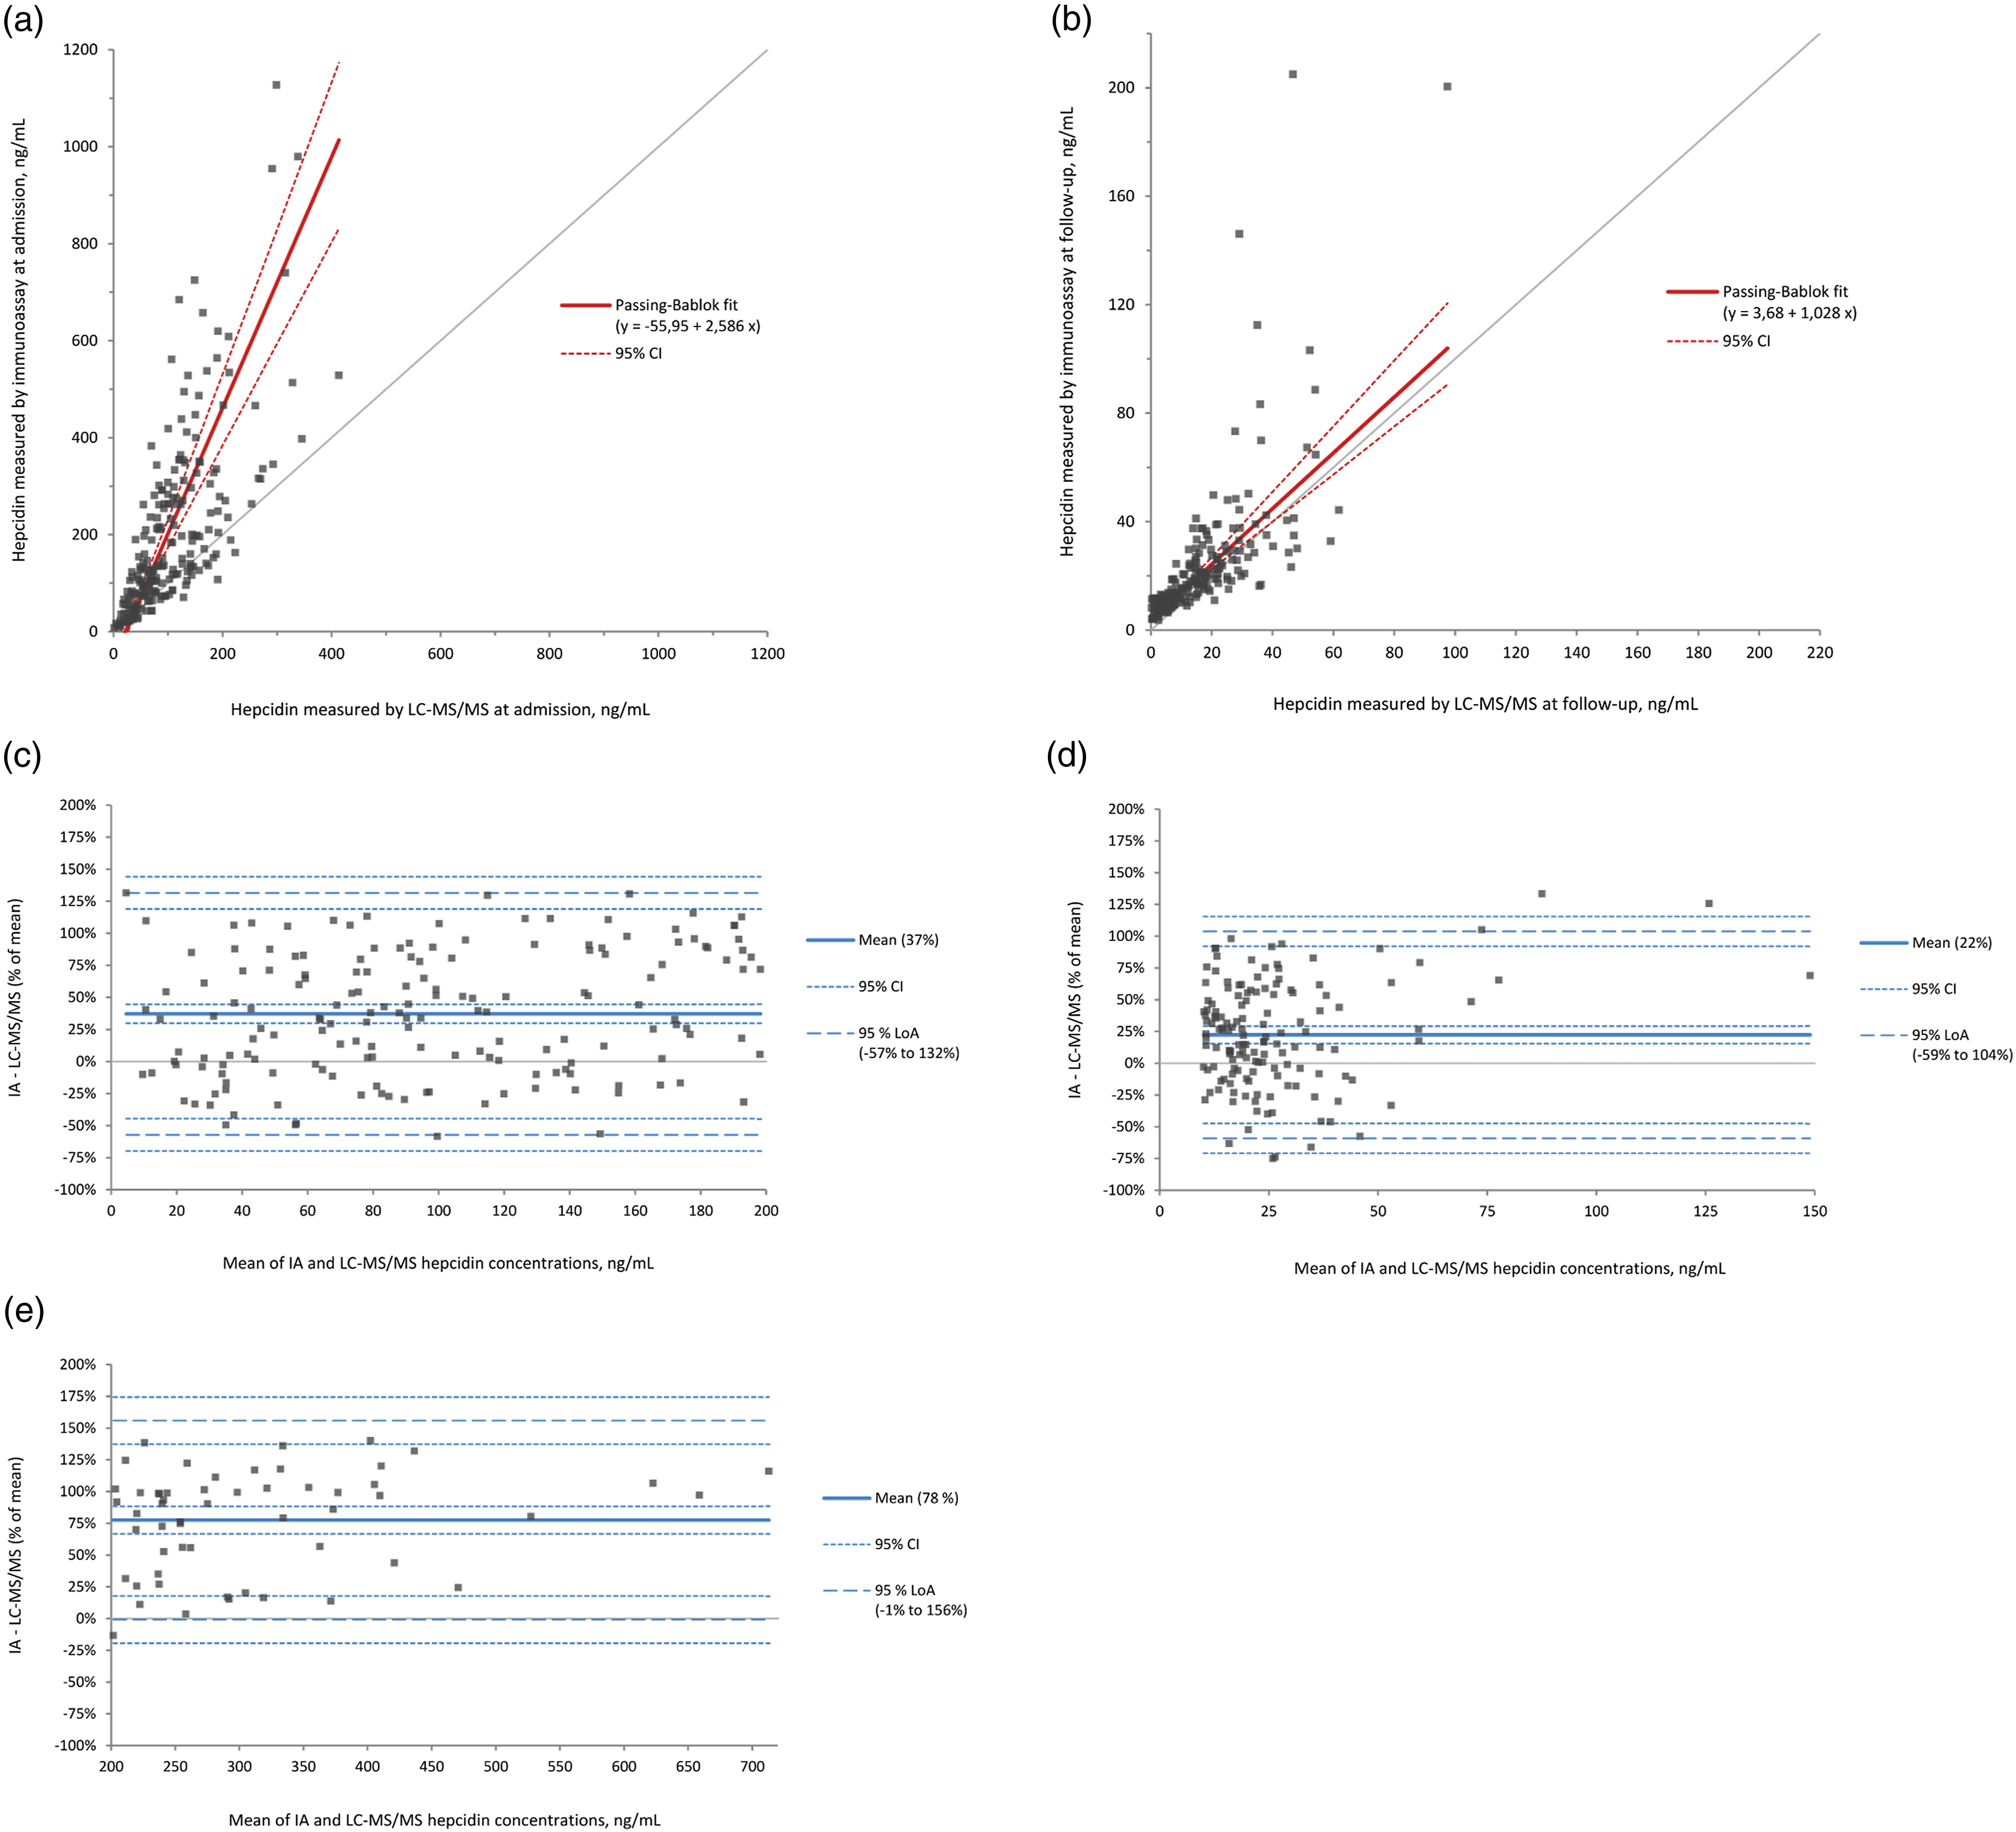
Reliability assessment of analytical methods and sample materials by intra-class correlations.
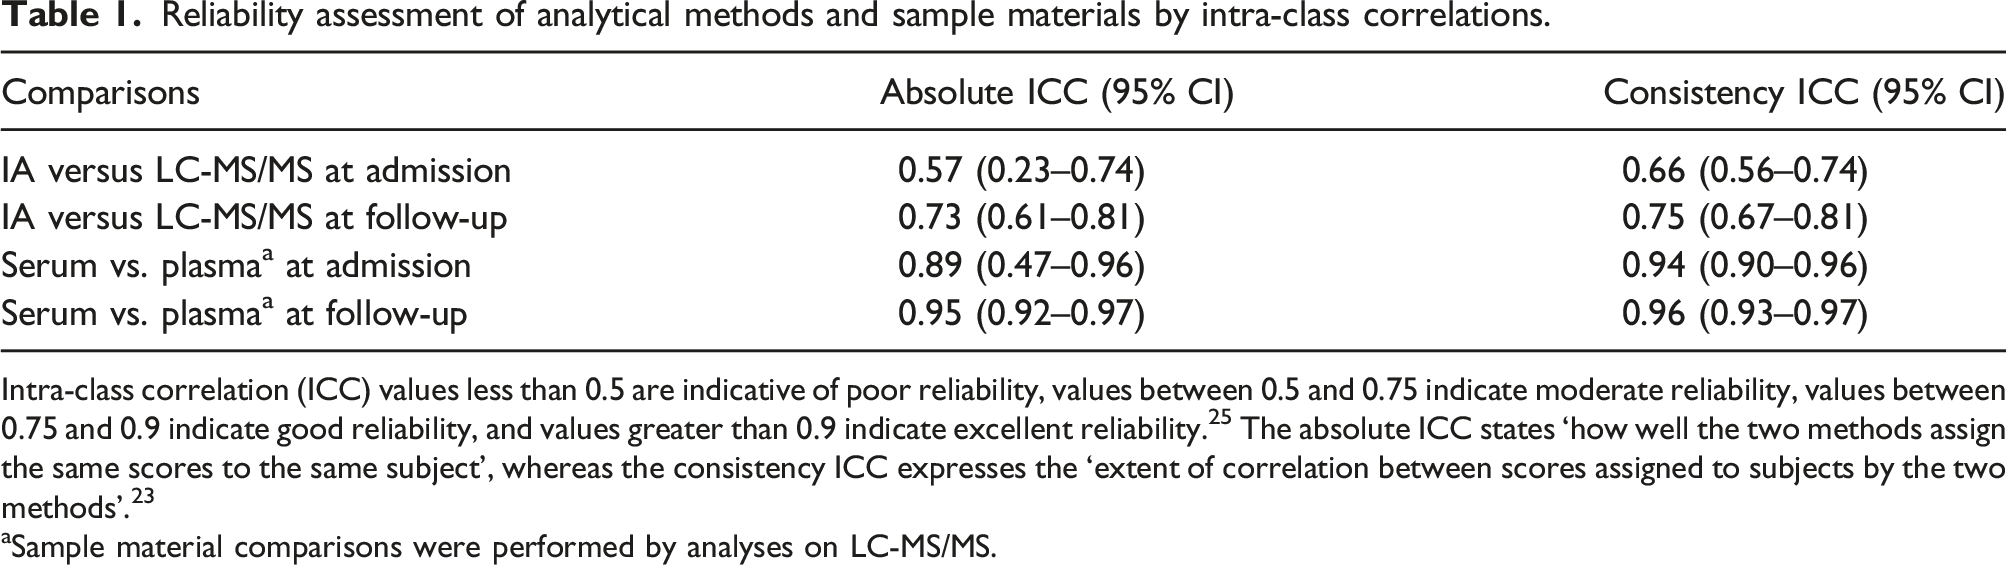
Intra-class correlation (ICC) values less than 0.5 are indicative of poor reliability, values between 0.5 and 0.75 indicate moderate reliability, values between 0.75 and 0.9 indicate good reliability, and values greater than 0.9 indicate excellent reliability. 25 The absolute ICC states ‘how well the two methods assign the same scores to the same subject’, whereas the consistency ICC expresses the ‘extent of correlation between scores assigned to subjects by the two methods’. 23
aSample material comparisons were performed by analyses on LC-MS/MS.
Comparison of sample materials
Scatterplots of serum and plasma hepcidin measurements by LC-MS/MS at admission and follow-up are displayed in Figures 2(a) and (b). At admission, serum samples were on average 22% lower than plasma samples (Figure 2(c)), a difference that was quite steady throughout the concentration range. At the follow-up, serum samples were on average 31% higher for mean sample material concentrations <20 ng/mL (Figure 2(d)), whereas samples with a mean concentration >20 ng/mL had an average difference of 1% (Figure 2(e)). Sample material comparison of hepcidin measurements by LC-MS/MS in patients with community-acquired pneumonia at hospital admission and a follow-up after approximately 6 weeks. (a) Scatterplot with Passing–Bablok regression for admission samples. (b) Scatterplot with Passing–Bablok regression for follow-up samples. (c) Bland–Altman difference plot for all samples at admission. (d) Bland–Altman difference plot for follow-up samples with a mean concentration up to 20 ng/mL. (e) Bland–Altman difference plot for follow-up samples with a mean concentration above 20 ng/mL.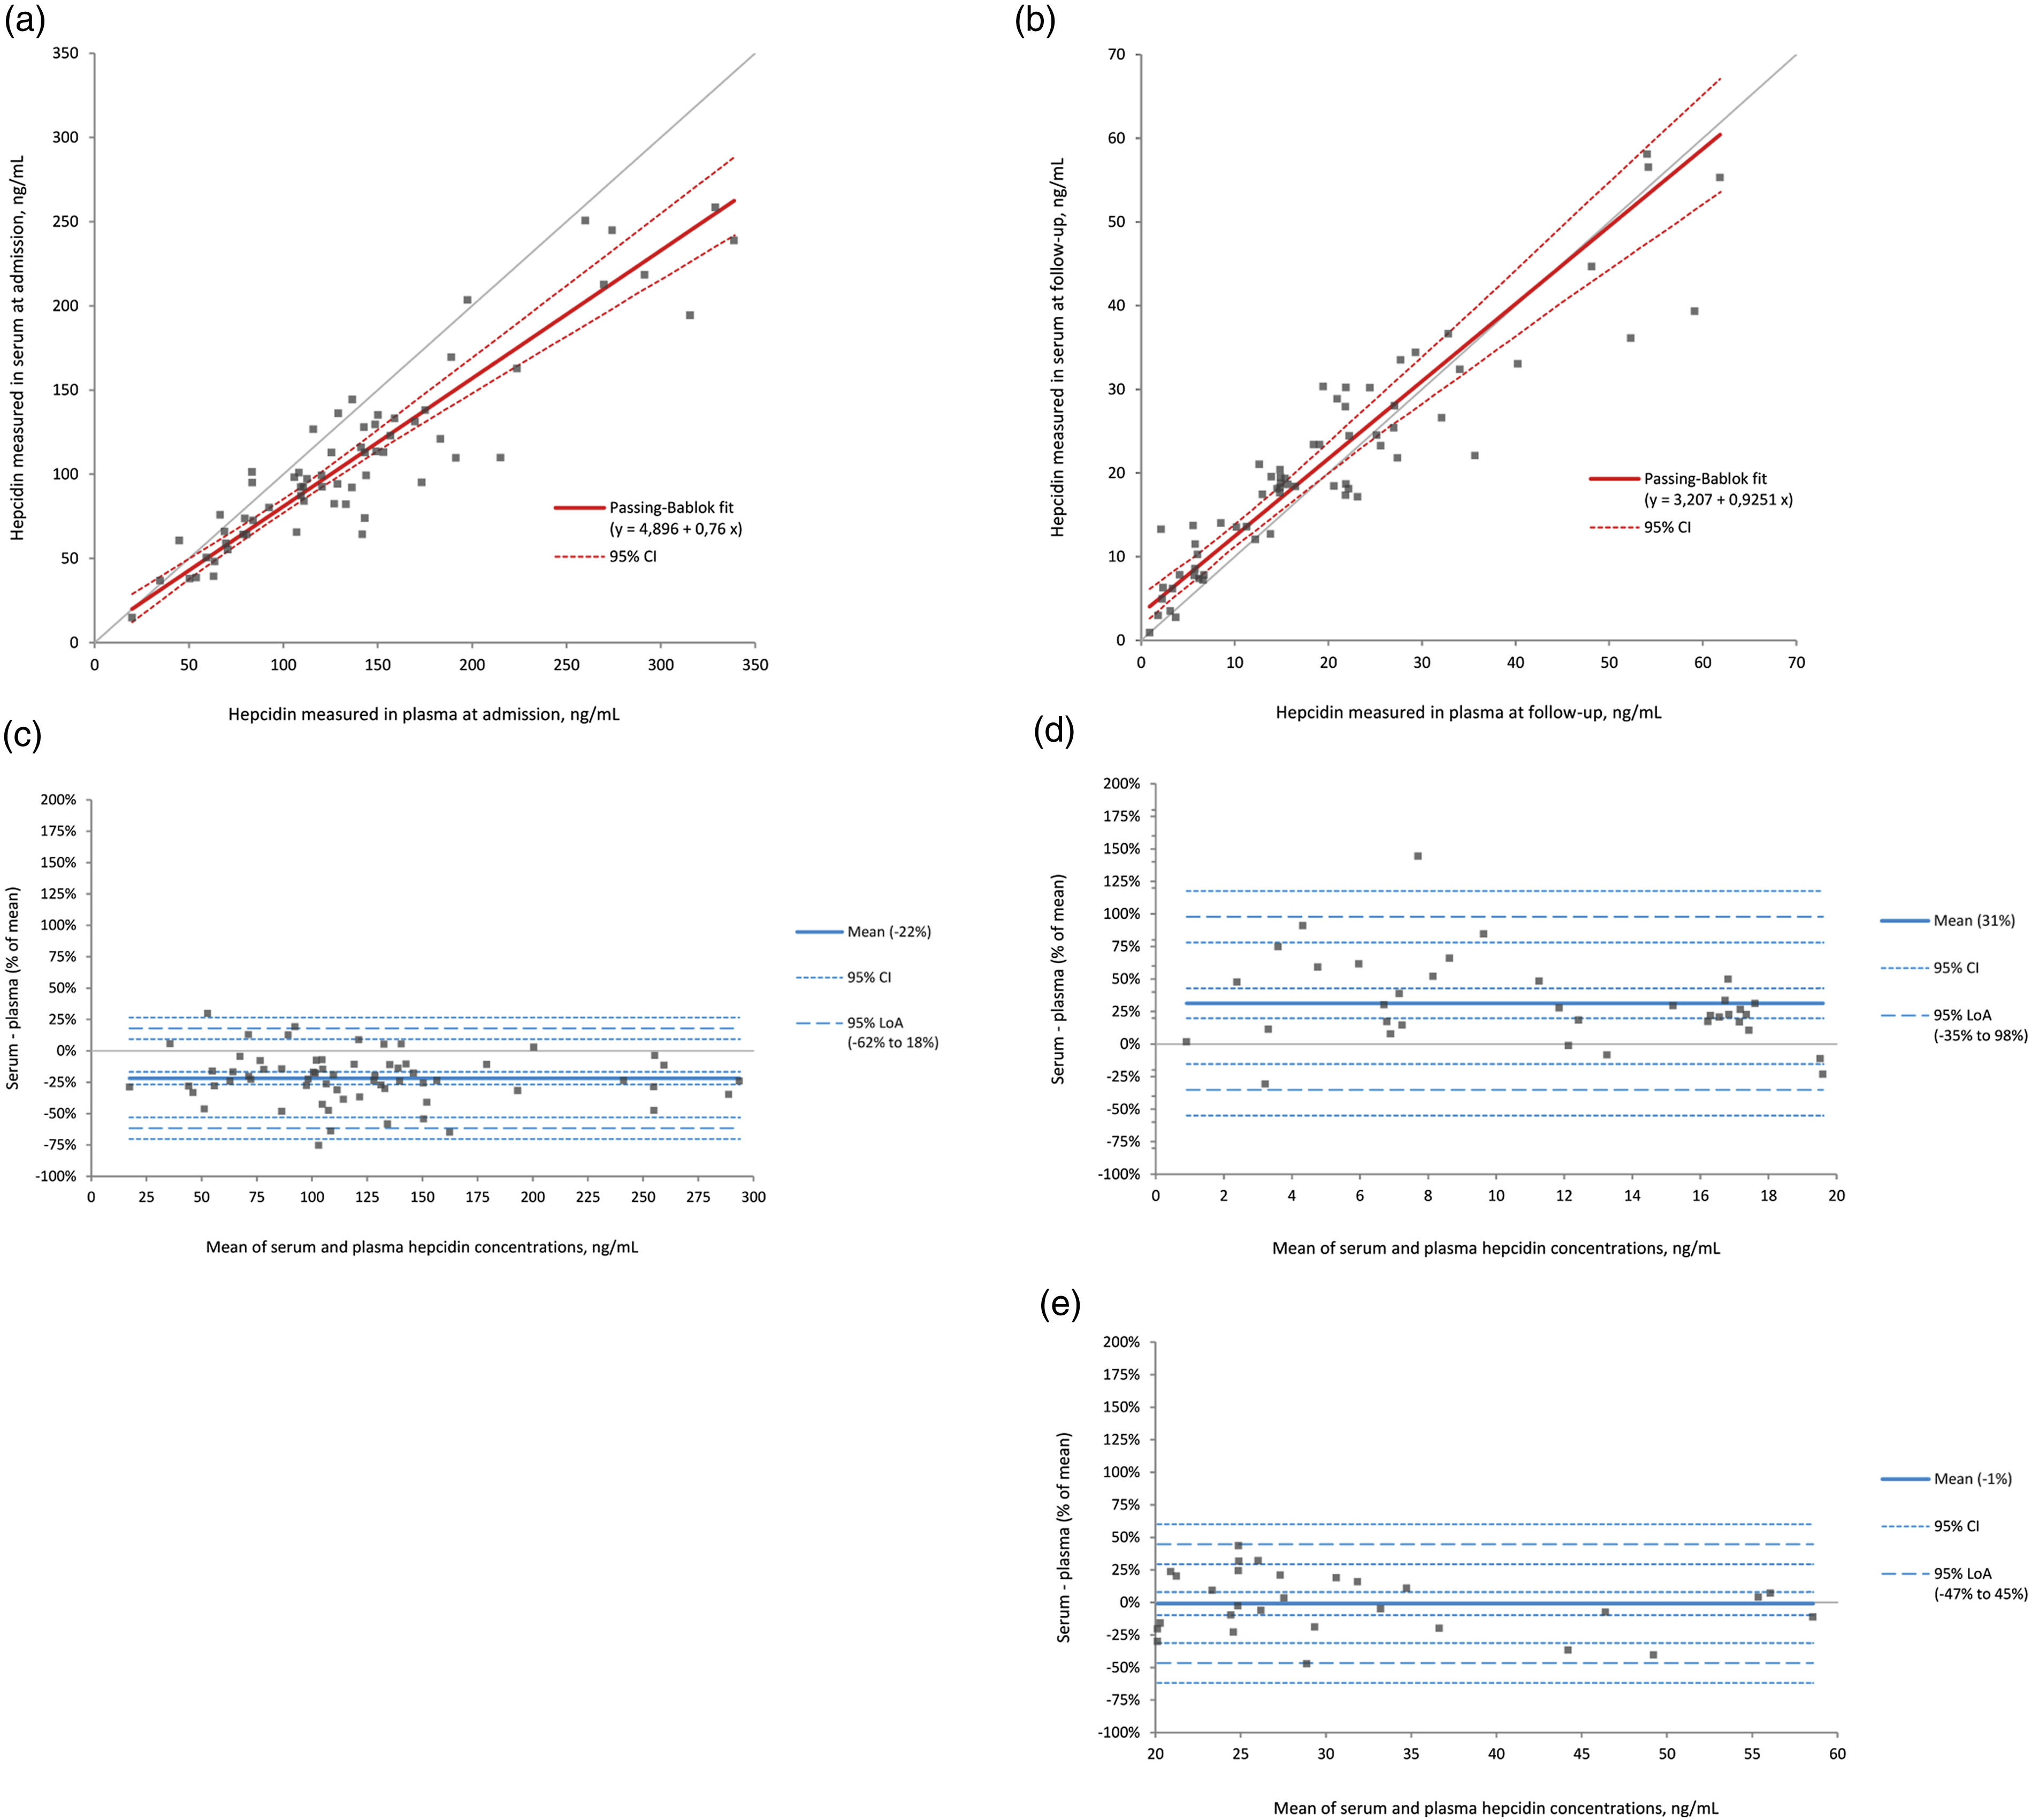
By comparing the ICCs of the two sample materials with the ICCs of the analytical methods in Table 1, it is evident that the reliability of the measurements in the two sample materials analysed by LC-MS/MS was stronger than the reliability between the two different analytical methods. For the admission samples, the discrepancy between the consistency ICC and absolute ICC of the sample material comparison was larger, suggesting a possible systematic difference, although with overlapping CIs.
Discussion
In this study, hepcidin concentrations measured by IA were higher compared with LC-MS/MS, and the difference was larger for samples with higher concentrations.
Hepcidin concentrations measured by various analytical methods are known to differ significantly, which has been attributed to the lack of international standardization or harmonization. 2 In accordance with our findings, immunochemical methods have generally measured higher concentrations than MS-based methods. 14 In the two analytical methods of the current study, standards (calibrators) consisting of synthetic hepcidin-25 from different vendors were used. Importantly, synthetic hepcidin-25 has been found non-commutable with native samples in a variety of analytical methods, and has not been recommended for harmonization. 11 Significant discrepancies in hepcidin levels are reported when using synthetic hepcidin-25 from different vendors, and it has been suggested that struggles in accurate value assignments of the standards (related to suboptimal materials and protocols) may cause inter-method differences.3,11 Laarakkers et al. discuss that such issues may lead to lower value assignment of the standard than expected and consequently higher hepcidin values when applied to an assay. As addressed by these authors, this may imply that assays measuring the lowest values may provide the most accurate absolute measurements. 3 However, other differences between measuring systems, such as storage conditions of the standards and analyte recovery (e.g. hepcidin losses due to stickiness to plastics or aggregation), as well as the assay specificity, can also affect the measured level.
Although calibration issues may contribute to the method discrepancies of the current study, the concentration-dependent difference more likely represents a specificity issue. The larger discrepancy at higher concentrations may be due to the different isoform specificities of the assays. IA, unlike LC-MS/MS, also co-measures smaller isoforms, which are known to increase in conditions with elevated hepcidin concentrations, including infections. 8
In addition to the differences between the analytical methods, we observed substantial variability in hepcidin concentrations between patients, which is in line with previous reports on various patient groups.6,26 The inter-individual variability may be due to heterogeneous patient groups. At admission, factors such as degree of inflammation, duration of symptoms, and comorbidities may contribute to the observed variability. At the follow-up, there were no clinical exclusion criteria, which may explain why some results were substantially higher than the majority. However, excluding the few re-admitted patients at the time of follow-up did not impact the results.
The comparison of serum and plasma showed concentration-dependent dynamics. The admission serum samples were on average 22% lower than plasma. This contrasts the follow-up samples, which were opposite in the far low end. The reasons for the discrepancy cannot be determined from this study design. Prior studies have mostly reported serum and plasma to be interchangeable. Similar to our findings for the admission samples, one study reported human EDTA plasma samples to be higher than serum samples, but the difference was not found in mice samples nor human heparin plasma. 16 The samples we have used may have been more exposed to preanalytical errors than ordinary patient samples due to long-term storage at −80°C and adsorption to plastics that may contribute to variability, especially for low-concentration samples. 27 Still, it may be reasonable to include high-concentration serum and plasma samples as part of a hepcidin method validation as well as assessing possible changes of high-concentration samples over time.
Due to the various analytical methods for hepcidin on the market and the current lack of standardization, 14 interpreting trends from this study on a higher level is more valuable than considering the numerical differences. The chosen LC-MS/MS method has the advantage of being validated for clinical use, but it does not identify the different hepcidin isoforms, which could have contributed to elucidate the differences. The comparative IA method required careful optimization to encounter a wide concentration range, but is still not optimal for the lowest samples. As described in the supplementary, the IA method was based on commercial reagents, but the protocol was modified and optimized to our laboratory. Importantly, it is not validated for clinical use. The degree of hepcidin protein-binding and its impact on biological activity and assay performance is uncertain, 28 and may thus impact the measurement of hepcidin differently among various analytical methods. How infection affects protein-binding of hepcidin is also unknown. It has been shown that smaller isoforms may be formed ex vivo in plasma, but despite a parallel decrease of hepcidin-25 and an increase of smaller isoforms, the total hepcidin concentration decreased, diminishing the actual difference between hepcidin-25 and total hepcidin measurements. 3 In the present study, the samples were initially kept on ice, and refrigerated centrifugation was performed within an hour. As the LC-MS/MS method only measures hepcidin-25, it would likely be more affected by conversion to smaller isoforms than the IA method, which recognizes all isoforms. However, the samples used for the LC-MS/MS method were only through one freeze-thaw cycle, and the internal standard was added early in the process to account for potential losses during the analytical procedure.
We argue that attention should be paid to the optimization of analytical hepcidin methods for a wide range of concentrations, as patients with inflammatory conditions show many-fold increases in hepcidin concentrations. The observed discrepancy for high-concentration samples could in theory also apply to other infectious or inflammatory conditions involving large groups of patients. Further studies are needed to determine whether the analytical method differences observed in the high-concentration samples are directly related to the infection or would apply to any high concentration.
Moreover, we advocate that high-concentration and infection-related samples should be considered in method validations, design and interpretation of external quality assessment programs, and further harmonization and standardization efforts. Studies including samples with high concentrations are needed to assess whether standardization is possible for a full range of clinically relevant samples or if hepcidin-25 and total hepcidin should be considered as two separate markers. Selective measurement of the biologically active hepcidin-25 is in theory preferable, but data on how this distinction affects clinical decisions are lacking. 1 Excluding total hepcidin measurements, and thus most IA methods, is not desirable considering practical and economical aspects. Moreover, despite absolute differences between IA and LC-MS/MS measurements, classification into low, intermediate, and high groups has been found satisfactory. 29
Keeping in mind that a promising clinical application for the hepcidin analysis involves anaemia of inflammation, 30 our finding of a pronounced, concentration-dependent analytical difference in patients with an acute infection should be considered when recommendations for hepcidin measurements are developed for clinical applications. Until then, awareness of this discrepancy is important to avoid misinterpretation of hepcidin measurements in clinical care.
Conclusion
Hepcidin measurements by IA were higher compared with LC-MS/MS, with larger relative differences for samples with higher concentrations during acute-phase pneumonia. This analytical discrepancy should be considered in method validations as well as in further harmonization and standardization efforts.
Supplemental Material
Supplemental Material - Hepcidin analysis in pneumonia: comparison of immunoassay and LC-MS/MS
Supplemental Material for Hepcidin analysis in pneumonia: comparison of immunoassay and LC-MS/MS by Kjersti Oppen, Cato Brede, Øyvind Skadberg, Trude Steinsvik, Jan Cato Holter, Annika E Michelsen and Lars Heggelund in Annals of Clinical Biochemistry
Footnotes
Acknowledgements
We thank Jon Michael Gran, associate professor at Oslo Centre for Biostatistics and Epidemiology (OCBE), University of Oslo, for guidance in the use of statistical analysis.
Declaration of conflicting interests
The author(s) declared no potential conflicts of interest with respect to the research, authorship, and/or publication of this article.
Funding
The author(s) disclosed receipt of the following financial support for the research, authorship, and/or publication of this article: The work was supported by Vestre Viken Hospital Trust, Norway.
Ethical approval
The study was approved by Regional Committees for Medical and Health Research Ethics South East Norway (reference no. S-06266a).
Guarantor
KO.
Contributorship
LH and JCH were central in the design and realization of the study cohort. KO, LH, ØS, and AEM conceptualized and designed the current study. CB and AEM performed the laboratory analyses. KO wrote the first draft and performed the statistical analyses. All authors contributed substantially to data interpretation, critically revised the draft for intellectual content, and approved the final version.
Data availability
Requests for access to data can be directed to the corresponding author.
Supplemental material
Supplemental material for this article is available online.
References
Supplementary Material
Please find the following supplemental material available below.
For Open Access articles published under a Creative Commons License, all supplemental material carries the same license as the article it is associated with.
For non-Open Access articles published, all supplemental material carries a non-exclusive license, and permission requests for re-use of supplemental material or any part of supplemental material shall be sent directly to the copyright owner as specified in the copyright notice associated with the article.