
Abstract
Background
The measurement of androgens in many laboratories is often limited to testosterone. To more accurately determine the androgen status in both sexes, the measurement of other androgens such as dihydrotestosterone, the more potent metabolite of testosterone, and androstenendione and dehydroepiandrosterone, the most abundant circulating androgens in women would be informative. We report a combined liquid chromatography tandem mass spectrometry method for the measurement of these androgens.
Methods
Internal standards in methanol (10 µL) were added to 100 µL serum followed by the addition of zinc sulphate (100 µL). After mixing, 100 µL of acetonitrile was added and was further mixed. The samples were centrifuged and the steroids extracted using an automated online solid phase extraction on a C18 cartridge by a Waters Acquity with online sample manager coupled to a TQS mass spectrometer.
Results
Separation of the androgens was achieved by liquid chromatography. The run time was 6.5 min per sample. The lower limit of quantitation was 0.1 nmol/L for testosterone, androstenedione and dihydrotestosterone and 1 nmol/L for dehydroepiandrosterone. The coefficient of variation of the assay in serum for testosterone was <6%, androstenedione <8% and dihydrotestosterone and dehydroepiandrosterone <10%.
Discussion
We have developed a rapid assay for the liquid chromatography tandem mass spectrometry measurement of testosterone, androstenedione, dihydrotestosterone and dehydroepiandrosterone in a routine clinical laboratory. The assay requires a small volume of serum, and all analytes are measured simultaneously. The assay is rapid and simple to execute offering the potential for routine clinical application.
Introduction
When considering the androgen status of a patient, often testosterone only is requested as the analysis is readily available in many laboratories and the clinical application has been well accepted. However, recent research has identified a role for other steroids in the pathogenesis of certain disorders. Examples of this include androstenedione or dihydrotestosterone (DHT) in polycystic ovarian syndrome (PCOS).1,2 DHT has been reported to be useful in evaluating males patients receiving 5 alpha-reductase inhibitor therapy 3 and patients with possible 5 alpha-reductase deficiency. 4 Low DHT concentrations have also been correlated with increased risk of frailty, diabetes and cardiovascular disease 5 as well as cognitive decline, 6 while higher concentrations have been associated with a reduction in the incidence of strokes in older men. 7 Raised dehydroepiandrosterone (DHEA), which despite having low androgenic potency is a pro-hormone for testosterone, has been reported to be related to symptoms of hyperandrogenism in females when raised.8,9 The sulphotransferase enzyme, which is responsible for the production of the sulfated metabolite of DHEA, dehydroepiandrosterone sulfate (DHEAS), has been shown to have altered activity during the course of a menstrual cycle. 10 Also altered activity of this enzyme has been proposed as a potential mechanism for hyperandrogenaemia in PCOS, 11 thus suggesting that the traditional measurement of DHEAS may be misleading. Therefore, the availability of a panel including these four analytes can prove to be of clinical utility in both male and female patients.
Historically, assays for androgen measurement involved separate immunoassays for each analyte. Immunoassays for testosterone have been automated for a considerable time, whereas the other androgen analyses are not available on main platforms, and are often time-consuming manual techniques that require large sample volumes. Liquid chromatography tandem mass spectrometry (LC-MS/MS) enables the simultaneous measurement of multiple analytes with the same volume of sample. Although LC-MS/MS methods exist for each of these analytes, they often involve lengthy sample preparation or derivitization techniques and/or large serum volumes.12–16
We have developed a method for the simultaneous measurement of testosterone, androstenedione, DHT and DHEA. The reported method uses a small sample volume and simple protein precipitation for sample preparation coupled with a novel online solid phase extraction technique. This assay may be used to underpin the clinical investigation of androgen status of both male and female patients with sex hormone deficiency or excess.
Materials and methods
Sample preparation
Stock solutions were prepared by dissolving DHT (Sigma, Poole, UK) in LC-MS grade methanol (Fluka, Poole, UK) and were stored at −20℃ for up to six months. Separate stock solutions were prepared for calibrators and quality controls (QCs). Methanolic solutions of testosterone and androstenedione were purchased from Sigma (Cerilliant reference solutions, Poole, UK). Initially DHEA was purchased as a CertiMass reference solution (Isosciences, King of Prussia, USA), but subsequently a Cerilliant reference solution was sourced (Sigma, Poole, UK). A separate vial of each was used for calibrators and QCs. Working calibrators were prepared by diluting the stock solution with phosphate-buffered saline (PBS) pH 7.4 (Sigma, Poole, UK) containing 0.1% (weight/volume; w/v) bovine serum albumin (BSA, Sigma, Poole, UK) to give concentrations of 0–50 nmol/L for testosterone, androstenedione and DHEA and 0–5 nmol/L for DHT. Two sets of QC material were used for the evaluation period. The first was prepared by diluting the stock solution with PBS pH 7.4 (Sigma, Poole, UK) containing 0.1% (w/v) BSA (Sigma, Poole, UK) to give concentrations of 0.7, 2.5, 10 and 30 nmol/L for testosterone and androstenedione, 2.5, 10 and 30 nmol/L for DHEA and 0.5, 1, 2 and 4 nmol/L for DHT. The second set were serum samples with concentrations of 0.6, 1.1, 5.0 and 14 nmol/L for testosterone, 1.5, 2.8 and 4.0 nmol/L for androstenedione, 0.2, 0.6 and 1.5 for DHT and 2.9, 6.2 and 24.0 nmol/L for DHEA and were used to assess imprecision in matrixed samples. Aliquots (300 μL) of these samples were stored at −30℃ for up to six months. Deuterated testosterone-d2 (−1, 2, 98% purity, QMX, Thaxted, UK), deuterated androstenedione-d7 (−2, 2, 4, 6, 6, 16, 16, 98% purity, QMX, Thaxted, UK), deuterated DHEA-d2 (−16, 16, 97% purity, QMX, Thaxted, UK) and DHT-d3 (−16, 16, 17, 99% purity, Sigma, Poole UK) were used as internal standards at a working concentration of 30 nmol/L for testosterone-d2, 20 nmol/L for androstenedione-d7, 125 nmol/L DHEA-d2 and 45 nmol/L for DHT-d3 in LC-MS grade methanol.
Standard, QC or sample (100 μL) was manually pipetted into a well of a 2 mL 96-well plate (Porvair, Leatherhead, UK). To this, 10 μL of working internal standard and 100 μL 50 g/L zinc sulphate (BDH, Bristol, UK) in distilled water were added. After a 10 s vortex, 100 μL of acetonitrile (LC-MS grade, Fluka, Poole UK) was added. After vortexing for 1 min, the plate was centrifuged for 10 min at 2254 g. Following centrifugation, the plate was transferred directly to the autosampler for analysis; 75 μL of supernatant was injected into the Acquity ultrahigh pressure liquid chromatography (UPLC) and online solid phase extraction system (OSM) system (Waters, Manchester, UK) using partial loop mode.
Chromatography and solid phase extraction
The mobile phases utilized were A; distilled water with 0.05% formic acid (BDH, Bristol, UK) and B; LC-MS grade methanol containing 0.05% formic acid (BDH, Bristol, UK). MassTrak C18 10 μm cartridges were used for online sample extraction (Waters, Manchester, UK). The cartridges were conditioned with 0.5 mL of LC-MS grade methanol then equilibrated with 0.5 mL of distilled water. The sample (75 μL) was loaded onto the cartridge using 0.5 mL of distilled water. The cartridge was washed with 0.25 mL of 30% (volume/volume; v/v) LC-MS grade methanol. Mobile phase was then passed through the cartridge for 0.5 min to facilitate elution on to the analytical column. The analytical column used was a 2.1 × 50 mm 1.8 μm Waters Acquity UPLC HSS C18 SB column coupled to an in-line filter (Waters, Manchester, UK). The androgens were eluted from the cartridge and analytical column by an increasing gradient of 50–70% B over 3 min at a flow rate of 0.45 mL/min. After 3 min, the composition was stepped up to 99% B for 1 min with a flow rate of 0.6 mL/min before returning to starting conditions for 1.5 min. Both guard and analytical columns were maintained at 50℃.
Mass spectrometry
The eluate was injected from the LC directly into a XEVO TQS™ tandem mass spectrometer (Waters, Manchester, UK). MassLynx NT 4.1 software was used for system control and the MassLynx TargetLynx program allowed data processing. This software used the height of the detected peaks, 1/× weighting and linear least squares regression to produce a standard curve. The 1/× weighting gives greater accuracy at lower concentrations. The mass spectrometer was operated in electrospray positive mode, the capillary was maintained at 2.4 kV and the source temperature was 150℃. The desolvation temperature and gas flow were 600℃ and 800 L/h, respectively. The source offset was maintained at 40 V. The quantifier and qualifier transitions identified were m/z 289.3 > 109.2 and 289.3 > 97.2 for testosterone, 287.3 > 109.2 and 287.3 > 97.2 for androstenedione, m/z 291.1 > 255.2 and 291.1 > 159.1 for DHT and m/z 271.2 > 213.2 and 271.2 > 253.2 for DHEA, respectively. The internal standards had transitions of m/z 291.3 > 111.2 for testosterone-d2, m/z 294.3 > 113.2 for androstenedione-d7, m/z 294.2 > 258.2 for DHT-d3 and m/z 273.3 > 213.2 for DHEA-d2. Transitions were monitored in multiple reaction monitoring (MRM) mode, with a dwell time of 0.025 s.
Validation
The assay was validated against published acceptance criteria for linearity, precision, recovery and sample stability. 17
I on suppression
To investigate ion suppression, we infused the working internal standard solution at 5 μL/min directly into the mass spectrometer to give a constant background signal. This concentration of DHEA and DHT was chosen as it allowed visualization of the increase in background signal while concentrations in the physiological range did not. Extracted serum samples (n = 6) were injected simultaneously via the autosampler. A reduction in the background signal is observed when ion suppression is occurring, and ion suppression is deemed significant if a reduction in signal of >10% is observed where the compound of interest elutes.
Accuracy
Calibrators were prepared using reference stock solutions where available. To confirm the lack of matrix effects given the use of PBS-based calibrators, the method of standard additions was used. Serum and PBS-based spiked samples were prepared with an acceptability target of within 5% of each other. Unfortunately, no suitable reference materials were available for DHT at the time.
R ecovery
Four different concentrations of androgens (0, 5, 10 and 20 nmol/L for testosterone, androstenedione and DHEA and 0, 0.75, 1.5 and 3 nmol/L for DHT) were spiked into six different serum samples. The recovery was calculated from measured compared with expected concentrations, and absolute ion counts were compared for any variances between matrices.
Imprecision
Imprecision of the method was assessed against a range of concentrations using PBS-based and serum-based QC samples. These samples were analysed daily for 10 days to calculate inter-assay imprecision. To determine intra-assay imprecision, the same samples were analysed 10 times within one batch. Further serum samples with lower concentrations were also analysed for intra-assay imprecision. Percentage deviation was calculated from the difference between mean observed and nominal concentrations to assess bias for the PBS based calibrators. The observed imprecision was compared between PBS and serum-based calibrators to further confirm the lack of matrix effects in the assay.
L inearity
To evaluate linearity of the calibration curves, three curves were prepared and analysed in separate batches. The ratios of analyte peak height to internal standard peak height were plotted against androgen concentration in nmol/L. Calibration curves were judged linear if the correlation coefficient (R2) was better than 0.9900 as calculated by weighted linear regression. Serial dilutions using PBS containing 0.1% (w/v) BSA were performed on six serum samples within the linear range. The measured concentration of the dilutions was compared with the expected concentrations to confirm that high concentrations can be diluted if necessary.
Limit of quantitation
The lower limit of quantitation (LLOQ) was defined as the lowest concentration for which 10 replicates of PBS based samples prepared with low concentrations of androgens gave a CV and deviation from expected concentration of less than 20%.
S pecificity
Solutions of various related steroids, both natural and synthetic, were prepared in 50% (v/v) methanol/water and injected directly into the mass spectrometer via the autosampler, without internal standard. Steroids tested to a final concentration of 1000 nmol/L were testosterone, dehydroepiandrosterone sulphate, dehydroepiandrosterone, cortisol, progesterone, aldosterone, cortisone, corticosterone, budesonide, 17 hydroxyprogesterone, 11 deoxycortisol, 21 deoxycortisol, pregnenolone, epitestosterone, DHT and androstenedione. Others tested to 1 mg/L were fludrocortisone, dexamethasone, methylprednisolone, prednisone, beclometasone, fluocinolone, cyproterone, ethinyl oestradiol, norethisterone, triamcinolone and prednisolone.This excess concentration was chosen to allow easy identification of any potentially interfering peaks. The retention times of any compounds found to give a signal in the specific channels for the androgens or their internal standards were subsequently assessed to determine if they would cause interference.
S tability
We investigated the stability of the detector by injecting a sample extract repeatedly over 20 h. Data were examined for changes in peak height or response. A change within 15% was deemed acceptable. We investigated the stability of androgens after sample preparation. Serum samples (n = 72) were prepared in duplicate. One plate was analysed immediately, while the second plate was stored at 4℃ for 24 h before analysis. This plate was re-centrifuged prior to loading on the autosampler. The results of the duplicates were compared using a paired sample t-test to determine if a significant difference was apparent.
C omparative assays
Serum samples (n = 101 for testosterone and n = 83 for androstenedione) were analysed by this method and compared with a routinely used LC-MS/MS method for testosterone and androstenedione. 15 A further comparison was performed against an established LC-MS/MS assay for DHEA (n = 55). 16
Serum samples (n = 91) from adult males were also analysed by this method for DHT and compared with an established gas chromatography tandem mass spectrometry (GC-MS) assay. These samples were collected and analysed according to the European Male Ageing Study (EMAS) protocol.18,19
S tatistical analysis
All statistical analyses were performed using Analyse-it software (Analyse-it Software Ltd, Leeds, UK).
Results
The retention times were 1.96, 2.23, 2.33 and 2.72 min for androstenedione, testosterone, DHEA and DHT, respectively. A typical chromatogram is shown (Figure 1) and demonstrates the importance of adequate separation between steroids, particularly for DHT. The isotopic internal standards all co-eluted within 0.02 min of their respective androgen. The testosterone and androstenedione internal standards were chosen as they have previously been shown to give good results in the routine assay.15,20 The use of DHEA-d2 may not be ideal, but we have previously shown that good results can be achieved using a d2 internal standard for a steroid if careful attention is paid to the concentration used.
21
This assay gave good agreement with an alternative assay utilizing a DHEA-d6 internal standard.
16
There was no significant suppression of ionization in the region of the chromatogram where any of the androgens or their internal standards elute. The mean recoveries following the addition of androgens to six serum samples was 98% (range 86–103%) for testosterone, 101% (range 96–113%) for androstenedione, 91% (range 83–107%) for DHT and 94% for DHEA (range 82–112%).
A typical chromatogram of a serum sample with concentrations of 0.86 nmol/L testosterone, 3.80 nmol/L androstenedione, 13.2 nmol/L DHEA and 0.15 nmol/L DHT. Interferences may be observed at an earlier retention time than DHT due to testosterone and DHEA. Also DHEA-sulphate may be observed at an earlier retention time in the DHEA transition.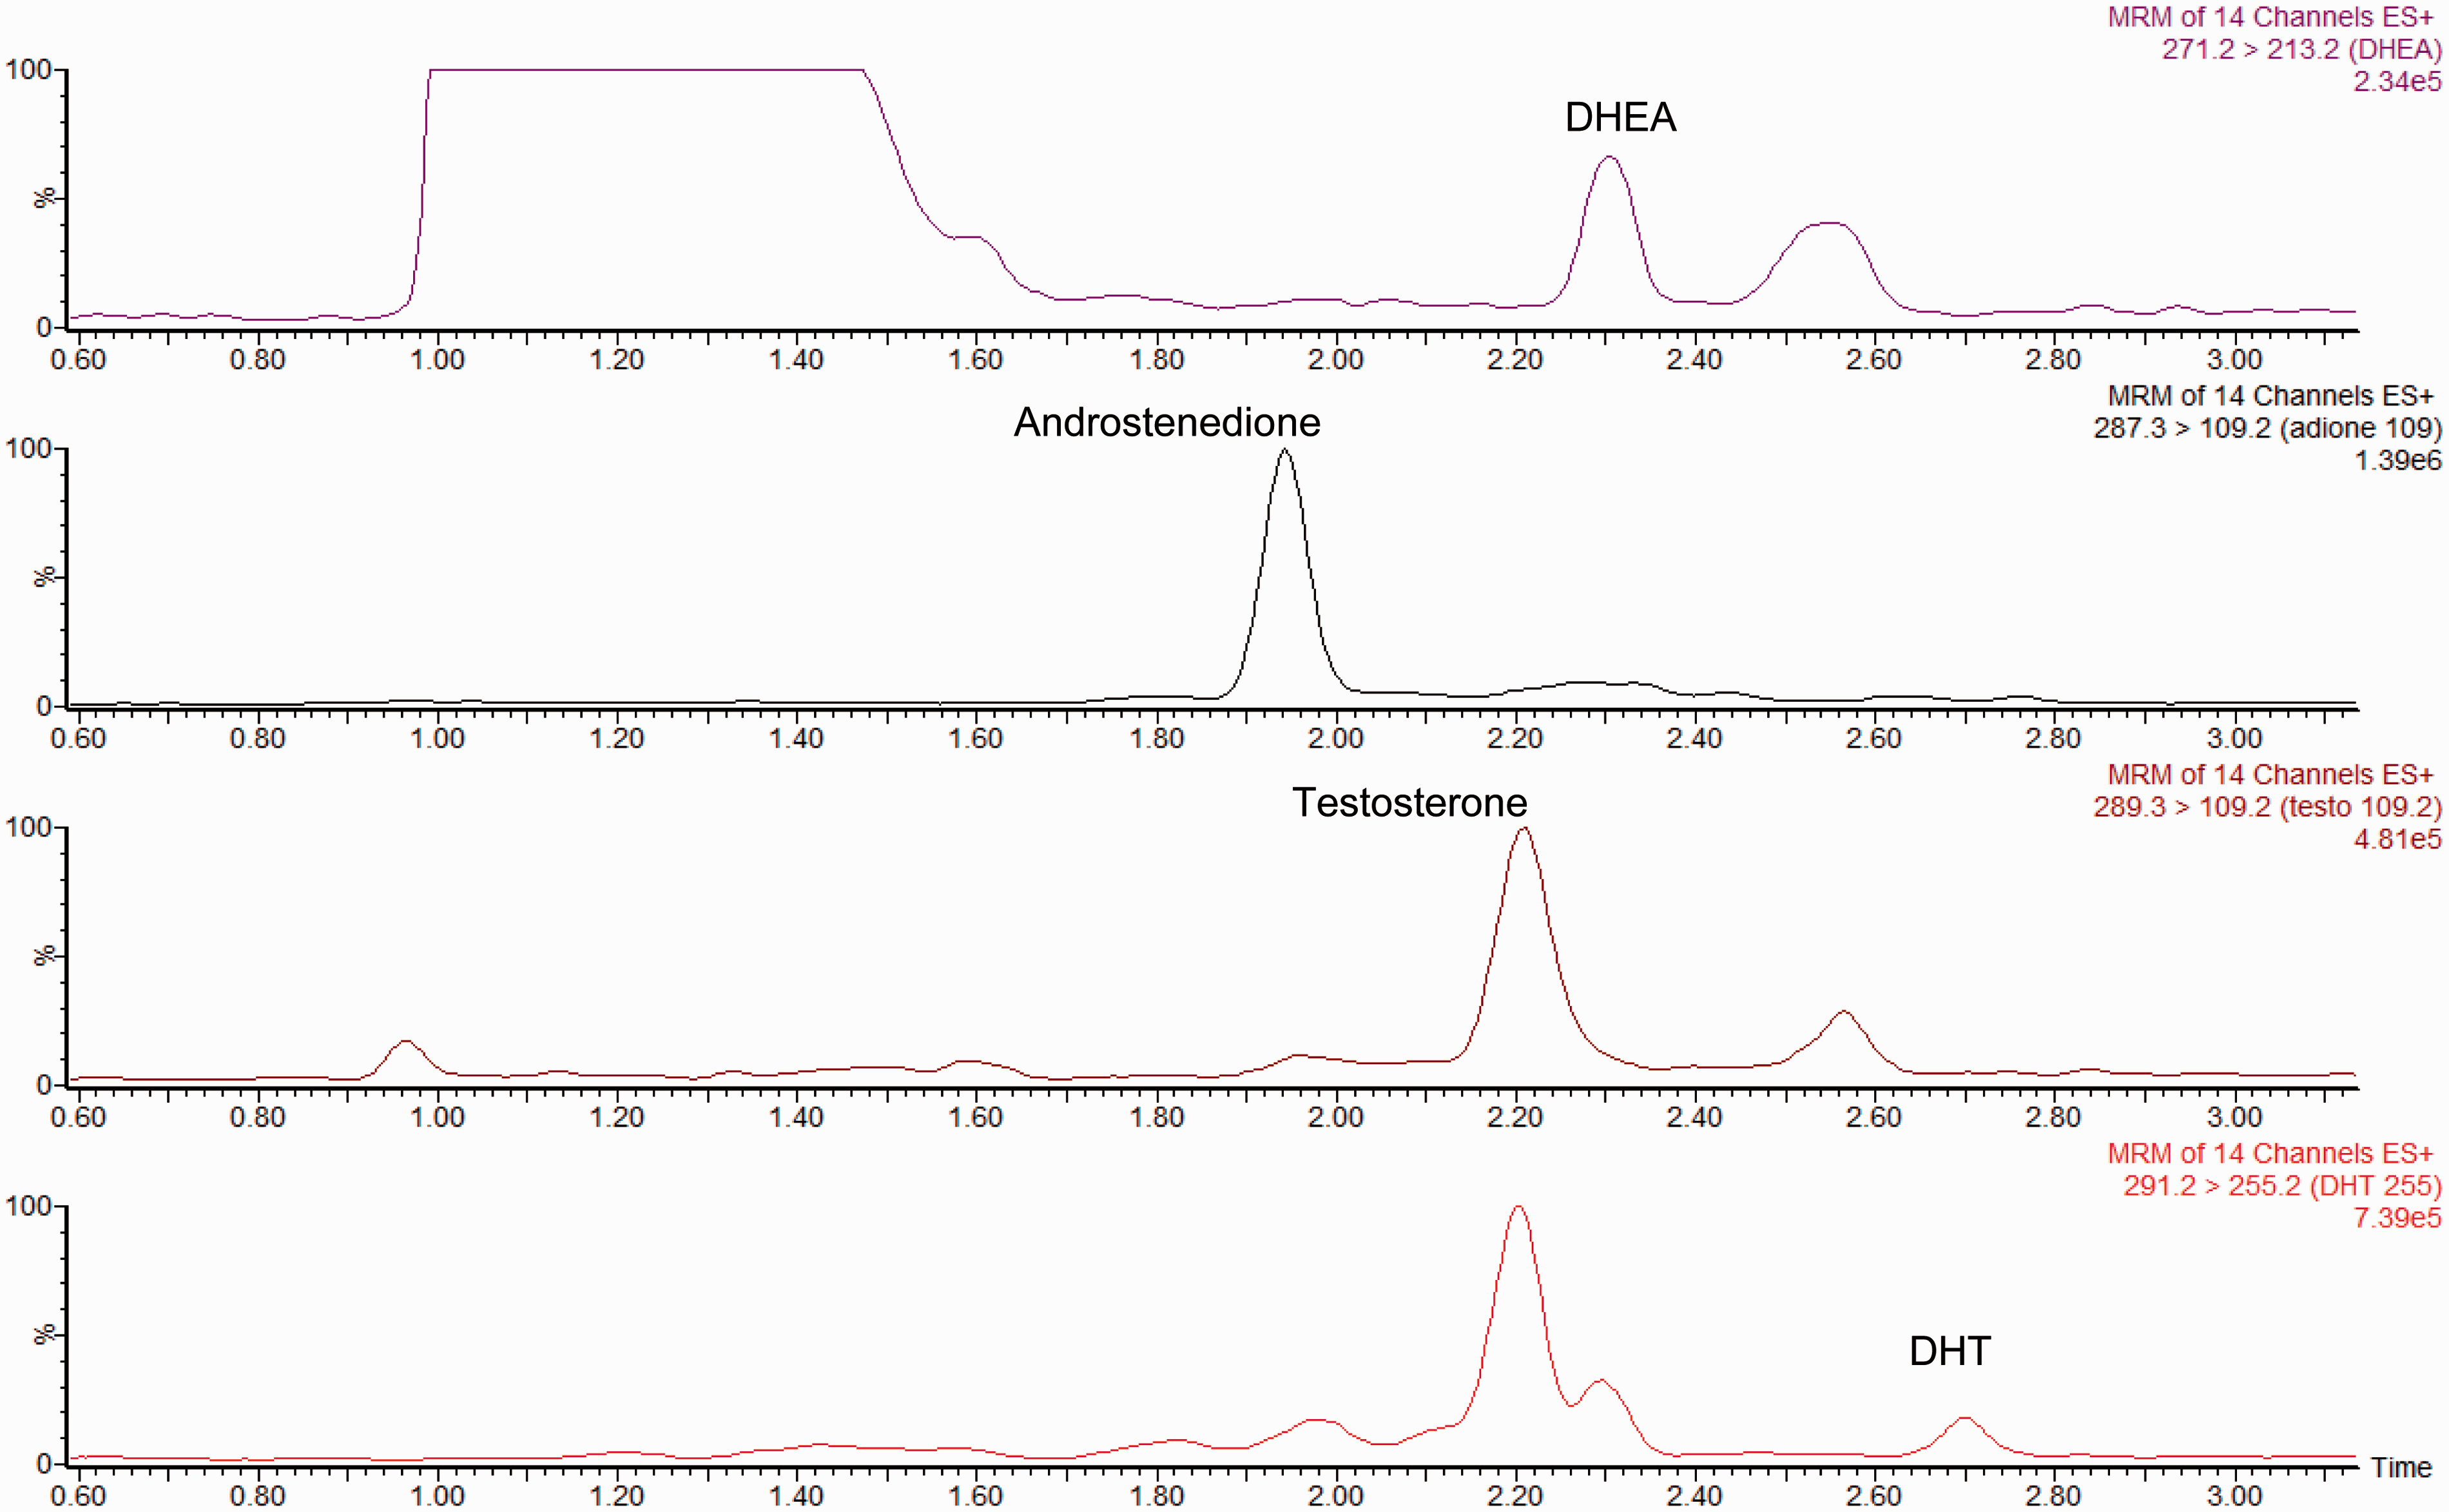
The results of the imprecision studies in prepared PBS-based quality control samples.
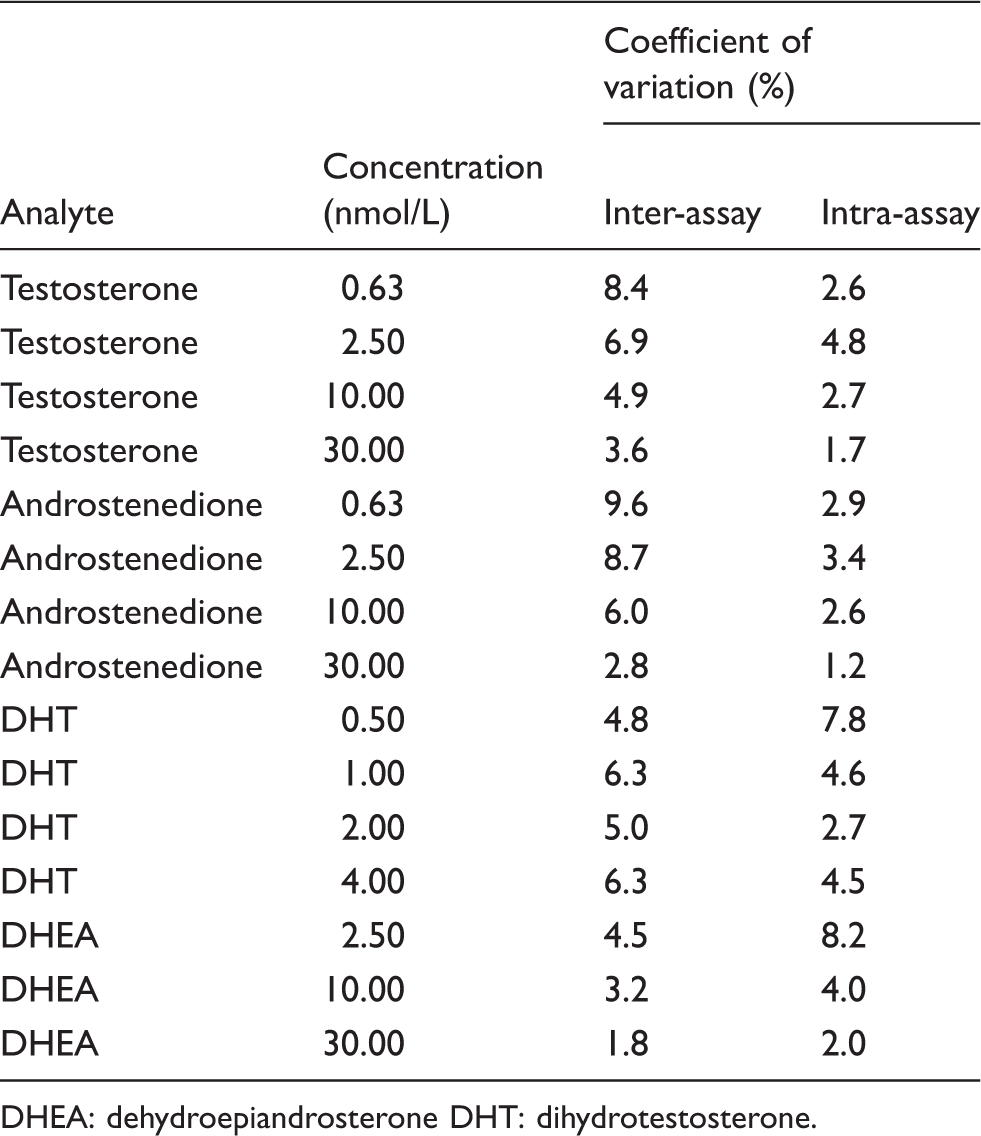
DHEA: dehydroepiandrosterone DHT: dihydrotestosterone.
The results of the imprecision studies in the serum-based quality control samples.
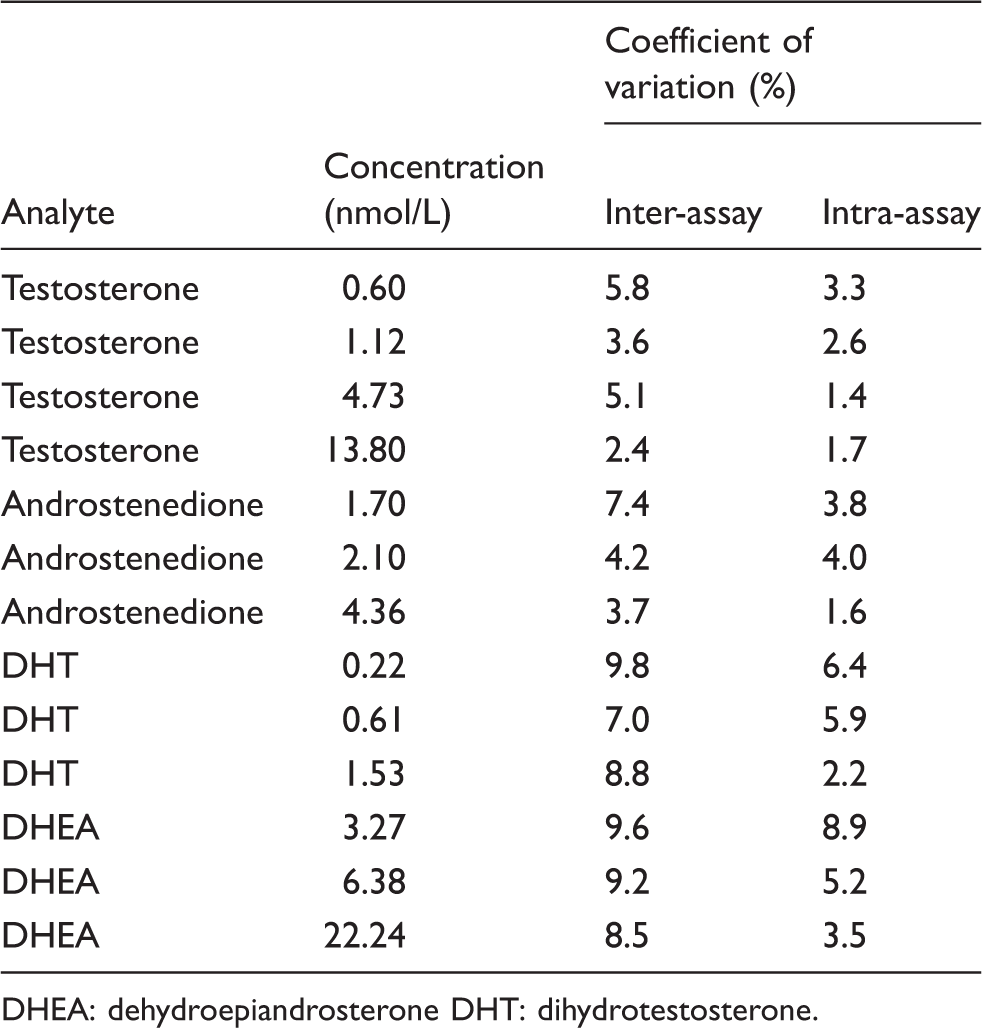
DHEA: dehydroepiandrosterone DHT: dihydrotestosterone.
Standard curves were made by plotting androgen concentrations on the x-axis and androgen/internal standard peak height ratios on the y-axis. The curve was linear over the standard range and was reproducible between batches. The curves showed good correlation with the assigned standard values with an R2 value of 0.99. The method of standard additions showed that the PBS containing 0.1% (w/v) BSA and serum spiked with the androgens were within the 5% target for each.
The LLOQ were 0.1 nmol/L for testosterone, androstenedione and DHT and 1 nmol/L for DHEA. None of the steroids tested to check for interference, endogenous or exogenous, gave a response above the LLOQ at the retention time for either compound or their internal standards.
A method comparison of serum samples analysed by this assay and an established in-house LC-MS/MS assay for testosterone and androstenedione gave Bland–Altman bias plots shown in Figure 2(a) and (b), respectively. The mean bias for testosterone was 0.26 nmol/L (95% CI 0.12–0.40 nmol/L). Passing–Bablock analysis for testosterone gave an equation of: existing assay = 1.02 × new assay + 0.03 nmol/L. The mean bias for androstenedione was 0.01 nmol/L (95% CI − 0.10–0.13 nmol/L). Passing–Bablock analysis for androstenedione gave an equation of: existing assay = 0.98 × new assay + 0.06 nmol/L. The Pearson correlation r value was 1.0 and 0.99 for testosterone and androstenedione, respectively. External quality assurance (EQA) samples formed part of this comparison (n = 5 for each). Results were comparable to those obtained by other LC-MS/MS users.
Bland–Altman plots comparing the new assay with the in-house LC-MS/MS assays for testosterone (a) and androstenedione (b).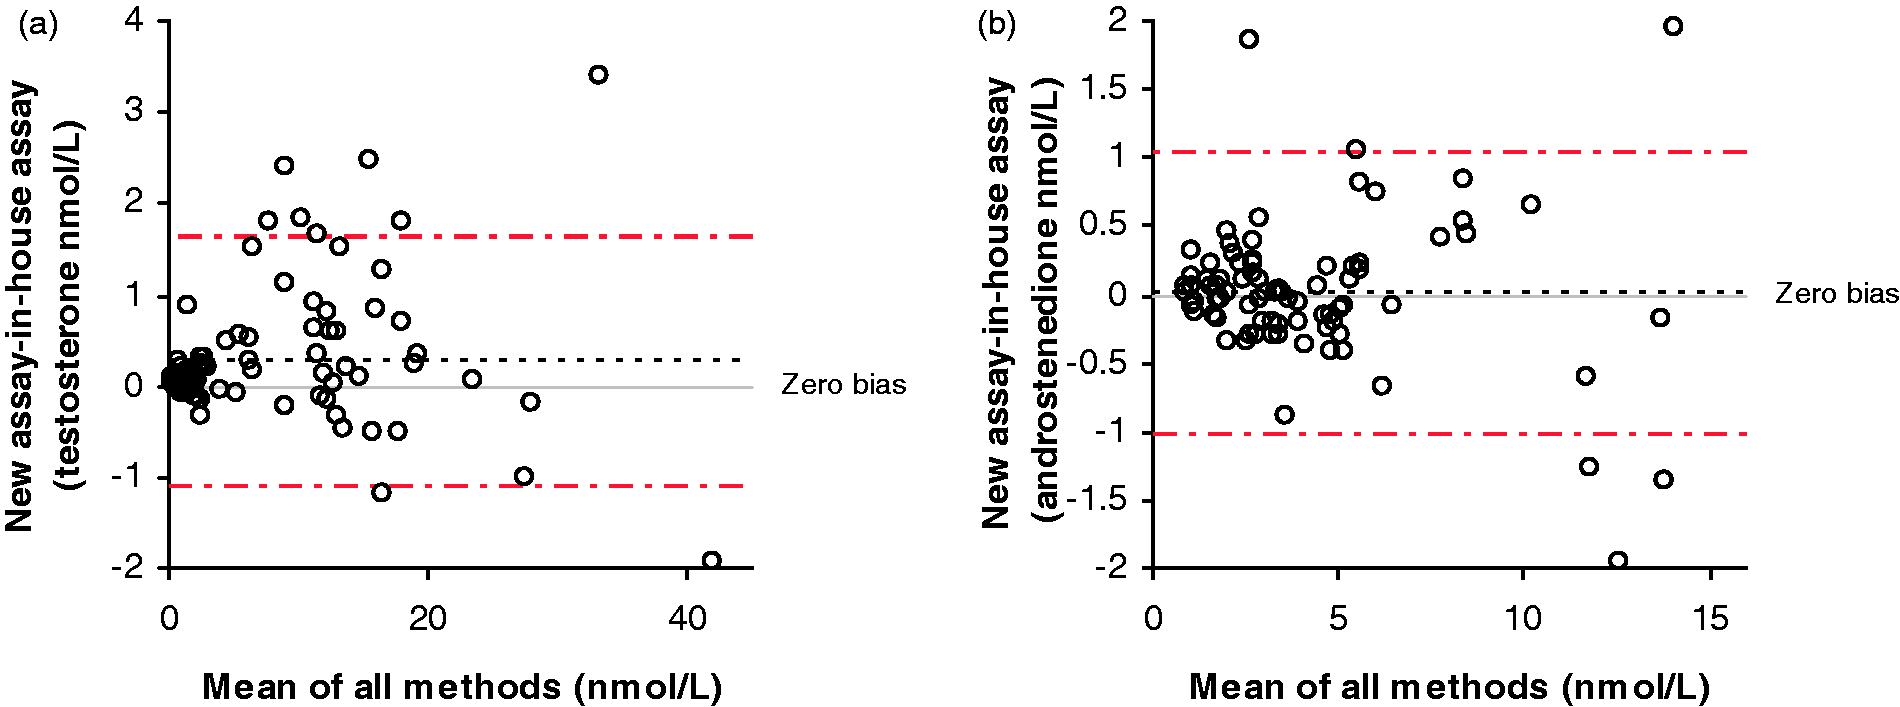
A method comparison of serum samples analysed by this assay, and an established LC-MS/MS assay for DHEA was also performed. The initial comparison using the CertiMass reference standard (Figure 3(a)) to prepare the calibrators gave a mean bias of 5.2 nmol/L (95% CI 3.9–6.5 nmol/L). Passing–Bablock analysis for DHEA gave an equation of: existing assay = 1.43 × new assay + 0.28 nmol/L. The Pearson correlation r value was 1.0. Due to this observed difference, the calibration of this assay was investigated. A new vial of CertiMass reference standard was compared with the existing calibration and this gave consistent results. The CertiMass reference solution was then compared with the Cerilliant reference standard and a discrepancy was found. New calibrators were prepared using the Cerilliant reference standard (which was also in use in the comparator’s assay) and the analysis was repeated (Figure 3(b)). The new comparison using the Cerilliant reference standard gave a mean bias of 0.6 nmol/L (95% CI 0.4–0.9 pmol/L). The Passing–Bablock analysis gave an equation of: existing assay = 1.04 × new assay + 0.20 nmol/L. The Pearson correlation r value was also 1.0.
Bland–Altman plots comparing the new assay with an established LC-MS/MS assay for DHEA. (a) The comparison when CertiMass reference solution was used for the calibration. (b) When Cerilliant reference solution is used for the calibration.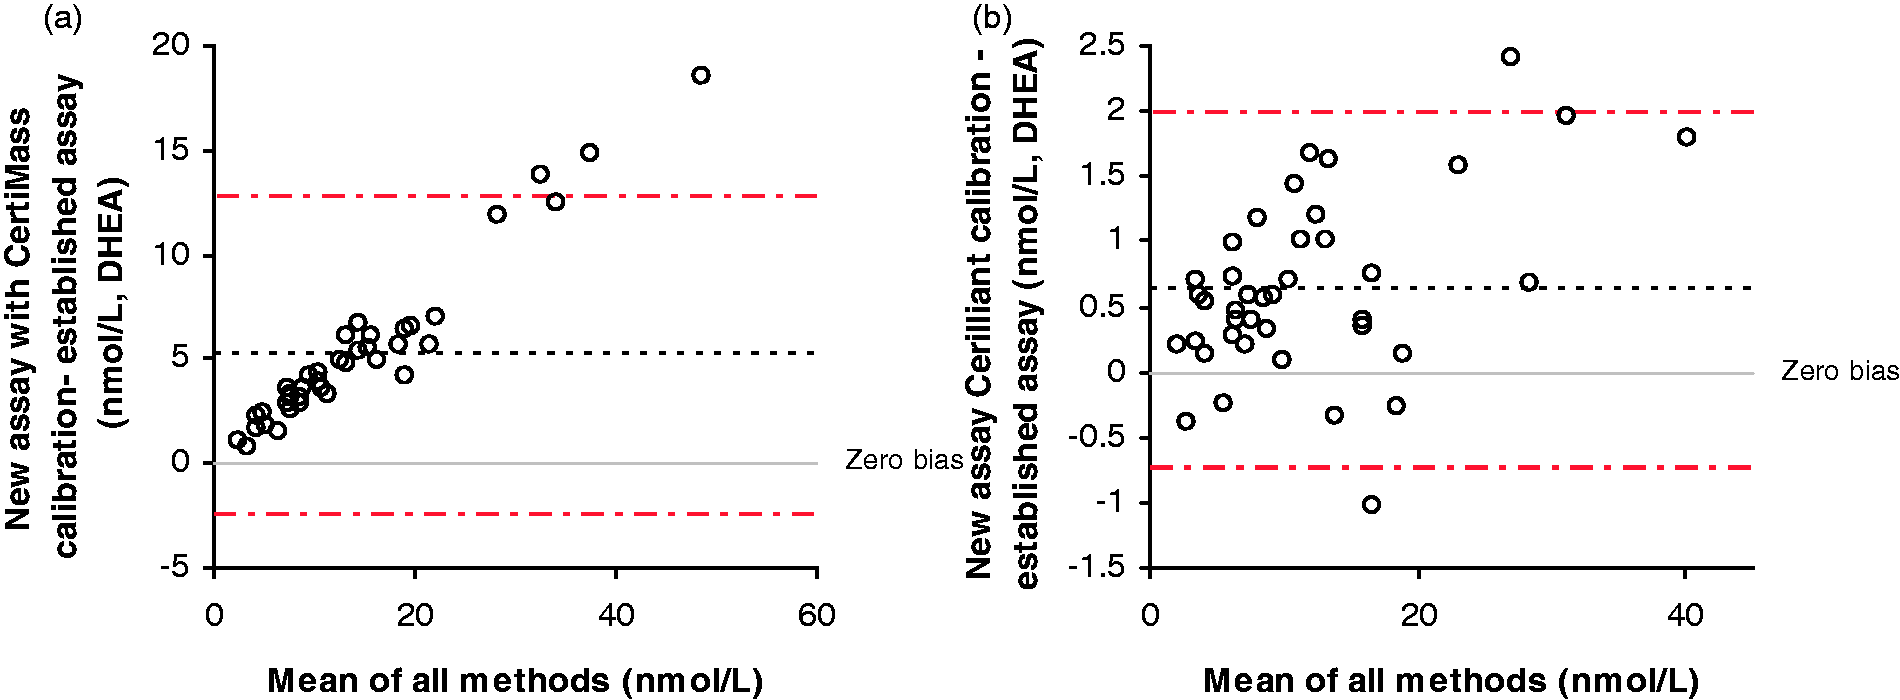
Samples that were analysed by an established GC-MS assay for DHT gave a mean bias of 0.49 nmol/L (95% confidence interval of 0.39–0.60 nmol/L). The Passing–Bablock analysis gave an equation of: existing assay = 1.25 × new assay + 0.06 nmol/L.
Discussion
We have developed an assay for testosterone, androstenedione, DHEA and DHT that has a novel and simple sample preparation. The use of online sample preparation allows a simple protein precipitation sample preparation step as further sample clean up is achieved by the C18 online SPE. Previously reported assays for DHEA and DHT have utilized manual sample clean-up to maintain the sensitivity required for these steroids. This is not necessary in this assay as a large volume (75 μL) of extract can be loaded onto the cartridges without any deterioration in peak shape such as fronting or splitting which are typical observations of overloaded columns. The assay displays excellent performance characteristics. The run time injection to injection is 6.5 min. This simple sample preparation means a full 96-well plate can be prepared in 30 min. After loading onto the instrument the analysis time for 86 samples is 10.4 h. The sample volume used is small at 100 μL. This gives sufficient extract for two injections if necessary. If sample volume is limited, all volumes may be adjusted pro-rata so that 50 μL of sample can be used with sufficient extract for the 75 μL injection.
Adequate sensitivity for all steroids using these conditions was achieved by using a highly sensitive mass spectrometer (Waters Xevo TQS™). This shows that careful attention to the mobile phase constituents may allow for improvements in sensitivity, even for non-polar compounds such as these. Furthermore, the best sensitivity was achieved for DHEA using m/z 271.2 as the precursor ion, rather than the molecular ion, as this steroid exhibited an in-source water loss under these conditions.
Comparison of the results between this novel assay and an in-house assay for testosterone and androstenedione individually showed very good agreement. The current assay, with manual liquid–liquid extraction (LLE), takes considerably longer time to prepare samples. The LLE process takes approximately 2 h to prepare one full plate compared with 30 min for the initial protein precipitation step used in this assay.
During the method evaluation phase, there was an observed difference in the calibration of this assay and the comparator assay for DHEA. Investigations revealed this to be problems with the primary calibrator despite this being sold as a reference standard. The assay was easily re-calibrated to remedy this and it now gives a good agreement with six other laboratories, 22 thus suggesting that users of reference standards should pay careful attention to the certificate of analysis. It is therefore important that material is sourced from a different supplier for the preparation of QCs, as recommended in ISO 15189, because discrepancies such as these may be identified sooner. It should be noted that this is often difficult for steroid assays as two independent sources of reputable reference solutions of compounds are not always available. The availability of traceable commercial calibrators that are emerging on the market may help with this situation. Although a small difference was obtained between this assay and the DHT GC-MS assay, the difference may also be due to differences in the calibration of these two assays.
We found good agreement between testosterone and androstenedione largely because the column that we chose, Waters Acquity HSS C18 SB, had similar performance characteristics to the Phenomenex Synergi Hydro column that we have routinely used for many years. Both columns give excellent ion suppression profiles, but the new column has a smaller particle size and under UPLC conditions exhibits better peak shape and sensitivity.
In summary, we have developed a rapid method to replace the current in-house assay for testosterone and androstenedione. As well as improving the work flow due to the simplified sample preparation and use of on-line sample extraction, this method will also provide more information on androgen status due to the inclusion of DHT and DHEA. This expanded androgen profiling should improve the investigation of males and females with potential androgen disorders and can be easily integrated into a routine NHS laboratory.
Footnotes
Declaration of conflicting interests
The author(s) declared no potential conflicts of interest with respect to the research, authorship, and/or publication of this article.
Funding
The author(s) received no financial support for the research, authorship, and/or publication of this article.
Ethical approval
Not applicable.
Guarantor
LJO.
Contributorship
The development and validation of the assay described was performed by LJO and BGK. FCW and RMB contributed to the method comparisons. All authors have contributed to the manuscript.