
Abstract
Background
LC-MS/MS is rapidly becoming the technology of choice for measuring steroid hormones. We have developed a rapid LC-MS/MS assay for the routine analysis of serum cortisol. We have used this assay to investigate the effects of gender and exogenous steroid interference on the immunoassay measurement of serum cortisol.
Methods
Zinc sulphate (40 µL) was added to 20 µL of sample. This was vortexed for 10 s followed by the addition of 100 µL of internal standard in methanol. Following mixing and centrifugation, 10 µL of sample was injected into an Acquity LC system coupled to a Quattro Premier tandem mass spectrometer.
Serum samples (n = 149) were analysed by LC-MS/MS and two commercial immunoassays. Results were then compared for all samples and for gender differences. A further set of serum samples (n = 171) was analysed by the LC-MS/MS assay and a GC-MS assay.
Results
Cortisol had a retention time of 0.98 min and the assay had an injection-to-injection time of 2.6 min per sample. Mean recovery was 99% and mean CV was 8%. The immunoassays gave comparisons of: Roche = 1.23 × LC-MS/MS −1.12 nmol/L and Abbott = 0.94 × LC-MS/MS + 11.97. The comparison with GC-MS showed LC-MS/MS = 1.11 × GC-MS – 22.90.
Discussion
We have developed an LC-MS/MS assay for serum cortisol analysis that is suitable for routine clinical use and has been in use in our laboratory for 12 months. The availability of this assay will give more reliable results in patients receiving exogenous steroid therapy.
Keywords
Introduction
Liquid chromatography tandem mass spectrometry (LC-MS/MS) is increasingly becoming the method of choice for steroid hormone measurements due to the poor specificity of immunoassays. Serum cortisol immunoassays are particularly susceptible to interferences due to exogenous steroids since these are structurally similar to cortisol and are widely used therapies for many disorders. UK NEQAS data show that a wide range of concentrations can be obtained by immunoassays when measuring a sample. Bimodal distributions can also be observed in some female samples, which suggest that binding proteins may influence the measurement of cortisol by these assays.
Due to their structural similarities, exogenous steroids may also present a challenge for mass spectrometry-based assays. Prednisolone, in particular, has been reported to cause interferences in both immunoassays and LC-MS/MS assays, 1 and long LC runs have been used to circumvent this, resulting in assays not suitable for routine clinical use.
We developed a rapid LC-MS/MS assay for serum cortisol for routine use and share our experiences over 12 months in a large teaching hospital which provides clinical services in respiratory and transplant medicine and therefore has a large population of patients on exogenous steroids. We also investigated the effects of gender on the measurement of cortisol.
Materials and methods
Sample preparation
Stock solutions were prepared by dissolving hydrocortisone (Sigma, Poole, UK) in methanol (Sigma, Poole, UK) and were stored at −20℃ for up to six months. Separate stock solutions were prepared for standards and quality control samples (QCs), both 10 mg/mL. Working standards and weighed-in QCs were prepared by diluting the stock solution with phosphate buffered saline (PBS) pH 7.4 (Sigma, Poole, UK) containing 0.1% (w/v) bovine serum albumin (BSA, Sigma, Poole, UK) to give concentrations of 0–2000 nmol/L and 100, 400 and 800 nmol/L. Aliquots (200 µL) of these were stored at −30℃ for up to 6 months. In addition, commercial QCs were used (Lyphochecks, BioRad, Hemel Hempstead, UK) according to the manufacturers’ instructions. Deuterated cortisol-9, 11, 12, 12 (D4) was used as an internal standard (CDN Isotopes, Quebec, Canada) at a working concentration of 0.1 mg/L (276 nmol/L) in methanol.
Standard or QC sample (20 µL) was manually pipetted directly into the well of a 96-deep well block (Thermo, Hemel Hempstead, UK). To this, 40 µL of 0.1 mol/L zinc sulphate was added. This was vortexed for 10 s followed by the addition of 100 µL of internal standard. The block was heat-sealed (Thermo, Hemel Hempstead, UK) and vortexed for 1 min, then centrifuged at 8000 g for 5 min. Following centrifugation, the plate was transferred directly to the autosampler for analysis; 10 µL of sample was injected into the liquid chromatography (LC) system using partial loop mode.
In addition, to investigate a method for the prompt analysis of urgent requests, samples (n = 39) were prepared as described above following the completion of their initial analysis and processed using the calibration curve from the original analysis. The results from the repeat analysis were then compared to the original analysis to identify if this method of adding samples to an existing calibration would provide fast reliable results for urgent samples.
Chromatography
A Waters Acquity UPLC liquid chromatograph (Waters, Manchester, UK) was used for chromatography. The mobile phases utilized were: (A) distilled water with 2 mmol/L ammonium acetate (Sigma, Poole, UK) and 0.1% formic acid (VWR International Ltd, Leicestershire, UK) and (B) methanol (LC-MS grade, Sigma, Poole, UK) with 2 mmol/L ammonium acetate and 0.1% formic acid. The sample was injected onto a Phenomenex C8 4 × 2 mm guard cartridge (Phenomenex, Macclesfield, UK) connected to a Phenomenex 30 × 2.1 mm C8 Kinetex analytical column using 30% mobile phase B at a flow rate of 0.6 mL/min. Cortisol is eluted with a 1 min linear gradient to 50% mobile phase B at 0.6 mL/min. Following this, the mobile phase composition was stepped up to 98% B at a flow rate of 0.6 mL/min. The flow was maintained at 98% B for 0.5 min before returning to 30% B for the final 0.4 min. Both guard and analytical columns were maintained at 50℃.
Mass spectrometry
The eluate was injected from the LC directly into a Quattro Premier™ Tandem mass spectrometer (Waters, Manchester, UK) with a Z spray ion source. MassLynx NT 4.1 software was used for system control and the MassLynx QuanLynx programme allowed data processing. This software used the area of the detected peaks, 1/x weighting and linear least squares regression to produce a standard curve. The 1/x weighting gives greater accuracy at lower concentrations. The mass spectrometer was operated in electrospray positive mode, the capillary was maintained at 0.3 kV and the source temperature was 140℃. The desolvation temperature and gas flow were 380℃ and 800 L/h, respectively. The transitions identified were m/z 363.2> 97.15 and 363.2>121.1 for cortisol and 367.1>97.1 for D4 cortisol. The cone and collision energies were 28 V and 26 eV for cortisol and D4 cortisol, respectively. Transitions were monitored in multiple reaction monitoring (MRM) mode, with a dwell time of 0.15 s.
Validation
The assay was validated against published acceptance criteria for linearity, precision, recovery and sample stability. 2
Ion suppression
Ion suppression is a matrix effect which occurs when compounds in a sample compete with the analyte for ionisation in the source. To investigate this, we infused a 1000 nmol/L solution of D4 cortisol in 50% (v/v) methanol/water directly into the mass spectrometer to give a constant background signal. Serum samples (n = 6) were injected simultaneously via the autosampler. A reduction in the background signal is observed when ion suppression occurrs and ion suppression is deemed significant if a reduction in signal of >10% is observed where the compound of interest elutes. Serum samples (n = 5) were serially diluted with PBS containing 0.1% BSA to assess the linearity of the dilutions and as a further test on ion suppression since cortisol concentrations would dilute in a non-linear manner in the presence of ion suppression.
Accuracy
The accuracy of the assay was determined by the analysis of European Reference Materials DA 192 and 193. Accurate measurement of this matrixed reference material would also confirm the lack of matrix effects given the use of PBS-based calibrators. To further confirm this, the method of standard additions was used with serum and PBS-based spiked samples with a target of within 5% of each other.
Recovery
Three different concentrations of cortisol were spiked into six different serum samples with cortisol concentrations ranging from 122 to 384 nmol/L. The concentrations of cortisol added to each sample were 97, 207 and 433 nmol/L. The recovery was calculated from measured compared to expected concentrations and absolute ion counts were compared for any variances between matrices.
Imprecision
Imprecision of the method was assessed against a range of concentrations using PBS-based and commercial QC samples. These samples were analysed daily for 12 days to calculate inter-assay imprecision. To determine intra-assay imprecision, the same samples were analysed 12 times within one batch. Percentage deviation was calculated from the difference between mean observed and nominal concentrations to assess bias.
Linearity
To evaluate linearity of the calibration curves, three curves were prepared and analysed in separate batches. The ratios of analyte peak area to internal standard peak area were plotted against cortisol concentration in nmol/L. Calibration curves were judged linear if the correlation coefficient (R 2) was better than 0.9900 as calculated by weighted linear regression.
Limit of quantitation and detection
The lower limit of quantitation (LLOQ) was defined as the concentration for which 10 replicates of PBS-based samples prepared with low concentrations of cortisol gave a CV of less than 20% and bias of less than 20%. The lower limit of detection (LLOD) was defined as the concentration which gave a peak with a 3 to 1 signal to noise ratio.
Specificty
Solutions of various related steroids, both natural and synthetic, were prepared in 50% (w/v) methanol/water and injected directly into the mass spectrometer via the autosampler, without internal standard. Steroids tested to a final concentration of 1000 nmol/L were testosterone, dehydroepiandrosterone sulphate, dehydroepiandrosterone, oestradiol, progesterone, aldosterone, cortisone, corticosterone, 17 hydroxyprogesterone, 11 deoxycortisol, 21 deoxycortisol, pregnenolone, 19 nortestosterone, epitestosterone, dihydrotestosterone and androstenedione. Others tested to 1 mg/L were fludrocortisone, dexamethasone, methylprednisolone, budesonide, prednisone, beclometasone, cyproterone, ethinyl oestradiol, norethisterone, triamcinolone and prednisolone.This excess concentration was chosen to allow easy identification of any potentially interfering peaks. The retention times of any compounds found to give a signal in the specific channels for cortisol or D4 cortisol were subsequently assessed to determine if they would cause interference. Previous reports have shown the M + 2 isotope of prednisolone may cause an isobaric interference in the cortisol transition 1 ; however, we have not found this to be a problem in a previously published salivary cortisol assay using similar equipment. 3
Stability
The stability of cortisol has been well documented. 4 Therefore, we investigated the stability of cortisol once the sample preparation has taken place and also the stability of the detector response upon multiple injections of an extracted sample over 16 h.
Comaparative assays and Short Synacthen® Testing
Serum samples were analysed by the LC-MS/MS method and compared to two commercially available immunoassays. These were the Roche E170 electrochemiluminescent immunoassay (ECLIA, n = 149) and the Abbott Architect chemiluminescent microparticle immunoassay (CMIA, n = 148). Following this, the data from unstimulated (pre-Synacthen®, n = 103) samples were investigated for gender-related differences by assessing the difference between males and females in a method comparison.
Furthermore, to evaluate the performance of our LC-MS/MS method pre-and post-synacthen, we analysed serum samples from healthy subjects which had been collected as part of another study that aimed to investigate the effects of different assay systems in the measurement of cortisol during Short Synacthen® Testing (SST). 11 The samples were collected from individuals aged 20 to 66 years and were stored at −20℃ and transported frozen. SST samples (n = 171) from this normal population were analysed by the LC-MS/MS assay and were compared to the results of a gas chromatography mass spectrometry (GC-MS) assay at the Welsh External Quality Assurance Scheme (WEQAS) laboratory. The GC-MS assay measured total cortisol using a modified version of their isotope dilution gas chromatography-mass spectrometry (ID-GC-MS) method. 5 Interassay CVs for this assay were 5.4%, 6.2% and 6.8% at concentrations of 120, 363 and 657 nmol/L, respectively. 11
This assay used NIST 921 for calibration and DA 192 and 193 for quality control. The measured percentage deviation from the target concentrations was 0.35% for DA 192 and 0.87% for DA 193 for the GC/MS assay. Data analysis was performed for all data, males and females, with and without oral contraceptive (OCP) use. The lower reporting limit for the 30 min SST cortisol response was estimated using the 2.5th centile of the log-transformed concentrations. A morning reference range for cortisol using the LC-MS/MS assay was derived using the 2.5th and 97.5th centiles of the 0 min data excluding samples from women on the OCP.
Data review
Chromatograms over a two-month period were inspected closely for the presence of exogenous steroids which was suggested by peaks in the chromatogram at a different retention time to cortisol in either transition. These samples were collected when available and analysed on the Abbott CMIA to investigate the degree of interference in the immunoassay. An arbitrary cut-off of immunoassay results >20% higher than the LC-MS/MS results were identified as having interference.
Statistical analysis
All statistical analyses were performed using Analyse-it software (Analyse-it Software Ltd, Leeds, UK).
Results
Both cortisol and D4 cortisol had retention times of 1.02 min (Figure 1) and a cycle time, injection-to-injection, of 2.6 min. The time to prepare and run 10 patients’ samples was approximately 75 min. The 363.2 to 97 transition for cortisol was used as the quantifier as the 363.2 to 121 transition displayed some interference in samples from patients taking prednisolone. This interference manifested as a shoulder on the peak at an earlier retention time to cortisol and prednisolone (both eluting at 1.02 min) and was therefore likely to be a drug metabolite. There was no significant suppression of ionisation in the region of the chromatogram where cortisol elutes. The mean recoveries following the addition of cortisol to six serum samples were 99% (range 85–123%).
Chromatogram of a serum sample containing 47 nmol/L of cortisol. The upper panel shows the internal standard and the lower panel shows the cortisol quantifier transition. The y-axis shows relative ion count normalised to the same intensity.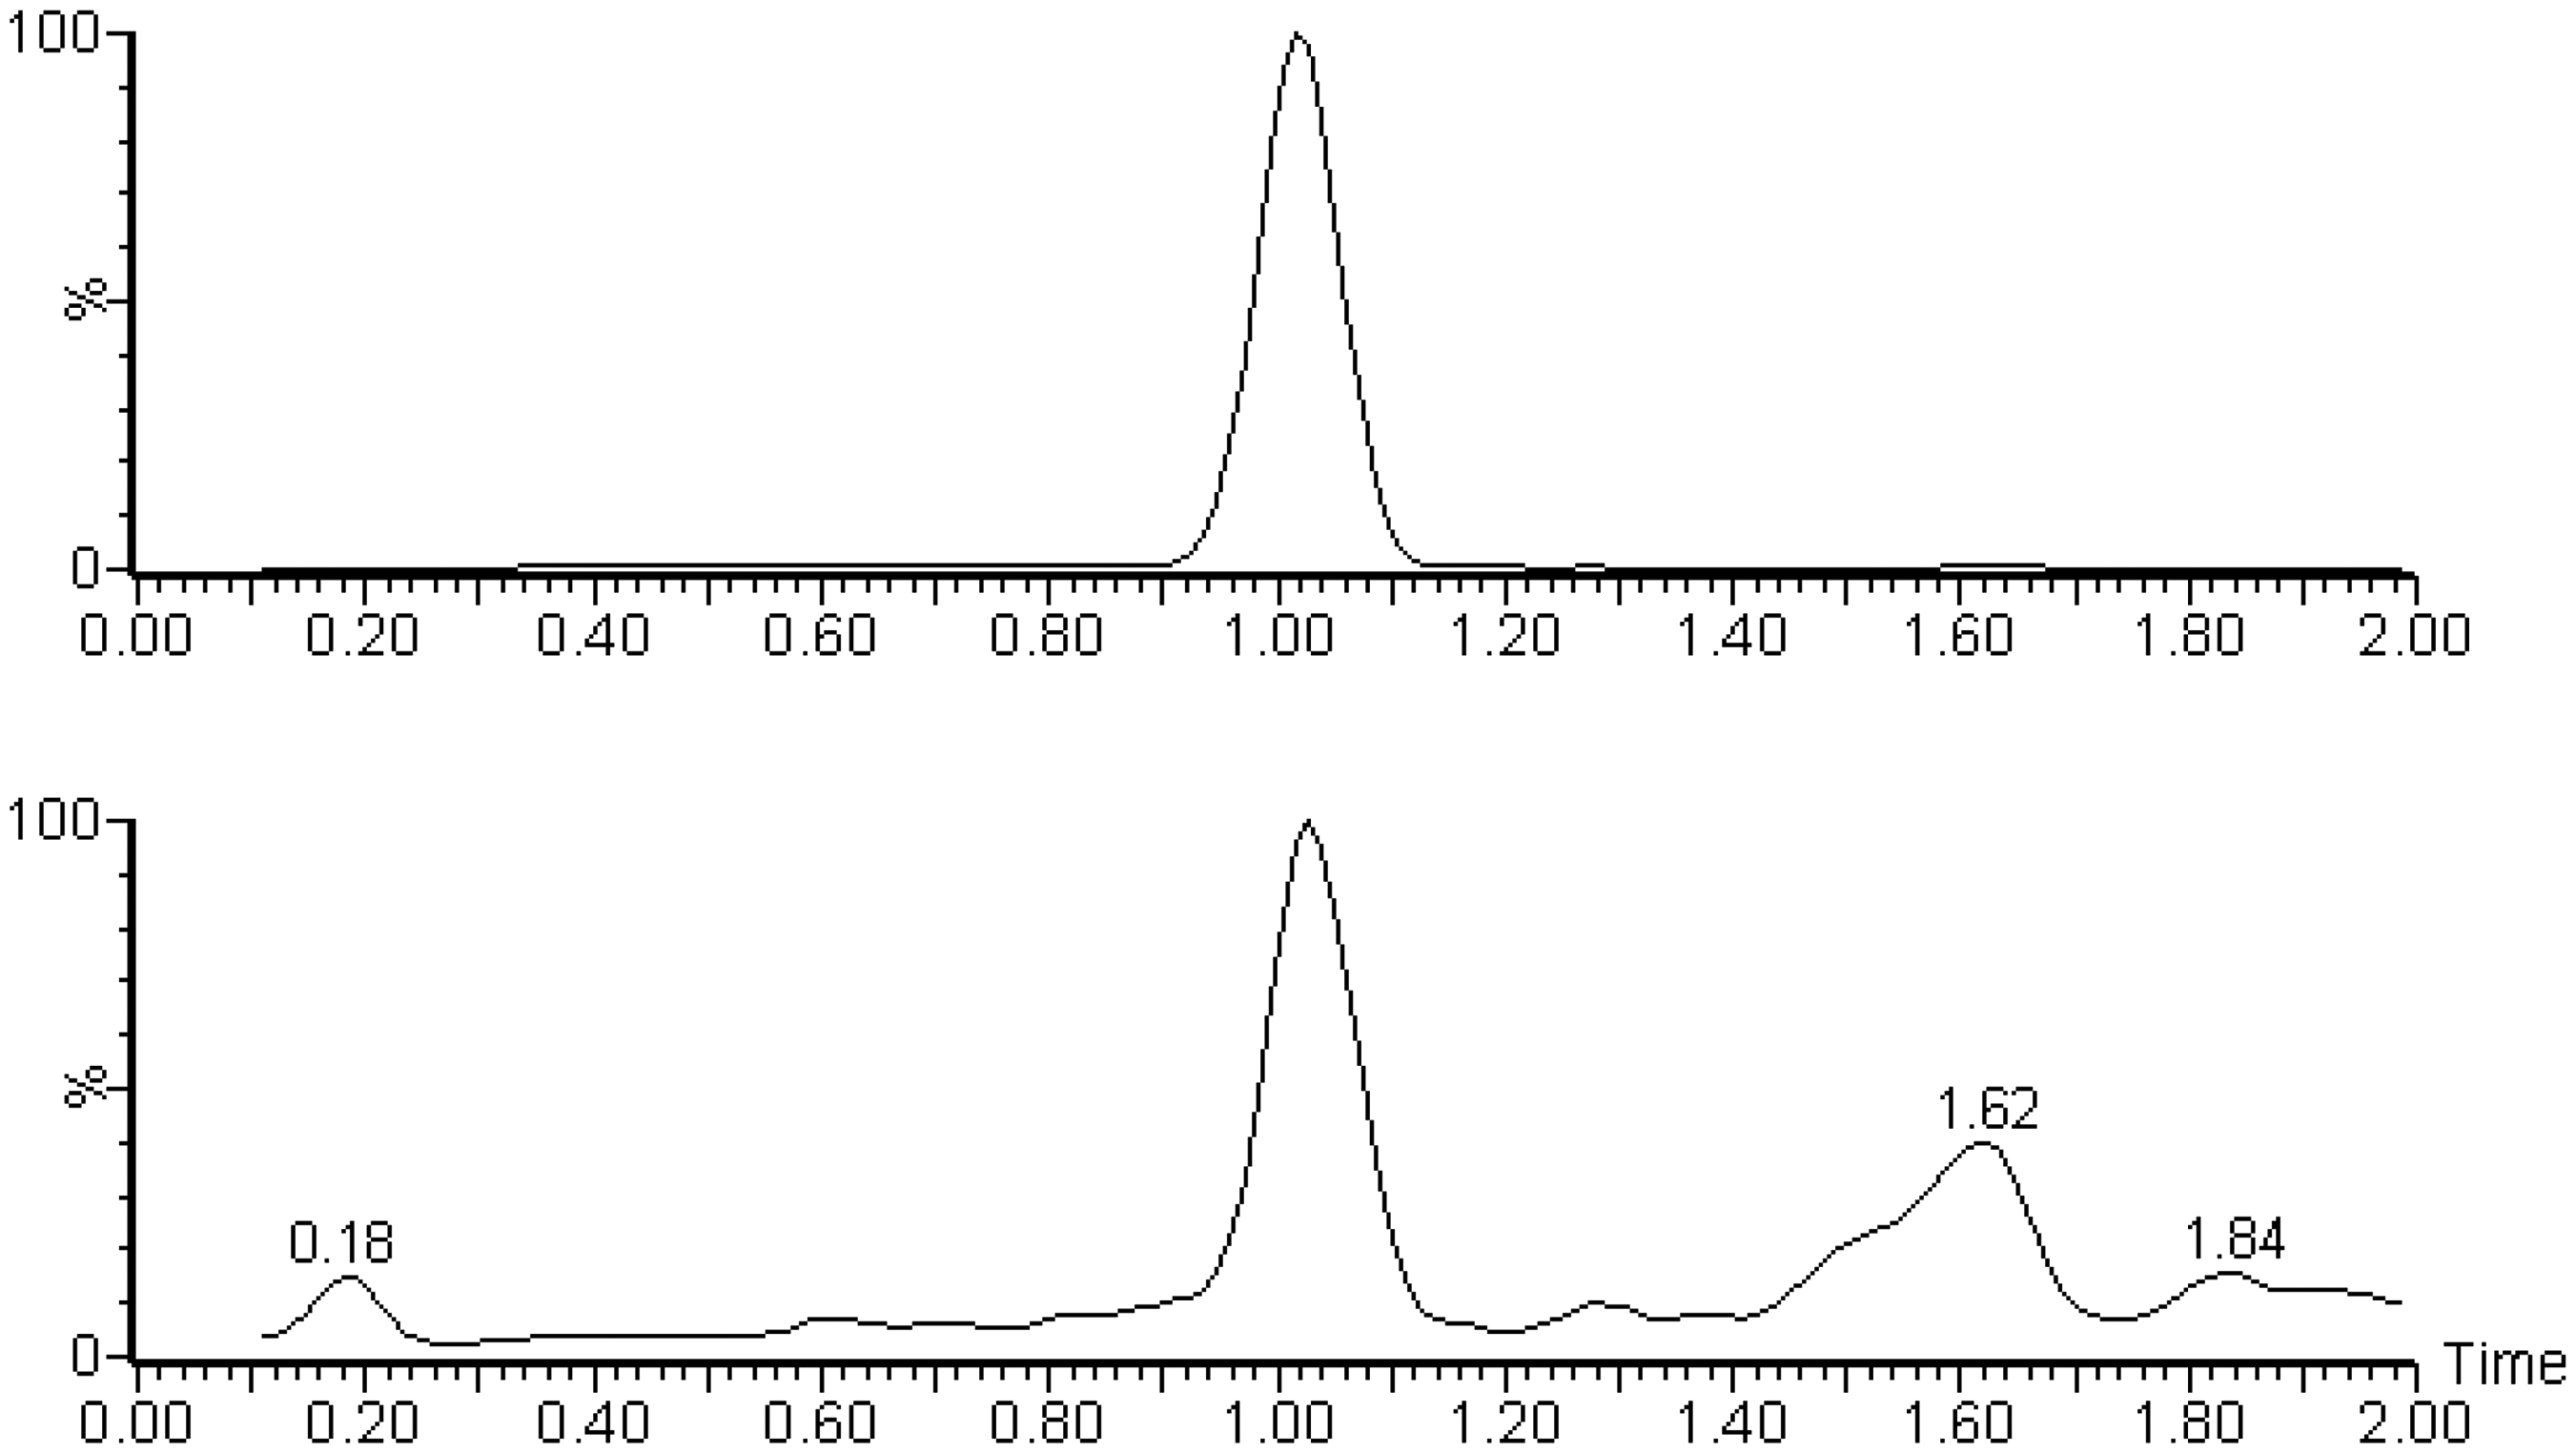
Analysis of matrixed reference materials gave concentrations within 3% of the target concentrations. The method of standard additions showed that the PBS containing 0.1% (w/v) BSA and serum spiked with 0–2000 nmol/L of cortisol were within the 5% target.
The inter-assay imprecision (%CV) for the PBS-based QCs was 13%, 9% and 5% at concentrations of 100, 400 and 800 nmol/L, respectively. The inter-assay imprecision for commercial QCs was 8%, 7% and 6% at concentrations of 80, 480 and 842 nmol/L, respectively. The intra-assay imprecision was 12%, 7% and 9% for the PBS-based QCs and 9%, 6% and 5% for the commercial QCs. All means were within 4% of the PBS-based QC targets. The reference material was measured within 3% of the target values.
Standard curves were made by plotting cortisol concentrations on the x-axis and cortisol/D4 cortisol peak area ratios on the y-axis. The curve was linear over the standard range and was reproducible between batches. The curves showed good correlation with the assigned standard values with an R 2 value of 0.999. Dilutional linearity experiments showed that serum can be diluted in PBS containing 0.1% BSA mean bias +1% (range −11% to +13%).
The lower limits of detection and quantitation were 5 and 12.5 nmol/L, respectively. The CV at 12.5 nmol/L concentration was 17% and the bias was +2%. None of the steroids, endogenous or exogenous, gave a response above the LLOQ at the retention time for cortisol or D4 cortisol.
A continuous series of injections over a 16-h period did not show any systematic decrease in the area counts of either cortisol or D4 cortisol and therefore did not cause any loss of sensitivity. The CV of the response (cortisol peak area/D4 cortisol peak area) was 8.1%. Extracts were stable at 4℃ for 24 h as shown by a paired sample t-test result of P = 0.22.
The re-analysis of samples prepared independently to the calibration curve to simulate a potential mechanism for the handling of urgent requests showed a bias of −1.1 nmol/L (Figure 2). The maximum CV of the pairs was 16.5% and the difference between the two sets of results was not significant (paired sample t-test, P = 0.89).
Bland–Altman plot comparing the results of 39 serum samples that were re-extracted and analysed for cortisol following the completion of their original analysis. The calibration of the original sample preparation was used to calculate the concentrations of the re-extracted samples.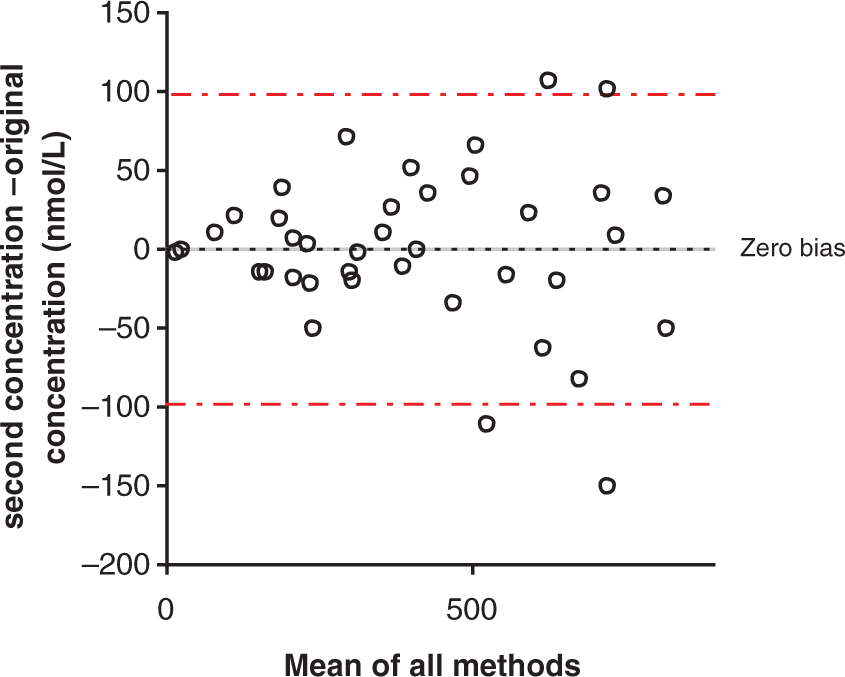
A method comparison of serum samples analysed by this assay (n = 149) and a Roche immunoassay gave a Bland-Altman bias plot (Figure 3) with a mean bias of −101 nmol/L. Passing–Bablock analysis showed an equation of: Roche = 1.23 × LC-MS/MS – 1.12 nmol/L. The correlation coefficient (R
2) was 0.94. Four samples were excluded from the data analysis due to a large discrepancy between the results. The immunoassay cortisol concentrations were considerably higher than the LC-MS/MS assay. All these samples were taken from patients taking prednisolone. When the data (males n = 47, females n = 57) were examined for gender-related differences, following the exclusion of any samples post Synacthen®, none were found. The Passing–Bablock method comparison for males was: Roche = 1.25 × LC-MS/MS −9.82 and for females was: Roche = 1.24 × LC-MS/MS + 7.43.
Bland–Altman plot comparing the LC-MS/MS assay and Roche immunoassay (n = 149), mean bias of LC-MS/MS assay was −101 nmol/L.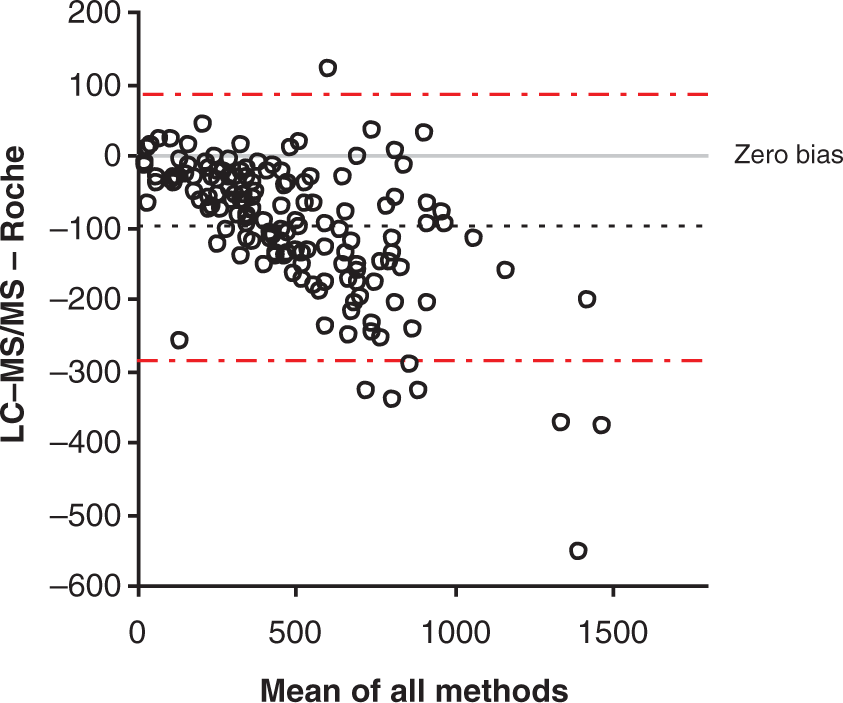
A method comparison using the Abbott immunoassay gave a Bland-Altman bias plot (Figure 4) with an average bias of +15 nmol/L. Passing–Bablock regression analysis gave the following equation; Abbott = 0.94 × LC-MS/MS + 11.97. The correlation co-efficient (R
2) was 0.96. The same four samples showed discrepancy between LC-MS/MS and the Abbott immunoassay, although to a smaller extent, and were excluded from the data analysis. When the data (males n = 44, females n = 59) were examined for gender-related differences, following the exclusion of any samples post Synacthen®, both constant and proportional biases were observed with the assay giving slightly lower results in most female samples. The Passing–Bablock method comparison for males was: Roche = 0.98 × LC-MS/MS + 6.45 and for females was: Roche = 0.94 × LC-MS/MS + 13.13.
Bland–Altman plot comparing the LC-MS/MS assay and Abbott immunoassay (n = 148), mean bias of the LC-MS/MS assay was +14.5 nmol/L.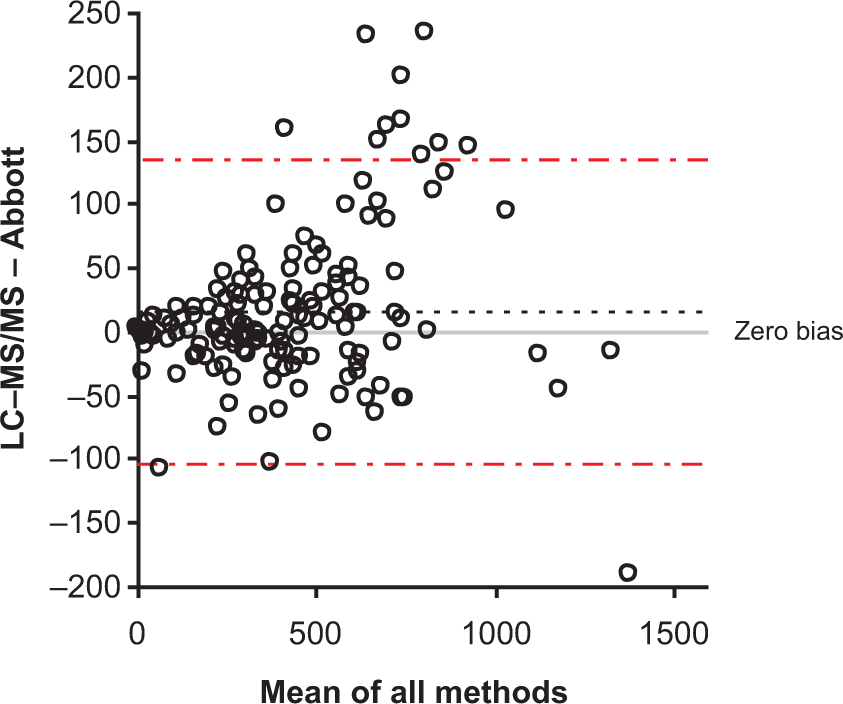
A comparison with a GC-MS assay (n = 171) for cortisol available at the WEQAS laboratory in Cardiff gave a Bland-Altman bias plot (Figure 5) with a mean bias of 24 nmol/L for all samples pre- and post-Synacthen®. The Passing and Bablock analysis gave the following equation: LC-MS/MS = 1.11 × GC-MS – 22.90 (R
2 = 0.92). Examining the data for SST samples showed the LC-MS/MS assay had a mean bias of 10.5 nmol/L and Passing–Bablock equation of LC-MS/MS = 1.08 × GC-MS–10.6 nmol/L for the pre-Synacthen® samples (n = 87). For post- Synacthen® (30 min) samples, the LC-MS/MS had a mean bias of 37.2 nmol/L and a Passing–Bablock equation of LC-MS/MS = 1.18 × GC-MS – 64.9. When examining the data for gender related differences, none were observed (males n = 74, females n = 97). Furthermore, similar comparisons were observed when comparing male samples (n = 74) with female samples, both on (n = 13) and off the OCP pill (n = 84).
Bland–Altman plot comparing the LC-MS/MS assay and WEQAS GC/MS (n = 171), mean bias of the LCMS/MS assay was +23.6 nmol/L.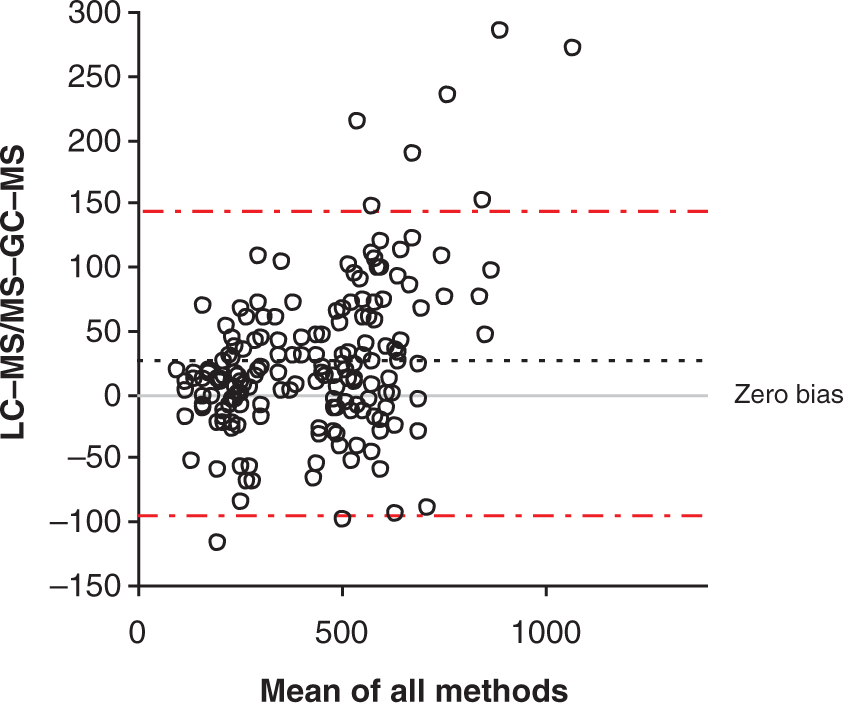
The 30 min lower reporting limit for cortisol concentration post-Synacthen® for males and females who were not taking the OCP was 417 nmol/L (n = 83, 45 females and 38 males). There was an insufficient number of samples (n = 14) from women taking the OCP to enable a specific cut-off to be used in this group. The reference range of the 2.5th and 97.5th centiles for morning samples pre-Synacthen® excluding samples that were taken from women on the OCP was 108–491 nmol/L.
Following the review of two months of requests for cortisol measurement, 128 samples (of the total requests, i.e. 33%) were found to show evidence of exogenous steroid use. These were identified as having extra peaks on the chromatogram at a different retention time from the cortisol peak in either the quantifier or the qualifier transitions or shoulder on the qualifier peak, as is the case for prednisolone metabolites. No samples exhibited shoulders on the quantifier peaks. Of these, 105 samples were available for further investigation. The Bland–Altman analysis of the LC-MS/MS assay compared to the Abbott immunoassay (Figure 6). Of the 105 samples, 24 samples displayed a cortisol concentration determined by the immunoassay as >20% higher than the concentration determined by LC-MS/MS. These samples represented 6% of all cortisol requests.
Bland–Altman bias plot comparing results of the LC-MS/MS and Abbott immunoassays of samples (n = 105) from patients samples that showed evidence of exogenous steroid use.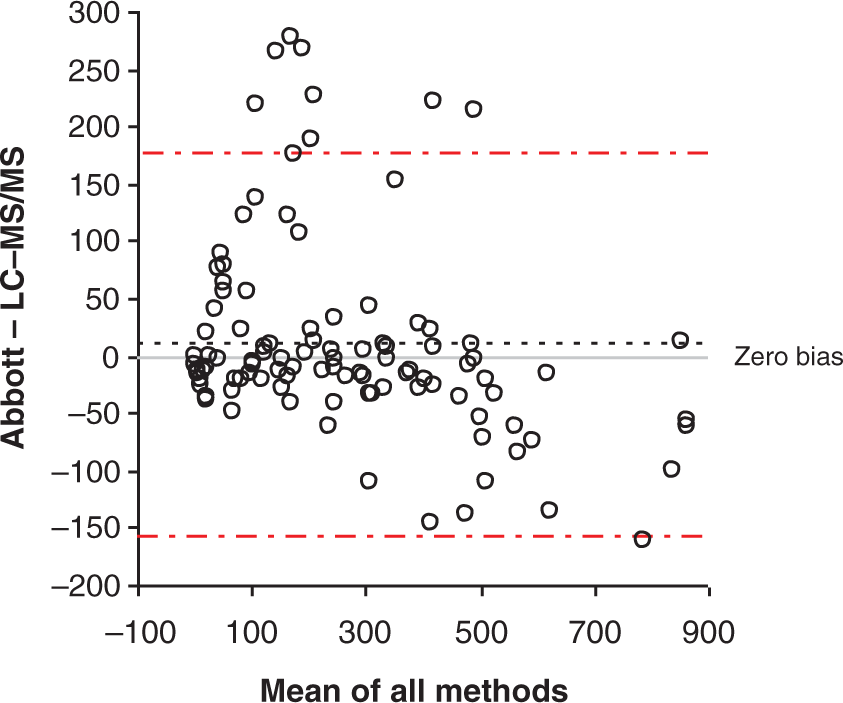
Discussion
We have developed a rapid LC-MS/MS assay for serum cortisol analysis that is suitable for routine clinical use. There have been LC-MS/MS assays for serum cortisol reported 1,6,7 but these are not suitable for routine use due to the long run times and extensive sample preparation. As a result, the uptake of LC-MS/MS assay has been poor compared to other steroids and consequently there is only one routine LC-MS/MS assay registered with UK NEQAS and none are registered with the WEQAS. The sample preparation in our LC-MS/MS assay involves a simple protein precipitation technique which takes approximately 10 min to prepare a run of six standards, quality controls and 12 samples, a typical daily run size for our large teaching hospital laboratory. However, we tend to prepare two smaller batches to minimize the turnaround time of these samples. Extracting samples and analysing them after a run has finished with the previous existing calibration still gave acceptable results. This approach could be used for handling urgent samples out of hours as this would take less than 10 min hands on time to prepare the samples and report the results. There would be also a small amount of ‘walk away time’ during the centrifugation and analysis times. We estimate this to be less than 10 min for one sample with the addition of 2.6 min for subsequent samples.
In 12 months, we have analysed 2860 samples for cortisol requiring three guard and analytical columns. The use of a C8-fused core column gave adequate separation without extensive run times as it allows rapid re-equilibration. The sample volume of only 20 µL is advantageous for small samples, particularly paediatric samples. The assay demonstrated excellent performance during the method validation process and had CVs comparable or less than those observed for the Abbott immunoassay despite manual sample preparation. The LLOQ of 12.5 nmol/L also rivals those obtained by immunoassays despite the fact that the LC-MS/MS assay was developed for speed of analysis rather than sensitivity.
The high degree of specificity conferred by the use of tandem mass spectrometry coupled with chromatography on a C8 column ensured that none of the endogenous or exogenous steroids tested resulted in any observed interferences. Prednisolone co-elutes with cortisol in this assay, however, due to different fragmentation patterns of prednisolone and cortisol, high concentrations (exceeding those found in individuals on therapy) of prednisolone do not cause a measurable peak in either cortisol transitions. A metabolite of prednisolone can be observed as an unresolved peak in the 363.2 to121 transition of cortisol but not in the 363.2 to 97 transition, and hence this was used for quantitation. This promotes the use of this LC-MS/MS assay in patients receiving prednisolone therapy and has previously been shown to be essential in patients with altered steroid metabolism such as those patients receiving metyrapone therapy. 8,9
The two routine immunoassays for cortisol demonstrated good comparisons with the LC-MS/MS assay; however, the Roche assay tended to measure cortisol 23% higher than the LC-MS/MS assay, but no gender-related differences were observed using this assay. However, these data may include samples from women taking the OCP and therefore if these are excluded, differences may become apparent. The Abbott immunoassay gave the best overall comparison of the two immunoassays but appeared to underestimate the cortisol concentrations in female samples. This supports the differences observed between these two immunoassays after the analysis of UK NEQAS samples from females. This may be due to the inability of some immunoassays to completely remove cortisol from its binding protein for measurement. This effect would be more pronounced in females due to the influence of oestrogens on binding protein concentrations. 10
The LC-MS/MS assay compared well to the WEQAS reference ID-GC-MS assay.
No differences were observed for males, females or females taking the OCP. This assay may therefore also be used in females on the OCP to give a more accurate result than some immunoassays and some samples have been analysed from referral laboratories for this purpose. A slight difference was observed when comparing samples pre- and post-synacthen®.
For SST, a lower reporting limit of 417 nmol/L is proposed when using this assay as this was the 2.5th centile of the log transformed 30-min cortisol concentrations during the synacthen® testing of normal individuals. This is similar to what was achieved using the ID-GC-MS assay. This is considerably lower than what is currently quoted for immunoassays (500–550 nmol/L). However, as the immunoassays compare variably to this assay, method-specific reference ranges should be employed. 11
A review of two months chromatograms at the end of the first year of routine use of this assay resulted in a large proportion of samples showing evidence of exogenous steroid use. Of these samples, many gave a falsely elevated result when measured by immunoassay which could cause in misclassification, misdiagnosis or incorrect treatment of patients.
Footnotes
Declaration of conflicting interests
None.
Funding
None.
Ethical approval
The synacthen testing study protocol was approved by the South East Wales Research Ethics Committee (clinical trial registration number: NCT00851942).
Guarantor
LJO.
Contributorship
The developmental and validation of the assay described was performed by LJO and JEA. SD supported the interference studies. FM contributed to the conception of part of the work. BGK supervised the work and made the collaboration. SN, NA-F, DD, CE and DAR contributed to the method comparisons. All authors have contributed to the manuscript.