
Abstract
Background
Direct-reacting bilirubin concentrations measured using vanadate chemical oxidation method do not exactly match the conjugated bilirubin concentration. One of the causes is the effect of bilirubin photoisomers. However, the quantitative evaluation of the effects of these photoisomers has not been sufficiently conducted. In particular, the influence of bilirubin configurational isomers on direct bilirubin is the most critical factor.
Methods
Sixteen residual serum samples were used. For quantitative analysis based on the change in direct bilirubin and bilirubin configurational isomer, samples were irradiated via blue light-emitting diodes to suppress the production of bilirubin structural isomers. Total bilirubin and direct bilirubin concentrations were measured using the vanadate chemical oxidation method. Concentrations of 4Z,15Z-bilirubin IXα and its photoisomers were measured using high-performance liquid chromatography. The sum of 4Z,15E-bilirubin IXα and 4E,15Z-bilirubin IXα was notated as bilirubin configurational isomer, and the differences between the measured values of the irradiated and non-irradiated samples were calculated and notated as ΔDB and ΔBCI.
Results
In non-irradiated and irradiated samples, total bilirubin and direct bilirubin concentrations were 10.73 mg/dL with significant a decrease to 10.60 mg/dL and 0.69 mg/dL with a significant increase to 0.78 mg/dL, while bilirubin configurational isomer values were 1.00 mg/dL and 1.52 mg/dL, respectively. The linear regression equation revealed a significant positive correlation of Y = 0.187X−0.006 between ΔDB (Y) and ΔBCI (X).
Conclusion
Applying the vanadate chemical oxidation method affected approximately 19% of the bilirubin configurational isomer concentration for direct bilirubin. Extreme caution is necessary when interpreting the measured values of samples indicative of unconjugated hyperbilirubinaemia.
Introduction
Direct-reacting bilirubin (DB) is a representative substance measured by clinical testing using the diazo method, 1 and is also detected in subsequent measurement of the bilirubin fraction via enzymatic methods 2 , 3 or the chemical oxidation method. 4 In clinical settings, DB is considered conjugated bilirubin; however, the amount of DB measured using these methods does not precisely match the concentration of conjugated bilirubin owing to the presence of delta bilirubin 5 and bilirubin photoisomers. 6
Bilirubin photoisomers are generated through the irradiation of 4Z,15Z-bilirubin IXα ((ZZ)-bilirubin), 7 which is the unconjugated form of bilirubin (Figure 1). Bilirubin photoisomers can be categorized as bilirubin configurational isomers (BCI) and bilirubin structural isomers (BSI). 7 , 8 BCI include 4Z,15E-bilirubin IXα ((ZE)-bilirubin), 4E,15Z-bilirubin IXα ((EZ)-bilirubin) and 4E,15E-bilirubin IXα. In addition, (ZE)-bilirubin and (EZ)-bilirubin, which are produced because of cis-trans isomerization of (ZZ)-bilirubin, exhibit a photo-equilibrium relationship with (ZZ)-bilirubin. 9 (EE)-bilirubin is untraceable because of its low concentration. BSI include 4E,15Z-cyclobilirubin IXα ((EZ)-cyclobilirubin) and 4E,15E-cyclobilirubin IXα ((EE)-cyclobilirubin); the former is produced from (EZ)-bilirubin, 10 , 11 whereas the latter is produced due to cis-trans isomerization of (EZ)-cyclobilirubin, and both (EZ)-cyclobilirubin and (EE)-cyclobilirubin exhibit a photo-equilibrium relationship. 9 BCI and BSI have different physicochemical properties.
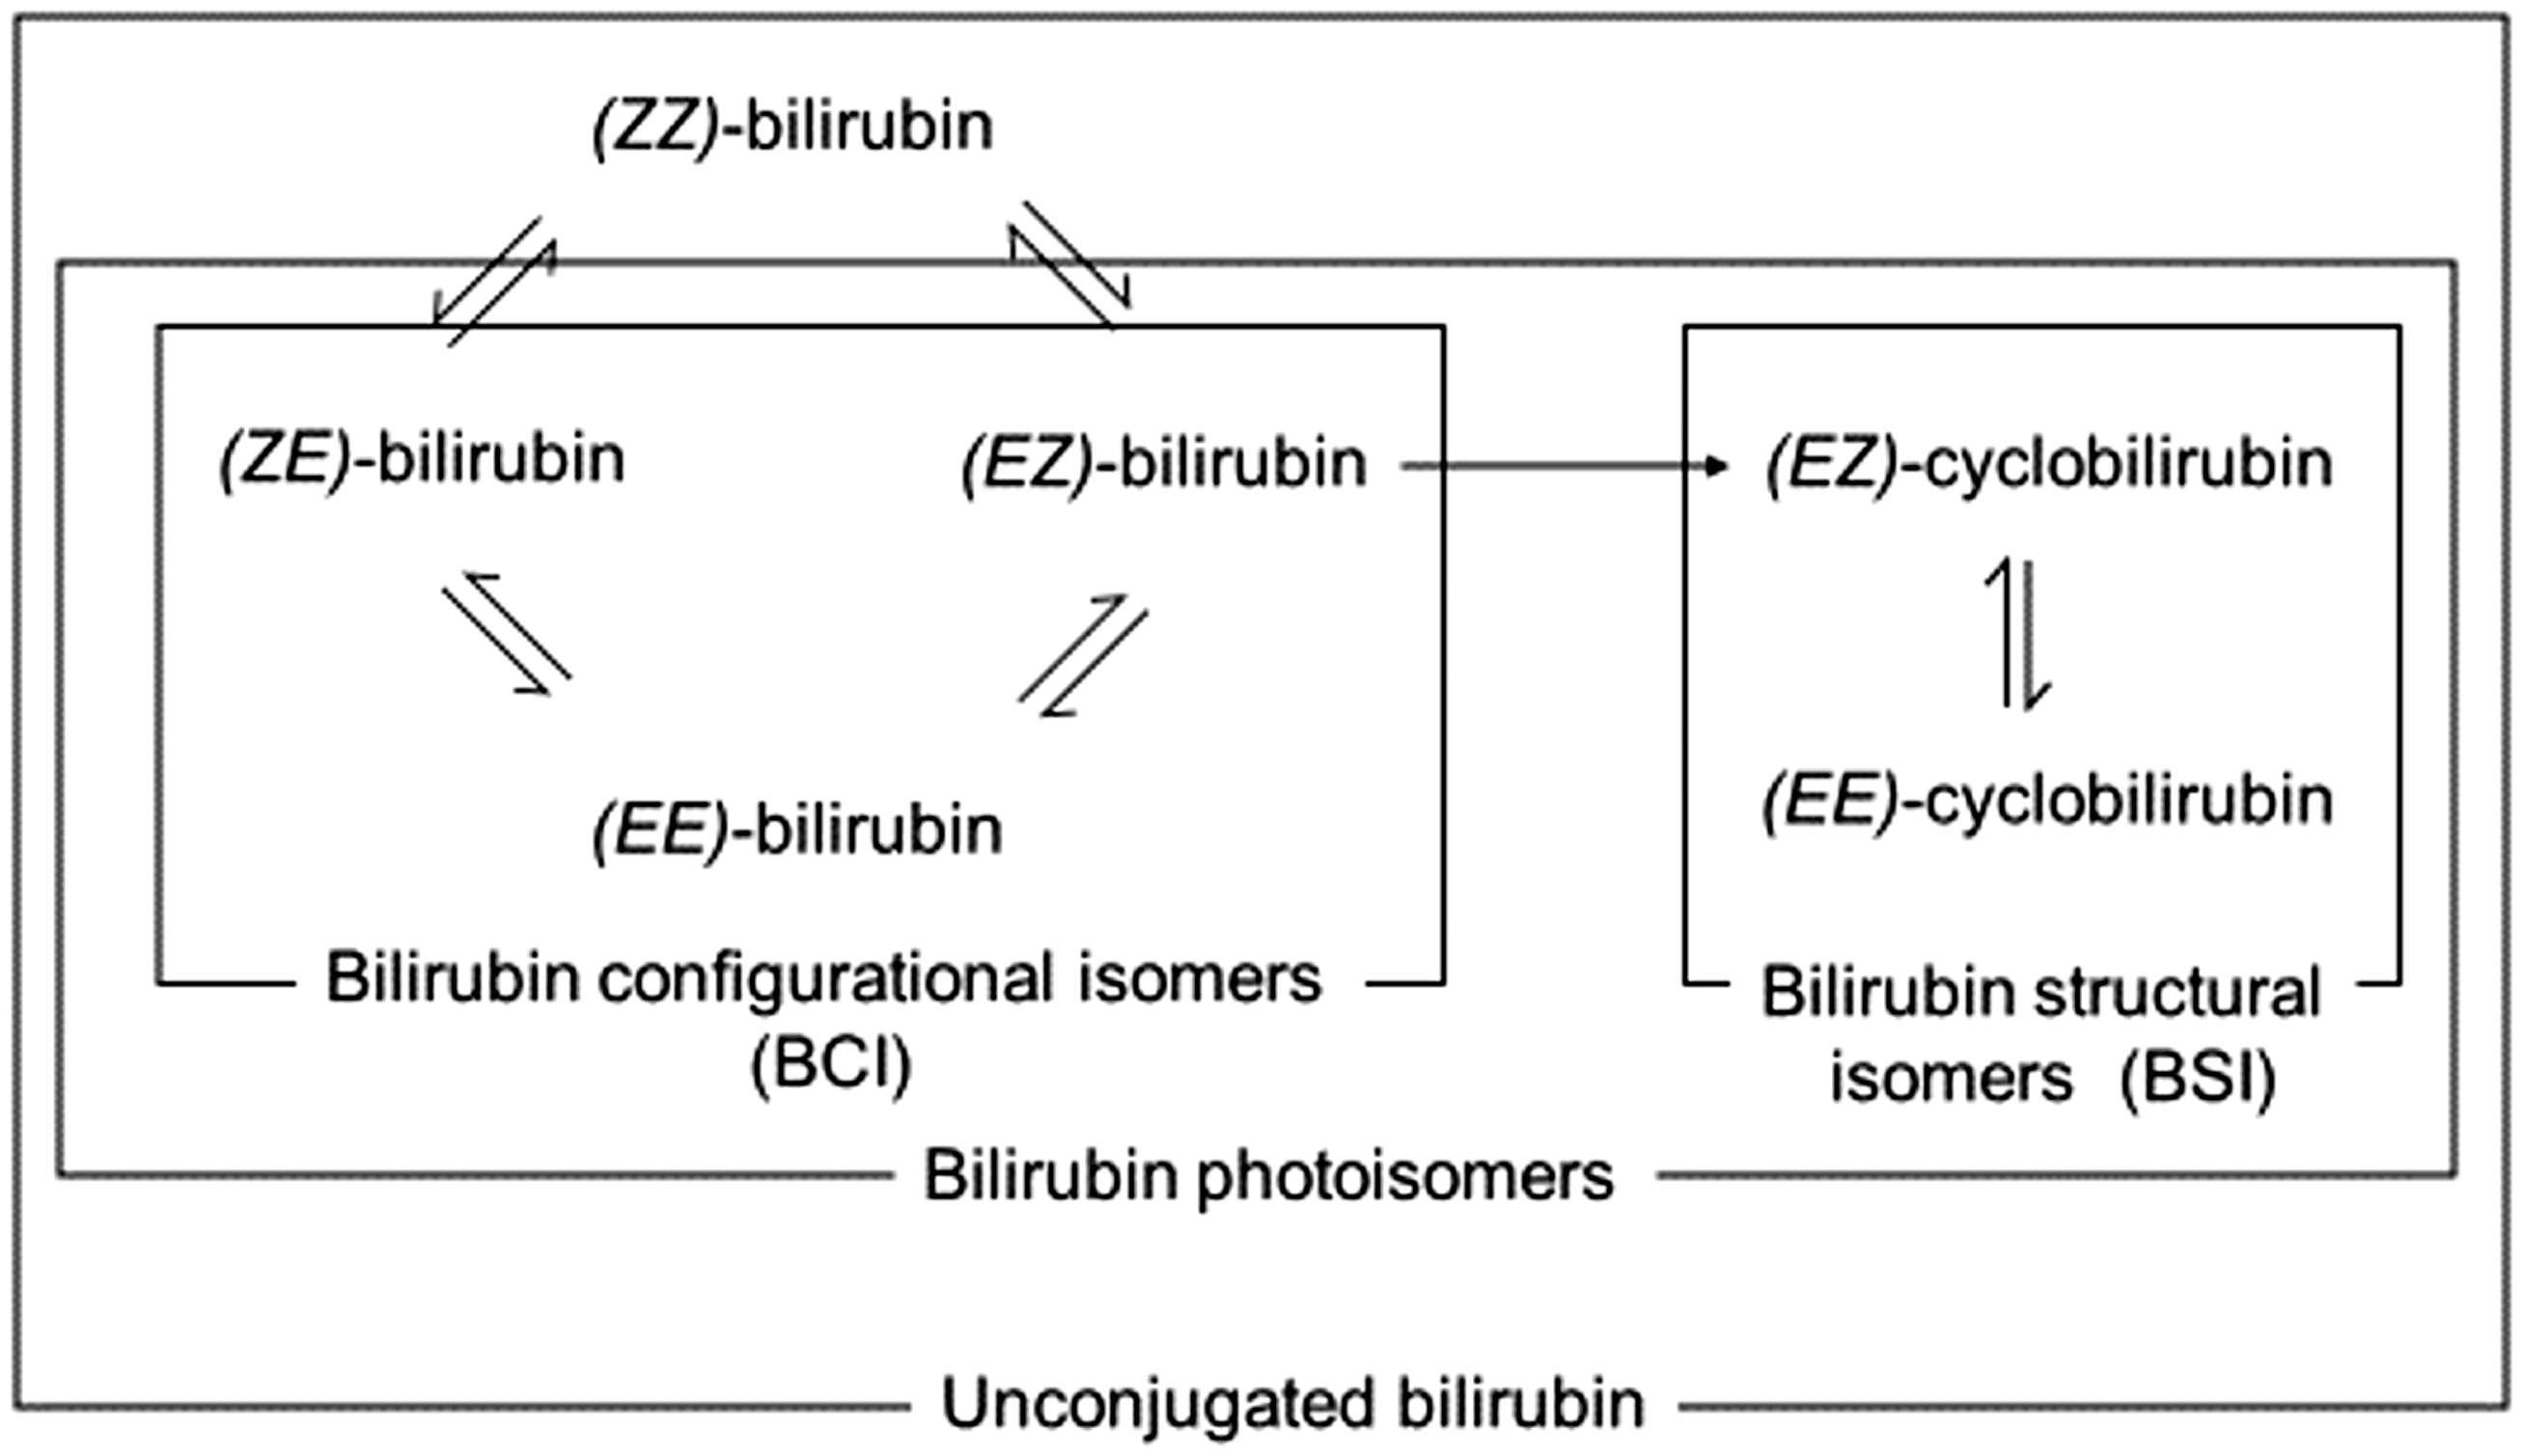
Illustration of the bilirubin photochemical reaction. (ZZ)-bilirubin: 4Z,15Z-bilirubin IXα; (ZE)-bilirubin: 4Z,15E-bilirubin IXα; (EZ)-bilirubin: 4E,15Z-bilirubin IXα; (EZ)-cyclobilirubin: 4E,15Z-cyclobilirubin IXα; (EE)-cyclobilirubin: 4E,15E-cyclobilirubin IXα.
Because humans are exposed to environmental light, these bilirubin photoisomers are always present in the human blood serum. BCI constitute approximately 10–20% of (ZZ)-bilirubin, whereas BSI, which are excreted very rapidly from the body, are present in trace quantities. 12 Infants with physiological jaundice, in particular, have higher unconjugated bilirubin concentrations than adults and therefore, have higher BCI concentrations, which dramatically affect DB and require careful clinical interpretation. 6 , 13 , 14
Vanadate chemical oxidation, a DB measurement method used in clinical laboratories, requires sodium metavanadate as an oxidizing agent. 4 Currently, this method is used in over half of all the testing facilities in Japan. 15 We previously reported that all bilirubin photoisomers in the human serum albumin-bilirubin solutions act as substrates upon vanadate addition, 16 resulting in an increased DB concentration measurement using this method. However, the proportion of each reacting bilirubin photoisomer that contributes to the altered DB amount is not the same because each isomer exhibits a different molar absorptivity. Therefore, a quantitative impact assessment is still needed.
Accordingly, in this study, we report our findings regarding the quantitative effects of BCI on DB by employing the chemical oxidation method using vanadic acid.
Materials and methods
Principles of analysis and irradiation conditions
Quantitative analysis of the effects of BCI on DB concentration was performed by comparing the increase in BCI and changes in DB concentration in light-irradiated samples. The change in the DB concentration was calculated from the decrease in the absorbance of BCI and BSI that reacted with vanadate. Because both BCI and BSI are produced when bilirubin is exposed to light, it was necessary to minimize the increase in BSI. The change in the DB concentration due to the reaction of BSI with vanadate did not exceed that in BSI alone because (EE)-cyclobilirubin and (EZ)-cyclobilirubin showed relative molar absorptivities for (ZZ)-bilirubin at 455 nm. The calibrator used for DB measurement contained bilirubin and ditaurobilirubin, which had molar absorptivities of 62,340 and 48,550 M−1 cm−1, respectively, at 450 nm. 17
The DB concentration used in the clinical setting is expressed in mg/dL up to two decimal places, and clinical judgments are made with a value up to one decimal place or more. Therefore, we set the change in BCI concentration to 0.2 mg/dL or more and the change in BSI concentration to below 0.05 mg/dL for quantitative analysis. The criteria for BCI production included production of a constant ratio to (ZZ)-bilirubin, with the ratio being high in the blue light spectrum. In contrast, BSI production was characterized by low irradiation in the blue light spectrum, proportional to the irradiance and irradiation time. After conducting a preliminary experiment with the irradiation conditions that met this requirement, we found that the optimal condition was irradiation of the neonatal serum with blue LED light for 1 s (BILI-THERAPY Spot Type; Atom Medical, Tokyo, Japan) with an irradiance of 450 μW nm−1 cm−2 (Minolta Photometer M451; Konica Minolta, Japan).
Sample collection and preparation
Residual serum samples obtained from 16 newborn infants born at Kagawa University Hospital, in conjunction with blood tests performed as part of routine medical treatment, were used as samples, and were collected between April 2018 and March 2020. The study was approved by the Institutional Ethics Committee of Kagawa University Heisei (approval number 30–188). Samples were protected from light and were frozen. Before use, samples were thawed in the dark and divided into 200-μL aliquots; nonirradiated samples were designated as Group A and irradiated samples as Group B.
Bilirubin measurement
Total bilirubin (TB), DB, (ZZ)-bilirubin and bilirubin photoisomer concentrations were measured for Groups A and B. TB and DB were measured using a TBA-C16000 instrument (Canon Medical Systems Co., Kyoto, Japan), TB E-HA Test (Wako Co., Osaka, Japan) and DB E-HA Test (Wako Co.). Concentrations of (ZZ)-bilirubin and its photoisomers were measured using high-performance liquid chromatography (HPLC), as previously described. 18 The following equipment was used: Shimadzu LC-20AD (Shimadzu Co., Japan), Nova-Pack C18 column and 5 mm × 10 cm radial compression cartridge (Nihon Waters KK, Osaka, Japan). Additionally, the following reagents were used: acetonitrile:0.01 M phosphate buffer (pH 5.5):dimethyl formamide solution (5:30:65 (v/v/v) as solution A and 20:15:65 (v/v/v) as solution B). Solution A was adjusted from 0% to 34% in 17 min and from 34% to 100% during the subsequent 8 min. The flow rate was 1.0 mL/min. An SPD-20AV instrument (Shimadzu Co.) was used as the detection device, and the detection wavelength was set as 455 nm. Dimethyl sulfoxide and acetonitrile were mixed in the same ratio as the specimens using a vortex mixer and centrifuged. The supernatant (25 μL) was injected into the HPLC apparatus.
The following bilirubin fractions were evaluated: the sum of (ZZ)-bilirubin, (ZE)-bilirubin, (EZ)-bilirubin, (EZ)-cyclobilirubin and (EE)-cyclobilirubin was classified as unconjugated bilirubin (UCB); the sum of (ZE)-bilirubin and (EZ)-bilirubin was classified as BCI; and the sum of (EZ)-cyclobilirubin and (EE)-cyclobilirubin was classified as BSI. The ratio of BCI or BSI to UCB (%) was calculated by dividing BCI or BSI by UCB. The TB, DB, BCI, BSI, BCI/UCB, BSI/UCB and individual bilirubin photoisomer values were compared between Groups A and B. The differences between Groups B and A with respect to DB, BCI and BSI were defined as ΔDB, ΔBCI and ΔBSI, respectively, and the correlations between ΔDB and ΔBCI, along with ΔDB and ΔBSI, were assessed.
Measurement of DB using the vanadate chemical oxidation method
After mixing 10 µL of the sample with 280 μL tartrate buffer (pH 2.9) and incubating, absorbance was measured at 450 nm. Next, 70 μL sodium metavanadate solution was dissolved in a phosphate buffer (pH 7.0). After the reaction, the absorbance was measured at 450 nm, and DB concentrations were calculated based on the decrease in absorbance.
Statistical analysis
Paired t-tests were used to compare the two groups, and a linear regression analysis was performed to verify the relationships between ΔDB and ΔBCI and between ΔDB and ΔBSI. Results with P values less than 0.05 were considered statistically significant. Statistical analysis was performed using GraphPad Prism version 6.0 for Windows (GraphPad Software, San Diego, CA, USA).
Results
The bilirubin fractions in Groups A and B, and changes in the concentrations of various bilirubin photoisomers are shown in Table 1.
Changes in TB, DB and bilirubin photoisomer concentrations before and after light irradiation.
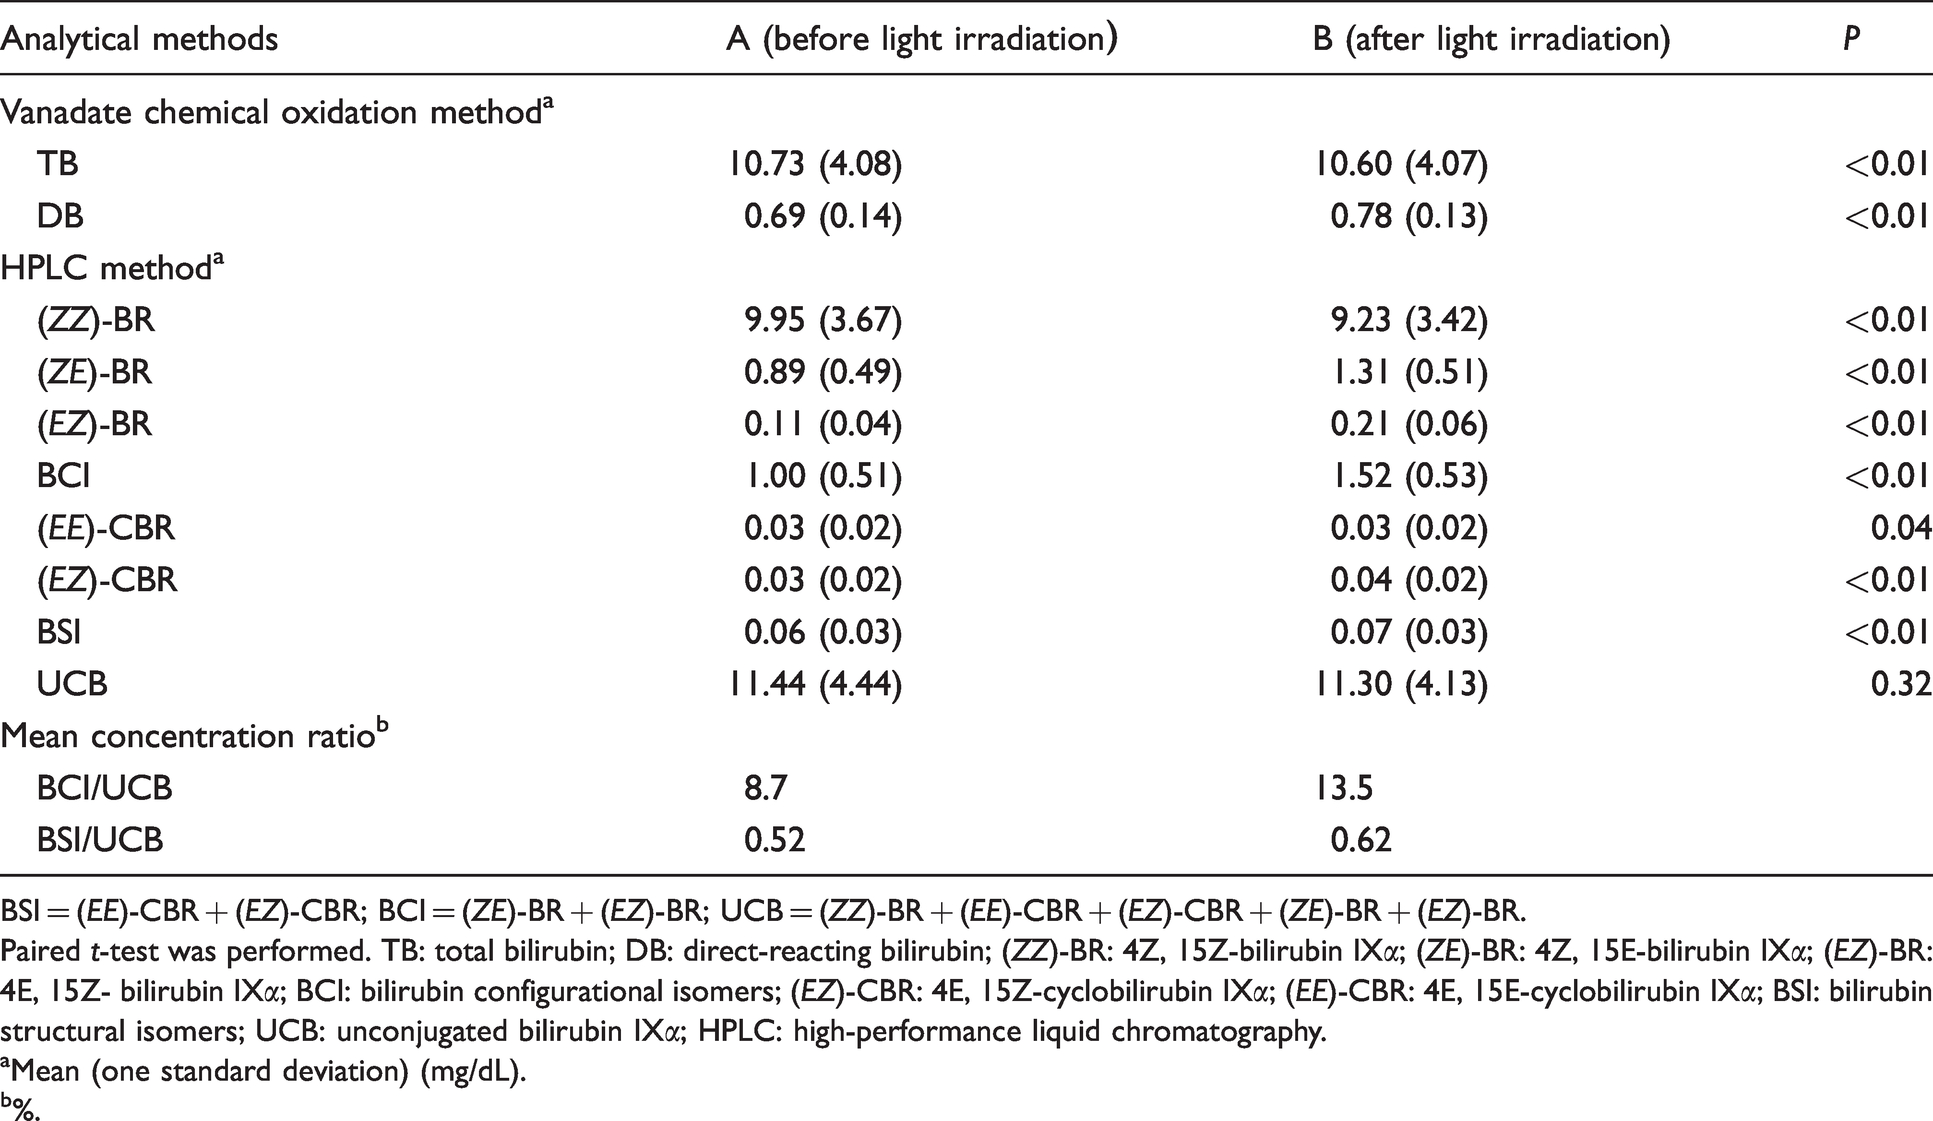
BSI = (EE)-CBR + (EZ)-CBR; BCI = (ZE)-BR + (EZ)-BR; UCB = (ZZ)-BR + (EE)-CBR + (EZ)-CBR + (ZE)-BR + (EZ)-BR.
Paired t-test was performed. TB: total bilirubin; DB: direct-reacting bilirubin; (ZZ)-BR: 4Z, 15Z-bilirubin IXα; (ZE)-BR: 4Z, 15E-bilirubin IXα; (EZ)-BR: 4E, 15Z- bilirubin IXα; BCI: bilirubin configurational isomers; (EZ)-CBR: 4E, 15Z-cyclobilirubin IXα; (EE)-CBR: 4E, 15E-cyclobilirubin IXα; BSI: bilirubin structural isomers; UCB: unconjugated bilirubin IXα; HPLC: high-performance liquid chromatography.
aMean (one standard deviation) (mg/dL).
b%.
The TB concentration (mean (1 standard deviation)) was significantly higher in Group A (10.73 (4.08) mg/dL) than in Group B (10.60 (4.07) mg/dL; P < 0.01). Additionally, the DB concentration increased significantly by 0.09 mg/dL to 0.78 (0.13) mg/dL in Group B compared with 0.69 (0.14) mg/dL in Group A (P < 0.01). (ZZ)-bilirubin concentration was significantly reduced to 9.95 (3.67) mg/dL in Group A and 9.23 (3.42) mg/dL in Group B (P < 0.01). The observed change in UCB concentration was not significant (11.44 (4.44) and 11.30 (4.13) mg/dL in Groups A and B, respectively). BCI concentrations were 1.00 (0.51) and 1.52 (0.53) mg/dL in Groups A and B, respectively, and BSI concentrations were 0.06 (0.03) and 0.07 (0.03) mg/dL in Groups A and B, respectively, indicating significant increases of 0.52 and 0.01 mg/dL in BCI and BSI concentrations, respectively, in Group B (P < 0.01). Bilirubin photoisomer concentrates were all significantly increased in Group B (P < 0.01). In Group A, the mean BCI/UCB and BSI/UCB ratios were 8.7% and 0.52%, respectively, while those in Group B were 13.5% and 0.62%, respectively; thus, in Group B, the BCI/UCB and BSI/UCB ratios were significantly increased by 4.8% and 0.10%, respectively.
The mean (range) differences in the bilirubin photoisomer groups were as follows: (EE)-cyclobilirubin, 0.001 (0–0.010); (EZ)-cyclobilirubin, 0.013 (0–0.030); BSI, 0.016 (0–0.035); (ZE)-bilirubin, 0.41 (0.16–0.68); (EZ)-bilirubin, 0.091 (0.034–0.18); and BCI, 0.50 (0.20–0.87) (Table 2). The changes in BCI and BSI met the established conditions.
The mean (range) differences in the bilirubin photoisomer groups.
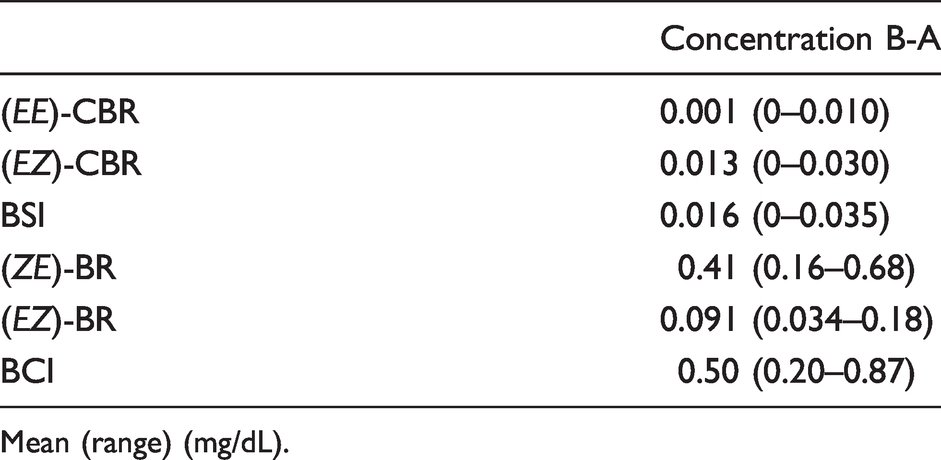
Mean (range) (mg/dL).
Figure 2 shows the correlations between ΔDB and ΔBCI. The linear regression equation showed a significant positive correlation of Y = 0.187X–0.006 between ΔDB and ΔBCI (R2 = 0.76, P < 0.01). Additionally, Figure 3 shows the correlations between ΔDB and ΔBSI. The linear regression equation showed a significant positive correlation of Y = 2.858X + 0.049 between ΔDB and ΔBSI (R2 = 0.50, P < 0.01).
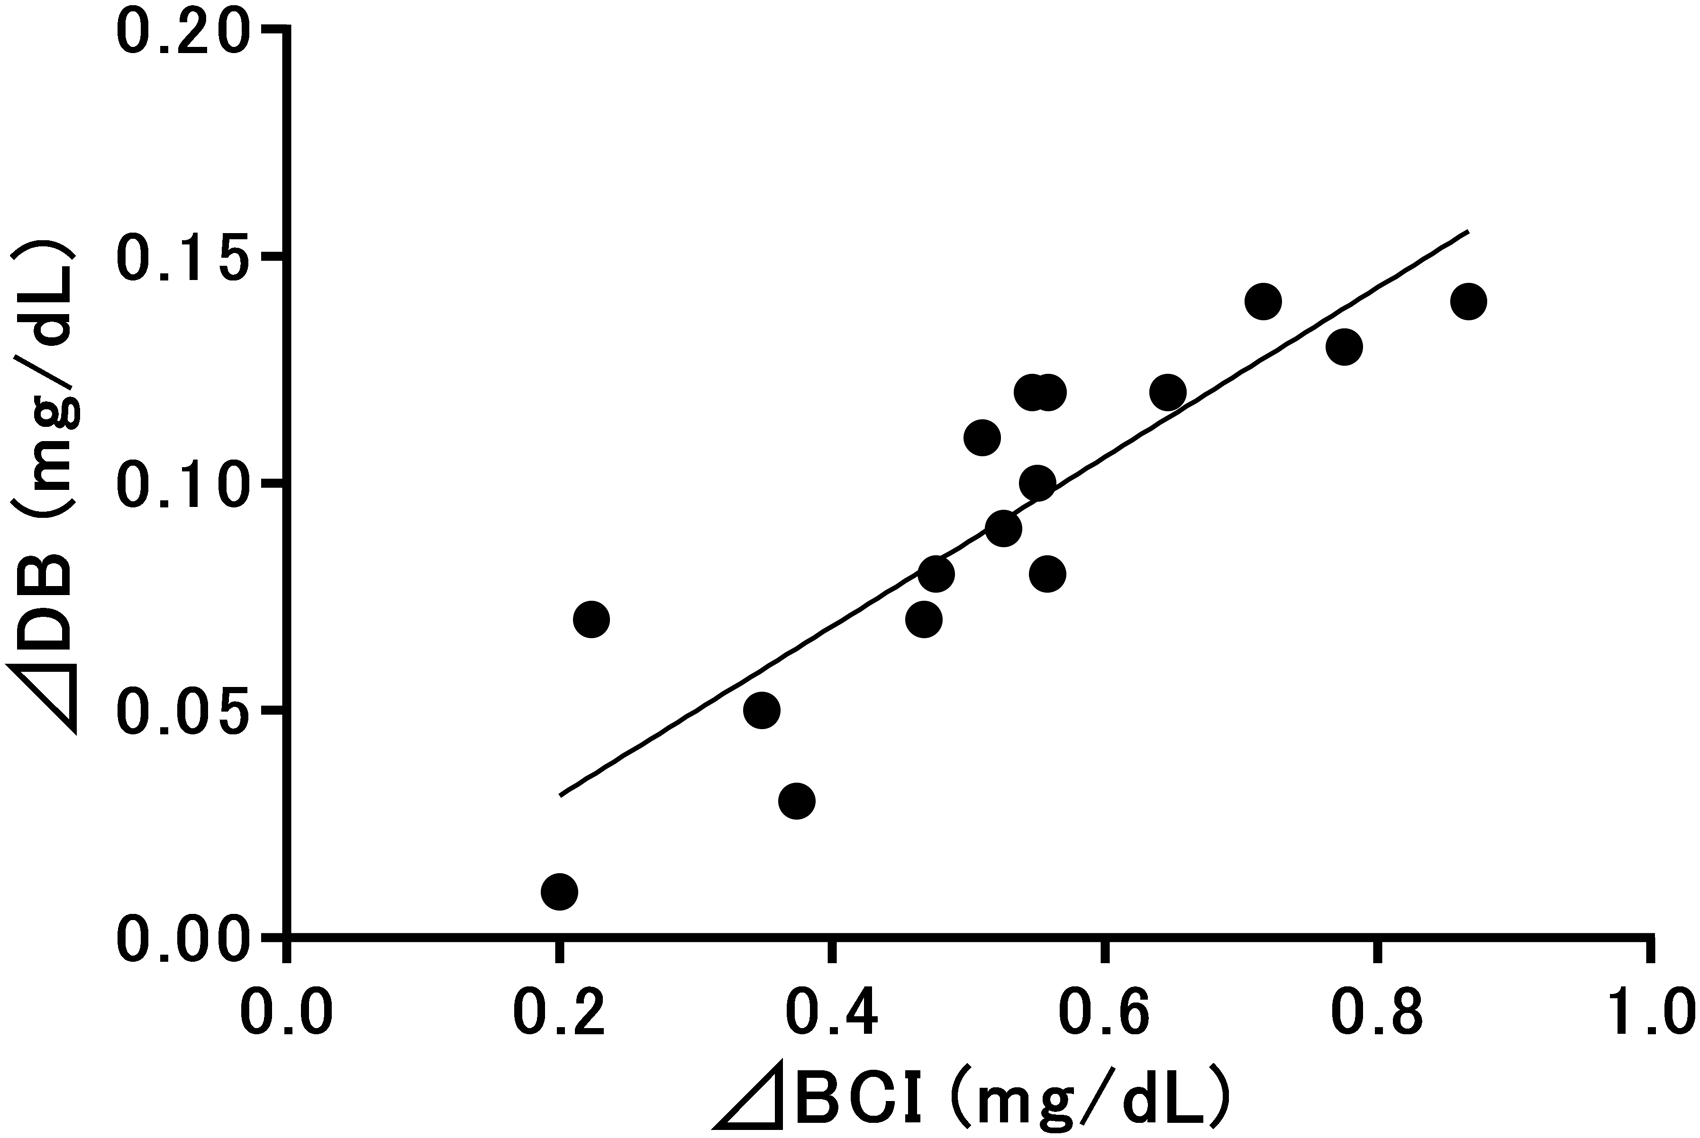
Relationships between direct-reacting bilirubin and bilirubin configurational isomers evaluated using 16 specimens. DB: direct-reacting bilirubin; BCI: bilirubin configurational isomer; ΔDB (Y) and ΔBCI (X). Y = 0.187X−0.006 (R2 = 0.76, P < 0.01).
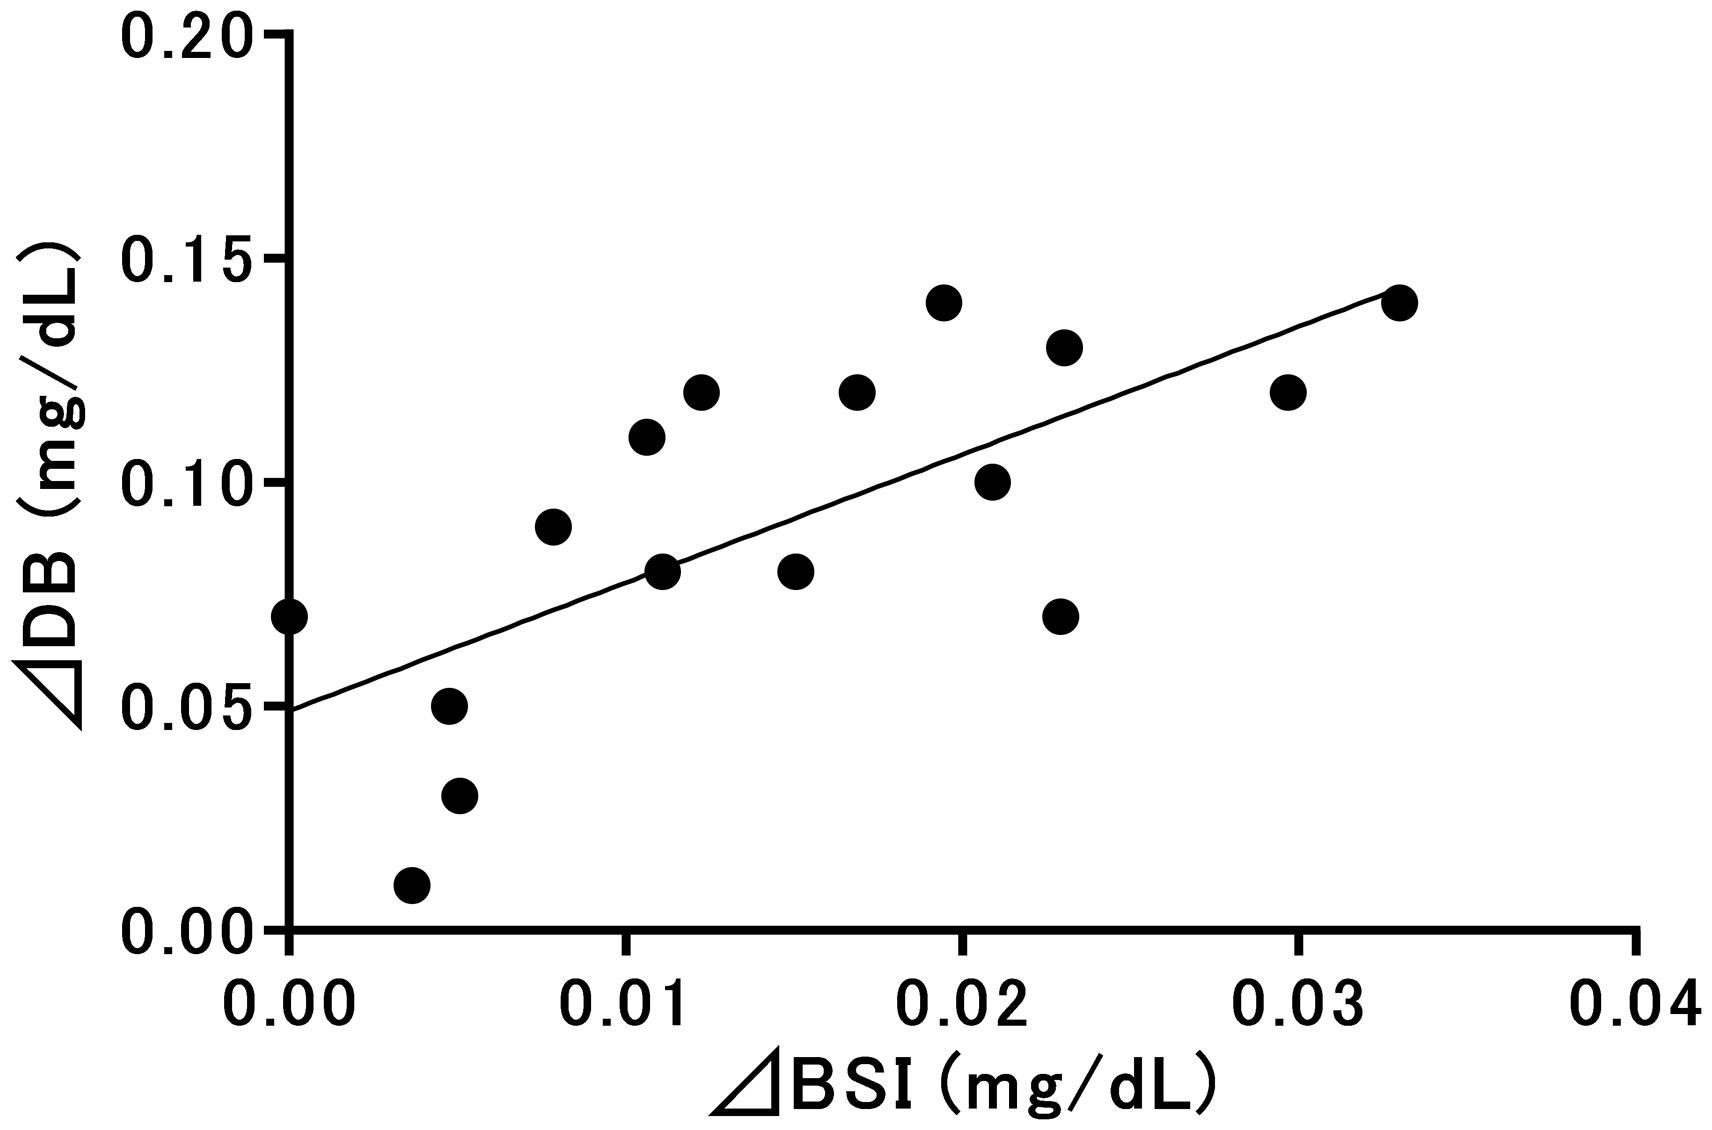
Relationships between direct-reacting bilirubin and bilirubin structural isomers evaluated using 16 specimens. DB: direct-reacting bilirubin; BSI: bilirubin structural isomer; ΔDB (Y) and ΔBSI (X). Y = 2.858X + 0.049 (R2 = 0.50, P < 0.01).
Discussion
DB measurement is a clinical test that remains difficult to standardize. Therefore, it is important to elucidate the factors that influence this measurement. In particular, it is necessary to investigate the effects of BCI, which are abundant in vivo, and BSI, which affect the samples after serum separation during DB measurement.
In this study, we investigated the effects of vanadate chemical oxidation on TB and DB concentrations by selectively increasing the proportion of BCI in bilirubin photoisomers using brief light irradiation. TB values were significantly decreased after irradiation. In contrast, UCB concentrations did not exhibit a significant change. The relative molar extinction coefficients (455 nm) of (ZE)-bilirubin, (EZ)-bilirubin, (EZ)-cyclobilirubin and (EE)-cyclobilirubin for (ZZ)-bilirubin are 0.81, 0.54, 0.47 and 0.39, respectively. 18 The observed decreases in TB concentrations resulted in decreased absorption at 450 nm, which is the wavelength used for measuring vanadate chemical oxidation, because the relative proportion of bilirubin photoisomers increased owing to light irradiation.
DB concentrations significantly increased in specimens following light irradiation. Conjugated bilirubin is present in trace quantities in the serum of healthy newborn infants 12 and is not significantly changed by light exposure. In addition, because no substances other than bilirubin exhibit absorbance at 450 nm or show substantial changes in concentration owing to light irradiation, these changes were attributed to the increased BCI concentrations in the samples.
In this study, BCI and BSI concentrations significantly increased upon light irradiation. BCI and BSI act as substrates in vanadate chemical oxidation. 16 The mean BCI to UCB ratio increased by 4.8% after light irradiation, and the mean concentration of BCI increased by 0.52 mg/dL. At the same time, a 0.09-mg/dL increase in DB concentrations was observed. Linear regression analysis revealed a positive correlation between ΔDB and ΔBCI, and as the intercept was close to 0 and the slope was 0.187 in the approximate linear equation, DB concentrations were determined to have increased by approximately 0.19 mg/dL as BCI concentrations increased by 1 mg/dL. As this relationship was consistent across various samples, including samples from Group A, DB concentrations accounted for approximately 19% of the BCI concentration in the sample. Regarding the effects of BSI on DB in the current study, the mean BSI to UCB ratio increased by 0.10%, and the mean concentration of BSI increased by 0.01 mg/dL. No reports have described the quantitative effects of BSI on DB values using this method; however, the mean DB value representing BSI was thought to be less than 0.01 mg/dL owing to the relationship between the molar absorptivities of the calibrator and BSI.
Among bilirubin photoisomers, (ZE)-bilirubin is the most abundant in the human serum 7 , 12 and is the bilirubin photoisomer that is considered most likely to affect DB. (ZE)-bilirubin characteristically reaches photo-equilibrium rapidly with (ZZ)-bilirubin following light irradiation, and the (ZE)-bilirubin/(ZZ)-bilirubin ratio has a constant value depending on the wavelength characteristics of the light source. 9 These ratios are approximately 0.1–0.2 under white fluorescent light, approximately 0.3–0.4 under blue light and approximately 0.1 under green fluorescent light.19,20 The (ZE)-bilirubin/(ZZ)-bilirubin ratio does not depend on the duration of light irradiation and irradiance. Because (ZE)-bilirubin and (EZ)-bilirubin has higher energy level than (ZZ)-bilirubin, they are converted back into (ZZ)-bilirubin at room temperature and under acidic conditions. 7 Therefore, the (ZE)-bilirubin/(ZZ)-bilirubin ratio decreases at room temperature, even in the dark, or when acidic conditions are used for pre-treatment during DB measurement. Some BCI in samples are converted into (ZZ)-bilirubin under acidic conditions, resulting in a decrease in BCI after the measurement. The effects of BCI concentration on DB were attributed to the residual BCI concentration and relative molar extinction coefficient. Newborn infants, from whom the serum used in this study was obtained, live in environments with typical indoor lighting and sunlight. Because these light source characteristics do not change significantly in most individuals, the BCI to (ZZ)-bilirubin ratio in the serum does not change significantly. However, BCI, particularly (ZE)-bilirubin, are thought to increase during phototherapy when a blue light source is used. Additionally, in the measurement of serum DB concentrations in unconjugated hyperbilirubinaemia, DB concentrations were found to increase in parallel with TB concentrations (R2 = 0.75, P < 0.01) (data are not shown). A previous study discussed the determination of clinical values based on the ratio of DB to TB.20,21 Thus, this phenomenon is thought to be the result of the BCI influence.
In the diazo method, as well as the bilirubin oxidase method, DB is affected by BCI; however, few studies have described the quantitative effects of BCI on these methods, 6 and it is therefore not possible to discuss the differences between reagents. However, in all methods, DB values in serum containing large amounts of BCI, such as the neonatal serum, may be overestimated.
Analysis of the effects of BSI on DB values revealed a correlation between elevated BSI and DB concentrations in serum samples exposed to environmental light over a 24-h period. In contrast, in the diazo method, BSI did not affect DB measurement. 6 BSI are produced and accumulate because of long-term exposure to room lighting after serum separation. 13 Thus, this method also had some problems regarding the effects of BSI, and detailed quantitative studies are needed in the future.
Conclusion
In this study, we demonstrated that the presence of BCI could affect the measurement of DB using vanadate chemical oxidation. The vanadate chemical oxidation method is an excellent method to measure bilirubin. However, caution is necessary when interpreting the measured values in samples from individuals with unconjugated hyperbilirubinaemia.
Footnotes
Declaration of conflicting interests
The author(s) declared no potential conflicts of interest with respect to the research, authorship, and/or publication of this article.
Funding
The author(s) disclosed receipt of the following financial support for the research, authorship, and/or publication of this article: This research was funded by KAKENHI (16K10093, 17K10179).
Ethical approval
Ethics Committee Kagawa University Heisei 30–188.
Guarantor
TK.
Contributorship
SK, KK, HO, SI, TK researched literature and conceived the study, and were involved in protocol development. SK, KK collected samples. SK, KK, HO, MO, TA measured bilirubin fractions. SK wrote the first draft of the manuscript. TI, HO, TK, KM worked to obtain ethical approval. All authors reviewed and edited the manuscript and approved the final manuscript.