
Abstract
Background
Therapeutic drug monitoring (TDM) of voriconazole is recommended for personalizing doses. The objective of this study was to compare the enzyme immunoassay developed by ARKTM Diagnostics Inc. for the quantification of voriconazole adapted to the Architect C4000 autoanalyzer (Abbott®) with ultra-performance liquid chromatography using ultraviolet detector (UPLC-UV) method.
Materials and Methods
Linearity, precision and accuracy of both methods were validated according to the Food and Drug Administration (FDA) and European Medicines Agency guidelines. The limit of quantification (LOQ) of the UPLC-UV method was determined experimentally. Both methods were applied to the analysis of 62 samples from patients. Correlation was evaluated by Passing-Bablok analysis and the concordance by the Bland–Altman method. Dosage recommendations were generated; the discordances according to the technique were evaluated.
Results
All validation parameters determined for UPLC-UV met the criteria set out and LOQ of 0.1 μg/mL was established. However, when the enzyme immunoassay was used to determine concentrations ≤1 μg/ml, CVs were >20%. A linear correlation between both methods was found. However, an overestimation of immunoassay (systematic error of 0.39 μg/mL) was detected. In 11.3% of the samples, the differences in concentrations when they were determined by different techniques would imply a different therapeutic regime. These samples had concentrations close to 1 μg/mL.
Conclusion
Although both techniques can be used for TDM of voriconazole, when a value close to the lower limit of the therapeutic range is determined by the ARKTM immunoassay, it would be better to verify the result by a non-automated technique to avoid possible underdosing.
Introduction
Voriconazole is a second-generation triazole used in the treatment of invasive fungal infections. However, the large inter- and intra-patient variability in voriconazole exposure is of concern since a narrow therapeutic window between 1 and 5.5 μg/ml for trough concentration has been proposed.1,2
Although there are many techniques to determine antifungal concentrations for TDM, high performance liquid chromatography (HPLC) has become the reference methods. However, immunoassays allow for faster analysis and do not need specialized personnel, making them good candidates for use in clinical practice. The objective of this study was to compare the enzyme immunoassay developed by ARKTM Diagnostics Inc. for the quantification of voriconazole concentrations adapted to the Architect C4000 autoanalyzer (Abbott®) with an ultra-performance liquid chromatography with ultraviolet detector (UPLC-UV) method.
Materials and methods
Reagents and analytes
Voriconazole substance was provided by Sigma-Aldrich®. The commercial kit used in the immunoassay was purchased from the ARKTM laboratory (Diagnostic, Inc.). HPLC grade acetonitrile was supplied by Thermo Fisher Scientific and formic acid and trichloroacetic acid (analytical grade) by Sigma-Aldrich®.
Calibration solution was prepared by spiking drug-free human plasma with stock solution of 500 μg/mL voriconazole, in the range of 0.5–15 μg/mL. Quality controls for UPLC (QC) were prepared in the same way.
Blood trough samples in EDTA tubes obtained just before dose administration from patients on voriconazole therapy were centrifuged (3700 r/min). The protocol was authorized by the Ethics Committee of Clinical Research (CEIC number: PI2020/03/460).
Ultra-performance liquid chromatography with ultraviolet detector assay
A Waters Acquity High Pressure Chromatographer was used with UPLC-UV, performing the separation with a Luna Omega C18 column (1.6 μm; 2.1 mm x 50 mm, Phenomenex Company) and the following conditions: 0.5 mL/min flow, 261 nm wavelength, injection volume 10 μL and 40°C column temperature. The mobile phase consisted of a mixture 65/35 of formic acid 0.5% and acetonitrile. Samples (100 μL) were treated with 20 μL of trichloroacetic (20%) and centrifugation (5000 r/min), 5 min, injecting after the filtration through 0.22 μm.
ARKTM immunoassay
The equipment was calibrated following the manufacturer’s instructions. The method is linear from 0.5 to 14 μg/ml, with a limit of quantification (LOQ) of 0.5 μg/ml.
Validation
Validation was carried out following Food and Drug Administration (FDA) Guidance and the European Medicines Agency (EMA) Guideline on bioanalytical method validation.
The performance of the assays was verified by analysing samples from patients. The Pearson coefficient was calculated considering UPLC-UV as the reference. The goodness of the fitting was confirmed by Passing-Bablok regression analysis. The concordance correlation coefficient (CCC) was estimated. Deviations from linearity were determined by the CUSUM test. A Bland–Altman analysis, representing the difference in concentrations versus each mean concentration, was carried out.
The discordance in the dosage recommendations according to the technique was analysed.
Results
The methods exhibited a good linearity over the range 0.5–15 μg/ml, with a regression line: y = 0.8828 × −0.1212 (r2=0.9966) for ARKTM and y = 1.0003 × −0.0005 (r2 = 0.9999) for UPLC-UV.
A LOQ of 0.1 μg/mL was established for the UPLC-UV. UPLC-UV showed a mean recovery percentage of 100.9 ± 2.7% (CV = 2.75%), compared to 86.2 ± 7.0% (CV = 8.2%) with the ARKTM. The within-run CVs were within accepted limits for both techniques. For between-day precision, CVs were >20% when the enzyme immunoassay was used to determine concentrations ≤1 μg/ml.
Sixty-two samples from patients were analysed. The median concentration (range) by UPLC-UV and ARKTM were 2.3 (0.5–13.2) μg/ml and 2.8 (0.6–13.2) μg/ml, respectively.
A linear correlation was found in Passing-Bablok analysis (Figure 1(a)) with an agreement between both methods (CCC = 0.976). The CUSUM test showed non-significant linearity deviation (p > .20). In the Bland–Altman (Figure 1(b)), a deviation of −0.39 μg/ml and 6.5% of values outside the range (mean ±1.96 SD) were observed. (a) Passing-Bablok plot of 62 samples from patients treated with voriconazole and measured with the ARKTM immunoassay adapted to the Architect c4000 and the UPLC-UV reference method. (b) Bland–Altman analysis: the solid line indicates the mean difference between the methods and the confidence intervals for the differences are indicated by dashed lines (mean ±1.96 SD).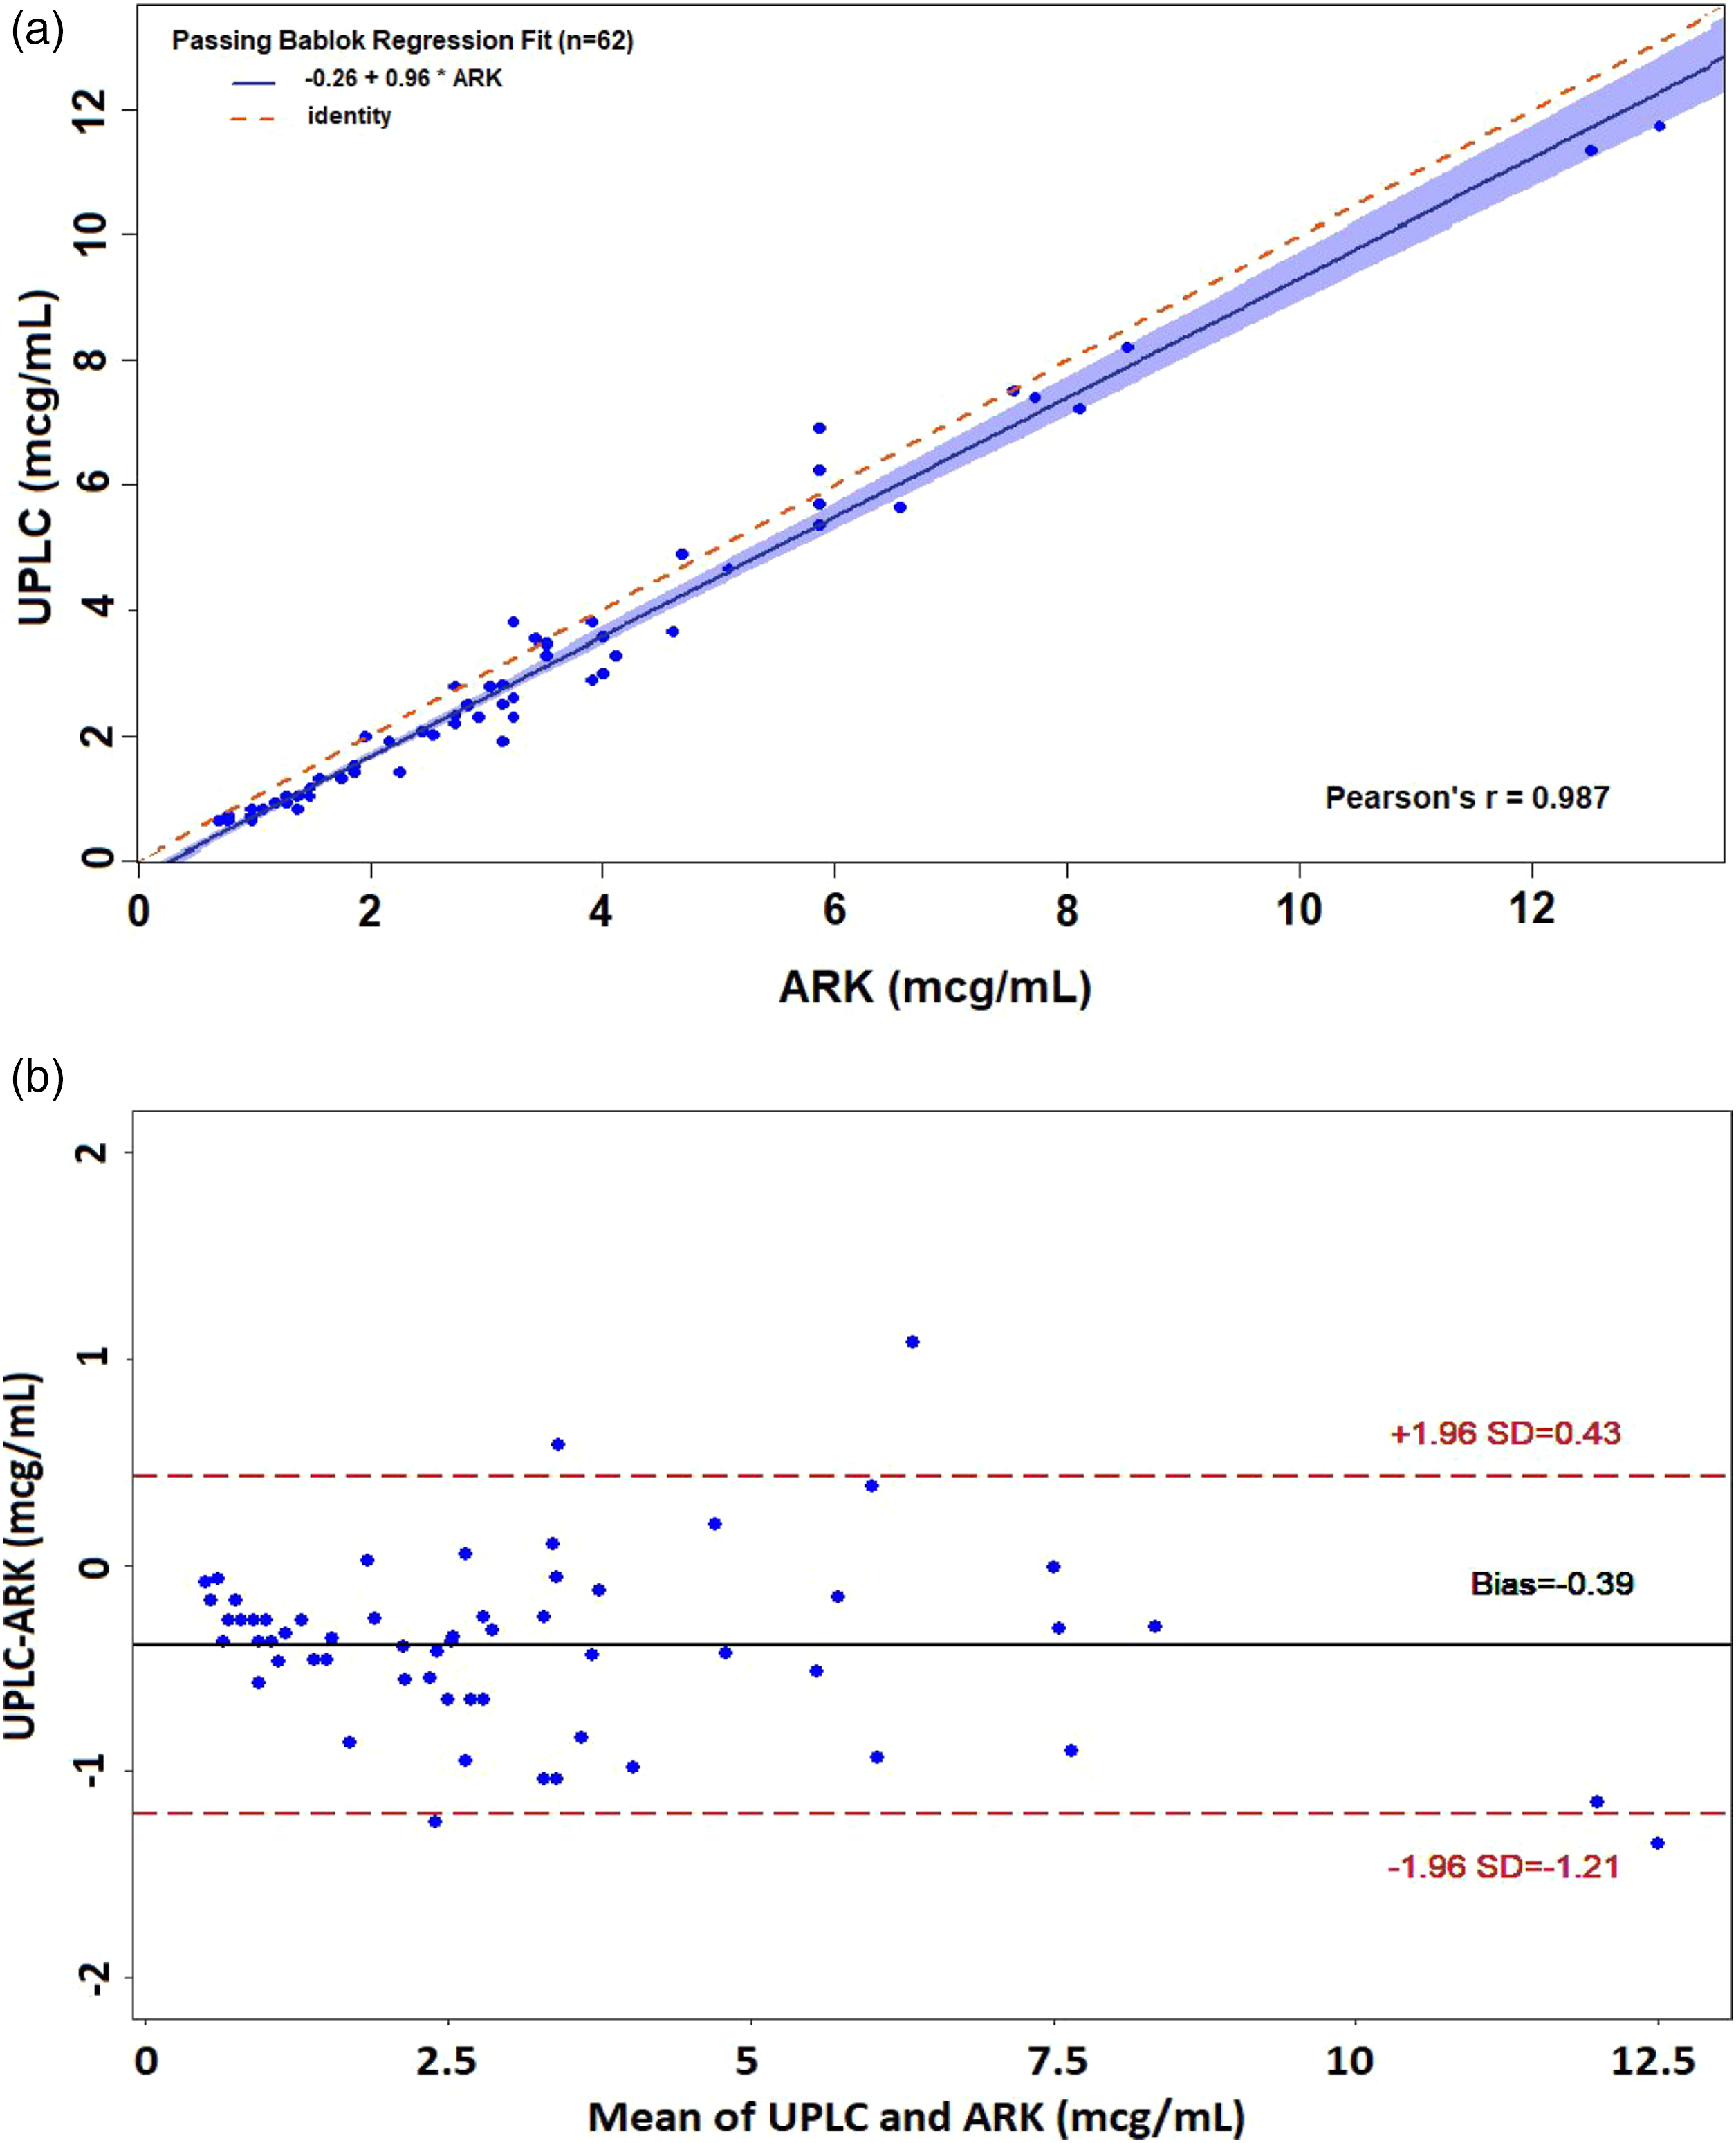
In 11.3% of the samples, the differences observed with different techniques would imply different therapeutic regimes. Concentrations of these samples were close to the lower limit of the therapeutic range and differences entailed dose increasing when UPLC-UV was used but no change when determined by ARKTM.
Discussion
Multiple techniques for the determination of voriconazole have been developed for TDM. We evaluated the performance of the ARKTM immunoassay coupled to the Architect C4000 autoanalyzer (Abbott®) as compared to a UPLC-UV method. Both techniques met the accuracy requirements. The imprecision study revealed good analytical performance for the UPLC-UV. However, the immunoassay showed up >20% between-day variation for the concentrations ≤1 μg/ml. This value is higher than that obtained by Cattoir et al. 3 (<6.8%) and Yongbum et al. 4 (<3%) and could be related to the application of the assay to an Architect c4000 analyser instead of to a Modular P800 (Roche) or TBA-200FR (Toshiba).
The LOQ of the developed UPLC-UV (0.1 μg/ml) is similar to other chromatographic methods (0.02–0.25 μg/ml). 5
An overestimation was observed with the ARKTM immunoassay, which has also been described when this immunoassay is applied on other analysers.3,4,6 According to our study, in most samples, both techniques led to similar dose recommendations. Nonetheless, they could differ with concentrations near the lower limit of the therapeutic range, leading to no change in patients who would need an increase of dose when the enzyme immunoassay is used. This could have clinical repercussions since it might lead to therapeutic failure.1,2
The analytical run time with the UPLC-UV technique is short (3 min), but the need for sample and equipment preparation make the immunoassay more convenient for clinical laboratories. Another limitation of this UPLC-UV is the lack of availability in most hospitals.
Conclusions
A new UPLC-UV method for the quantification of voriconazole concentrations with a similar processing time as automated techniques has been validated and compared to the ARKTM immunoassay implemented in Architect c4000. Although in practice, both techniques can be used, when a concentration close to the lower limit of the therapeutic range is determined by the immunoassay, it would be prudent to verify the result by a non-automated technique to avoid possible underdosing.
Footnotes
Declaration of conflicting interests
The author(s) declared no potential conflicts of interest with respect to the research, authorship, and/or publication of this article.
Funding
The author(s) received no financial support for the research, authorship, and/or publication of this article.
Ethical approval
The study protocol was authorized by the Ethics Committee of Clinical Research of our university hospital (CEIC number: PI2020/03/460).
Guarantor
NR.
Contributorship
NR and AZ-C researched literature and conceived the study. DP-L was involved in protocol development, gaining ethical approval, patient recruitment and data analysis. DP-L wrote the first draft of the manuscript. All authors reviewed and edited the manuscript and approved the final version of the manuscript.