
Abstract
Background:
Advances in analytical techniques, including salivary proteomics and gene expression analysis, have enabled the identification of thousands of proteins and specific genetic markers, providing a comprehensive understanding of salivary composition and its dynamic changes in response to therapeutic interventions.
Objectives:
To conduct the salivary proteomic analyses using the LC-MS/MS method and identify the number of proteins in the whole saliva. This study also assessed the effect of an intraoral vibration device on the expression of specific genes associated with the bone remodeling process.
Design:
This pilot project is a prospective study where salivary samples were assessed at baseline (0 day), Midpoint (15 days), and Endpoint (30 days) following the intervention.
Methods:
This study utilized an intraoral vibration device as a therapeutic intervention to observe the changes in the salivary proteomic analyses using the LC-MS/MS method. Salivary gene expression analysis was conducted for ALPL, OPN, IL1B, IL1RN, IL1R1, TNF alpha, RANKL, and RUNX2 genes.
Results:
A total of 1119 proteins in 1059 clusters at 1 minimum peptide and a 444 proteins in 384 clusters at 2 minimum peptides were identified in saliva. Out of all of the genes included in this experiment, OPN showed significant upward change at mid point (9 fold) (15 days) followed by moving toward the baseline level (2.3-fold) toward the end point (30 days).
Conclusion:
This study highlights the potential of salivary proteomics and gene expression analysis as a promising tool for biomarker discovery, emphasizing the complexity and their variability. Despite of some challenges, the advantages of whole saliva collection and the sensitivity of shotgun proteomics and gene expression analysis support its potential as a high-throughput, practical approach for future applications in the field of oral health care.
Keywords
Introduction
The National Institutes of Health (NIH) describes a biomarker as a measurable and objective indicator of standard biological functions, disease processes, or responses to therapeutic interventions. 1 Essentially, biomarkers provide unbiased insights into an organism’s physiological condition. Recent research suggests that saliva has significant potential as a biomarker, offering a non-invasive approach to screening and diagnosing various conditions. 2 One of the primary advantages of utilizing saliva as a diagnostic tool is the ease of sample collection, which does not necessitate specialized training. This feature makes saliva particularly useful for large-scale screenings involving children, the elderly, and situations requiring repeated sampling. 3 These benefits have spurred growing interest among researchers to explore the diagnostic potential of saliva further.
Often referred to as the “mirror of the body,” saliva serves as an excellent substitute medium for clinical diagnostics. 4 Like blood, saliva is a complex biological fluid that contains a diverse array of enzymes, hormones, antibodies, antimicrobial agents, and growth factors. These components can reach saliva from the bloodstream through transcellular pathways—such as passive diffusion and active transport—or paracellular mechanisms, including extracellular ultrafiltration.5 -7 Consequently, the composition of saliva closely reflects physiological states, systemic homeostasis, and metabolic or hormonal fluctuations. 8
Various analytical methods have been developed to monitor changes in salivary composition over time, including cytokine analysis, hormonal assessments, salivary gene expression profiling and salivary proteomics. Amongst them, salivary proteomics technology is the most comprehensive experiment design to identify over a thousand salivary proteins from the major salivary glands, while salivary gene expression analysis facilitates the identification of specific genes and monitors their behavioral changes over time in response to particular treatment interventions. 9 In 2008, a collaborative research team supported by the National Institute of Dental and Craniofacial Research (NIDCR) successfully mapped the human salivary proteome. This effort cataloged saliva samples from a diverse demographic, revealing that a significant proportion of salivary proteins are also present in blood and tears. 10
Whole saliva consists of secretions from major and minor salivary glands, oral epithelial cells, nasal secretions, gingival crevicular fluid, and microbial contributions.11 -15 Due to the complexity and variability of salivary composition, a range of analytical approaches is necessary to establish a complete catalog of salivary proteins. Mass spectrometry (MS)-based techniques involving tandem MS (MS/MS) combined with ultra-high performance liquid chromatography (UPLC) and electrospray ionization (ESI), have been widely adopted for protein identification.16,17 These methods, often referred to as “bottom-up proteomics,” involve enzymatic digestion of proteins into peptides, separation of the resulting peptides using UPLC, and application of MS/MS for sequence elucidation. This allows for untargeted and unbiased analysis of protein composition across various biological samples, including cells, tissues, and body fluids.18 -23
The presence of messenger RNA (mRNA) in saliva represents an emerging frontier in non-invasive diagnostics. Studies have identified saliva-derived mRNA in both healthy individuals and oral cancer patients, expanding the potential applications of saliva for gene expression analysis.24 -26 Despite the inherent instability of RNA due to the presence of ribonucleases, recent findings suggest that certain macromolecules within saliva may provide protective mechanisms, such as encapsulation within lipid or protein complexes, or association with extracellular vesicles. These protective factors challenge previous assumptions regarding the fragility of salivary RNA.27 -30
In addition to diagnostic applications, vibration therapy has gained attention in medicine for its potential to prevent or mitigate bone loss in conditions such as osteoporosis, muscular dystrophy, and cerebral palsy. High-frequency vibration (HFV) at 120 Hz and 0.3g acceleration has demonstrated promising results in restoring bone density in experimental animal models of osteoporosis. 31 When applied in conjunction with orthodontic treatment, HFV has been shown to enhance the inflammatory response in the periodontal ligament (PDL), promoting osteoclast activity and facilitating tooth movement.32 -34 These findings are supported by both in vitro and in vivo studies investigating the effects of mechanical vibration and compressive forces on PDL and bone cells.35 -38
This pilot study was designed to conduct the salivary proteomic analyses using LC-MS/MS method and enlist the number of proteins that can be identified in the whole saliva. It was also part of this experiment to evaluate the changes in the salivary composition following the daily use of intra-oral vibration devices. Furthermore, this study also assessed the effect of intraoral vibration device on the expression of specific genes associated with the bone remodeling process.
Methods
Participants
A total of 4 healthy volunteer participants were included in this pilot study. This study was approved by the Institutional Review Board of the University of Connecticut Health (IRB: 19-056-2) and conducted per the Declaration of Helsinki 39 and The reporting of this study conforms to the STROBE statement. 40 Informed consent was obtained from all study participants before their inclusion in the study. The mean age of the study participants was 30 years, and none of them had a history of autoimmune disorders, metabolic disorders, systemic disorders, malignancy, or infectious diseases. Also, no history of infectious diseases was reported in the past 6 months.
Intervention
Samples were collected from individuals at 0 days (T1), 15 days (T2), and 30-day (T3) time points. Since the beginning of the experiment, individuals were instructed to use an intra-oral vibration device (Propel™) 10 minutes per day.
Salivary Sample Collection
All study subjects were asked not to eat or drink for at least an hour before sample collection. 50 mL sterile DNase- and RNase-free tubes (Thermofisher Scientific™) were used to collect approximately 10 mL of untimulated whole saliva using a passive drooling method. Immediately after collection, samples were placed on dry ice and maintained frozen for up to 2 hours before transfer to the storage facility.
Sample Processing for the Analysis
Samples were divided into 1 mL aliquots in 1.7 mL sterile DNase- and RNase-free Denville Posi-Click™ Tubes (Thomas Scientific™, Swedesboro, New Jersey, USA) and centrifuged at 16 100 RCF and 4°C for 20 minutes. Salivary supernatant was collected and stored at −80°C and utilized for proteomic analysis, and the pellet was processed for salivary RNA extraction and gene expression analysis.
Comprehensive Proteomics Analysis of Salivary Samples
Salivary supernatant was processed for the proteomics analysis. Samples of 2 randomly selected subjects for 3 time points were prepared for analysis using untargeted shotgun proteomics via ultra-high performance liquid chromatography coupled to high-resolution tandem mass spectrometry (UPLC-MS/MS). The protein concentration of each sample was determined using the Pierce™ BCA Protein Assay (Thermo Scientific™) using the manufacturer’s standard protocol. Following the process of protein reduction, alkylation and tryptic digestion, samples were subjected to UPLC-MS/MS analysis on a Q Exactive HF Orbitrap mass spectrometer (QE-HF) coupled to an Ultimate 3000 RSLC liquid chromatograph operated in nanoflow mode as previously reported. 41 Briefly, a 120 minutes reversed-phase UPLC gradient at a 300 nL/min flow rate over a 2 µm, 100 Å, 75 µm × 25 cm Easy Spray PepMap C18 analytical column (Thermo Scientific) heated to 35°C was used to achieve high-resolution peptide separation prior to mass analysis. 41
All raw files were searched using the Andromeda search engine embedded in MaxQuant v1.6.1.0 against the Homo sapiens Uniprot proteome reference database (Organism 9606, Proteome ID UP000005640, Accessed Apr 22, 2017). 42 The following parameters were used for per search: 1% false-discovery rate filters at the peptide-spectrum match (PSM) and protein levels, tryptic cleavage specificity with maximum 2 missed cleavages, a 5 amino acid/peptide minimum, fixed carbamidomethylation on Cys, and variable protein N-terminal acetylation, oxidation of Met, deamidation of Asn, Gln, and peptide N-terminal Gln to pyro-Glu. All other parameters were left at default values. MaxQuant results for all analyses were uploaded into Scaffold 4.0 (Proteome Software, Inc.) for data visualization and analysis.
Statistical Tests
A one-way Analysis of Variance (ANOVA) test was performed to find out the level of significance between 3-time points. The student t-test was used to evaluate the level of significance between baseline T1 and T2; T2 and T3; and T1 and T3 time points. Van diagrams were prepared to evaluate the distribution of overlapping proteins amongst various samples. All statistical tests were performed using Scaffold_4.9.0 software.
Salivary Gene Expression Analysis
All procedures were performed in an RNase-free environment. All samples’ pellets were prepared for RNA isolation using the modified TRIzol (Thermo Fisher Scientific) protocol reported by Gandhi et al. 43 Using complementary DNA (cDNA) generated from RNA isolated using the TRIzol (Thermo Fisher Scientific) protocol, we examined the specificity of the RT-qPCR technique using 10 transcripts: (1) actin beta (ACTB), a housekeeping gene; (2) 18s ribosomal RNA (18s rRNA), a housekeeping gene; (3) alkaline phosphatase (ALPL), a biomineralization associated marker; (4) interleukin 1 beta (IL1B), an inflammatory marker; (5) interleukin 1 receptor antagonist (IL1RN), suppresses inflammation; (6) Osteopontin (OPN), bone remodeling; (7) Tumor necrosis factor-alpha (TNF alpha), an inflammatory marker; (8) Receptor activator of nuclear factor-κB ligand (RANKL), a bone remodeling marker; (9) interleukin 1 receptor 1 (IL1R1), an inflammatory marker, (10) RUNX family transcription factor 2 (RUNX2), an osteoblastic differentiation marker (Table 5). Primers were designed with Primer3 software (bioinfo.ut.ee/primer3-0.4.0/), and we also used the Basic Local Alignment Search Tool (BLAST; https://www.ncbi.nlm.nih.gov/tools/primer-blast/) with our RT-qPCR primer sets to eliminate the possibility of amplification of microbial transcripts. SYBR Select Master Mix (Thermo Fisher Scientific) was used to detect the quantitative expression levels of salivary transcripts. Our qPCR reaction mixture (20 μL total) comprised SYBR Select Master Mix (Thermo Scientific), forward and reverse primers (20 μM), nuclease-free water, and 2 μL of cDNA template. A Bio-Rad thermal cycler CFX 96 instrument was used, with a PCR protocol of 95°C for 10 minutes (initial denaturation) and 40 cycles of 95°C for 15 seconds and 60°C for 1 minute. Following qPCR amplification, we performed a melting curve analysis. 43
Results
The compliance to use intraoral vibration devices was reported to be above 90%. A total of 1119 proteins in 1059 clusters at 1 minimum peptide were identified in total. Furthermore, at the threshold of 2 minimum peptides, a total of 444 proteins in 384 clusters were reported. Van diagrams reporting an overlap of a number of proteins between 3-time points are shown in Figure 1.

Venn diagrams showing the overlap and variability of salivary proteins across 3 time points (T1, T15, & T30) in 2 individual sample groups. The center indicates number of proteins overlapped for all 3 time points.
Based on the ANOVA test, a total of 6 proteins have shown a significant change between 3-time points (Table 1, Figure 2). Furthermore, we conducted a comparative analysis between different time points (T1, T2, and T3) to evaluate the expression of proteins throughout the course of the experiment. The t-test between the time points T1 and T2 and between T2 and T3 showed a change in expression of 7 proteins (with 2 peptides minimum) (Table 2, Figure 3; and Table 3, Figure 4). Following the application of the t-test between the baseline (T1) and 30 days (T3) samples, 11 proteins showed significant down-regulation during the experiment (Table 4, Figure 5). Once the significant outliers are removed from the analysis, a total of 10 proteins were identified with the significant difference between T1 and T3 (Volcano plot, Figure 5).
Significant Change in the Concentration of List of Salivary Proteins Between Base Line (T1- 0 days) Versus (T2- 15 days) Versus End point (T3- 30 days).

P value < .05 deemed to be a significant change.

Scatter plot (linear regression) showing the comparison of Log10 (mean) and Log10 (Standard Deviation) of salivary protein between 3 time points (T1 = 0 days, T2 = 15 days, T3 = 30 days).
Significant Change in the Concentration of List of Salivary Proteins Between Base Line (T1- 0 days) Versus (T2- 15 days).

P value < .05 deemed to be a significant change.

Volcano plot showing the comparison of salivary protein between T1 = 0 days versus T2 = 15 days.
Significant Change in the Concentration of List of Salivary Proteins Between Base Line (T2- 15 Days) Versus (T3- 30 Days).

P value < .05 deemed to be a significant change.

Volcano plot showing the comparison of salivary protein between T2 = 15 days versus T3 = 30 days.
Significant Change in the Concentration of List of Salivary Proteins Between Base Line (T1- 0 days) Versus End point (T3- 30 Days).

P value < .05 deemed to be a significant change.

Volcano plot showing the comparison of salivary protein between T1 = 0 days versus T3 = 30 days.
Salivary gene expression analysis was conducted for ALPL, OPN, IL1B, IL1RN, IL1R1, TNF alpha, RANKL, and RUNX2 genes and fold changes for Base line (0 day), Mid point (15 days) and End point (30 days) following the intervention are reported in Graph 1. List of primers used in this experiments with efficiency and R square is provided in Table 5. Out of all of the genes included in this experiment, OPN showed significant upward change at mid point (9 fold) (15 days) followed by moving toward the baseline level (2.3-fold) toward the end point (30 days) (Figure 6).
List of Human Primers for Specific Genes Used in This Experiment.

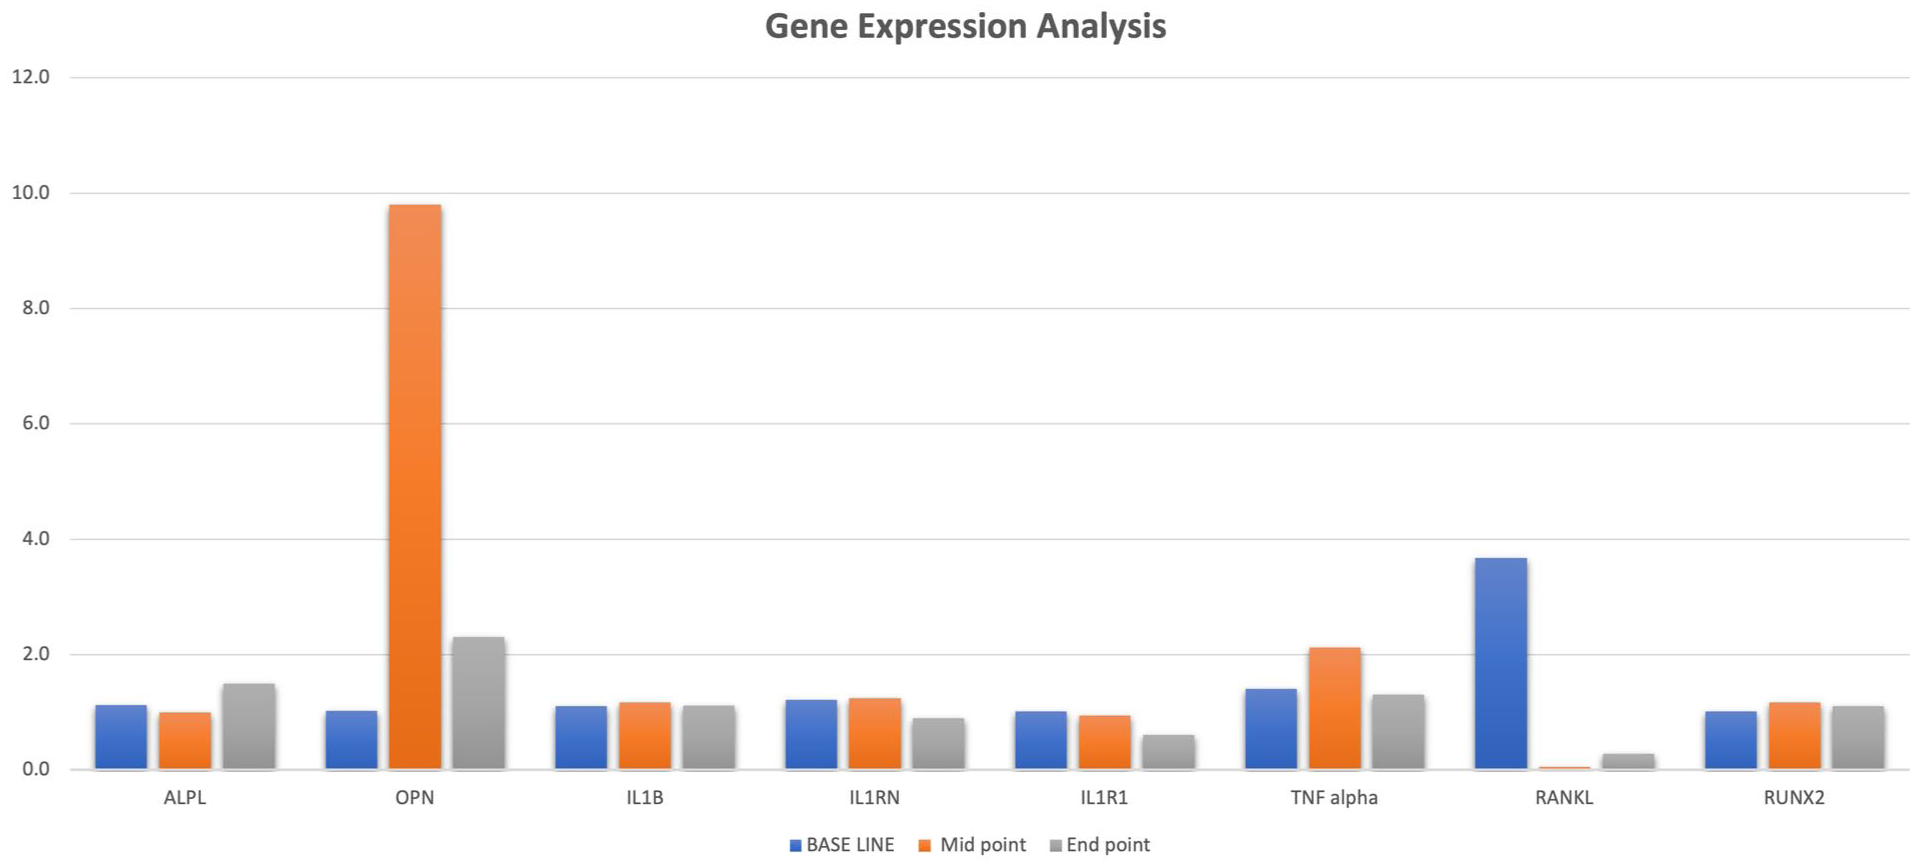
Bar graph showing the gene expression analysis (fold change) reported between 3 time points for specific genes.
Discussion
Over time, the interest in discovering and developing biomarkers capable of detecting disease at an early stage and monitoring its progression has significantly increased.44,45 These clinically relevant biomarkers primarily consist of proteins, and advancements in mass spectrometry technology, along with the sequencing of the human genome, have greatly accelerated the identification of proteomic biomarkers readily available in body fluids such as blood, saliva, and urine.46 -48 Using a peptide fractionation method coupled to cation exchange and MS technique, a group of researchers documented a total of 1939 non-redundant salivary proteins compiled from a total of 19 474 unique peptide sequences identified from the whole and ductal saliva; with 740 of the 1939 proteins were identified in both ductal and whole saliva. Furthermore, a comparative analysis of the human salivary and plasma proteomes revealed a total of 3020 plasma proteins, of which 597 overlapped with salivary proteins. 47 In our study, we identified a total of 1119 proteins across 1059 clusters, using a minimum of 1 peptide for identification. These findings highlight the potential of salivary proteomics in biomarker discovery and underscore the complexity of the salivary proteome, emphasizing the need for further exploration to fully understand its diagnostic and therapeutic implications.
The protein expression patterns identified in our study, particularly those that demonstrated significant modulation across time points, offer promising insights into the biological response to intraoral vibrational intervention. The downregulation of 11 proteins over the 30-day period may suggest a potential suppression of inflammatory or remodeling-related processes, which aligns with previous reports suggesting anti-inflammatory effects of mechanical stimulation (Table 1). Of particular interest is the dynamic expression of osteopontin (OPN), a multifunctional glycoprotein known to play a key role in bone remodeling and immune response modulation. The sharp upregulation of OPN at the 15-day mark, followed by its partial normalization by day 30, may indicate an early activation of osteogenic or reparative pathways triggered by mechanical stimuli, with a subsequent return to homeostasis. The concurrent analysis of other genes, including RUNX2 and RANKL, both integral to osteoblastic differentiation and osteoclast regulation respectively, adds a valuable transcriptomic dimension to our findings (Figure 6). These molecular trends highlight the feasibility of integrating salivary proteomic and transcriptomic biomarkers to monitor mechanotransduction-related biological changes in real time during orthodontic or oral device interventions.
About 99% of the total protein content of the plasma proteome is contributed by 22 abundant proteins. In contrast, the 20 most abundant proteins in whole human saliva constitute only 40% of the protein content. 9 Thus, it can be inferred that specificity and sensitivity of detecting biomolecules of clinical significance are comparatively easy and feasible in the saliva than blood plasma. 49 Not very surprisingly, in our experiment, we found alpha-amylase (AMY1A) as a most abundant protein, with the range of 11% to 23% of total spectra for all 4 samples at 3 different time points. Serum albumin (ALB) was the second most abundant protein with a range of 5.1% to 7.7% of total spectra.
However, unlike the relatively stable plasma proteome, the whole human saliva is highly susceptible to a variety of physiological and biochemical processes, and this presents a challenge for clinical saliva proteomics.50 -52 Also, a large dynamic range of protein concentrations in the saliva is another challenge. Furthermore, many physiological variables such as the salivary flow rate, the type of saliva (eg, stimulated vs unstimulated), genetic polymorphisms, circadian and circannual rhythms, and nature and the duration of the stimulus, may affect the composition of saliva.52 -54 For this experiment, we consistently scheduled the sample collection appointments in the morning hours and collected unstimulated saliva by the passive drooling method.
The type of saliva acquired from an individual, such as the whole saliva versus specific glandular saliva; or stimulated versus unstimulated saliva, influences the proteome biomarker discovery. 55 Moreover, saliva collection, handling, and pre-processing steps are also vital in promoting saliva as an alternative diagnostic medium to blood.56,57 The standardized method should be developed for the specific downstream applications involving either RNA, DNA, and/or protein. As an example, when analyzing salivary proteins, it is imperative to keep samples on ice during collection and processing. A study from Esser et al has demonstrated that protein degradation in the whole saliva is very rapid, and this may occur during saliva collection and handling (saliva samples processed at room temperature have increased proteolysis). 57
It is important to minimize artificial changes to saliva post-collection if one wishes to analyze the true salivary proteome. One of the ways to minimize saliva sample degradation is to minimize the time that elapses between sample collection, processing, and storage. Proteolytic activity plays a role in modifying saliva post collection, and this may then result in misleading information about the saliva proteome, that is, incorrectly identifying a pre-secretory event due to the post secretory proteolytic activity. 58 Generally, such proteolytic activity would be minimized using a protease-inhibitor cocktail after salivary sample collection; however, it increases the complexity of the sample, which may interfere with the proteomic analysis, especially when the inhibitors are peptides.
The sensitivity of mass spectrometry utilizing the shotgun proteomics approach is sufficient to detect thousands of peptides in a single run, making it highly advantageous for comprehensive proteome analysis. Unlike targeted approaches, which are restricted to predefined sets of analytes, shotgun proteomics enables the unbiased identification of a broad spectrum of peptides and proteins simultaneously. This is particularly valuable for complex biological fluids such as saliva, which contain proteins spanning a wide dynamic range of abundance. Importantly, the strategy of proteolytic digestion of large proteins into smaller peptides ensures that proteins of varying molecular weights, solubility, and structural characteristics can be effectively represented in the dataset.59,60 In this way, even proteins that are present at relatively low abundance or embedded within larger complexes can still be detected and quantified.
Moreover, shotgun proteomics significantly outperforms other analytical techniques in terms of coverage, with studies demonstrating that the number of salivary components identified using this method is more than fivefold greater than those detected by immunoassays, 2-dimensional gel electrophoresis, or other conventional proteomic platforms.59,60 This expanded coverage is critical for biomarker discovery, as it maximizes the likelihood of identifying both high- and low-abundance proteins that may play key roles in physiological or pathological processes. Additionally, the technique provides flexibility for downstream bioinformatics analyses, allowing detected peptides to be mapped back to their corresponding proteins with high confidence, thereby enabling functional annotation, pathway mapping, and comparative analysis across conditions. For these reasons, shotgun proteomics was selected as the analytical strategy in the present study. Its capacity to provide deep proteome coverage, coupled with its ability to detect proteins across a wide concentration range, made it the most suitable choice for capturing the complexity and variability of the salivary proteome in our experimental design.
In terms of gene expression analysis, the limited sample size in the present study necessitates that the findings be interpreted as an initial exploration or “proof of concept” aimed at evaluating the potential of mRNA detection in human whole saliva. Saliva is a complex biofluid, and its composition can be influenced by numerous external and intrinsic factors, which may affect its reproducibility and reliability as a biomarker source. Demographic characteristics such as age, gender, and ethnicity, as well as lifestyle habits including smoking, alcohol consumption, dietary patterns, and oral hygiene practices, have all been reported to contribute variability in salivary composition at the time of collection. These factors highlight the importance of conducting larger, more diverse cohort studies to validate the robustness of salivary RNA-based biomarkers across populations.
Whole saliva was selected as the source for RNA biomarkers, rather than salivary supernatant, because of its practical advantages and broader representation of the oral environment. Collection of whole saliva is noninvasive, rapid, and patient-friendly, which makes it highly adaptable for large-scale and longitudinal studies. However, one of the key challenges of working with whole saliva lies in the high background signal contributed by non-human RNA, predominantly derived from the oral microbiome. While this microbial RNA introduces complexity to the transcriptomic landscape, it may also provide an additional layer of information relevant to oral and systemic health. Nevertheless, disentangling host-derived signals from microbial contributions remains an important methodological hurdle for salivary transcriptomics.
The precise influence of the oral microbiome on gene expression patterns within salivary glands is not yet fully understood, raising important questions about the specificity and reliability of salivary RNA biomarkers for glandular disorders and systemic diseases. Despite these limitations, the high-throughput approach employed in this study demonstrates both feasibility and efficiency, offering a practical framework for future investigations. With the integration of improved RNA isolation techniques, standardized collection protocols, and advanced bioinformatic pipelines, salivary transcriptomics holds considerable promise as a noninvasive, scalable platform for biomarker discovery and clinical diagnostics. While salivary exosomes have been shown to provide a more stable environment for RNA by protecting transcripts from enzymatic degradation, whole saliva was chosen in this study for its ease of collection and broader applicability in a clinical setting. 61 Future work comparing whole saliva and exosomal RNA may help clarify the trade-off between stability and practicality in salivary biomarker research.
Conclusion
In conclusion, our study highlights the potential of salivary proteomics and gene expression analysis as a promising tools for biomarker discovery, emphasizing the complexity and variability. The identification of 1119 proteins across 1059 clusters demonstrates the feasibility of using whole saliva for diagnostic purposes, although factors such as demographic characteristics, lifestyle habits, and sample handling protocols must be carefully considered to ensure reliable results. Gene expression analysis further reinforces the potential of saliva as a diagnostic medium, offering insights into the dynamic molecular changes associated with disease states. However, variability introduced by the oral microbiome and environmental factors presents challenges in interpreting salivary gene expression patterns accurately. The challenges associated with saliva collection and processing, including proteolytic degradation and the influence of physiological variables, underscore the need for standardized methodologies to enhance the reproducibility of salivary biomarker research. Despite these challenges, the advantages of whole saliva collection and the sensitivity of shotgun proteomics and gene expression analysis support its potential as a high-throughput, practical approach for future studies. Further research is required to fully understand the diagnostic and therapeutic implications of salivary proteomics and gene expression analysis and to optimize their clinical applications.
Footnotes
List of Abbreviations
1. MS: Mass spectrometry
2. NIDCR: National Institute of Dental and Craniofacial Research
3. UPLC: Ultra-high performance liquid chromatography
4. ESI: electrospray ionization
5. mRNA: messenger RNA
6. HFV: High-frequency vibration
7. PDL: Periodontal ligament
8. PSM: Peptide-spectrum match
9. cDNA: Complementary DNA
10. qPCR: quantitative PCR
11. RT-qPCR: reverse transcription quantitative real-time PCR
12. BLAST: Basic Local Alignment Search Tool
List of Genes
1. ACTB: Actin Beta
2. 18s rRNA: 18s ribosomal RNA
3. ALPL: Alkaline Phosphatase, Biomineralization Associated
4. IL1B: Interleukin 1 Beta
5. IL1RN: interleukin 1 receptor antagonist
6. OPN: Osteopontin
7. TNF alpha: Tumor necrosis factor-alpha
8. RANKL: Receptor activator of nuclear factor-κB ligand
9. IL1R1: interleukin 1 receptor 1
10. RUNX2: RUNX Family Transcription Factor 2
Author’s Note
Po-jung Chen is now affiliated to Department of Advanced Specialty Sciences, James B. Edwards College of Dental Medicine, Medical University of South Carolina, Charleston, SC, USA.
Ethical Considerations
This study was approved by the Institutional Review Board of the University of Connecticut Health (IRB: 19-056-2).
Consent for Participate
Informed consent was obtained from all study participants before their inclusion in the study.
Consent for Publication
Not applicable.
Author Contributions
VG: Conceptualization, Investigation, Writing-original draft, Methodology, Validation, Visualization, Writing—review & editing, Software, Project administration, Formal analysis, Data curation. PC: Validation, Writing—review & editing, Formal analysis, Software, Resources, Supervision, Investigation. SY: Conceptualization, Funding acquisition, Investigation, Writing—original draft, Writing-review & editing, Methodology, Supervision, Resources, Project administration, Validation.
Funding
The authors disclosed receipt of the following financial support for the research, authorship, and/or publication of this article: This study was supported by Dr. Charles J. Burstone Foundation Award.
Declaration of Conflicting Interests
The authors declared no potential conflicts of interest with respect to the research, authorship, and/or publication of this article.
Data Availability Statement
Not applicable.
Artificial Intelligence
No scientific data has been generated or modified using Artificial Intelligence tools.