
Abstract
Background
Urinary 5-hydroxyindoleacetic acid (5-HIAA) is a first-line investigation for gastrointestinal neuroendocrine tumours that secrete serotonin. It also has clinical utility for monitoring disease progression and therapeutic response.
Aim
To develop and validate a liquid chromatography-tandem mass spectrometry (LC-MS/MS) method for urinary 5-hydroxyindoleacetic acid that incorporates a supported liquid extraction and 13C-labelled internal standard.
Methods
Samples were diluted in ammonium acetate containing a 13C-labelled internal standard (5-hydroxyindole-3a,4,5,6,7,7a-13C6-3-acetic acid). Supported liquid extraction was performed followed by chromatographic separation using the 2.1 × 30 mm CORTECS® UPLC® T3 column. Mass spectrometry detection (Waters Xevo TQ-XS) was performed in electrospray positive mode using the transitions 192.3 > 146.4 m/z (quantifier) and 192.3 > 118.4 m/z (qualifier) for 5-hydroxyindoleacetic acid and 198.2 > 152.4 m/z for 13C-5-HIAA.
Results
A well-defined 5-hydroxyindoleacetic acid peak was observed at 0.8 min with a run time of 2.4 min. The assay was linear (r2 > 0.99) to 382 µmol/L, with a lower limit of quantification of 5.3 µmol/L (CV <15%). Analysis of 29 external quality assurance samples showed good agreement between our method and the UKNEQAS method mean (4.7% positive bias). The intra- and inter-assay precision was within acceptable limits, and the assay was stable up to 96 h postextraction with minimal carryover.
Conclusion
We have developed a robust LC-MS/MS method with semi-automated extraction that offers an improved run time and performance over the existing, labour-intensive, HPLC method. The method was quick, precise, showed good agreement with UKNEQAS external quality assurance material and is in routine service for clinical samples.
Introduction
The term neuroendocrine tumour (NET) describes a collection of neoplasms that arise from neuroendocrine cells throughout the body, 1 which can be functional (synthesize, store and release chemical mediators such as amines, peptides and chromogranins) or non-functional (non-secretors or secretors of no clinical significance). 2 , 3
NETs of the gastrointestinal tract that secrete serotonin (5-hydroxytryptamine; 5-HT) are also referred to as carcinoid tumours and are predominantly found in the midgut. These tumours are generally slow-growing and often patients do not present to their GP with symptoms until the tumour has metastasized to the liver (∼95% of cases). 4 The patient may develop ‘carcinoid syndrome’ which describes a collection of symptoms including flushing, diarrhoea, paroxysmal abdominal discomfort, palpitations and wheezing. 4 , 5 This can be extremely distressing for the patient and have a profound impact on their social, working and family life. Therapeutic intervention can help to alleviate symptoms and limit disease progression in these patients. Therefore, the provision of a sensitive and specific diagnostic test is essential.
5-HT released by the enterochromaffin cells of the gut may be taken up by platelets, thus removing serotonin from the circulation. 6 Alternatively, hepatic monoamine oxidase can metabolize 5-HT to 5-hydroxyindoleacetaldeyde which is then oxidized to 5-hydroxyindoleacetic acid (5-HIAA) by aldehyde-dehydrogenase. 5 , 6 As the NET progresses, there will be an increase in serotonin secretion and platelet stores of the neurotransmitter will become saturated. Consequently, excess serotonin in the circulation is metabolized to 5-HIAA, a water-soluble molecule, that facilitates renal excretion. At present, urinary 5-HIAA and plasma chromogranin A are first-line investigations for patients with a suspected NET. 7 These biochemical markers are also recommended for monitoring tumour recurrence or progression in patients who have been diagnosed with a NET. 7 However, current data in the literature support the use of plasma 5-HIAA and serum 5-HIAA as an alternative to urinary 5-HIAA. 8 Whole blood and urinary serotonin may also be considered. 9 , 10
Within our laboratory, urinary 5-HIAA analysis was historically performed via high performance liquid chromatography with electrochemical detection (HPLC-ED). However, this method suffered from technical issues associated with an aging analyser which had a profound effect on turnaround times. Significant investment in liquid chromatography-tandem mass spectrometry (LC-MS/MS) technology has allowed us to develop and validate an in-house method for urinary 5-HIAA.
Materials and methods
Ethyl acetate (LiChrosolve® for LC) and methanol (LiChrosolve®hypergrade for LC-MS) were purchased from Merck® (Darmstadt, Germany). Ammonium acetate and formic acid (LC-MS grade) were purchased from Sigma-Aldrich® (Gillingham, Dorset, UK). 13C-labelled internal standard (5-Hydroxyindole-3a,4,5,6,7,7a-13C6-3-acetic acid) and certified reference material (CRM) catecholamine metabolites mix solution were purchased from Sigma-Aldrich® (Gillingham, Dorset, UK). 6PLUS1® Multilevel Urine Calibrator set was purchased from Chromsystems (Gräfelfing, Germany). Lyphochek quantitative urine control level 1–2 was purchased from Bio-Rad™ (Watford, UK). ISOLUTE® SLE+ 400 mg plate and 2 mL, 96-well sample collection plates were purchased from Biotage® (Uppsala, Sweden).
External quality assurance
Twenty-nine external quality assurance (EQA) samples, provided by UK National External Quality Assessment Scheme (UK NEQAS), were analysed in singlicate to measure accuracy. The UK NEQAS report for each sample distribution provides an LC-MS/MS method trimmed mean which was used for comparison to our method during validation. The method trimmed mean data are available at: https://birminghamquality.org.uk/. In addition, three of these EQA samples were used to calculate the assay imprecision (described below).
Sample preparation
Samples were thawed at room temperature and 1 mL transferred to a plastic tube for centrifugation (5 min, 1890 × g) prior to analysis. Using the Biotage ExtraHERA, 30 µL sample, QC, blank or calibrator was manually diluted in 120 µL distilled H2O (dH2O) in a 2 mL collection plate. Sixty microlitres of the diluted sample were then added to 210 µL 100 mM ammonium acetate (pH 7.2) containing 0.1 μg/mL (w/v) internal standard in a separate collection plate. Two hundred and twenty-five microlitres of each sample were loaded onto the SLE plate. A vacuum was applied (2 min) to allow sample to enter the sorbent matrix and the plate was allowed to incubate for 5 min at room temperature. Sample was then eluted into a collection plate via the addition of 550 µL ethyl acetate containing 1% (v/v) formic acid. The plate was incubated for a further 5 min (room temperature) before loading a final 550 µL ethyl acetate. A vacuum was applied (2 min) to ensure any remaining extraction solvent was eluted into the collection plate. The eluate was dried under a stream of air using the SPE Dry 96 micro plate evaporation system (10 min, 40°C, 50 L min−1) before reconstitution in 1.5 mL 5% (v/v) methanol and agitation on an automated plate shaker (20 min).
Liquid chromatography and tandem mass spectrometry
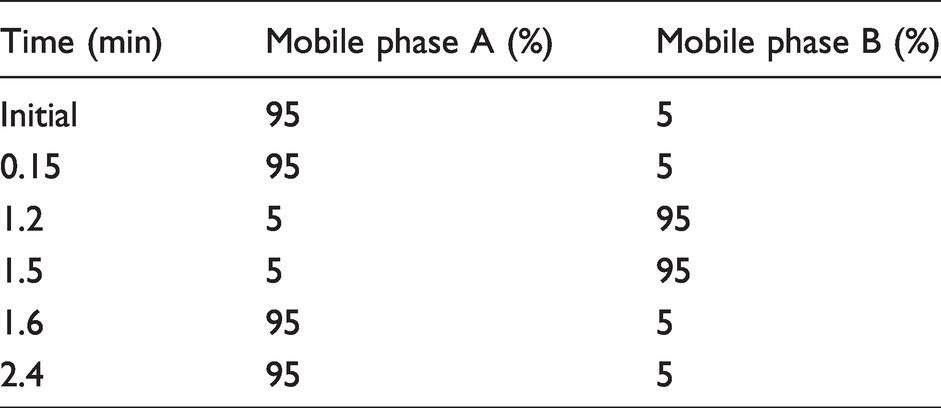
The Waters® Acquity™ UPLC system coupled to a XEVO TQ-XS (Waters, Manchester, UK) was used during method development and validation. Six microlitres of sample were injected into a CORTECS® UPLC® T3 2.1 mm × 30 mm, 1.6 μm column with a flow rate of 0.4 mL/min. Mobile phase A contained 2 mM (w/v) ammonium acetate and 0.1% (v/v) formic acid in dH2O. Mobile phase B contained 2 mM (w/v) ammonium acetate and 0.1% (v/v) formic acid in methanol. The chromatographic run time was 2.4 min. Table 1 describes the mobile phase gradient employed.
Chromatography parameters.
Positive mode electrospray ionization (ESI) and multiple reaction monitoring (MRM) were performed under the following conditions: source temperature 150°C, capillary voltage 0.94 kV, cone gas flow (150 L/h), desolvation temperature 550°C and desolvation gas flow 1000 L/h. Ion transitions are outlined in Table 2.
Optimal tuning parameters.
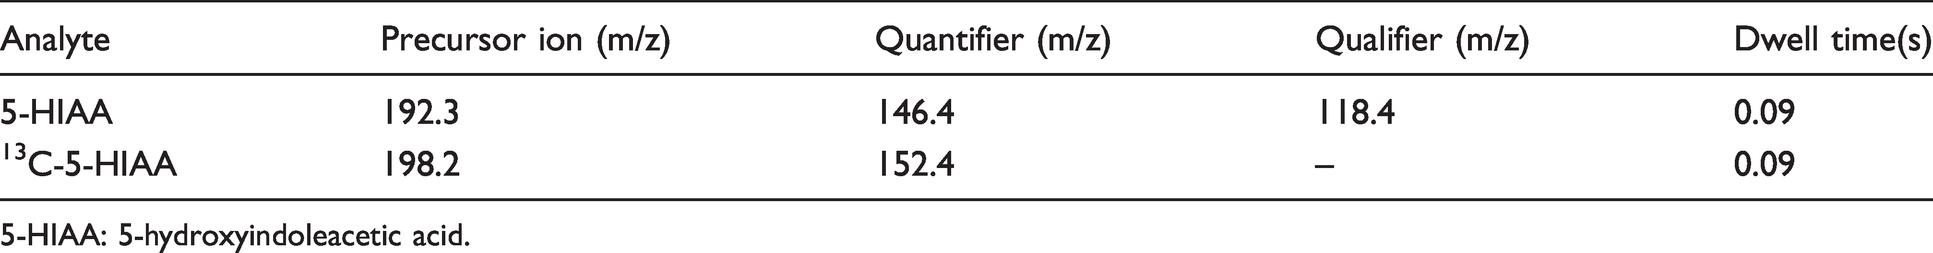
5-HIAA: 5-hydroxyindoleacetic acid.
Method validation
This method was validated based on criteria described by Clinical and Laboratory Standards Institute, 11 European Medicines Agency (EMA) 12 and the Food and Drug Administration (FDA) 13 where specified.
Qualitative assessment of matrix effects
An evaluation of ion suppression was performed by direct infusion of 5-HIAA CRM into the mass spectrometer (1 mg/L [w/v] catecholamine mix in 5% [v/v] methanol) or 13C-labelled internal standard (0.1 mg/L in 5% [v/v] methanol) at 10 µL/min flow rate. At the same time, an extracted phosphate-buffered saline (PBS) or patient sample with (5-HIAA) <10 μmol/L was injected into the LC-MS/MS system. The acceptance criteria were no obvious change in signal where 5-HIAA elutes from the column.
Linearity
To assess linearity, a six-point calibration curve was performed using the 6PLUS1 Multilevel Urine Calibrator set (0–382 μmol/L) on six separate days. The mean, SD and CV (%) were calculated, and least squares linear regression analysis was performed with 1/x weighting (TargetLynx software). The acceptance criteria for linearity were an r2 >0.99 for regression analysis and Bio-Rad QCs within the manufacturer’s target range.
LLOQ
Internal quality control material (Bio-Rad™ Lyphochek quantitative urine control level 1) was diluted in water and analysed as six replicates on one plate. The LLOQ was defined as the lowest concentration of 5-HIAA that could be measured with a CV <20%, bias <20% and no quantifier:qualifier ion area ratio (quan:qual) flag. The quan:qual ratio was accepted (no flag) if this value was within 20% of the quan:qual ratio for calibrator 3.
Recovery
Recovery was assessed using UKNEQAS EQA material (normal human urine spiked with a range of 5-HIAA concentrations; n = 8). Recovery was calculated as follows: recovery (%) = (measured–basal/target) × 100. The acceptance criterion for recovery was set at ±15% of the target. 11
Accuracy
Accuracy was assessed by comparing the result of 29 UK NEQAS EQA samples with the mass spectrometry method mean. Bland-Altman analysis was conducted to evaluate the agreement between these data (Microsoft Excel; Analyse-it®).
Precision
To calculate the intra-assay precision, three EQA samples for urine 5-HIAA (4.05, 47.0, 91.1 µmol/L) were analysed across a 96-well plate (six replicates). To evaluate the inter-assay precision, EQA samples described above were analysed in six independent assays. The mean, CV (%) and bias (%) were calculated with a CV <15% deemed acceptable for both intra- and inter-assay precision. 11 , 13
Carryover
To assess carryover, a dH2O blank was analysed immediately after the top calibrator (382 µmol/L) (n = 6). The acceptance criteria for a blank sample were set at a peak response <25% of the LLOQ. 11
Stability
To investigate the stability of extracted samples, a plate containing the six-point calibration curve and internal QCs were analysed (i) following extraction and (ii) 96 h post extraction (storage at 4°C). An r2 > 0.99 and QC values within the expected range were deemed acceptable.
Results
Using the optimized chromatography parameters described above, 5-HIAA and the IS eluted from the CORTECS® UPLC® T3 column at 0.8 min (Figure 1).
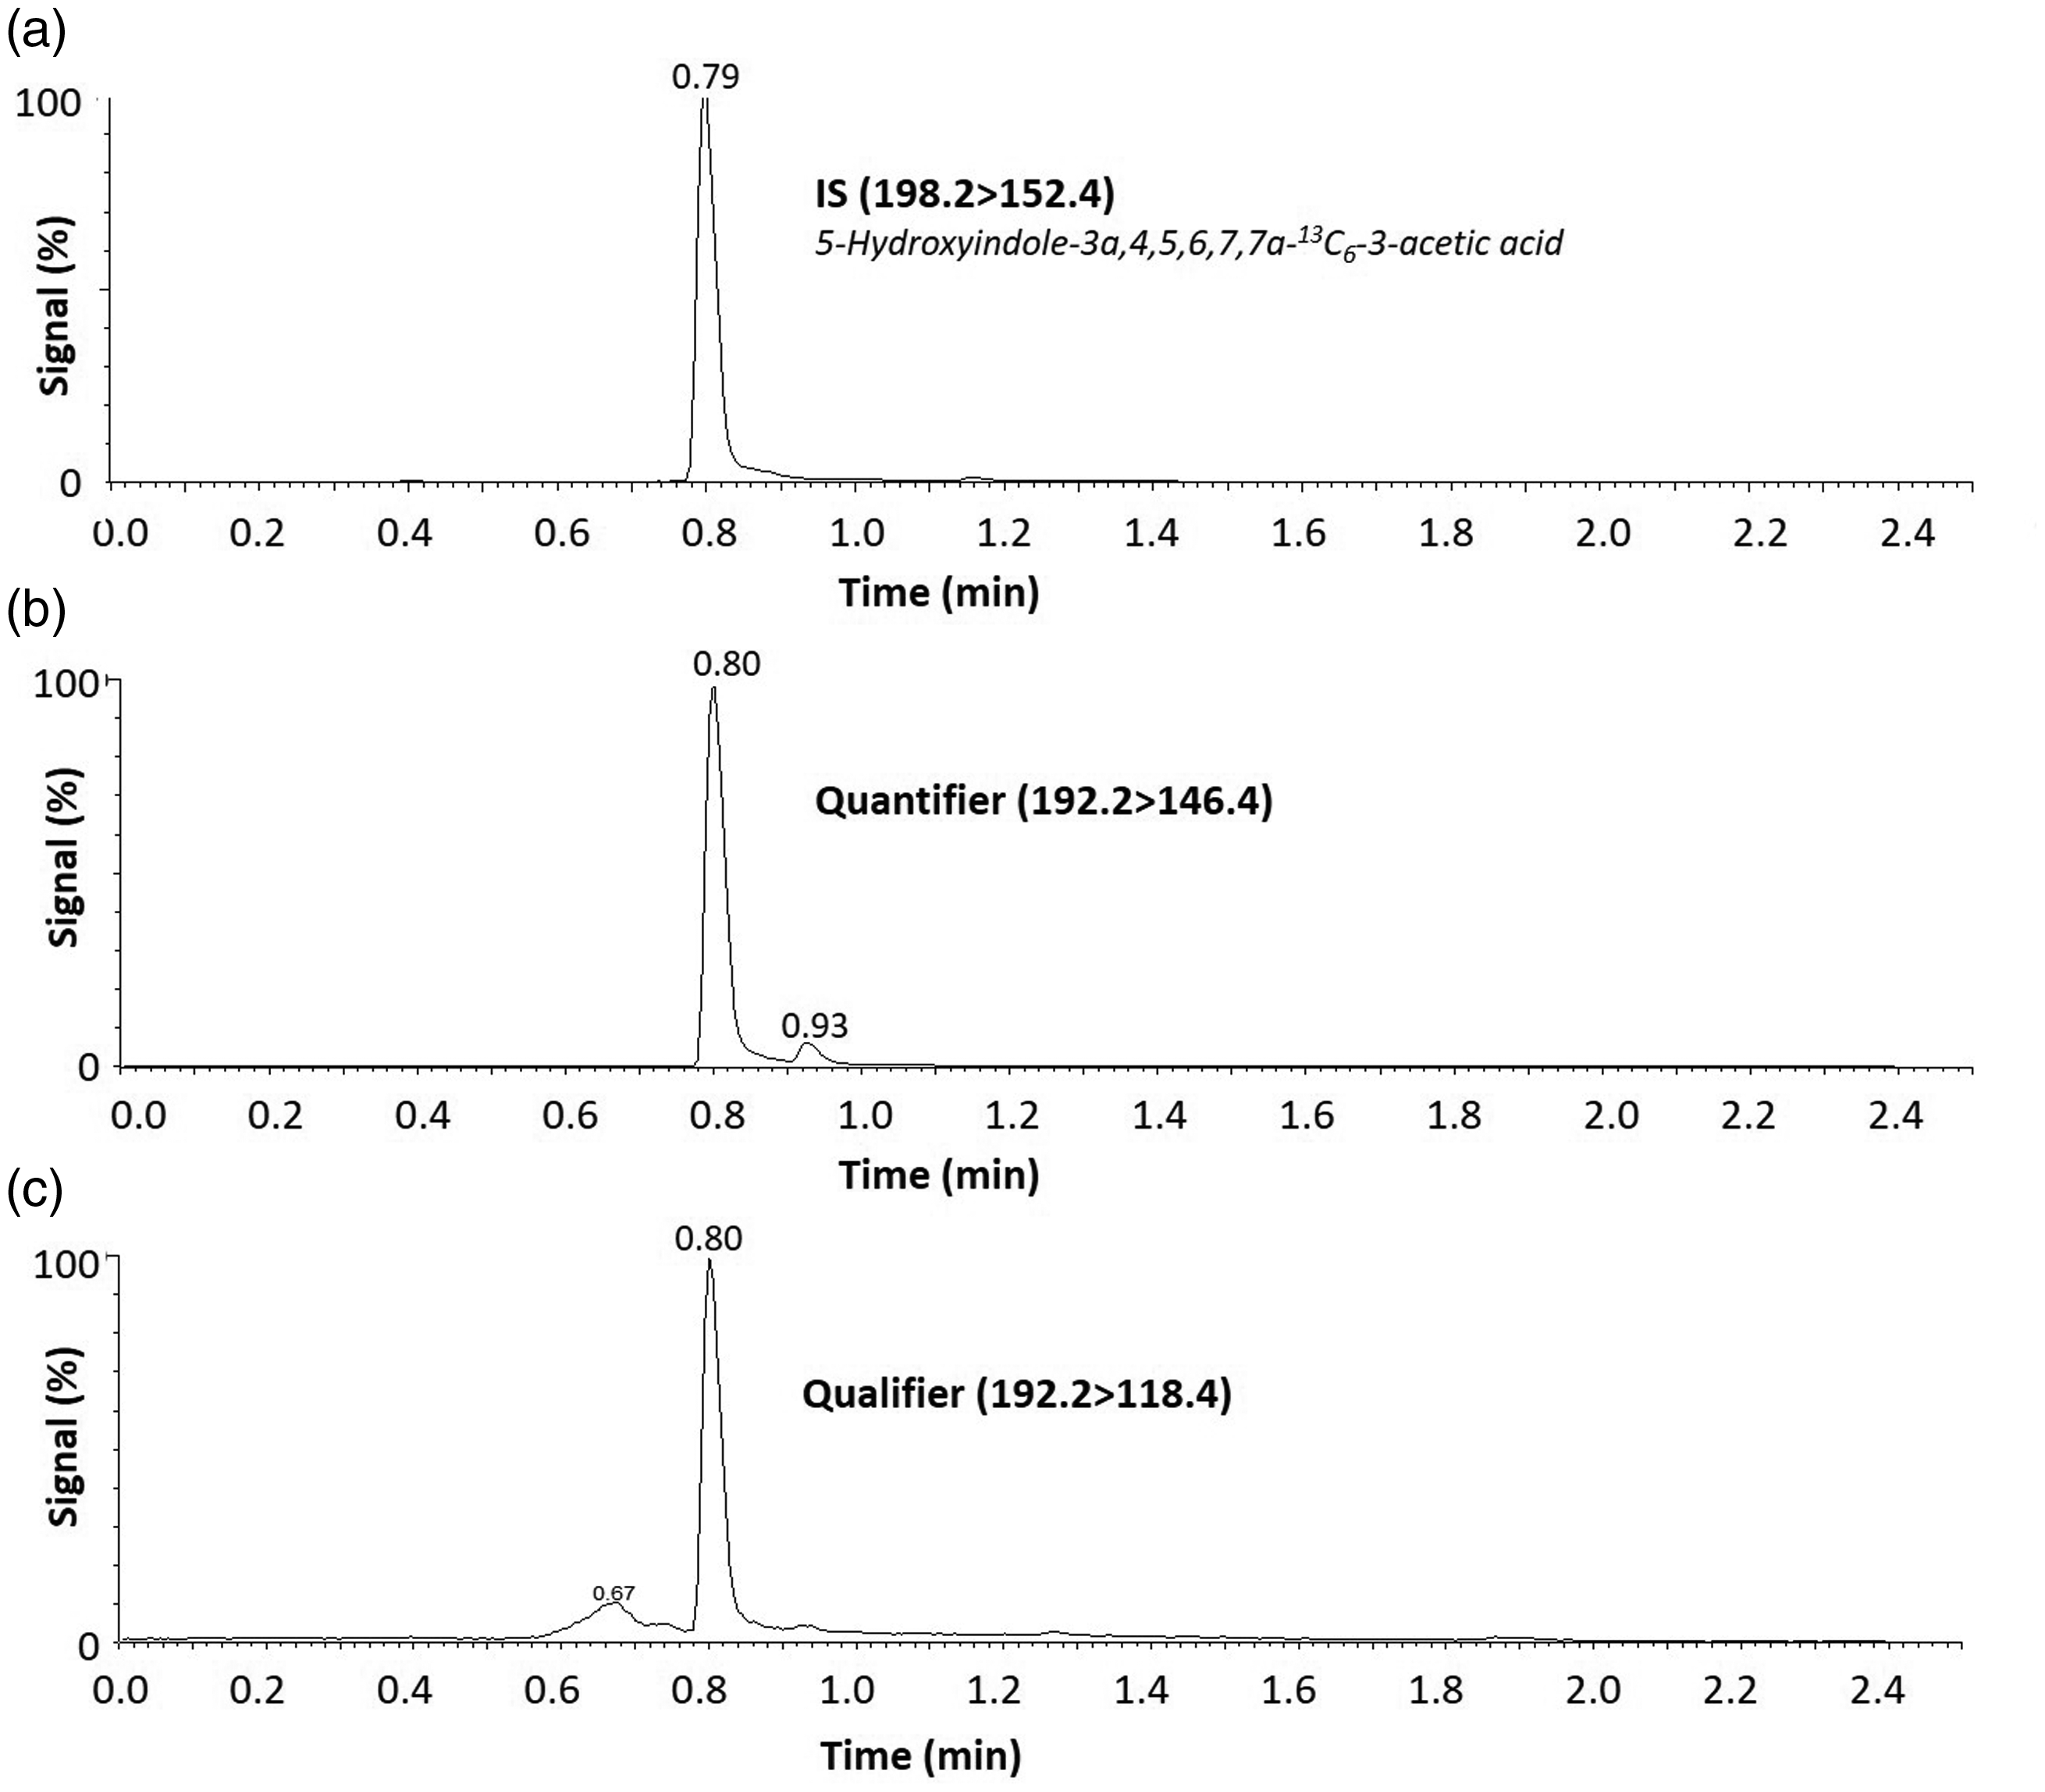
Example 5-HIAA chromatograms for each MRM transition. 5-HIAA commercial calibrator (24.5 µmol/L) was extracted and injected into the LC-MS/MS system. (a) Internal standard transition for 5-HIAA (198.2 > 152.4). (b) Quantifier (192.3 > 146.4) and (c) qualifier (192.3 > 118.4) transitions for 5-HIAA. 5-HIAA elutes from the column at 0.8 min with approximately 65% mobile phase B.
A qualitative assessment of matrix effects involved direct infusion of 5-HIAA CRM or 13C-labelled internal standard into the mass spectrometer and simultaneously injecting PBS or urine into the LC-MS/MS system. These qualitative data showed minimal evidence of ion suppression or enhancement where 5-HIAA elutes from the column at 0.8 min (Figure 2(a) to (f)).
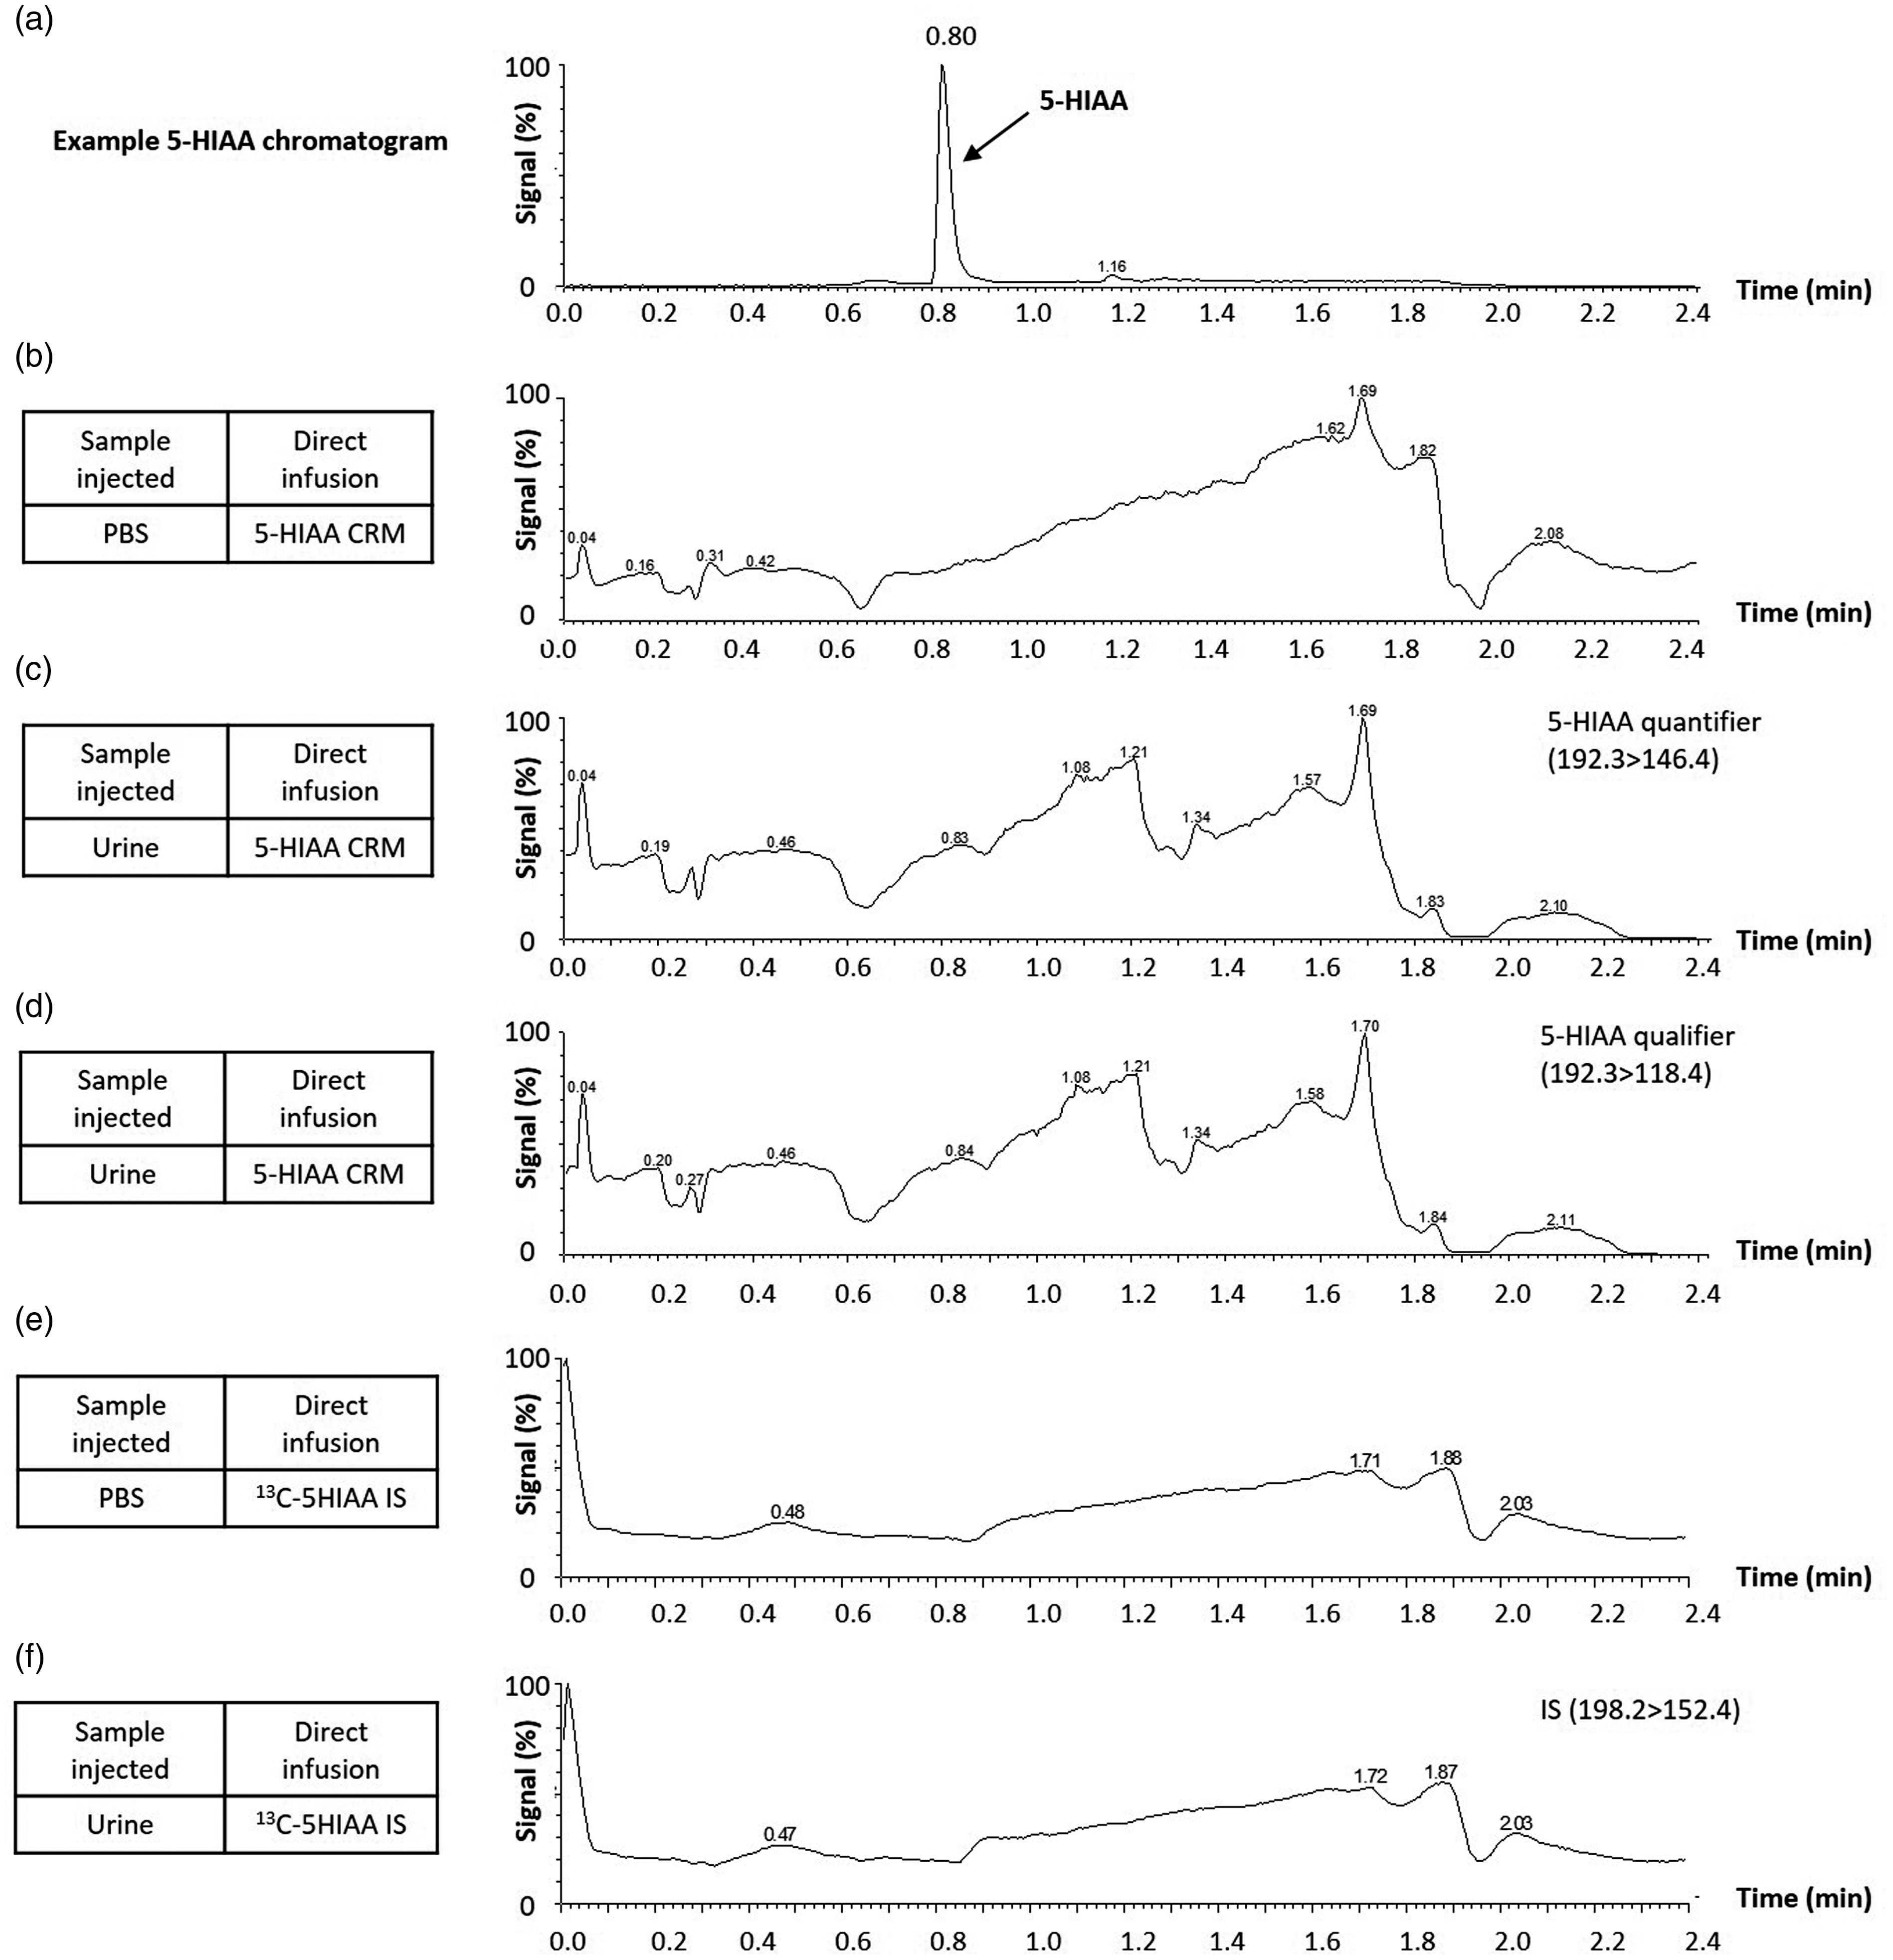
Investigation of ion suppression due to matrix effects. 1 mg/L 5-HIAA CRM (b–d) or 13C-labelled internal standard (e–f) was infused into the mass spectrometer at 10 µL/min flow rate. At the same time, PBS or a patient urine sample with low (5-HIAA) was injected into the LC-MS/MS system. (a) Example chromatogram shows 5-HIAA elutes from the column at 0.8 min (5-HIAA calibrator; 24.5 µmol/L). (b) PBS injection with 5-HIAA CRM infusion. (c) Urine injection with 5-HIAA CRM infusion (quantifier transition). (d) Urine injection with 5-HIAA CRM infusion (qualifier transition). (e) PBS injection with 13C 5-HIAA internal standard infusion. (e) Urine injection with 13C 5-HIAA internal standard infusion. A qualitative assessment showed minimal ion suppression/enhancement where 5-HIAA elutes from the column.
To assess linearity, a six-point calibration curve was performed using commercial calibrators. The assay demonstrated linearity (r2 >0.99) over the concentration range 0–382 μmol/L (Figure 3(a)), with QCs in range and acceptable deviation from calibrator target values (±15%) (Figure 3(b)).
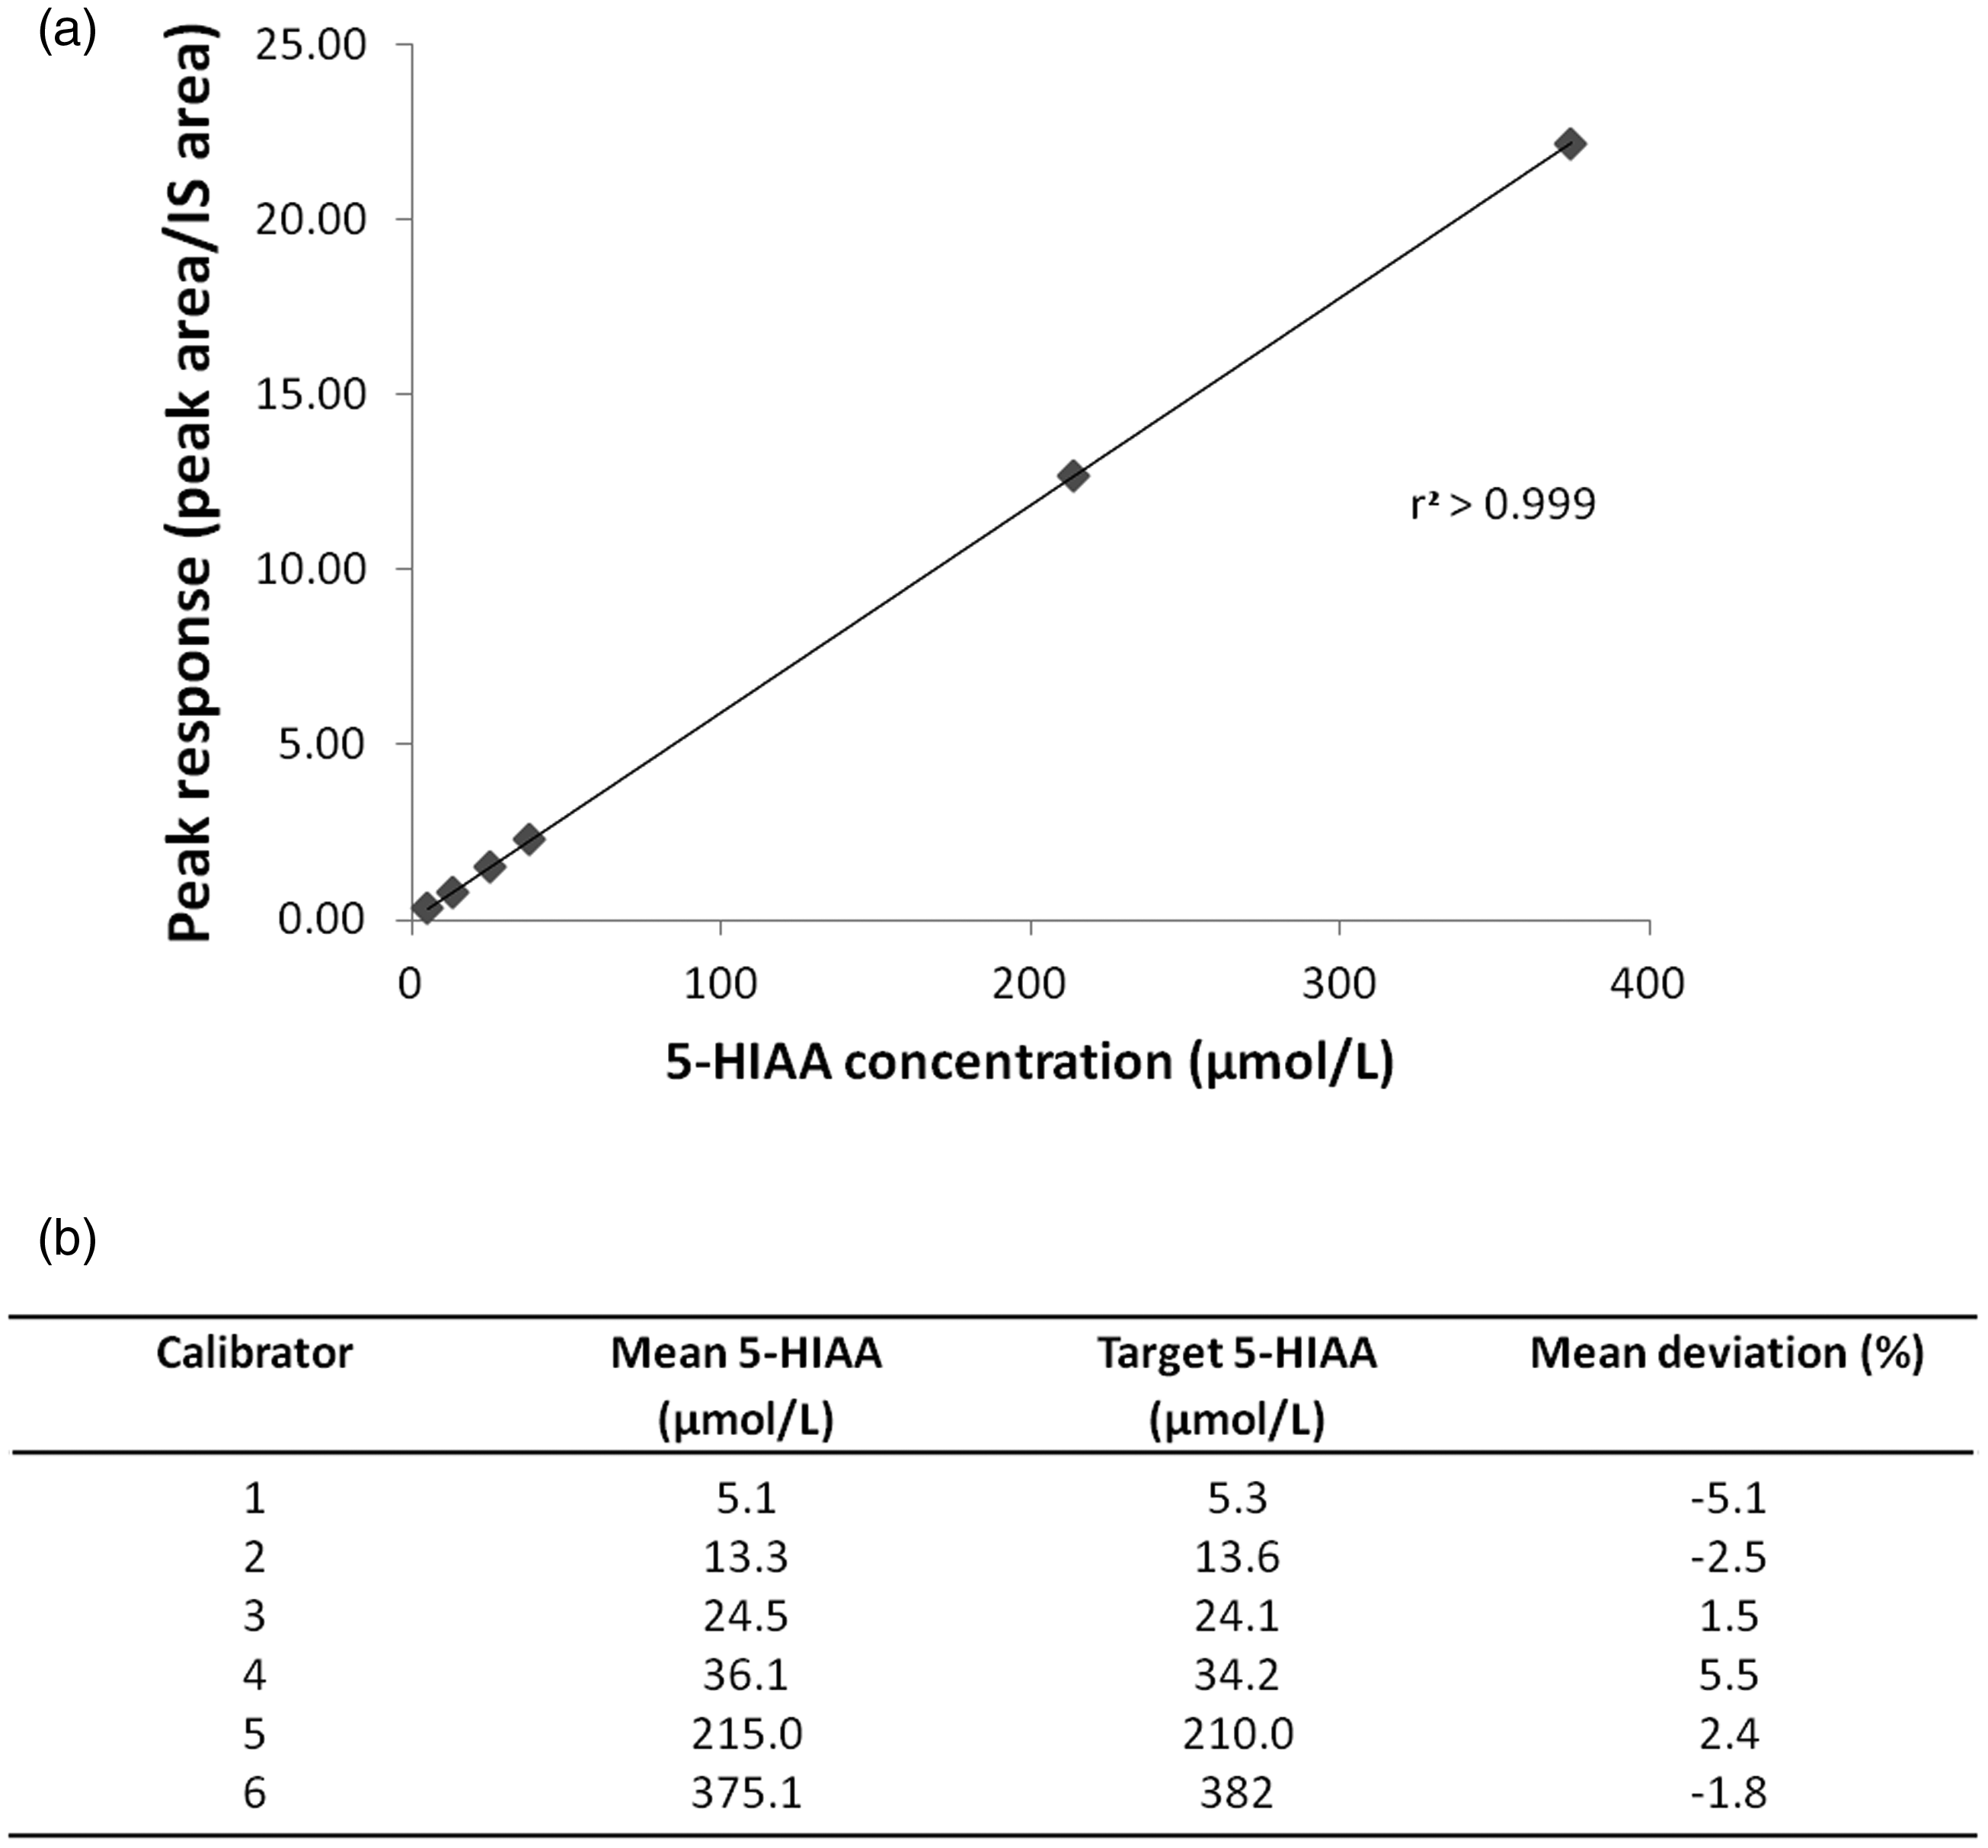
Linearity of the urine 5-HIAA LC-MS/MS method. (a) 5-HIAA calibration curve (0–382 µmol/L) (n = 6). Calibrator concentration is displayed along the x-axis and the calculated response (peak area/internal standard peak area) is plotted along the y-axis. (b) Deviation from manufacturer’s calibrator target value (n = 6).
Recovery experiments involved analysis of EQA data in which urine samples were spiked with a known concentration of 5-HIAA. These data were within the ±15% of the target (Table 3).
Recovery.
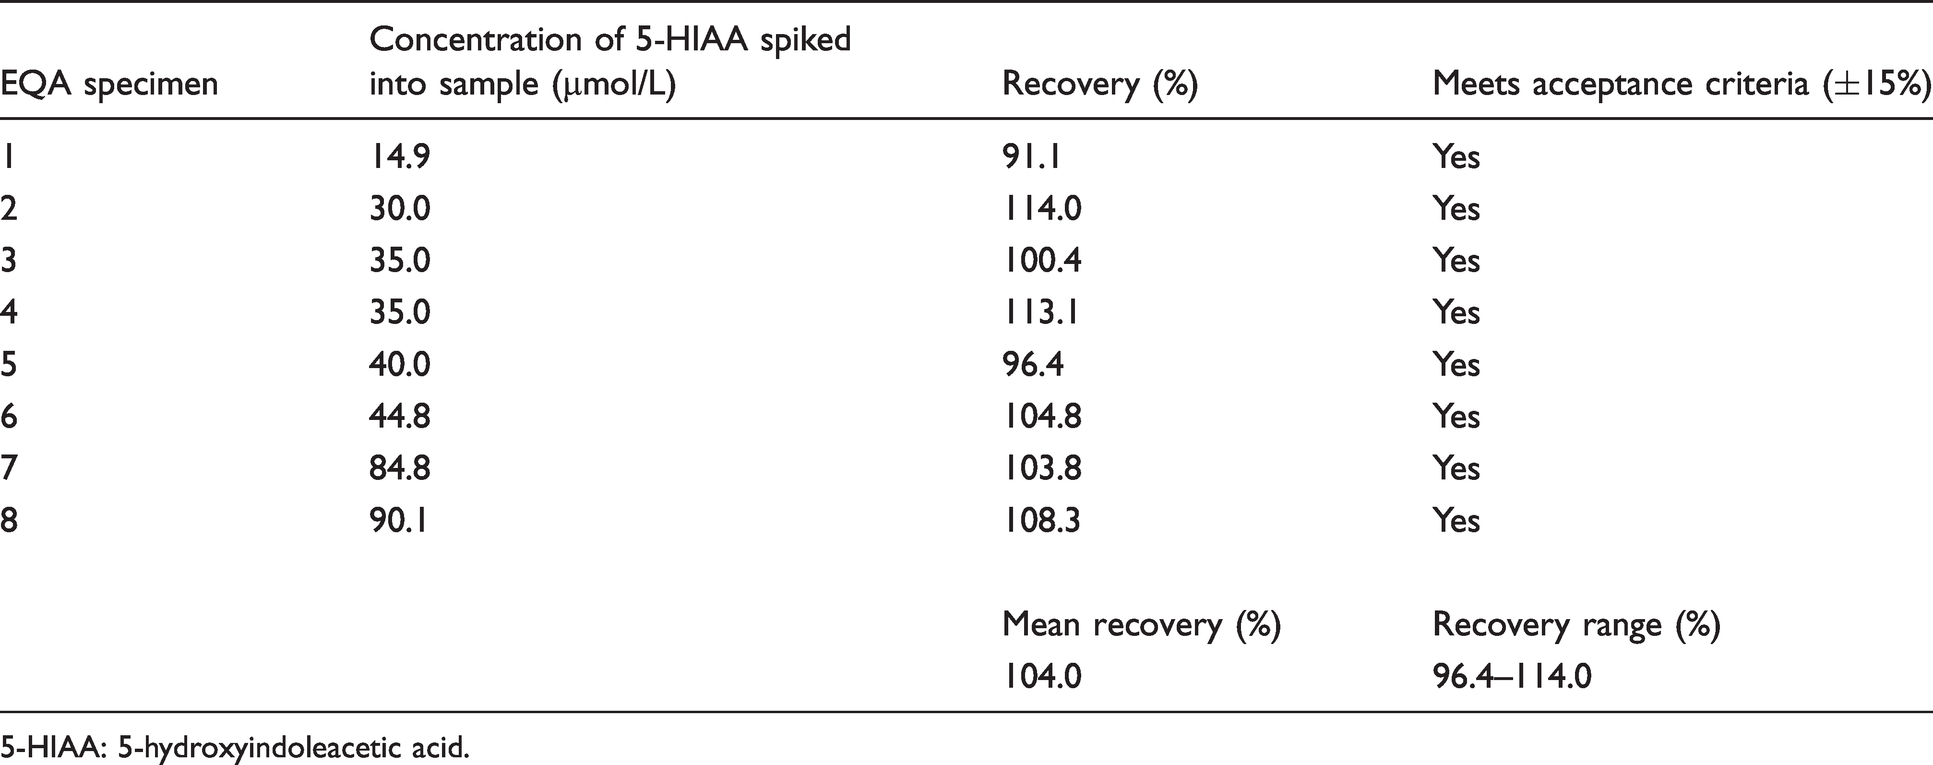
5-HIAA: 5-hydroxyindoleacetic acid.
The LLOQ was determined by diluting internal quality control material to 5.3 µmol/L and was analysed as six replicates on one plate. The mean value was 6.5 µmol/L with a CV of 2% and bias of +5.5% (Table 3). Based on CLSI C62-A guidance (CV <20%, bias <15%), the LLOQ of the assay was 5.3 µmol/L. 11
To evaluate the intra-assay precision, EQA samples that reflect a low (4.1 µmol/L), medium (47.0 µmol/L) and high (91.1 µmol/L) concentration of urinary 5-HIAA were analysed (Table 4). The intra-assay CV was within the accepted limit (<15%) based on FDA 2018 recommendations for chromatographic methods. 13 The EQA samples were analysed in replicates of six, on six separate days to provide a measure of inter-assay precision. The mean, SD and CV (%) were calculated with a CV <15% deemed acceptable. 11 , 13 The inter-assay CV for the low EQA sample (4.1 µmol/L 5-HIAA) was 17.8% which was marginally above the recommended 15% (Table 4). 11 , 13 The inter-assay precision for the medium and high EQA samples were within 15% (Table 4).
Evaluation of imprecision and lower limit of quantification (LLOQ).
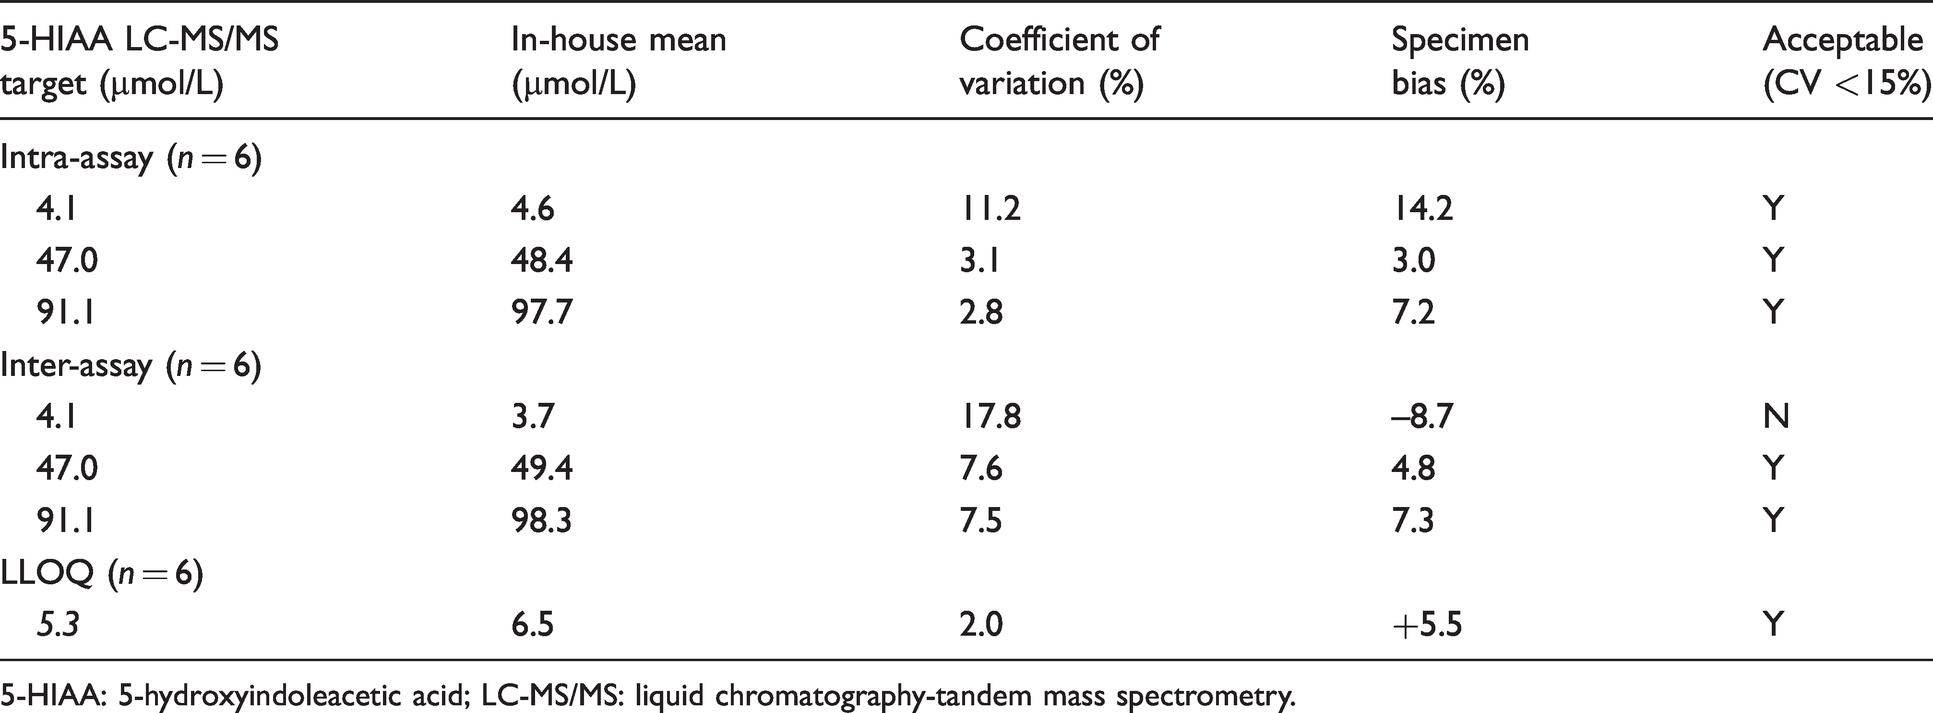
5-HIAA: 5-hydroxyindoleacetic acid; LC-MS/MS: liquid chromatography-tandem mass spectrometry.
Accuracy was assessed by comparing the in-house LC-MS/MS result with 29 EQA samples (MS method mean). The Bland-Altman plot revealed a mean positive bias of 4.7% (95% CI: 1.8 to 7.7%) for our method compared with the NEQAS MS method mean (Figure 4). One sample was out with the 95% limits of agreement (–10% to 20%) (Figure 4).
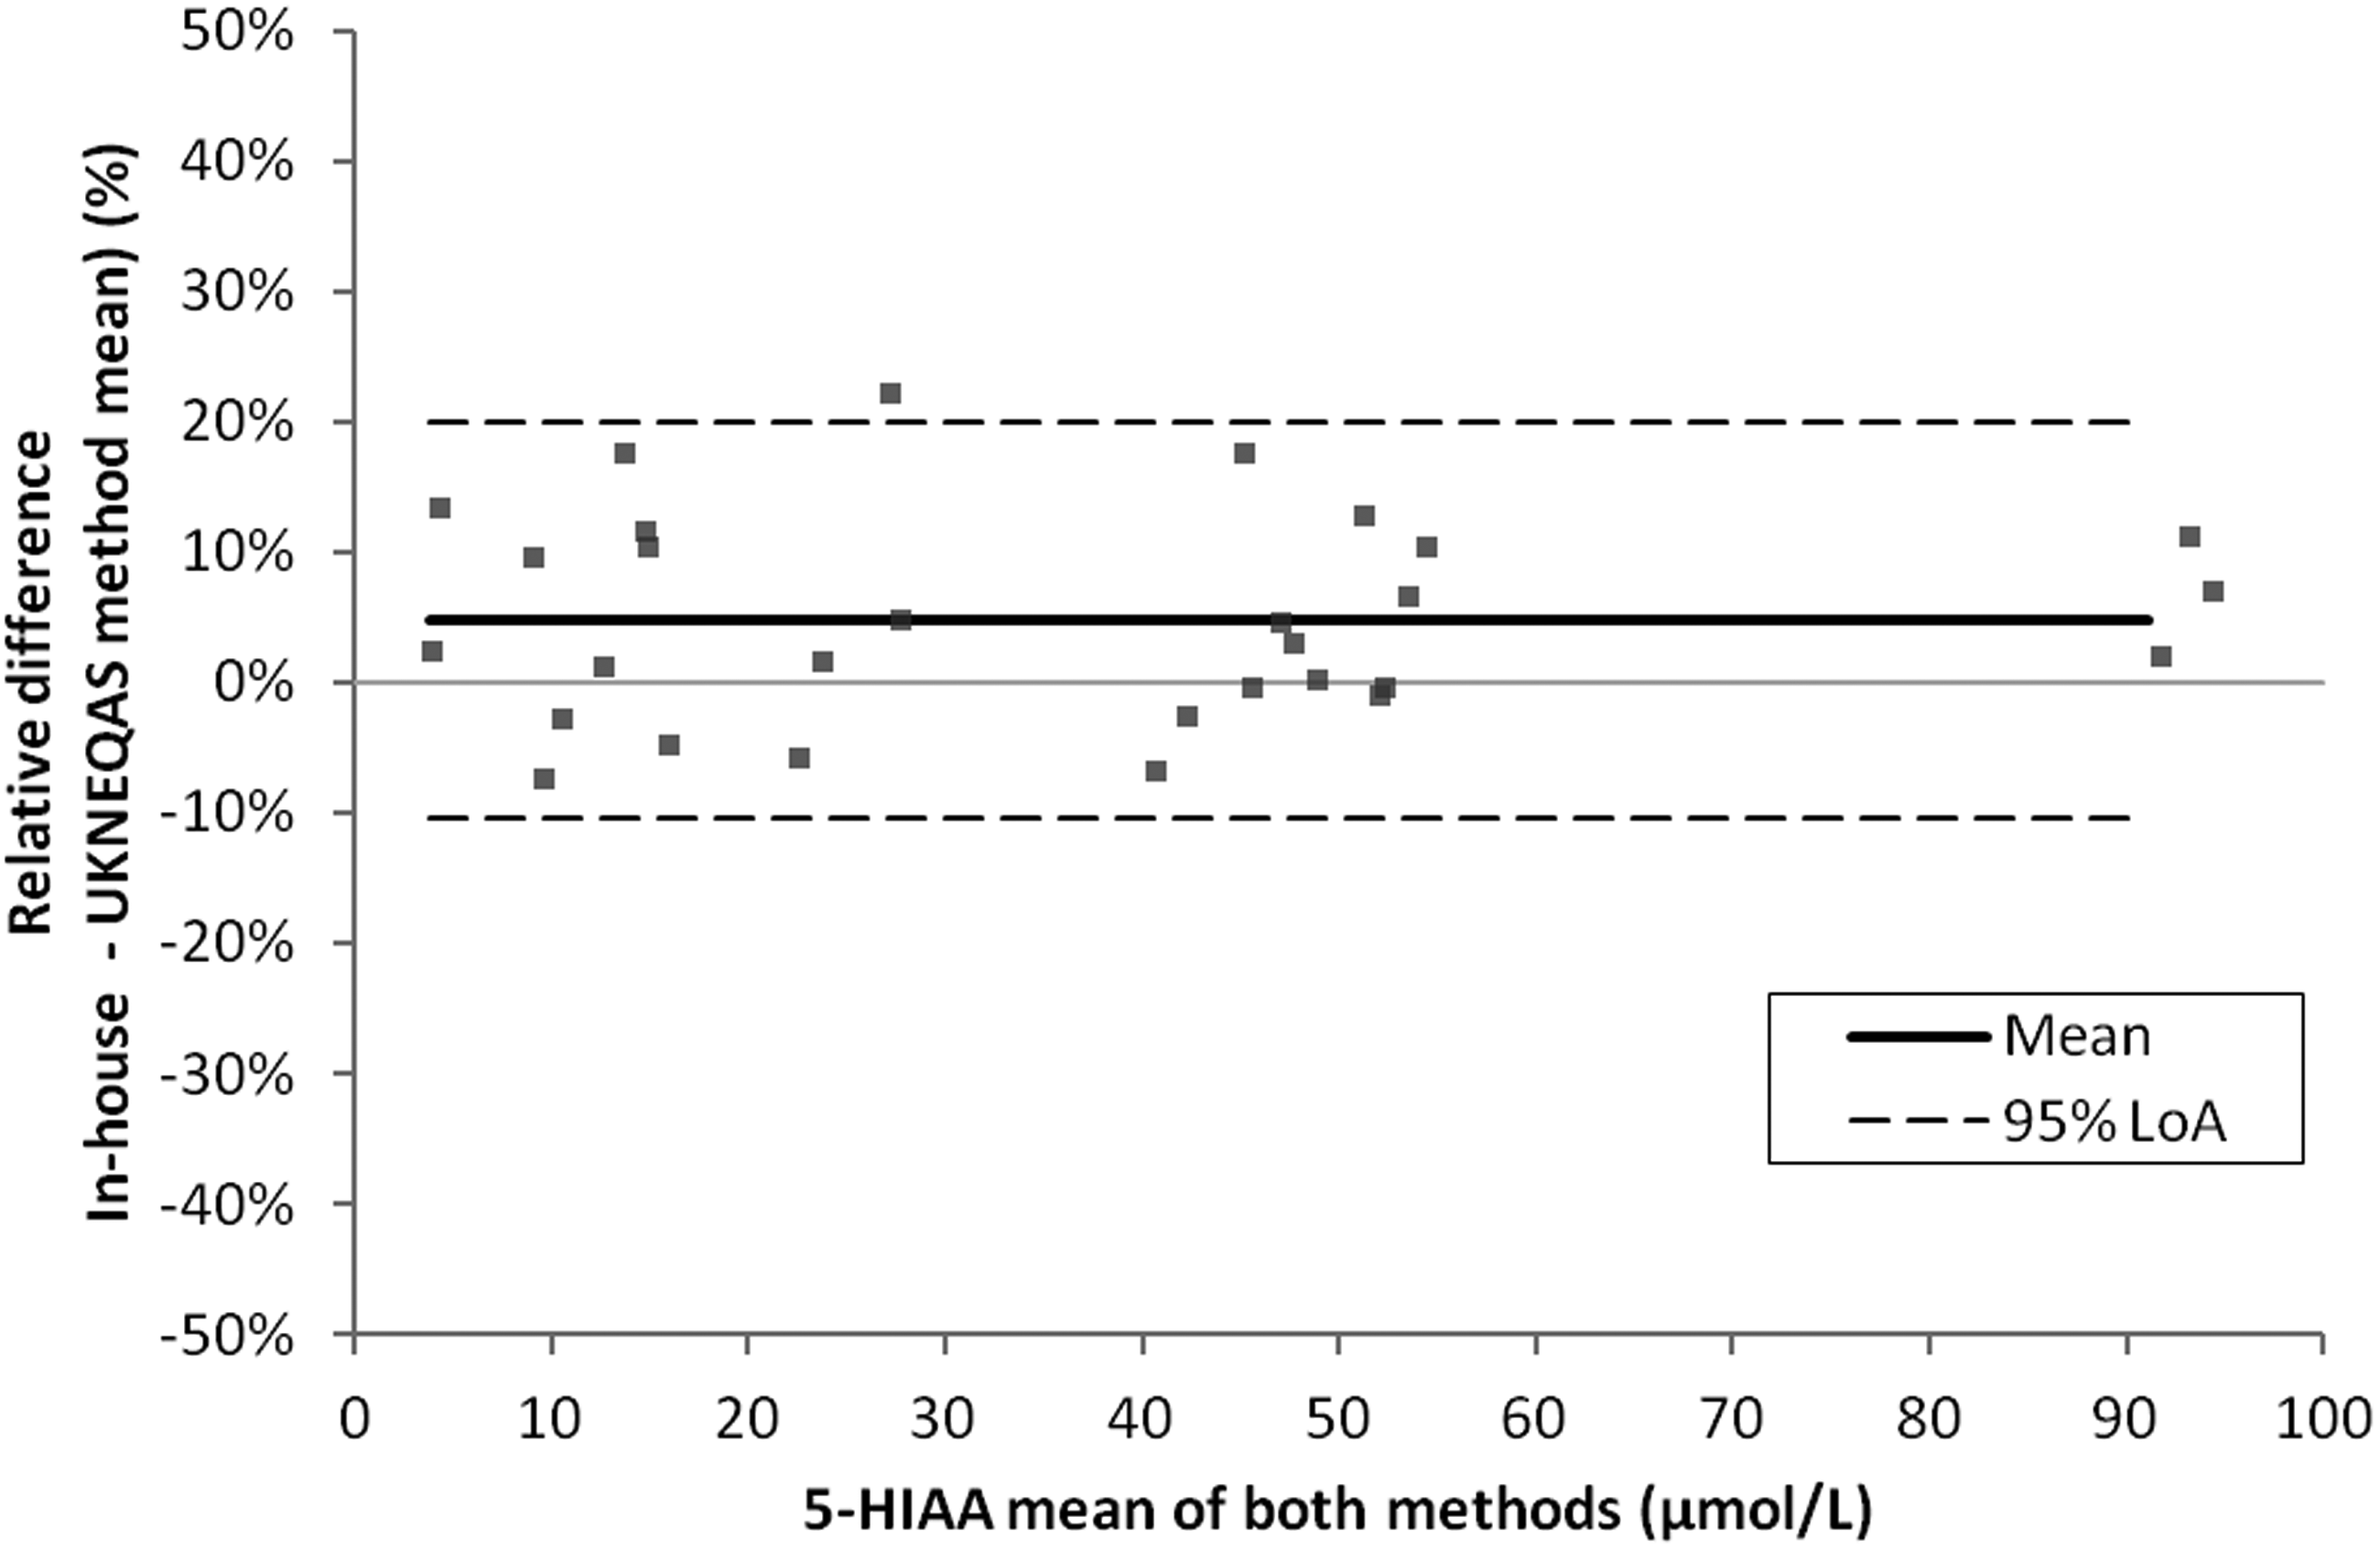
Accuracy. Urine 5-HIAA method comparison of the in-house LC-MS/MS result with the EQA LC-MS/MS method mean (n = 29). Bland-Altman plot. These data showed a mean bias of 4.7% for the in-house LC-MS/MS method compared with UKNEQAS. 95% LoA: –10% to 20%.
Post-SLE extraction stability was evaluated by analysing a validation plate (i) immediately following extraction and (ii) 96 h post extraction (storage at 4°C). An r2 > 0.99 and QC values within the target range were observed confirming stability. Minimal carryover was observed (no 5-HIAA peak integration in the blank and signal <25% LLOQ).
Discussion
The measurement of urinary 5-HIAA is recommended for the diagnosis and/or monitoring of serotonin secreting NETs. 2 , 5 , 14 Until recently, our laboratory employed an HPLC-ED assay for the quantification of urinary 5-HIAA which suffered from significant technical issues associated with an ageing analyser. This had a negative impact on turnaround times, potentially delaying patient diagnoses and required additional biomedical scientist time for troubleshooting and re-analysis.
The aim of this project was to develop and validate an LC-MS/MS method to UKAS standards for the analysis of urinary 5-HIAA that will be used in routine diagnostic practice. It is hoped that developing an assay with superior analytical performance will ultimately have a positive impact on patient care upholding the values of the NHS constitution. 15
The majority of LC-MS/MS 5-HIAA methods described in the literature employ reversed-phase chromatographic separation.16–20 Deacon highlighted that at a neutral pH, the carboxyl group on 5-HIAA is ionized. 21 As a result, the 5-HIAA molecule is too polar to be retained on a reversed-phase column. To overcome this, acid must be present in the mobile phase to limit the ionization process and permit interaction of the 5-HIAA molecule with the hydrophobic stationary phase. 21 As such, we conducted a reversed-phase column evaluation, ensuring acid was present in the mobile phases.
The Waters® CORTECS® UPLC® T3 column employs T3 bonding of the C18 ligand at a density that facilitates retention of polar and non-polar molecules. 22 This column was progressed to method development based on the excellent peak shape and reduced run time of 2.4 min (Figure 1). The existing HPLC method had a run time of 20 min per sample with a TAT of 14 days (an internal audit revealed only 64% of samples met this target). As such, the 2.4 min run time for the CORTECS® T3 column was attractive for the provision of a routine service. Instrument and staff time are important considerations for any clinical laboratory. We hypothesize that this method will not suffer from the technical issues associated with the aging HPLC kit. This, in turn, will free up staff time and improve reporting TATs while providing an assay with superior analytical performance. Finally, the reduced sample run time will allow other routine assays to be analysed on the same day (maximizing the utility of the instrument).
Components in the biological matrix which elute from the LC column at the same time as the analyte of interest can affect the efficiency of electrospray ionization. 23 , 24 We conducted a qualitative assessment of matrix effects using the postcolumn infusion technique. There was no major ion suppression observed where 5-HIAA elutes from the column (Figure 2). Interestingly, Clark et al. described a dilute and shoot method for LC-MS/MS urinary 5-HIAA, which revealed slightly larger zones of signal suppression/enhancement compared with our data. 17 Dilute and shoot methods may be more prone to matrix effects. Our method incorporates SLE which essentially performs a sample clean-up to remove matrix components and potentially limit interference.
5-HIAA is a tumour marker, and therefore new patients may present with concentrations above the measuring interval of the assay. For the purpose of monitoring disease progression and therapeutic response, it is important to dilute high samples to within the linear range for quantification. We have demonstrated that our assay was linear across the measuring interval (0–382 μmol/L) (Figure 3). In contrast, the existing HPLC method in our laboratory had a linear range of 0–200 μmol/L. The new LC-MS/MS method will therefore reduce the number of high patient samples that require repeat analysis on dilution. Interestingly, inclusion of an additional ‘high’ calibration point, manually prepared from 5-HIAA CRM (1000 μmol/L), led to variable linearity with an r2 >0.98 which did not meet the acceptance criteria specified. Moreover, blank samples (5% methanol) injected following the high calibrator resulted in 5-HIAA peak integration > 25% of the LLOQ which was deemed unacceptable carryover and therefore was not included in routine analysis. In routine service, samples above the linear range of the assay (>382 μmol/L) are subject to repeat analysis following manual dilution of the sample 1 in 5.
During initial method development, we employed a 5-HIAA internal standard isotopically labelled with five deuterium ions (5-hydroxyindole-4,6,7-D3-3-acetic-D2 acid; D5-5-HIAA). However, we observed linearity issues between different LOT numbers of manufacturer calibrators (data not shown). Linearity issues associated with the D5 IS has been reported elsewhere in the literature. 17 The authors proposed that the non-linear appearance was attributed to endogenous 5-HIAA and the D5-5-HIAA IS eluting from the chromatographic column at different times. This may be attributed to ion suppression and warrants further investigation. Our laboratory had little experience with quadratic curve fitting and so we sought to employ a new commercially available 13C-labelled IS described by Clark et al.. In addition to this, Davison et al. highlighted the issue of deuterium-hydrogen ion exchange with regard to a d5-labelled 5-HIAA IS when reconstituted in hydrochloric acid. 25 This resulted in a progressive decline in the IS peak areas over time. As such, we have selected a commercially available 13C-labelled IS which co-eluted with endogenous 5-HIAA for routine use (Figure 1). Within our laboratory, stability of the IS is monitored by recording the IS peak area during sensitivity checks for each routine assay.
Accuracy is defined as ‘the closeness of agreement between a measured quantity value and a true quantity value of a measurand’. 26 In the present study, accuracy was assessed by performing a comparison of the in-house result and target mean for 29 UK NEQAS EQA samples (Figure 4). In 2018, 13 UK NEQAS participants employed mass spectrometry and 58 participants employed HPLC to measure urinary 5-HIAA. The all lab trimmed mean (ALTM) may therefore be skewed toward the HPLC method mean. As such, regression and Bland-Altman analysis were conducted to compare the result generated for the in-house LC-MS/MS method with the UK NEQAS MS method mean. These data showed good agreement with minimal bias of 4.7% for the in-house method which was deemed acceptable 12 (Figure 4).
Evaluation of the intra- and inter-assay precision was conducted by analysing a low, medium and high EQA sample. These data were within the recommended 15% CV limit with the exception of the low EQA sample (4.1 µmol/L 5-HIAA) which had an inter-assay CV of 17.8% (Table 4). This was marginally higher than the recommended 15% CV limit. 11 We hypothesize that this observation was likely due to limited staff experience using the Biotage ExtraHERA at the time of assay validation. The assay has now been in routine service for one year with excellent EQA performance. Moreover, in routine clinical service, we do not report 5-HIAA concentrations below 10 µmol/L. The highest EQA sample available in sufficient quantity was 91.1 µmol/L 5-HIAA. Ideally, the high EQA sample should be closer to the top of the measuring interval (382 µmol/L). An alternative would be to spike a known concentration of 5-HIAA CRM into a normal urine sample and calculating the % recovery. 11 The LLOQ of this assay was 5.3 µmol/L (Table 4). Although higher than other LC-MS/MS methods cited in the literature, 19 , 20 this LLOQ met the clinical need of our service users.
5-Hydroxytryptophol (5-HTOL) has been described as a potential interferent in the literature. 17 However, the authors noted that in one year, this affected only 0.7% of samples and therefore represents a small proportion of samples that could not be reported. 17 Due to the low frequency of 5-HTOL interference reported, we did not investigate this in our method.
In conclusion, we have developed and validated an LC-MS/MS method to UKAS standards for the quantification of urinary 5-HIAA employing a 13C-labelled IS. The method was linear, precise, stable and demonstrated excellent agreement with UKNEQAS EQA material. The semi-automated, SLE together with the LC-MS/MS run time of 2.4 min per sample provides a rapid and robust method which has been in routine service for one year.
Footnotes
Acknowledgements
None.
Declaration of conflicting interests
The author(s) declared no conflicts of interest with respect to the research, authorship, and/or publication of this article.
Funding
The author(s) received no financial support for the research, authorship, and/or publication of this article.
Ethical approval
Not applicable.
Guarantor
KMG.
Contributionship
KMG and CL co-first author; KMG, CL, KS and SJ: experimental design for method development and validation; KMG and CL: performed the laboratory investigations involved in method development; KMG and CHL: performed the validation analysis; KMG: wrote the draft article; KMG, CL, KS and SJ: revised the draft article for submission.