
Abstract
Background
The revised national guidelines for analysis of cerebrospinal fluid for bilirubin in suspected subarachnoid haemorrhage (UK) provide an objective means of assessing cerebrospinal fluid samples to determine the risk of subarachnoid haemorrhage. The guidelines are intended for general use, but samples rendered uninterpretable due to the presence of the antibiotic doxycycline have been described. Here, further cases of antibiotic-based interference, and their implications, are presented.
Methods
An archival search of cerebrospinal fluid spectra performed at Hallands County Hospital Halmstad was performed for the years 2011 and 2016–2019 in an attempt to locate instances of interference. Each case of suspected interference was further investigated with in vitro reproduction experiments as a means of confirmation and assessment of potential clinical impact.
Results
A total of 10 cases of cerebrospinal fluid curve interference were discovered: six due to doxycycline, three due to metronidazole and one due to tetracycline. Interference caused by the tetracycline class was revealed through in vitro experimentation to cause an apparent decrease in the sample’s net bilirubin absorbance; the presence of xanthochromia on visual inspection was, however, conserved.
Conclusions
The problem of cerebrospinal fluid absorbance curve interference might be more common than previously suspected. Due to the potential net bilirubin absorbance-lowering effect of tetracyclines, the author recommends visual examination of cerebrospinal fluid samples in every case.
Keywords
Introduction
The national guidelines (UK) provide a framework for interpretation of cerebrovascular fluid (CSF) samples for diagnosis of subarachnoid haemorrhage (SAH). 1 An absorbance curve is generated by analysing a CSF sample with a spectrophotometer, which is in turn interpreted by the procedure described in the guidelines. The presence of bilirubin normally supports a diagnosis of SAH. As the guidelines are intended to be generally applicable, the discovery of a curve that was not interpretable according to the guidelines was unexpected, and, due to a lack of literature on this specific issue, this problem was further investigated and revealed to be due to the presence of an interfering substance, the antibiotic doxycycline. 2 The current article represents an attempt to answer the questions that have arisen as a result of this case: how often the problem of interference occurs, whether substances apart from doxycycline can cause interference, the clinical outcome of interference and how these problems might best be dealt with. Taking into account the wealth of evidence behind the guidelines,3,4 and to maintain objectivity, this article will primarily concern itself with uninterpretable/borderline-uninterpretable scans; scans that have been affected in subtler ways will be sought, but given the complexity of the issue and the number of potentially interfering substances, any estimation of the true extent of absorbance curve interference will most likely be an under-estimation.
Method
An archival search of CSF absorbance curves performed at Hallands County Hospital, Halmstad (Sweden) by the author between January 2016 and December 2019 was conducted in order to assess the frequency of interference. In order to investigate whether the problem had changed over time, absorbance curves performed between January 2011 and December 2011 were also included in the archival search. Absorbance curves were divided into two categories: those suspected of interference and those not suspected of interference; the former were then further investigated to ascertain if interference did in fact occur. Curves were defined as being suspected of interference if peaks (that is, local maxima) were present in positions other than those expected of oxyhaemoglobin, bilirubin and methaemoglobin. Curves suspected of interference were investigated with a review of medications at the time of lumbar puncture. The absorbance characteristics of each medication were compared with the interference pattern of each corresponding CSF absorbance curve. A selection of curves not suspected of interference were also further investigated with medication lists for comparison purposes. A curve was defined as being affected by interference according to the following criteria: The pattern of interference corresponds to that which would be expected from doxycycline therapy, that is, the presence of an interference peak at 370 nm as described in a previous publication.
2
Or: The pattern of the interference corresponds to that which would be expected from another substance to which the patient was exposed at the time of lumbar puncture.
And: 3. The maximal absorbance of the interference pattern corresponds to that which would be expected from the dose of the substance to which the patient was exposed at the time of lumbar puncture.
And: 4. The pattern of the interference can be re-created in vitro through the addition of the interfering substance to a CSF sample.
Potential effect on clinical outcome was assessed through the addition of substances shown to cause interference to CSF samples (for a more detailed description, see below and Supplementary Method Information). Each curve was interpreted before and after the addition of interfering substance so that a comparison could be made. CSF samples were visually examined to assess the effect of each interfering substance on the presence or absence of xanthochromia. The clinical record of each patient affected by CSF absorbance curve interference was reviewed.
Results
Types of interference discovered
One case of tetracycline interference, three cases of metronidazole interference and six cases of doxycycline interference were discovered during the study period (see Table 1, Figure 1, Supplementary Figure, Supplementary Table) out of a total 404 absorbance curves reviewed (117 in 2011, 71 in 2016, 53 in 2017, 87 in 2018 and 76 in 2019). All patients were being treated with the relevant antibiotic at the time of lumbar puncture with the exception of the two metronidazole cases in 2011 both of which were being treated with metronidazole until the day before lumbar puncture. The absorbance maxima of tetracycline, 5 metronidazole 6 and doxycycline 7 correspond to those observed in the absorbance curves. Tetracycline, metronidazole and doxycycline are known to cross the blood–brain barrier.8–10 In vitro experiments to reproduce the spectrophotometric findings were confirmatory for each antibiotic at physiologically relevant concentrations2,8,11–13 (although the paucity of data concerning tetracycline in human CSF should be noted). The half-lives of these medications would also support their presence in the CSF at the time of lumbar puncture.12–14
Summary of results.
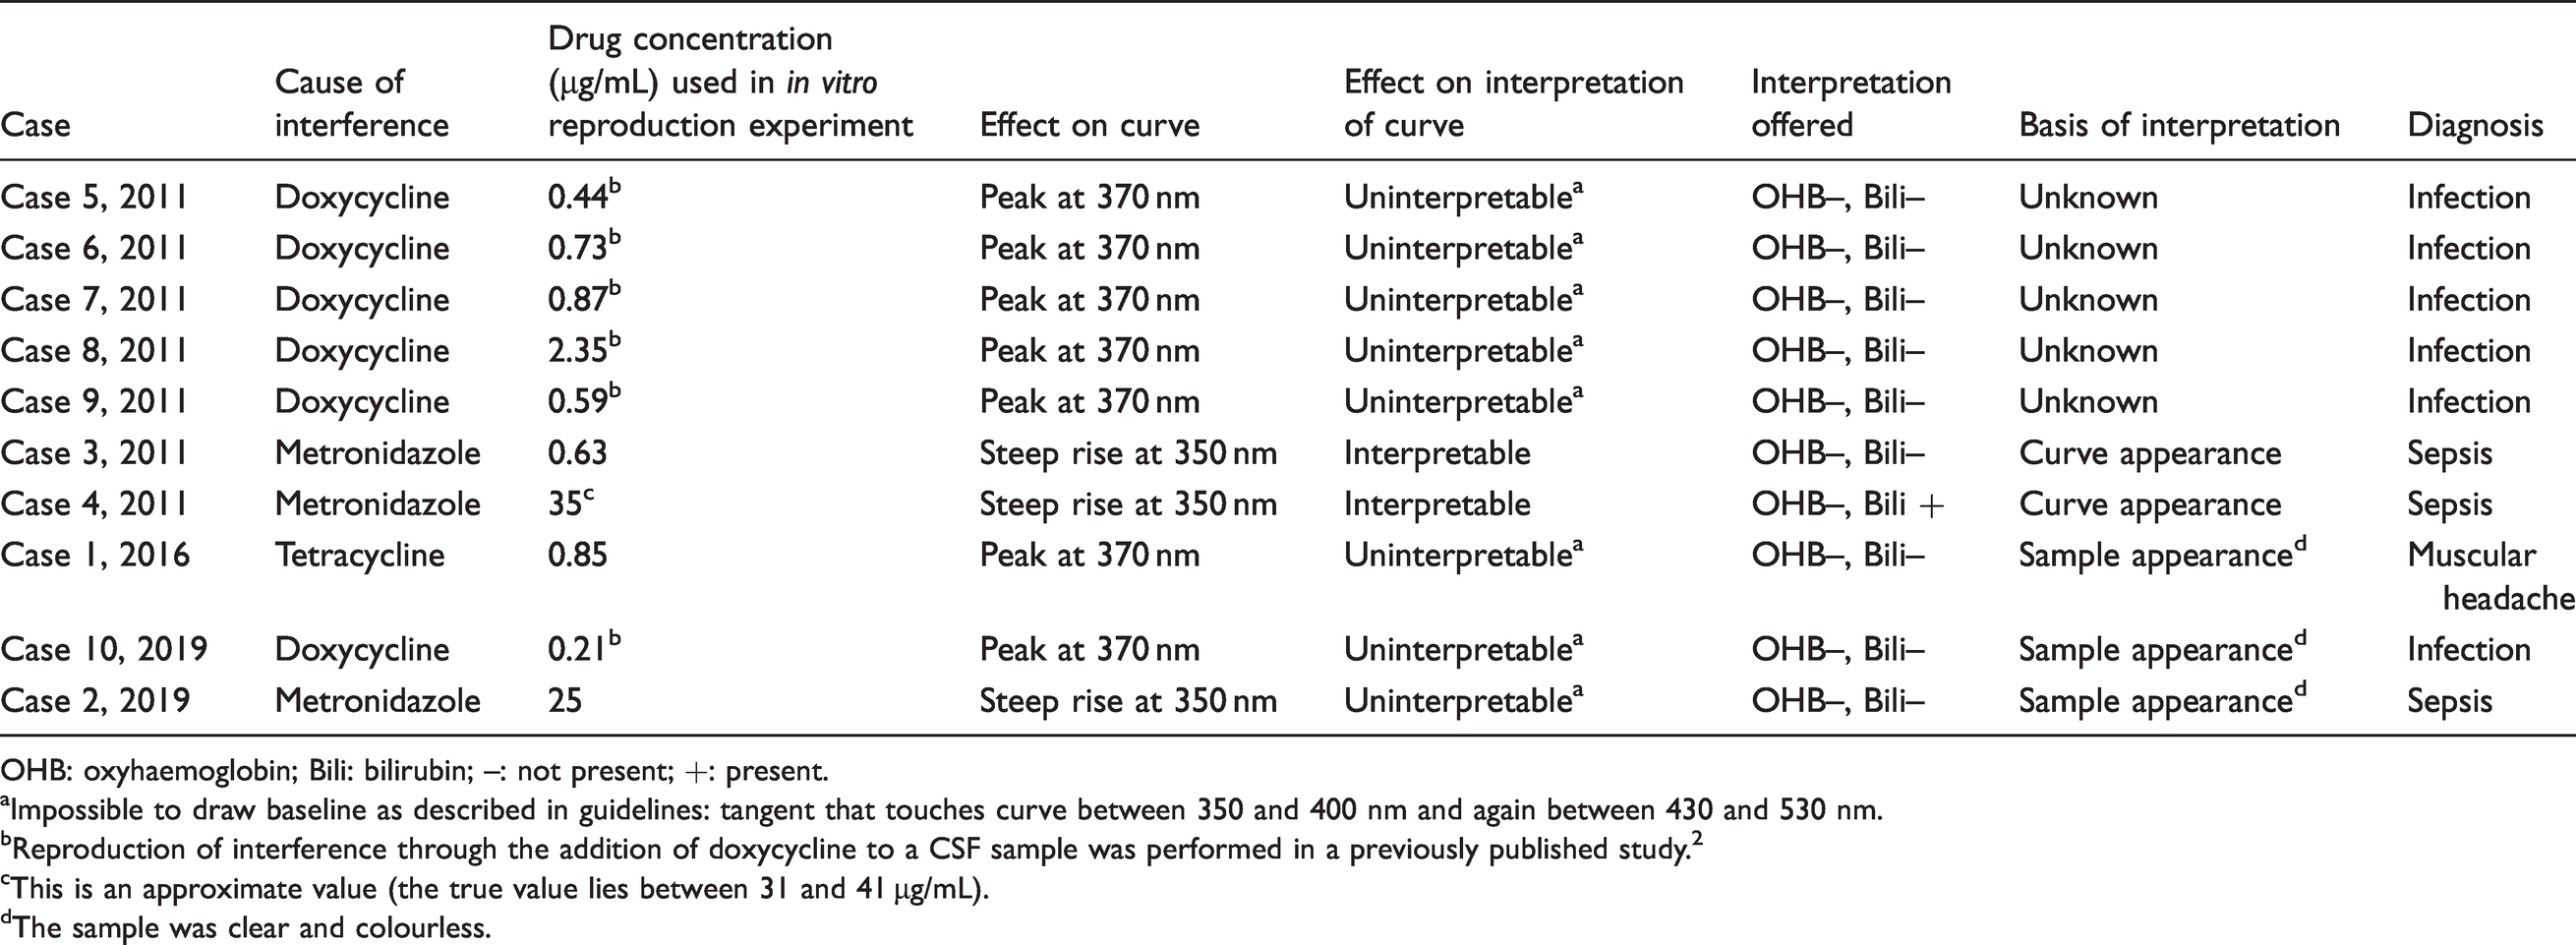
OHB: oxyhaemoglobin; Bili: bilirubin; –: not present; +: present.aImpossible to draw baseline as described in guidelines: tangent that touches curve between 350 and 400 nm and again between 430 and 530 nm.
bReproduction of interference through the addition of doxycycline to a CSF sample was performed in a previously published study. 2
cThis is an approximate value (the true value lies between 31 and 41 µg/mL).
dThe sample was clear and colourless.
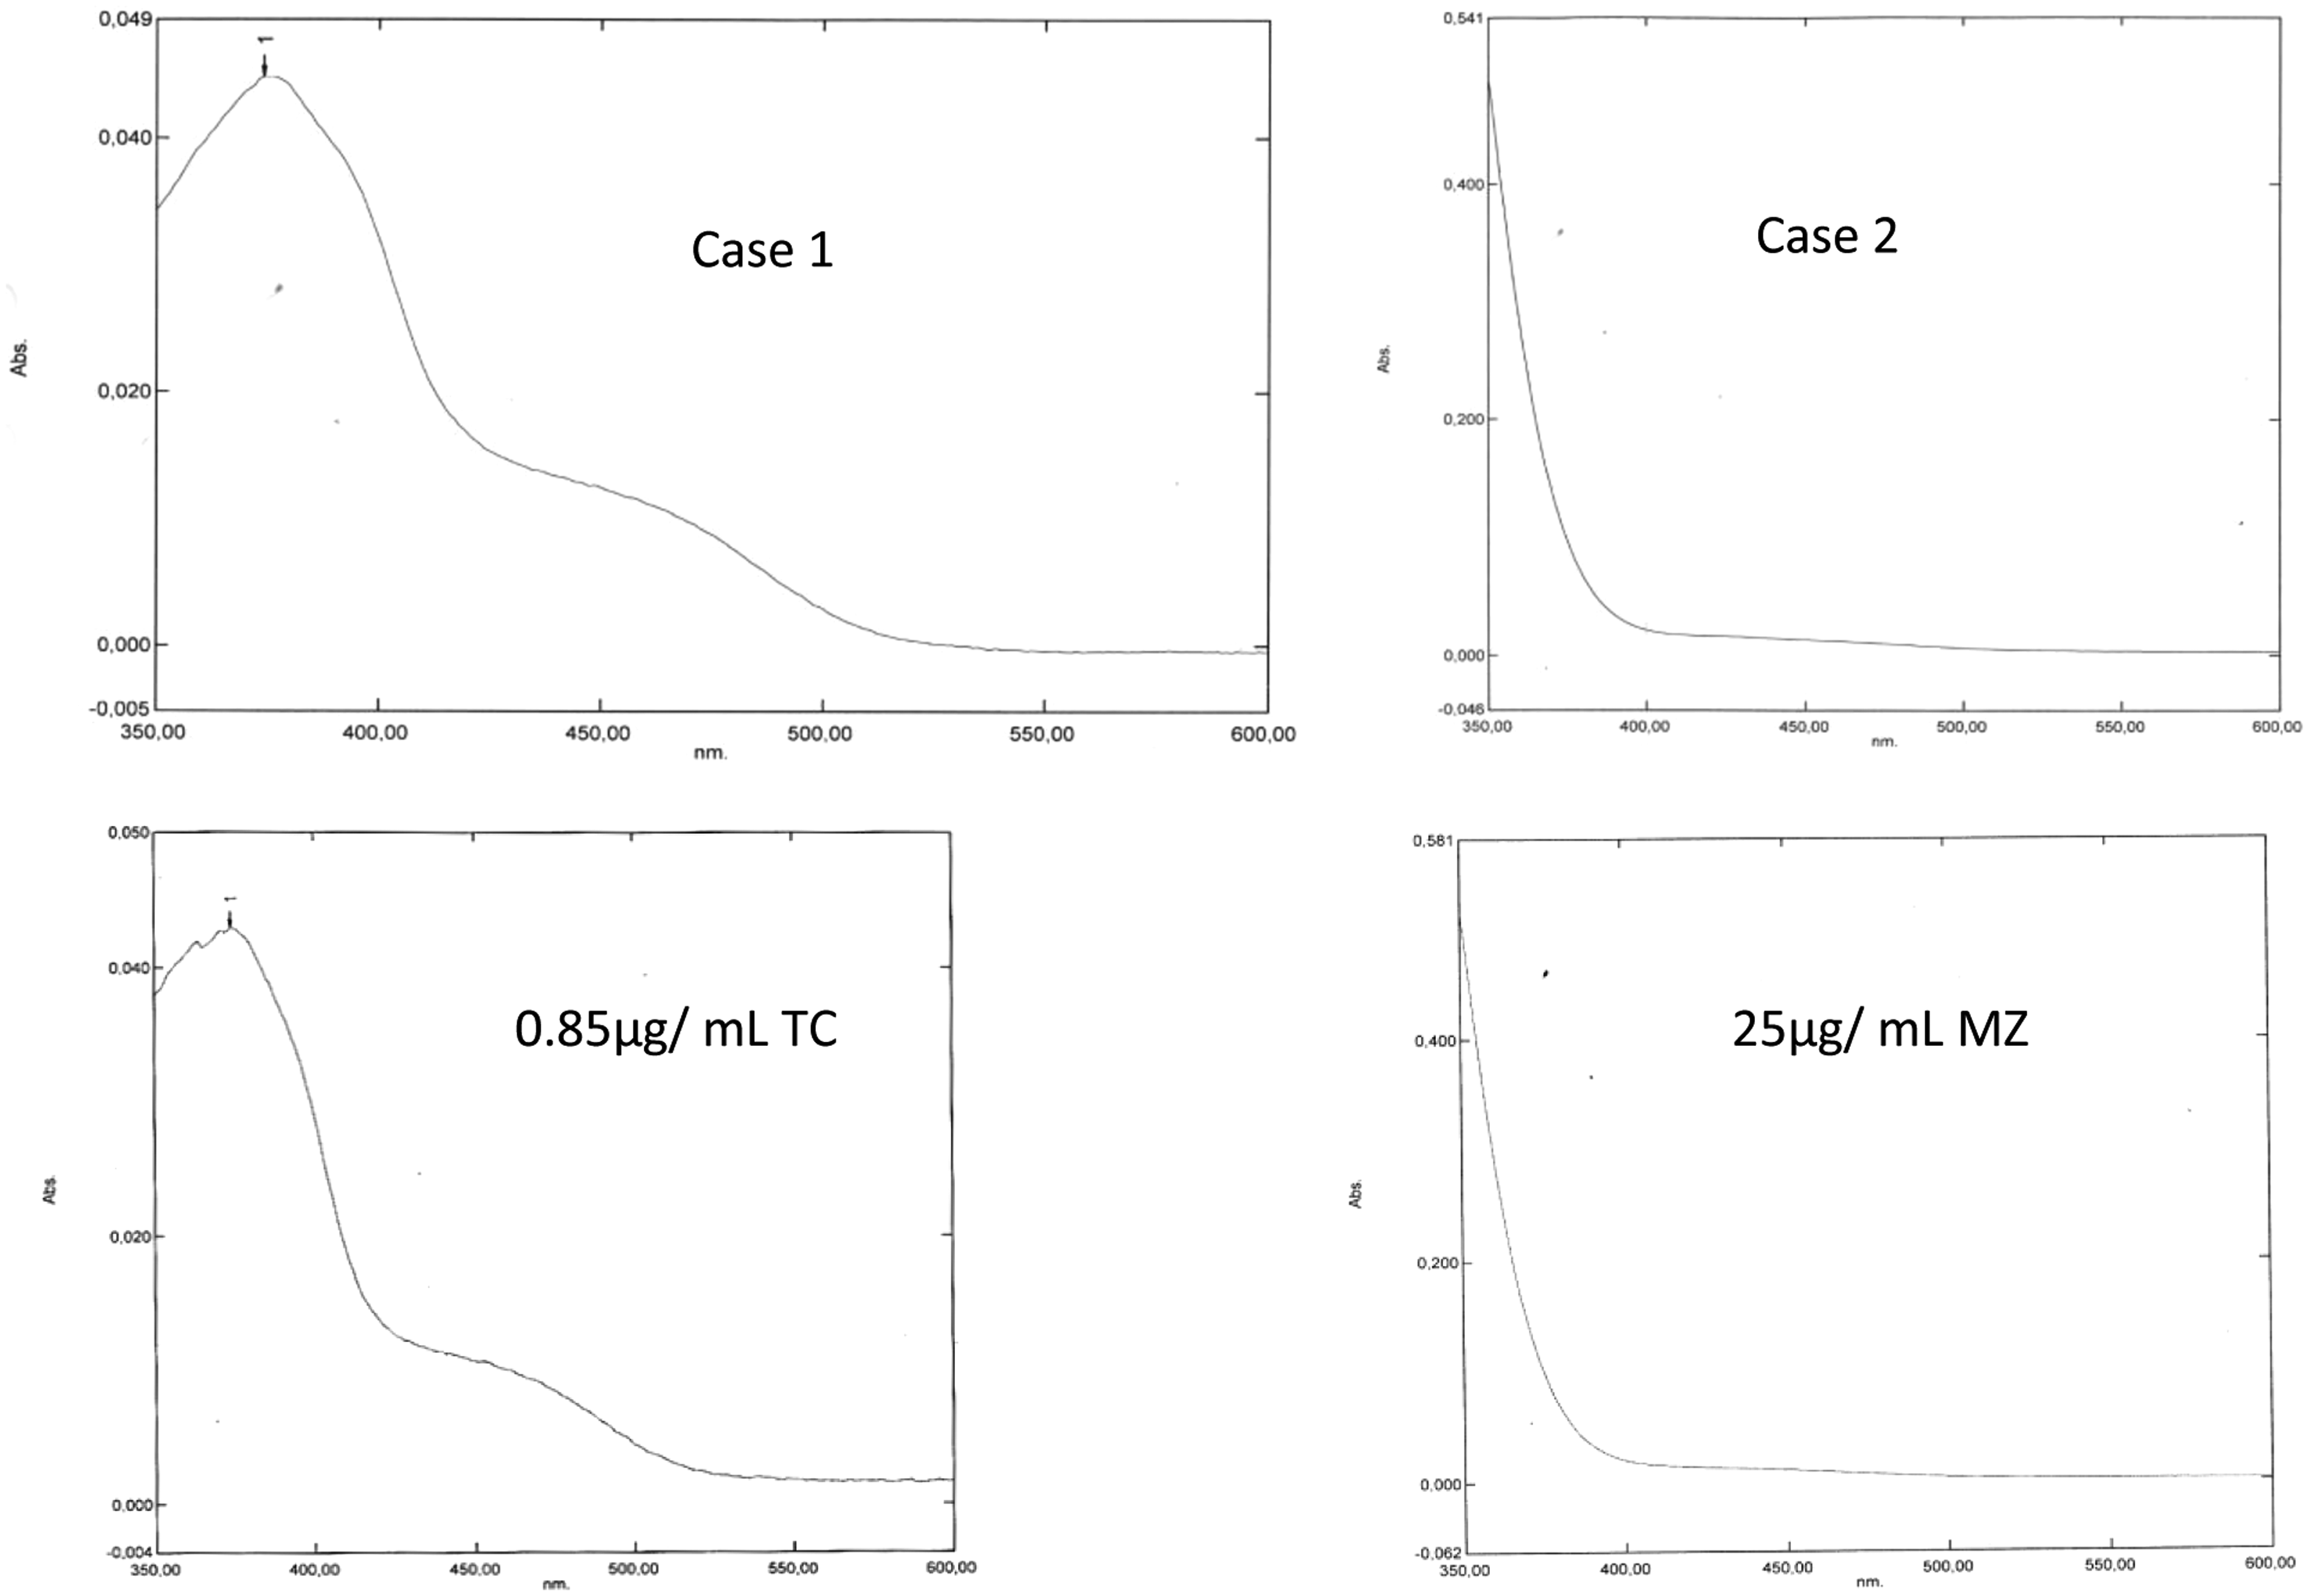
Cases 1 and 2 with their in vitro reproductions using 0.85 µg/mL tetracycline (TC) and 25 µg/mL metrondidazole (MZ). Note that the curves are uninterpretable in that it is impossible to draw an artificial baseline that touches the curve between 350 and 400 nm and again between 430 and 530 nm.
There were two cases of uninterpretable absorbance curves, one case of a borderline interpretable curve and two cases of curves of unusual appearance for which no explanation could be found (see Supplementary Figure). It is possible that these curves are artefactual or caused by a pharmacological substance that was not recorded in the case notes.
There were no instances of ‘typical’ absorbance curves in patients who were taking any of the interfering agents described above at the time, or within 24 h, of lumbar puncture. This was the case with bilirubin-positive and bilirubin-negative curves.
There were no instances of SAH in any of the interference-affected cases.
Impact on interpretation
Doxycycline/tetracycline interference
The addition of doxycycline/tetracycline to CSF samples to create concentrations that might be expected from oral therapy did not affect the colour of the sample on visual inspection. In samples that were clearly positive for oxyhaemoglobin/bilirubin, the spectrophotometric effect of the addition of doxycycline/tetracycline varied from a subtle elevation of the trough normally observed at 370 nm to the emergence of a peak at 370 nm. The former was especially interesting in that it was possible to convert a spectrum with a net bilirubin absorbance >0.007 AU (that is, supportive of the diagnosis of SAH) into one with a net bilirubin absorbance of <0.007 AU (that is, unsupportive of the diagnosis of SAH) through the addition of doxycycline/tetracycline. The concentrations of doxycycline and tetracycline used in this experiment were in the range expected in patients receiving antibiotic therapy, 0.29 µg/mL and 0.19 µg/mL, respectively (see Figure 2). The colour of the samples on visual inspection remained the same: xanthochromic samples remained xanthochromic after the addition of doxycycline/tetracycline.
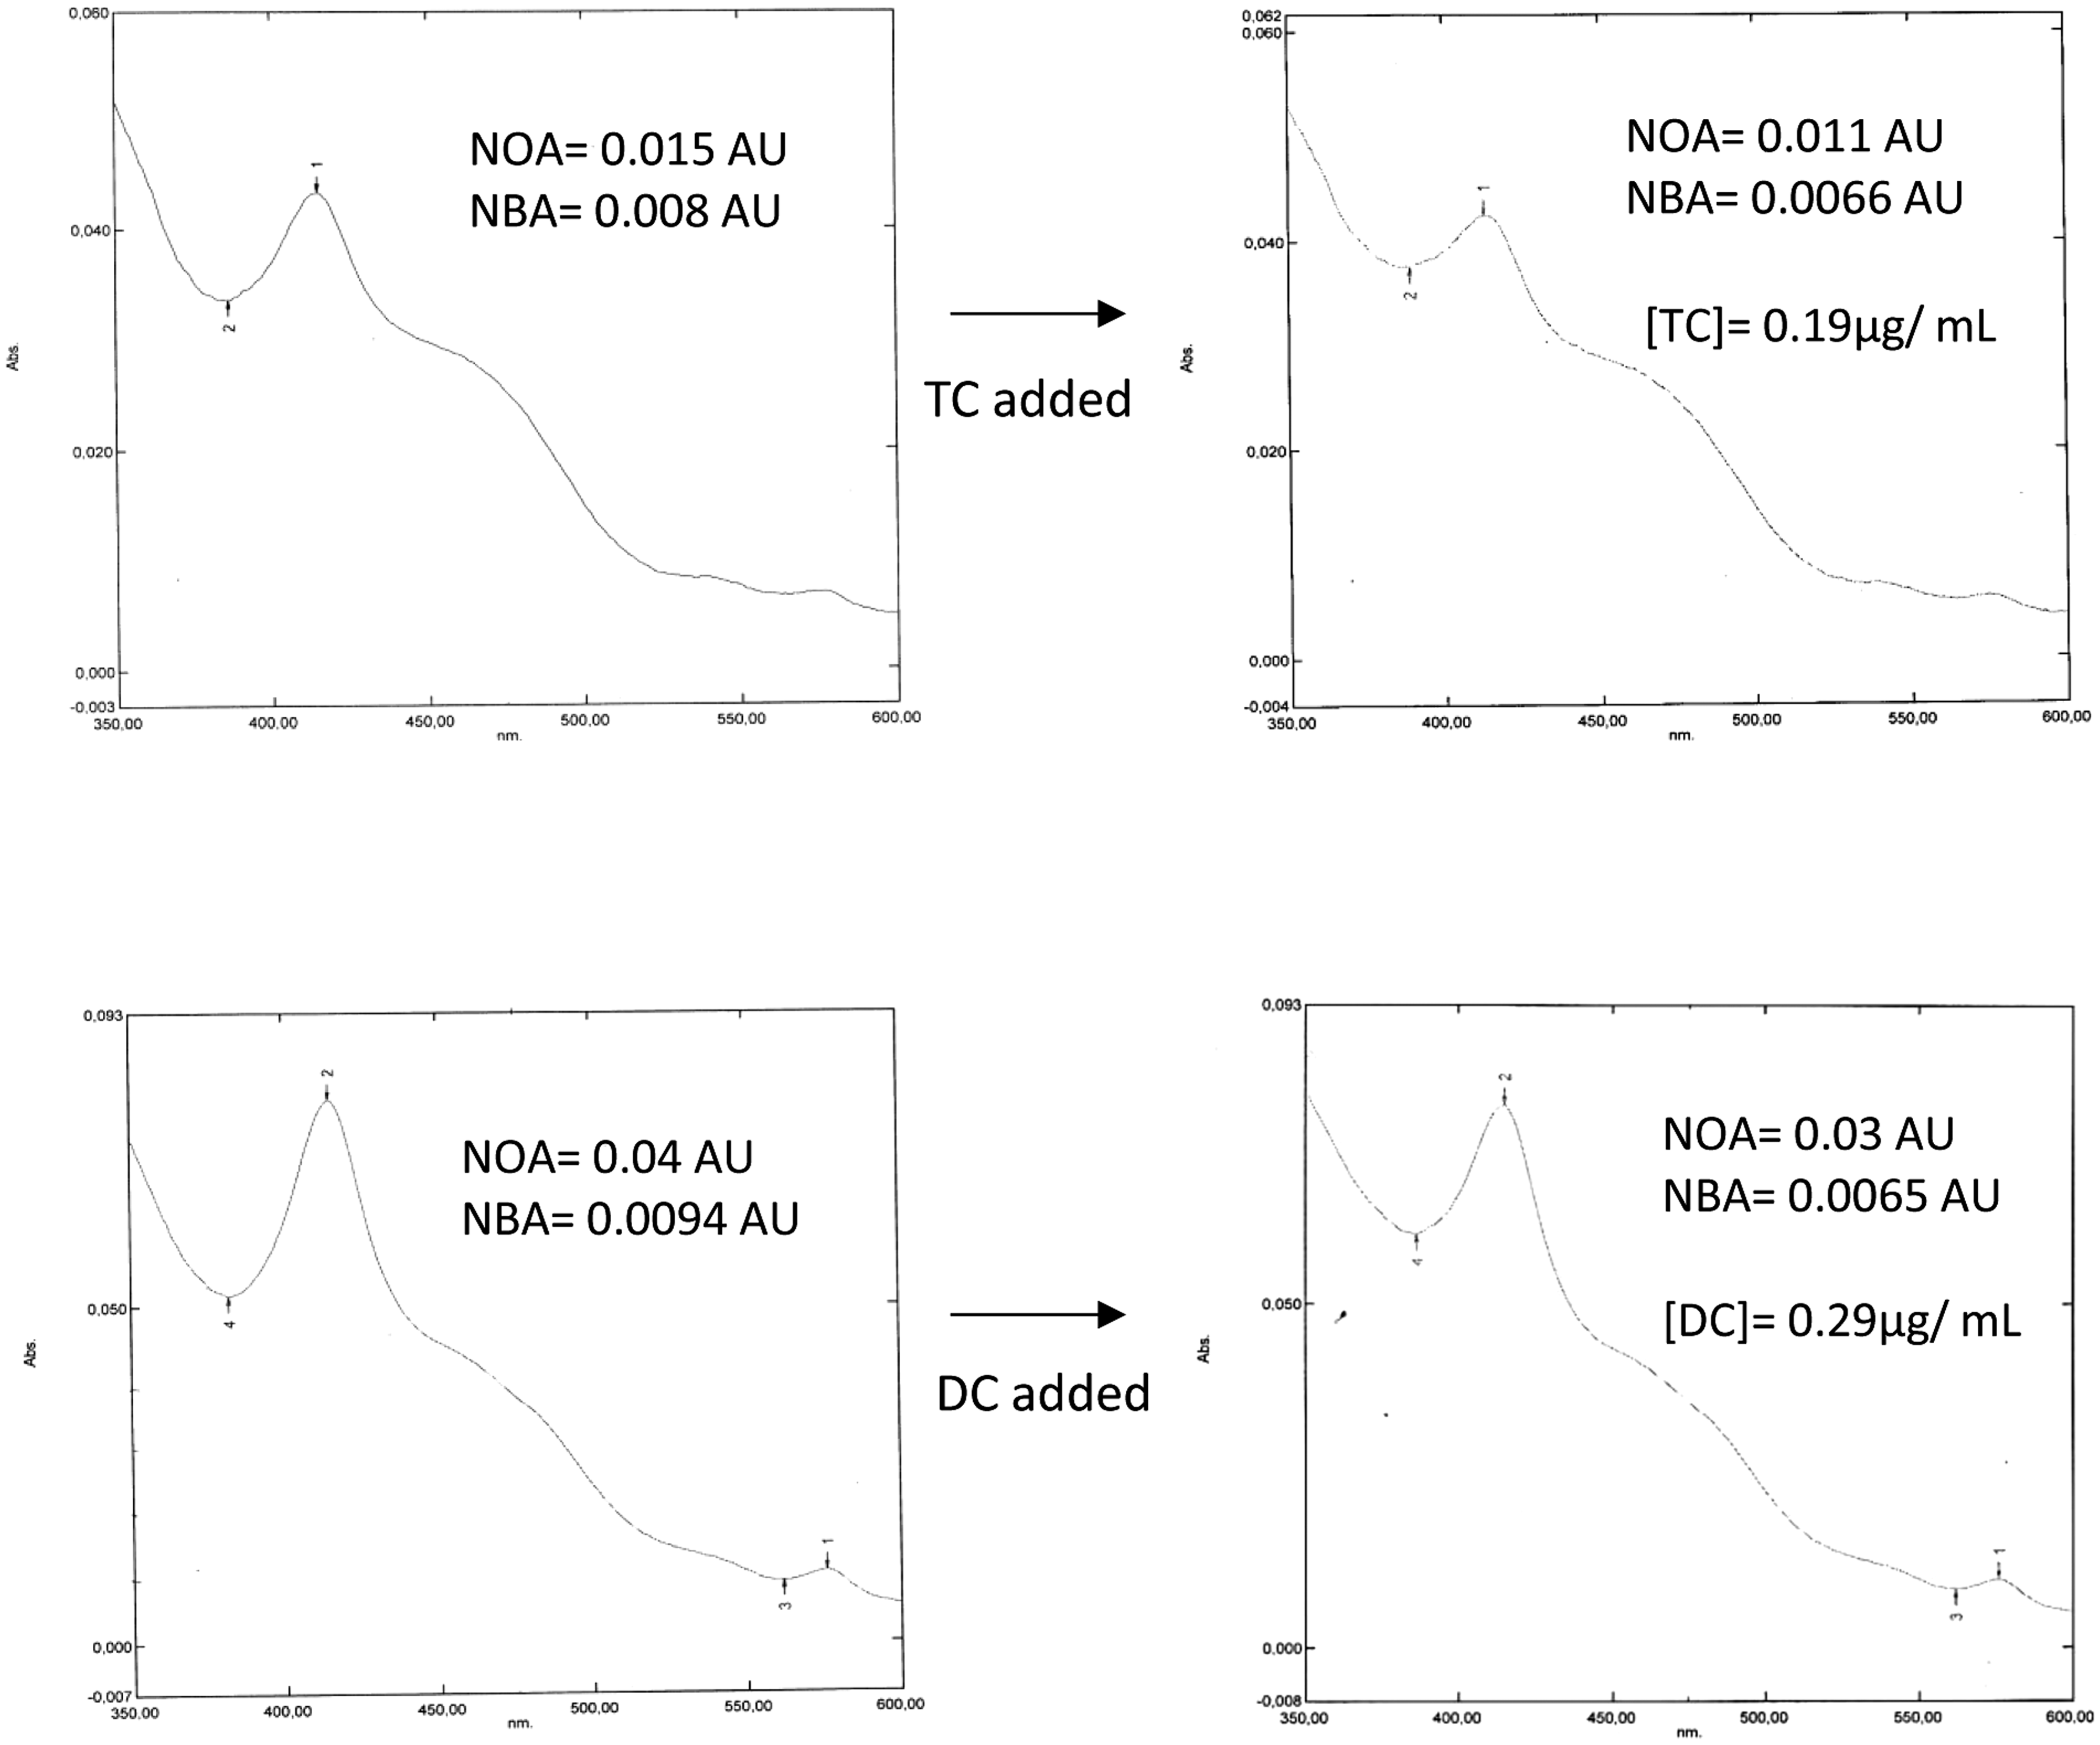
Effect of the addition of tetracycline (TC) and doxycycline (DC) on the absorbance curves of samples that would have been Interpreted as supportive of subarachnoid haemorrhage.
Metronidazole interference
Metronidazole was added to xanthochromic and non-xanthochromic CSF samples. The addition of metronidazole did not change the colour of the sample on visual inspection. However, a decrease in net oxyhaemoglobin absorbance (NOA) and, to a much lesser extent, NBA, was observed (Figure 3). Additionally, while the curve remained interpretable, it was on the borderline of interpretability, that is, the artificial baseline touched the curve at a point close to 400 nm (see Figure 3).
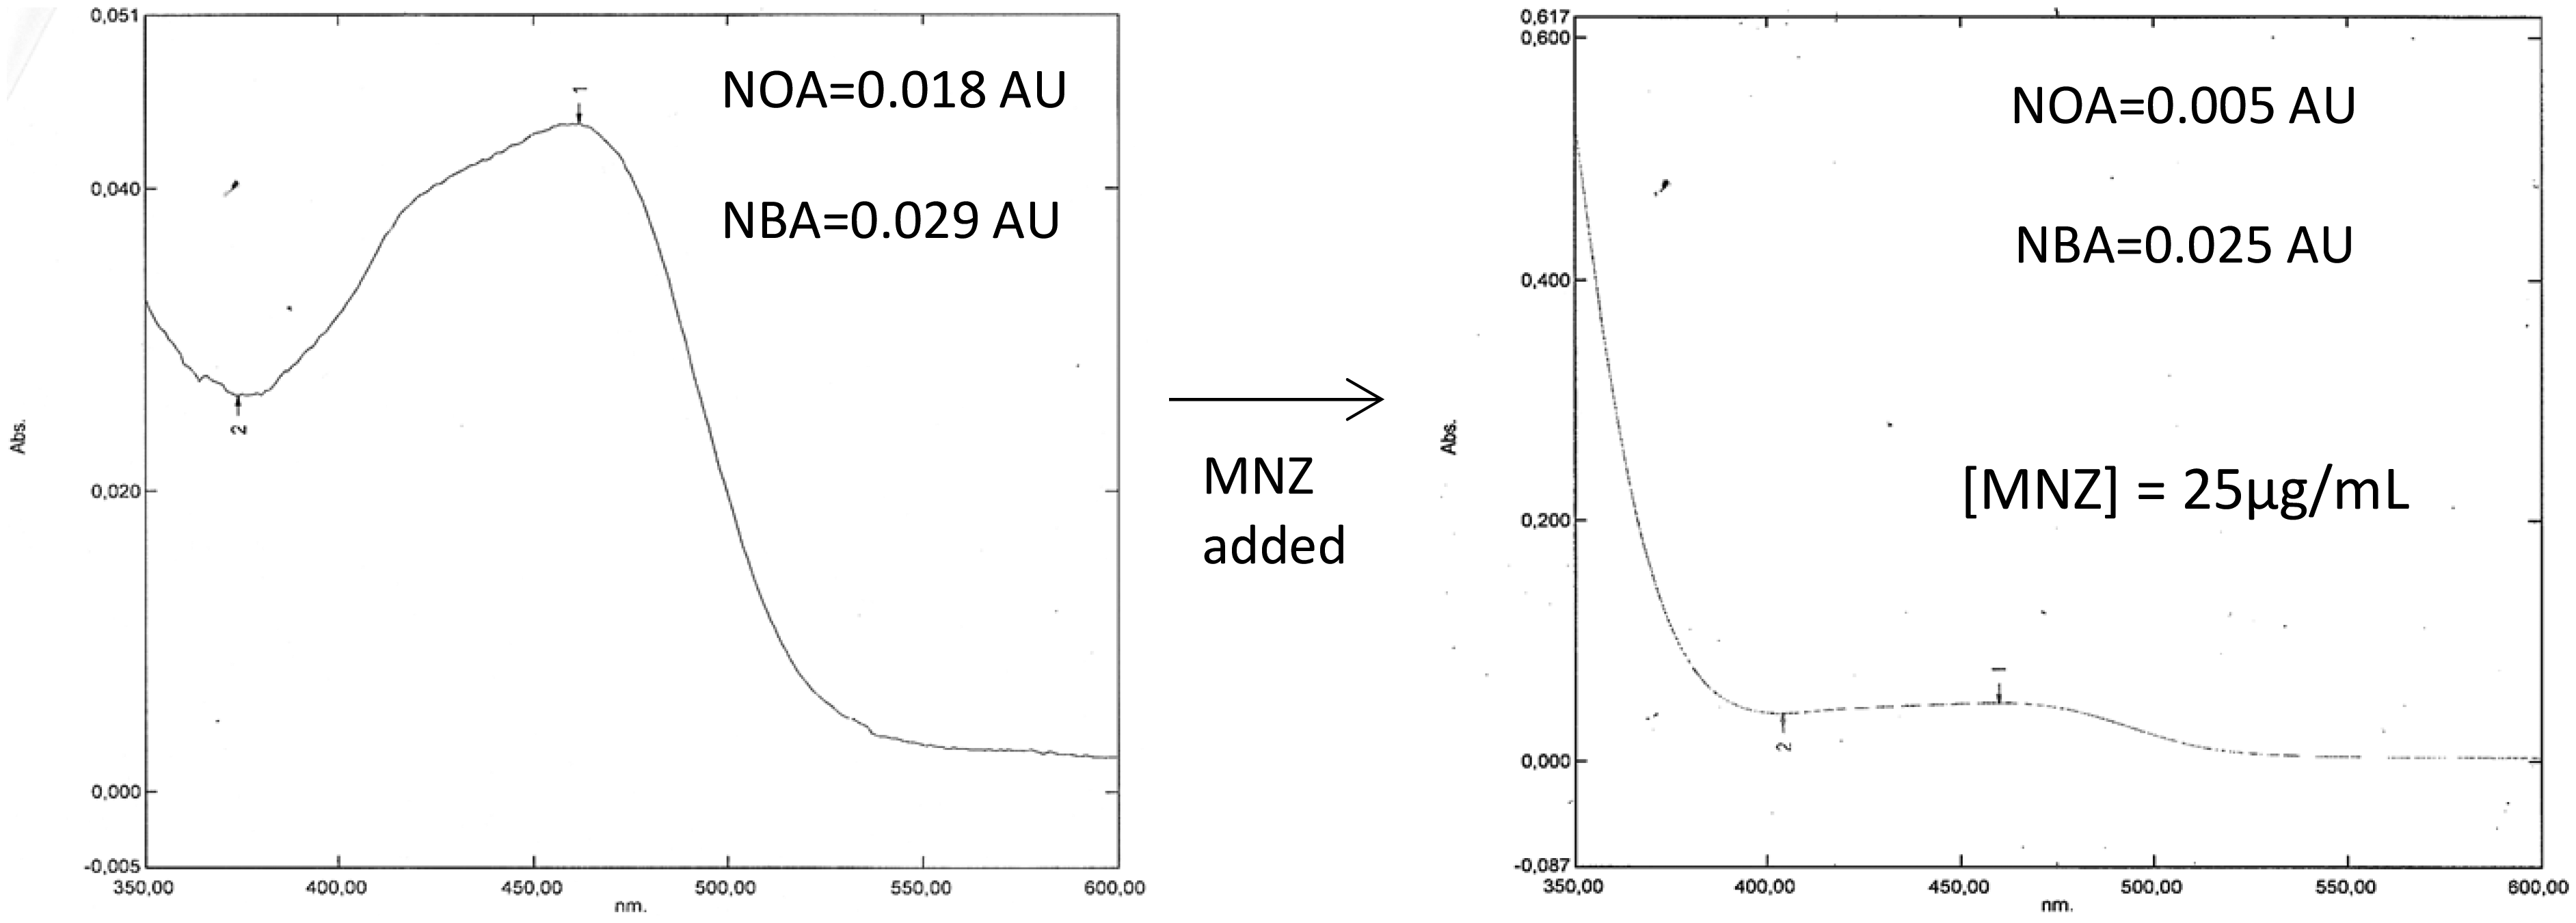
Effect of the addition of metronidazole (MNZ) on the absorbance of a sample that would have been interpreted as being supportive of subarachnoid haemorrhage.
Discussion
Although obvious interference in absorbance curves appears to be rare, of the order of 1% in the period 2016–2019, 6% in 2011, interference that is less obvious may also occur. An initiative to reduce the number of inappropriate requests may partly account for the apparent decrease between 2011 and 2016–2019, doxycycline being a commonly prescribed antibiotic for neuroborreliosis/suspected neuroborreliosis.
A key point is that the impact of the interfering substance on CSF absorbance spectra is variable, ranging from an appearance that is clearly uninterpretable to more subtle changes that might result in the reporting of an incorrect interpretation. In the case of metronidazole, the interference did not appear to affect a curve’s ultimate interpretation, the bilirubin-positive curve in the experiment remained bilirubin positive with experimental addition of metronidazole (although it should be noted that the observed small decrease in NBA may, at least in theory, be decisive in samples with an NBA marginally above the 0.007 AU cut-off). Reassuringly, xanthochromia also appears to be a reliable indicator of the presence of bilirubin in CSF samples affected by metronidazole interference. In the case of doxycycline and tetracycline interference, although no such cases were observed in the study, it appears to be possible to make a bilirubin-positive curve appear bilirubin negative. This is due to the fact that tetracycline-based antibiotics absorb light maximally at 370 nm, and, in some cases, rather than causing a curve to become uninterpretable, merely cause a smaller NBA. This problem is particularly troublesome because an affected curve need not appear unusual and therefore might go unnoticed. In a previous publication, the present author has suggested examining the colour of samples associated with uninterpretable curves and noting which medications the patient was taking at the time of lumbar puncture. 2 Given the findings of the current study, the author now advocates visual inspection of CSF samples for xanthochromia in every case. Due to the rarity of significant interference, and the relative insensitivity of the human eye compared with a spectrophotometer, 15 this approach would not be expected to be incompatible with the UK guidelines in the vast majority of cases. Also, in the event that a xanthochromic sample with an NBA of less than 0.007 AU is discovered, the cause may be some aspect of the sample’s analysis other than interference. In this way, checking a sample’s colour provides added quality assurance. This is not an entirely original recommendation: an approach combining visual methods with spectrophotometry has been described by Linn et al. 16
In other situations, an approach to the problem of medication-based interference is to discontinue the medication involved. This is not possible in suspected SAH given the relatively long half-lives involved; in the case of doxycycline’s 12 to 25-h half-life, this could involve a wait of five days. 14
Limitations
This study is limited by small sample numbers. It is likely that the frequency of CSF curve interference is in fact higher than presented here for a number of reasons: potential sources of interference may not be recorded in patients’ medication lists (vitamin B preparations and quinine found in tonic water, for example, absorb in the 350 to 600 nm region of interest,17,18) effects of metabolism and protein binding may not be accurately reproduced in the in vitro experiments performed in order to confirm/investigate each suspected case of interference (it is, however, reassuring to note that peaks expected from literature were present in the reproduction experiments in this study).
There exists no gold standard, apart from CSF analysis itself, in the diagnosis of SAH. 19 This is a limitation of this study, as it is concerned with how a gold standard might be improved.
Conclusion
Examples of medication-induced interference in CSF absorbance spectra are presented here and suggestions as to how these might be dealt with. It is hoped that a future version of the UK guidelines for the interpretation of CSF absorbance curves will include recommendations that address this issue.
Supplemental Material
sj-pdf-1-acb-10.1177_00045632211027612 - Supplemental material for Uninterpretable cerebrospinal fluid absorbance scans caused by antibiotic therapy
Supplemental material, sj-pdf-1-acb-10.1177_00045632211027612 for Uninterpretable cerebrospinal fluid absorbance scans caused by antibiotic therapy by Jan Miller in Annals of Clinical Biochemistry
Supplemental Material
sj-pdf-2-acb-10.1177_00045632211027612 - Supplemental material for Uninterpretable cerebrospinal fluid absorbance scans caused by antibiotic therapy
Supplemental material, sj-pdf-2-acb-10.1177_00045632211027612 for Uninterpretable cerebrospinal fluid absorbance scans caused by antibiotic therapy by Jan Miller in Annals of Clinical Biochemistry
Supplemental Material
sj-xlsx-3-acb-10.1177_00045632211027612 - Supplemental material for Uninterpretable cerebrospinal fluid absorbance scans caused by antibiotic therapy
Supplemental material, sj-xlsx-3-acb-10.1177_00045632211027612 for Uninterpretable cerebrospinal fluid absorbance scans caused by antibiotic therapy by Jan Miller in Annals of Clinical Biochemistry
Footnotes
Acknowledgements
I would like to thank Andreas Hillarp and Stefan Lönn for their assistance and guidance.
Declaration of conflicting interests
The author(s) declared no potential conflicts of interest with respect to the research, authorship, and/or publication of this article.
Funding
The author(s) disclosed receipt of the following financial support for the research, authorship, and/or publication of this article: This research was supported by Region Halland’s research support (Grant number: HALLAND-931064).
Ethical approval
Approved by Regionala Etikprövningsnämnden Lund (Sweden), Dnr 2018/774, Ändringsansökan 2019–09–05. Patient consent was not obtained because the article contains very little clinical information and no data that could be used to identify a patient.
Guarantor
Sole author.
Contributorship
Jan Miller researched literature, conceived the study, collected data, interpreted data, wrote the first draft and reviewed the article.
Supplemental material
Supplemental material for this article is available online.
References
Supplementary Material
Please find the following supplemental material available below.
For Open Access articles published under a Creative Commons License, all supplemental material carries the same license as the article it is associated with.
For non-Open Access articles published, all supplemental material carries a non-exclusive license, and permission requests for re-use of supplemental material or any part of supplemental material shall be sent directly to the copyright owner as specified in the copyright notice associated with the article.