
Abstract
Background
A logical consequence of the introduction of robotics and high-capacity analysers has seen a consolidation to larger units. This requires new structures and quality systems to ensure that laboratories deliver consistent and comparable results.
Methods
A spreadsheet program was designed to accommodate results from up to 12 different instruments/laboratories and present IQC data, i.e. Levey-Jennings and Youden plots and comprehensive numerical tables of the performance of each item. Input of data was made possible by a ‘data loader’ by which IQC data from the individual instruments could be transferred to the spreadsheet program on line.
Results
A set of real data from laboratories is used to populate the data loader and the networking software program. Examples are present from the analysis of variance components, the Levey-Jennings and Youden plots.
Conclusions
This report presents a software package that allows the simultaneous management and detailed monitoring of the performance of up to 12 different instruments/laboratories in a fully interactive mode. The system allows a quality manager of networked laboratories to have a continuous updated overview of the performance. This software package has been made available at the ACB website.
Keywords
Introduction
The recent years have seen a major transformation in the provision of healthcare. With the merger of hospitals and formation of organizations comprised a number of hospitals, patients have become more mobile between sites and specialities. Inevitably pathology diagnostics need to ensure transferability of results across analysers and sites and be able to monitor broader performance on a regular basis. In the setting of networks of analysers, the assessment of performance using IQC and EQA data in isolation does not provide adequate means for ensuring comparability of results across the network.
To this end, the above ACB Scientific Committee joined forces on a project to develop software that could extend the application of IQC data across the network and simplify an overall monitoring of analytical performance within the network. Comparing the scatter of data across the network ensures that comparability is within acceptable levels.
The dispersion in the IQC data is taken to equate with the uncertainty associated with a patient result if it were repeatedly measured across the network. In other words, it presents the measurement uncertainty (MU) identified through measuring the dispersion, i.e. imprecision, of repeated measurements in a given measuring system. This is in a setting where the sample may be analysed randomly on any one analyser within or across a network of laboratories. The scatter of IQC data across the network justifies the standard deviation as the main metric under consideration for the software.
The intermediate imprecision is calculated through capture of IQC data and the overall uncertainty of the measurement results presented. Bias is offset by employing appropriate calibration systems which are traceable to either certified or conventional reference material. The software provides tools for identifying relative bias in form of trends or shifts. Performance in relation to set goals or allowable systematic deviation between results of measurements of different concentrations is also presented.
The principle of MU is extensively described in the document: Guide for expression of uncertainty in measurement (GUM) 1 and UKAS publications. 2
The approach employed for the estimation of the MU in this software is top down, in that imprecision is calculated through capture of the IQC data. This is different from the bottom up approach which combines the calculated uncertainty associated with each component of the measuring system.
The international standard for accreditation of clinical laboratories (EN/ISO 15189) 3 states: ‘The laboratory shall determine the uncertainty of measurement for each test where relevant and possible’. However, the GUM is not a normative reference for the standard 4 which states in clause 5.5.3: ‘In addition to document control identifiers, documentation shall include, when applicable to the examination procedure, the following’: and continues in subclause (m) ‘principle of procedure for calculating results including, where relevant, the measurement uncertainty of measured quantity values’. The standard thus does not rigidly mandate that the procedures in GUM are applied.
In the present report, we describe software that monitors the precision of laboratories in a network and alerts users of unexpected or erroneous results.
Design
The software applies to a network of instruments, either in a single laboratory or in a conglomerate of consolidated laboratories. It is assumed that common reference materials of two different concentrations are used for internal quality control (IQC) across the network. The software provides the laboratories with a module (see below) to reformat identified results of IQC to fit a central calculation module which reviews the results and calculates relevant parameters to allow for the evaluation of all results from a summary report.
Software description
The object and challenge of this project were to provide a convenient computer-based system that could collect IQC data from many instruments with a minimum of human intervention and calculate and present as much relevant information as possible as close to a real-time system as presently feasible.
The strategy was to write a ‘data-loader’ module which collects data from multichannel high-throughput performing instruments. In the present available version, the data-loader has been adapted to Roche, Siemens, Abbott and Beckman instruments. The data-loader transforms the specific format of their data output to a single, common format that can be used for calculations in an attached calculation module. The software allows a continuous monitoring of up to 12 instruments and accommodates up to 500 observations of two analyte concentrations. The within- and between-instrument imprecision, comparison with defined analytical goals, display of Levey-Jennings and Youden plots are continuously calculated and displayed.
The software and detailed instructions can be found on the Association of Clinical Biochemistry and Laboratory Medicine website: 5 http://www.acb.org.uk/whatwedo/science/best_practice/iqc-for-networked-analysers
The software consists of three main components.
Data-loader
The data-loader makes the task of processing large volumes of IQC data into a single and repeatable action possible and practical. It is based on Microsoft Excel® and converts data from files extracted from the instruments or various middleware/QC packages into test specific data which can be transported to, and handled by, the calculation module. The lay-out of the data-loader is the same for all analytes. Each analyte and instrument require their own set up but once installed runs automatically.
The calculation module
The calculation module offers a tool to assess the performance of one to 12 collaborating instruments based on up to 500 observations from each instrument. Although it can be used as standalone, it is designed to be part of a package to import data from the instruments’ data manager or any other suitable data storage system that can produce export files containing IQC results from multiple instruments in a specified format.
Comparisons, by definition, require input of data from at least two groups but the performance of the ingoing units will be critical and central and should be reported separately. Regulations and convention require that at least two concentrations of control material are simultaneously monitored. The input data and calculations of the module are therefore presented in two identical sections.
The user specifies analytical goals and other limits in this module.
The program presents an updated calculation of the within- and between-instruments imprecision and calculates the combined uncertainty and relative uncertainty 6 and graphically shows the moving averages and imprecision of each instrument. Furthermore, the performance of each instrument and measurand is compared with the analytical goals. These should be defined for the whole group and based on experience, or analytical and clinical criteria.
The calculation module consists of several sheets, one of which continuously displays a Levey-Jennings plot which can be focused on a single instrument, specified to a limited input time interval and chosen limits. If two control materials have been measured, a Youden plot 7 is presented.
Summary report
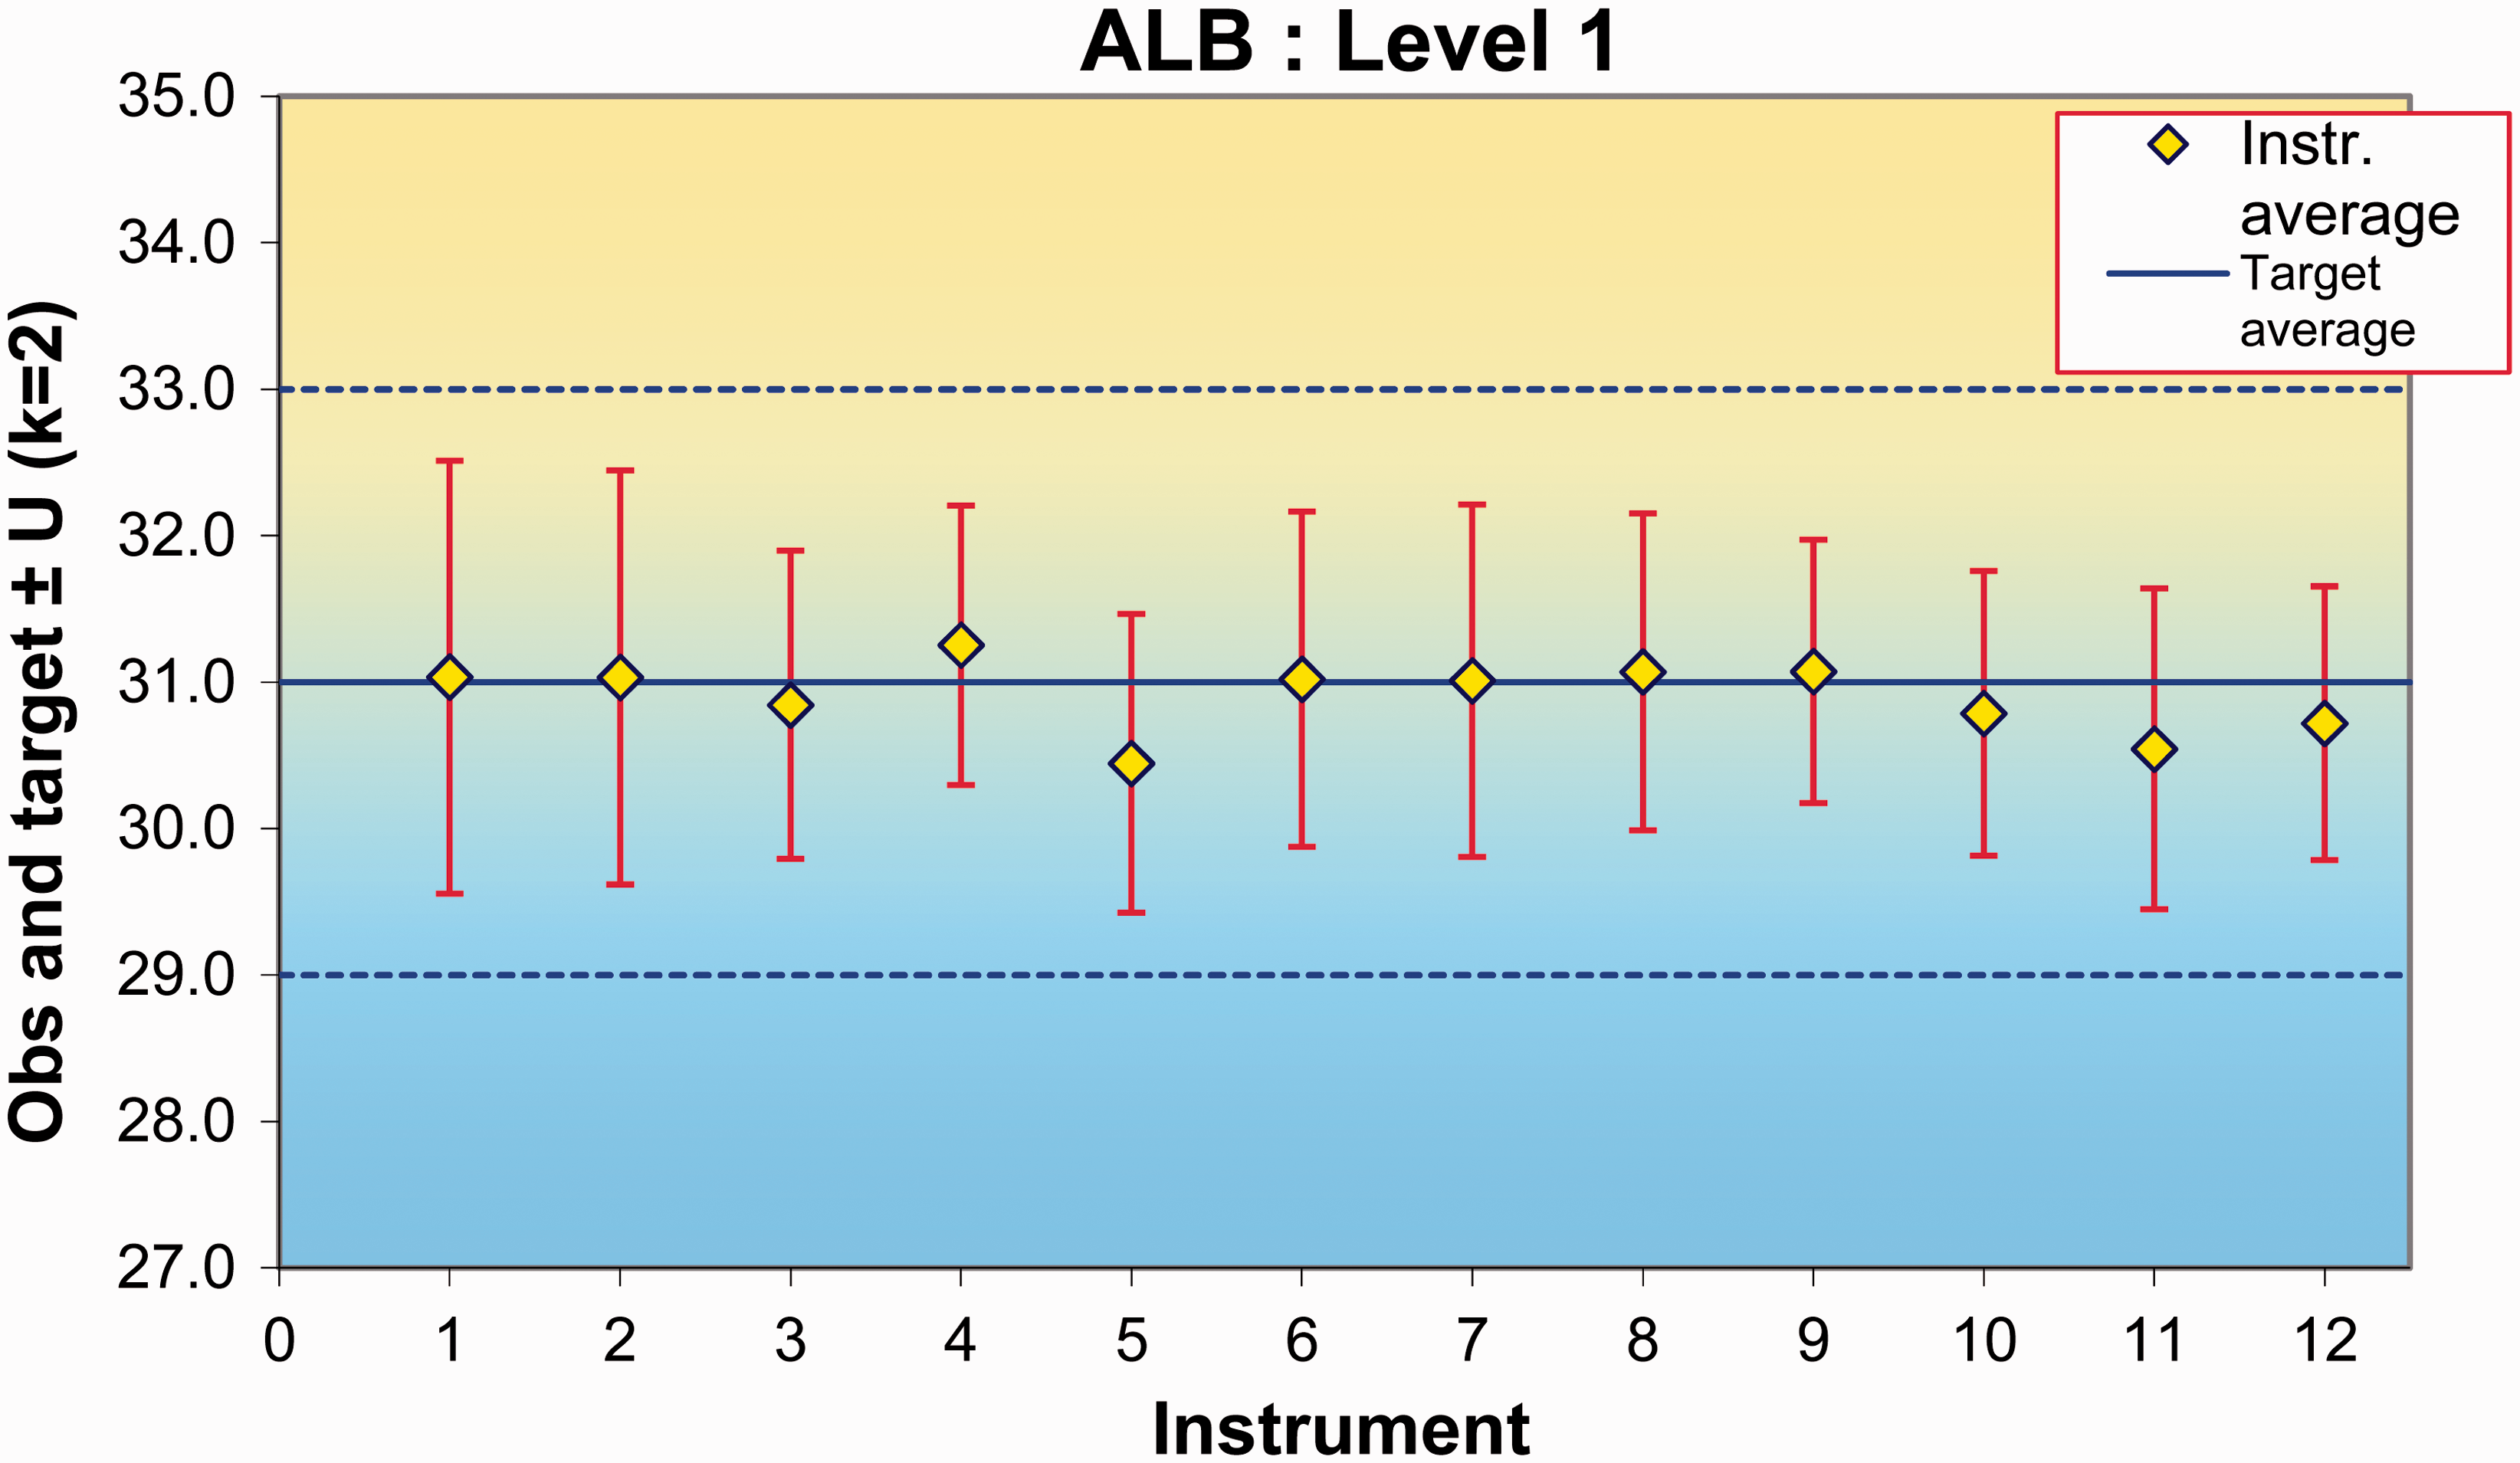
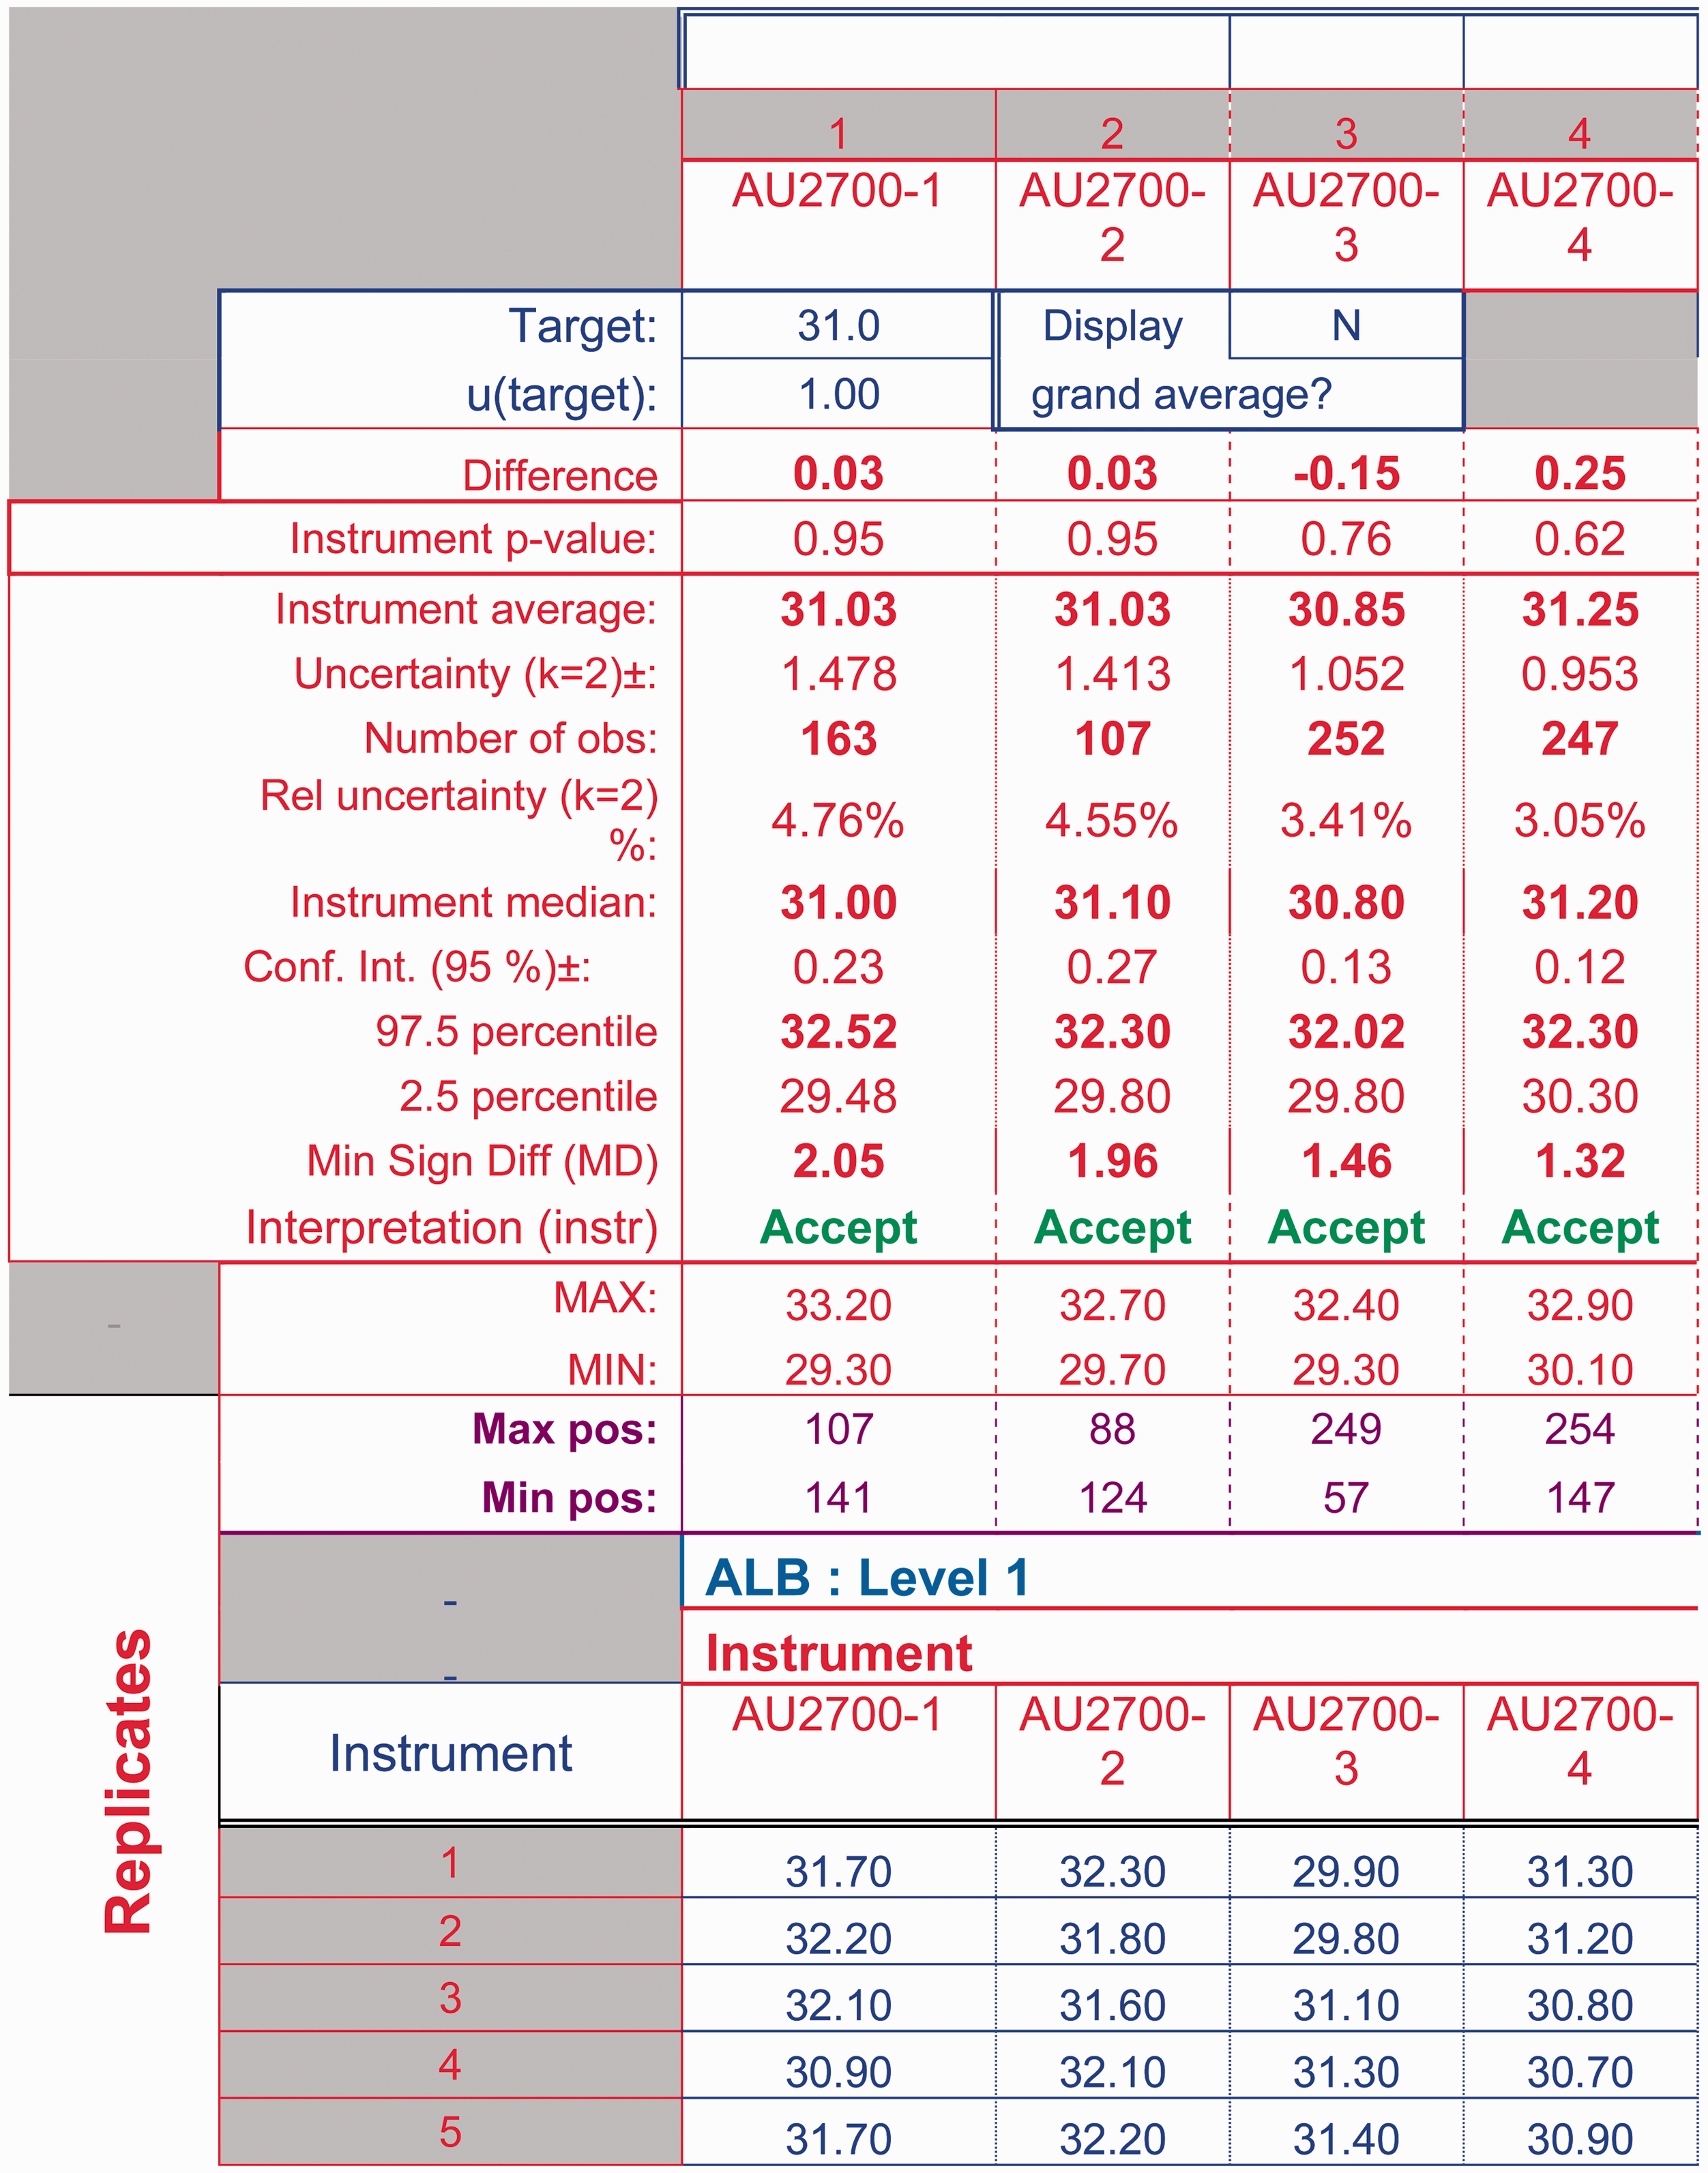
The large amount of detailed information that is produced in the calculation module may be difficult to inspect. Therefore, the data-loader retrieves the calculated results and presents a summary in a format that identifies unexpected results which may indicate a performance problem or an erroneous result. The output sheet is populated with all test names and acceptable performance criteria as defined by the user and applicable to all instruments in the network. The output is a one-page evaluation summary (Figure 1) which highlights unexpected results or those that violate analytical or clinical goals as defined in the system. The calculation module (Figure 2) is a graphic display of QC results at one level for a single analyte on each instrument and within the entire network. The calculation module spreadsheet also shows a detailed report of the statistical calculations (Figure 3). The latter allows the identification of poorly performing assays.
Summary evaluation table. A screen-dump of part of the summary evaluation page. Statistical evaluations are shown in the first two columns on the left, agreement with user-defined analytical goals are shown under network evaluation and performance of each analyser for each level shown on the right. The graphical display of the moving averages and variation of the recorded data across instruments/network. Statistically processed data showing performance of the measurand in the network according to the statistical tests used.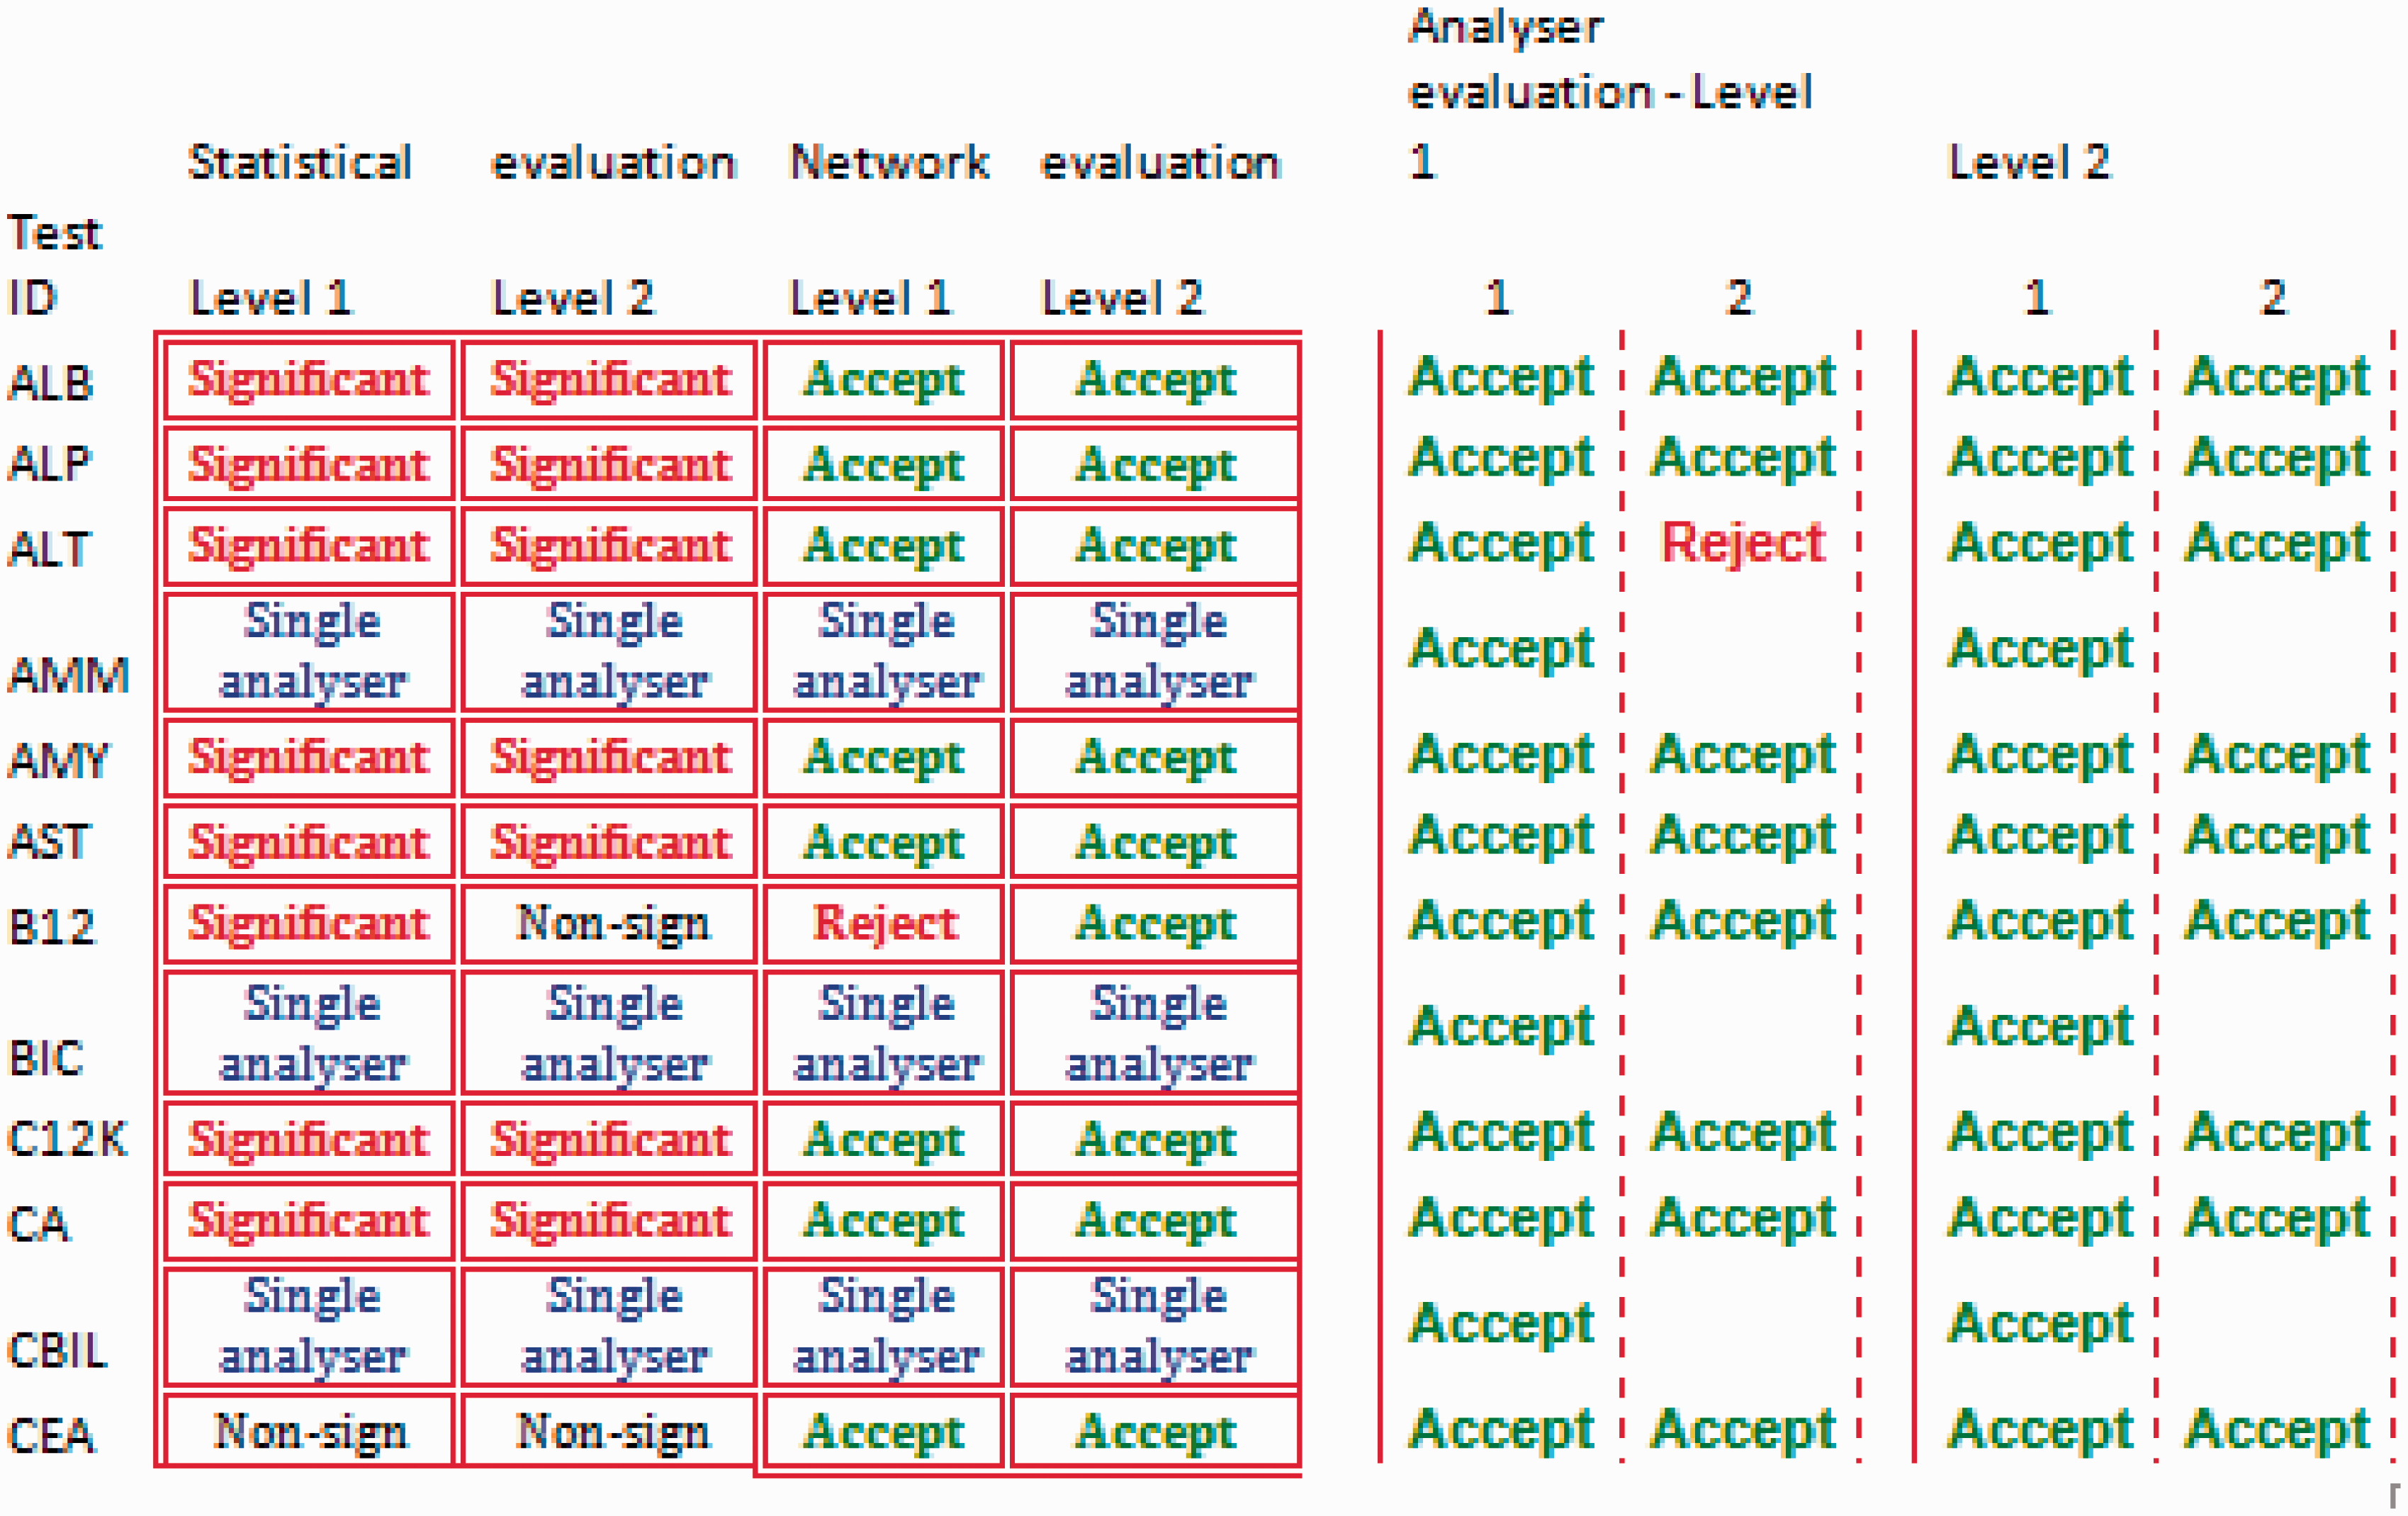
Statistics
Excel innate statistics were used as applicable. The analysis of variance components, comparison with target values, graphical displays and Youden analysis 7 were programmed in Excel.
Discussion
Comparability of measurement results is critical and has experienced a renewed importance with the ongoing consolidation of laboratories and increasing mobility of patients. Convenient and efficient procedures are necessary to monitor laboratories or instruments in a network and identify those which fail or perform badly in an IQC system. The described software allows for consolidated collection of data along with calculation and reporting of results from IQC measurements in such a network and meets the requirements for clinical laboratories to monitor the performance of measurements across a network of analysers. Import of large files of IQC data to the calculation sheet is facilitated by a special data-loader that has been developed for many of the more widely used robotic and automatic measuring systems. The calculating module displays tabulated and graphical IQC data and allows for ‘at a glance’ simultaneous assessment of the performance of up to 12 instruments. The process of measuring and reporting the uncertainty for all included tests in the network of laboratories can be completed in around 15 min. The summary report is essential to make the software practical and useful.
It is important to understand that the sensitivity of the system will decrease the more observations are included since both the averages and the within-and between-variations are ‘moving’, i.e. continuously updated. This means that the graphs presented on the first tab of the calculation module will gradually become less responsive to a single deviation from the expected value or an outlier. This will, however, be picked up in the Levey-Jennings plot and also highlighted in the report sheet. The software provides different graphical presentations to facilitate a simplified procedure to reveal poor or erroneous performance. This facilitates efficient trouble shooting if performance does not meet the defined goal.
Laboratories are responsible for ensuring that test results are fit for their clinical purpose by setting and maintaining the quality of their analytical methods. We suggest that the software is embedded in the laboratory quality system to allow for regular monitoring of IQC in a network. An important feature of this software is the link to analytical quality goals, which allows users to compare test performance against defined criteria. The program allows monitoring the performance over time and between instruments. The proposed system thus forms a basis for a quality management system that can be used to regulate variability of the analytical process.
Although the main emphasis is on monitoring imprecision, the calculation module makes comparisons with target trueness values to detect any bias. The bias and imprecision experienced in each individual measuring system is also demonstrated in the Youden plot.
Laboratories need to select the appropriate goals in accordance with regulatory requirements and also ensure that selected goals are practical and consistent with the actual clinical use of the test in their health system.
The spreadsheet of the calculation module, when used separate from the programme can also be used for the analysis of other data sets, e.g. inter laboratory verification of methods where analysis of variance 6 is the appropriate statistical tool.
Footnotes
Declaration of conflicting interests
The author(s) declared no potential conflicts of interest with respect to the research, authorship, and/or publication of this article.
Funding
This study was funded by ACB Scientific Committee.
Ethical approval
Not applicable.
Guarantor
ZK.
Contributorship
ZK proposed the original idea to the ACB, PA designed and programmed the data-loader, AK designed and programmed the Excel® data analysis spreadsheets. All authors contributed to the planning, developing and reporting of the work.