
Abstract
Background
Myeloperoxidase has shown potential as a marker for prognosis of coronary artery disease, but presently little is known about preanalytical handling of samples for quantifying myeloperoxidase. The present study was conducted to evaluate the effect of collection tube and freeze–thaw cycles on myeloperoxidase concentrations.
Methods
Acute coronary syndrome patients (n = 88) were enrolled after obtaining written informed consent from coronary care unit of a tertiary care hospital (January 2012–June 2014). About 5 mL venous blood was collected from patients and divided into serum, lithium heparin, ethylenediaminetetraacetic acid and sodium citrate tubes. Except serum, all tubes were kept on ice immediately after collection. Samples were centrifuged at −4℃, separated immediately after centrifugation and stored at −40℃ until analysis. Myeloperoxidase was quantified by in-house and commercial assays and re-quantified after five freeze–thaw cycles.
Results
Myeloperoxidase concentrations, (serum samples) determined by commercial and in-house assays correlated well (r = 0.946) (P < 0.001) and were higher in serum samples. Within plasma, myeloperoxidase concentrations were slightly higher in ethylenediaminetetraacetic acid (307.7 ± 52.1) and lower in lithium heparin (290.3 ± 49.2) and sodium citrate (221.4 ± 40.3) but not statistically significant. Correlation between myeloperoxidase concentrations (in-house enzyme-linked immunosorbent assay) after first cycle and fifth freeze–thaw cycle dropped to r = 0.448 (P < 0.001).
Conclusion
Myeloperoxidase concentrations are comparable in three types of plasma tubes when samples are placed on ice immediately, centrifuged at low temperatures and separated immediately after centrifugation. Multiple freeze–thaw cycles have an effect on myeloperoxidase and should be avoided for quantifying myeloperoxidase.
Introduction
The prevalence of coronary artery disease (CAD) is on rise globally, especially in developing countries, and is foreseen to be the major cause of mortality by the year 2020. 1 acute coronary syndrome (ACS) is an unstable manifestation of CAD that causes persistent threat to cardiac patients. In ACS, plaque develops inside the coronary arteries as a result of deposition of fat, cholesterol, calcium and other substances present in the blood. Some inflammatory processes trigger the deposition of these salts and fats in the veins. Myeloperoxidase (MPO) is an inflammatory marker and acts as a central link between inflammation and ACS. 2 It is a haemoprotein present in neutrophils and releases macrophages on activation of neutrophils. MPO acts as a catalyst in the conversion of chloride and hydrogen peroxide to hypochlorite and also assists in the oxidation of lipids present within low-density lipoprotein cholesterol.3,4 Furthermore, MPO consumes endothelially derived nitrous oxide reducing its bioavailability and resulting into impairment of vasodilatory and anti-inflammatory properties. Thus, MPO has got a role in the pathogenesis of ACS. An increase in MPO concentrations may occur during the early stages of ACS, even prior to the evidence of myonecrosis, probably reflecting instability of atherosclerotic plaque. 5
Several studies have reported that MPO concentrations may provide prognostic information in ACS patients.6–8 A few important studies have investigated the role of MPO for risk stratification of CAD.9,10 Zhang et al. 6 reported that in blood leukocytes, MPO activity was found to be elevated in CAD patients than angiographically confirmed normal controls. This elevated activity was extensively integrated with presence of CAD. 6 In another study, it was shown that risk of future CAD development was greater in consecutive quartiles of MPO concentrations. 11 In a cross-sectional study by Duzguncinar et al. 12 MPO concentrations were found to be raised in patients with CAD and associated with the degree and severity of atherosclerosis of the coronary arteries. 12
Besides the role of MPO in risk stratification of cardiovascular diseases, its transition from research to clinical settings requires further research. To accurately quantify MPO, there is a need to develop and validate accurate and reproducible analytical methods for MPO measurement and to evaluate preanalytical factors, like type of sample, sample handling and short-/long-term storage of samples. It has been reported that repeated freeze–thaw cycles effect MPO concentrations, but exact molecular mechanism is not yet known. It may be due to the fact that as MPO is an enzyme, repeated temperature changes disrupt its structure. In the present study, the effect of type of collection tube and effect of freeze–thaw cycles were evaluated on MPO concentrations of ACS patients.
Methodology
This comparative study was carried out at National Health Research Complex, and Coronary Care Unit (CCU), Department of Cardiology, Shaikh Zayed Medical Complex Lahore, from January 2012 to June 2014. Study protocol was approved by Ethical review board of Shaikh Zayed Post Graduate Medical Institute, Lahore. ACS patients (n = 88) of both genders, in the age range of 30–75 years, admitted in the CCU were enrolled after obtaining written informed consent. The diagnosis of patients was done according to American College of Cardiology and European Society of Cardiology diagnostic criteria for ACS. 13 All patients were treated as per American College of Cardiology/American Heart Association treatment protocol of ACS patients. Patients having diabetes, kidney disease, lung disease, cancer and rheumatoid arthritis were excluded from the study. For each patient a study proforma was filled, which included information on age, gender, body mass index (BMI), electrocardiogram, chest pain, troponin I, smoking history and MPO concentrations. Study participants were requested 5 mL of venous blood, which was drawn under aseptic conditions, within 18 h of admission to CCU. Blood was drawn after administration of anticoagulant (as anticoagulant is recommended to be administered immediately after confirmation of ACS). Routine treatment protocol of ACS patients was not interrupted. Blood samples were immediately divided into four parts: 2 mL in serum vacutainers (with separator gel), 1 mL in sodium citrate tube, 1 mL in ethylenediaminetetraacetic acid (EDTA) tube and 1 mL in lithium heparin tube. The serum tubes were kept at room temperature, whereas the plasma tubes were kept on ice instantly after collection. Samples were centrifuged in a refrigerated centrifuge machine (−4℃) at 2500 r/min for 20 min, within 1 h of collection. After centrifugation, samples were separated immediately from cell debris in order to avoid contact of separated serum/plasma with cells. Plasma and serum samples were stored in two aliquots at −40℃ until analysis.
MPO concentrations in serum samples (n = 88) were determined, using in-house MPO enzyme-linked immunosorbent assay (ELISA) and also by commercial kit (Quantikine human MPO ELISA; R&D systems, Minneapolis, USA), as per protocol of manufacturer. The in-house MPO assay is based on sandwich ELISA format. MPO-specific antibodies (APO 36, code: BM240-N4C7 SCIPAC, UK) were coated on microtitre plates (NUNC, maxisorp). Reference calibrants were prepared by using human MPO (code: 257-5, SCIPAC, UK). Paired biotinylated MPO antibodies (APO 35, code: 189-176-4, SCIPAC, UK) were used for coupling with streptavidin-Horseradish peroxidase (HRP) conjugate (S5512-0.5 mg/098K6001, Sigma). Substrate of HRP was prepared by dissolving 100 mg of tetra-methyl-benzidene (code: T2885, Sigma) per mL of dimethyl sulfoxide (MERCK). The in-house assay was developed and validated previously (in another project). The lower detection limit of in-house assay was 0.1 ng/mL. The intra-assay (n = 10 replicates) coefficient of variation (CV) at the concentrations of 570 ng/mL and 4376 ng/mL was 5.7% and 8.3%, respectively, and inter-assay CV (n = 10 assay batches) was 7.4% and 9.6%, respectively. The MPO concentrations in only 19 serum samples (determined by Quantikine kit) were compared with paired plasma MPO concentrations (lithium heparin, EDTA and sodium citrate) by Quantikine kit, due to budget constraints. To determine the effect of multiple freeze–thaw cycles on MPO concentrations, serum samples were re-quantified (using in-house ELISA), after five freeze–thaw cycles and were correlated with MPO concentrations determined by in-house MPO assay after first freeze–thaw cycle.
The data were entered and analysed using IBM SPSS Statistics 20.0. The quantitative variables including age and MPO concentrations are presented as mean ± standard deviation. Mann Whitney U-Test was applied to check the differences in MPO concentrations according to gender, BMI and smoking status. MPO concentrations determined by using Quantikine ELISA and in-house MPO assay were correlated by Pearson’s correlation coefficient. Mann Whitney U-Test was used to determine the difference between MPO concentrations in all three types of plasma samples. The value of P < 0.05 was considered significant.
Results
Clinical and laboratory parameters of enrolled ACS patients.
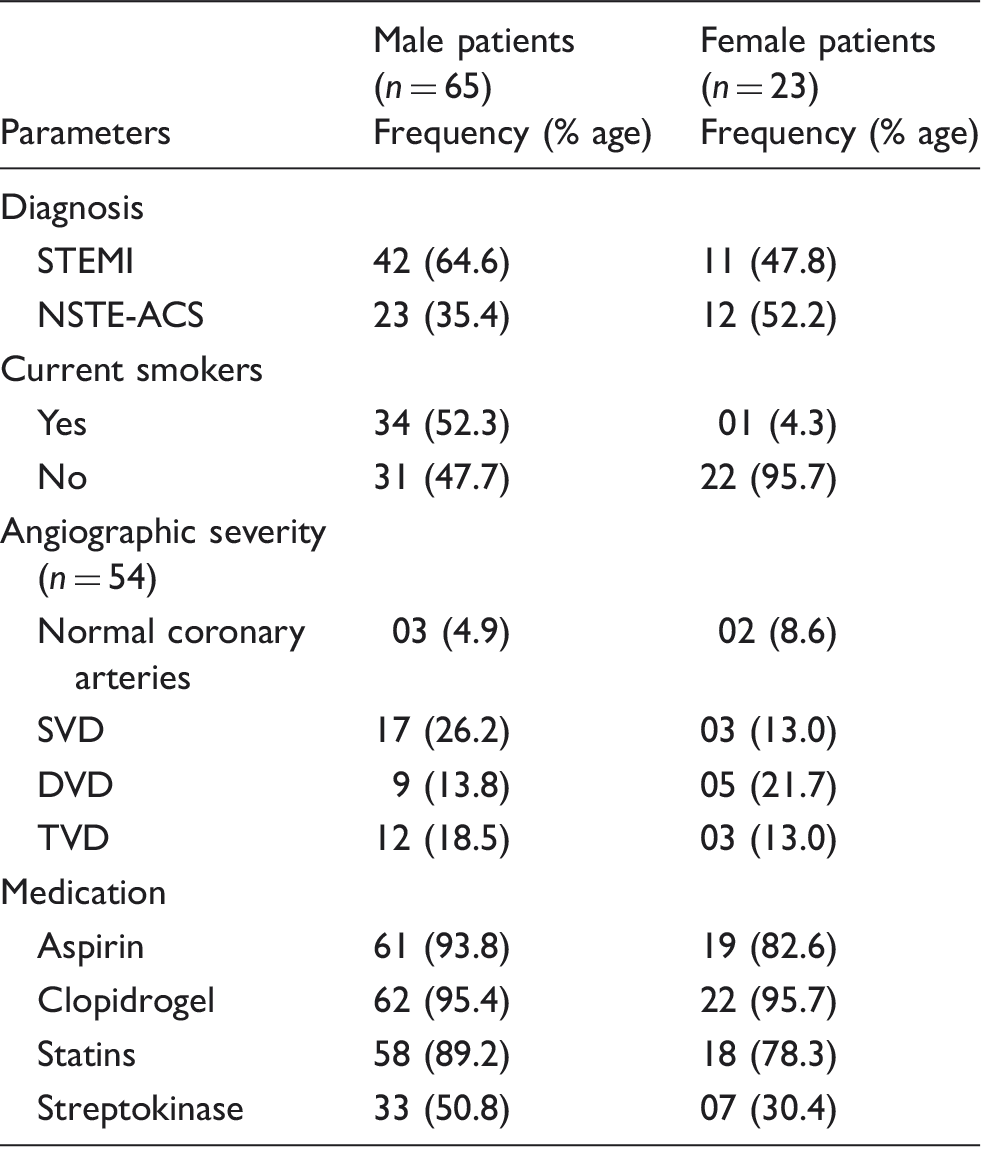
STEMI: ST segment elevation myocardial infarction; SVD: single vessel disease; DVD: double vessel disease; TVD: triple vessel disease.
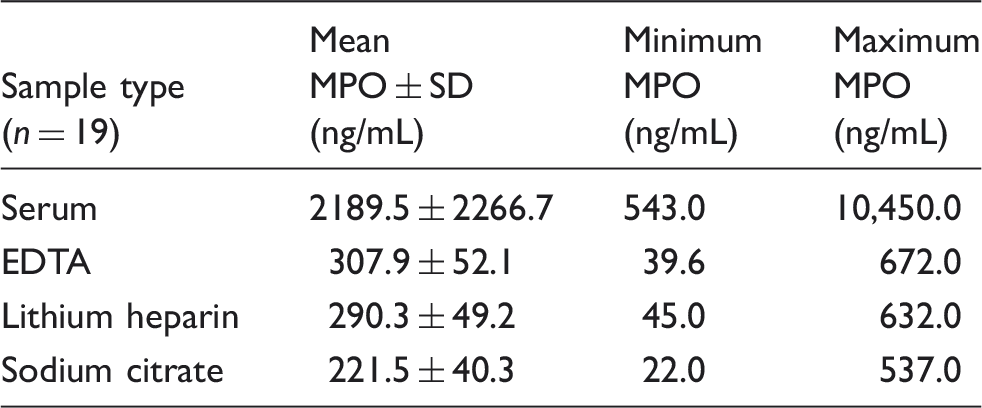
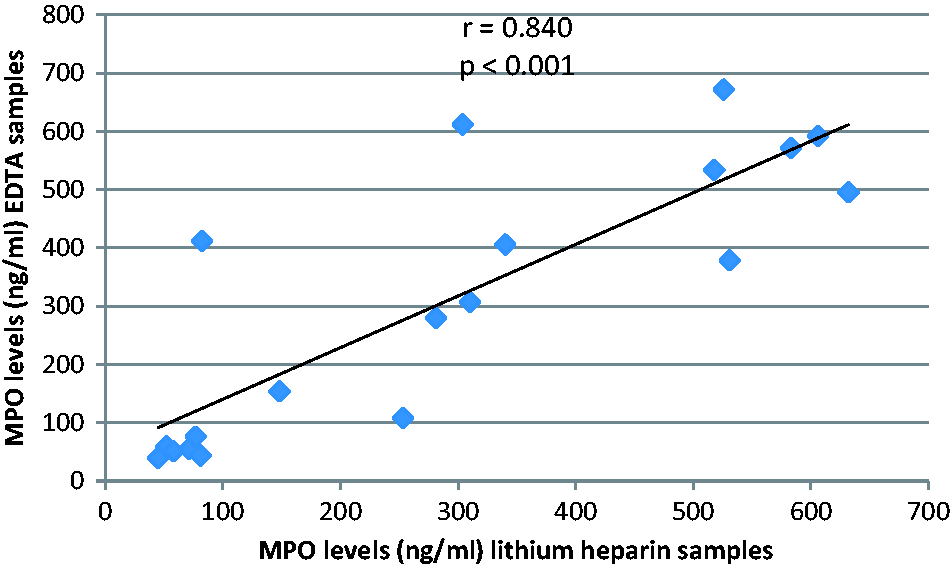
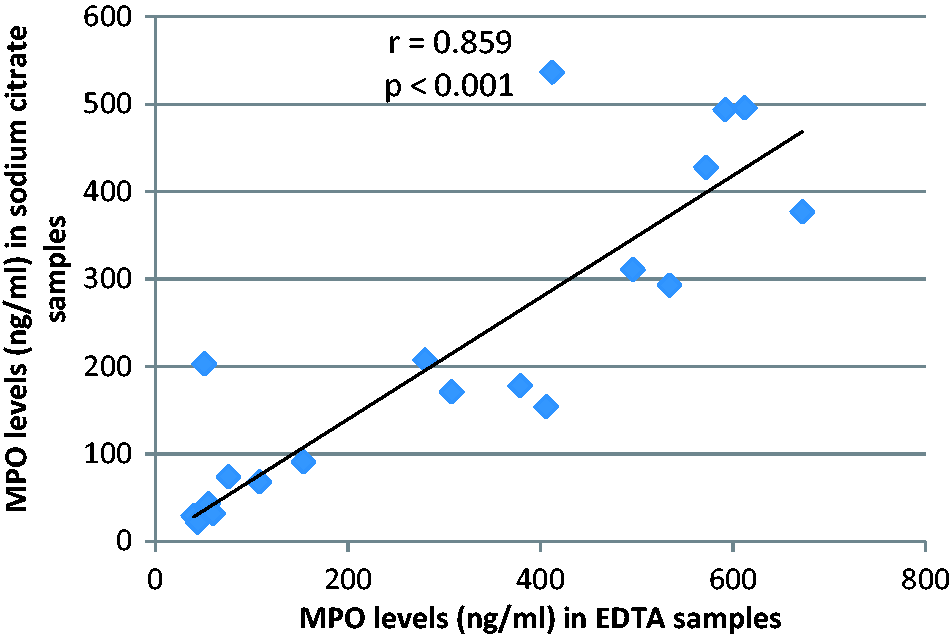
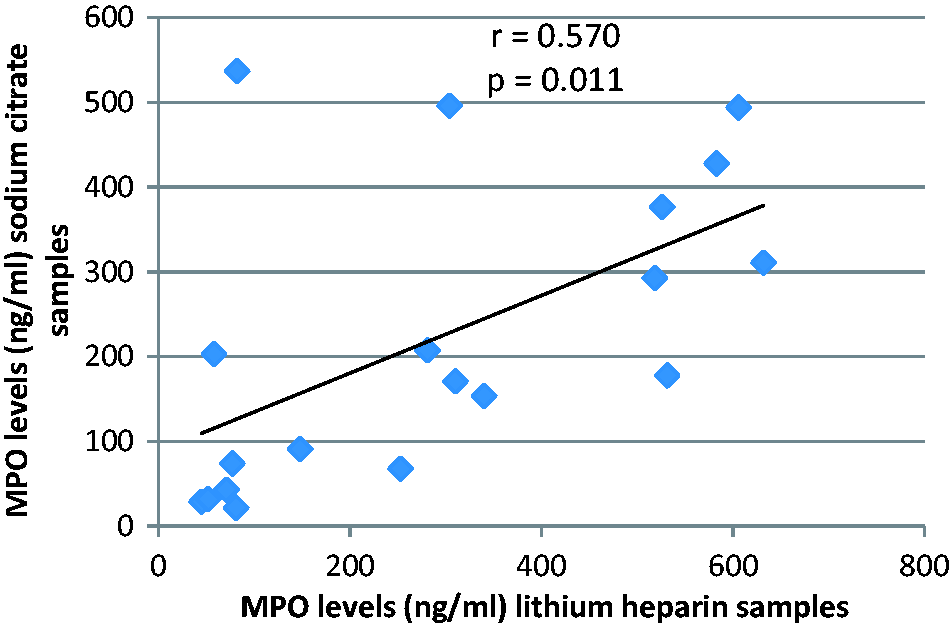
MPO concentrations in serum samples (n = 88) gave comparable results with both Quantikine ELISA (2164.1 ± 1914.5) and in-house ELISA (2193.2 ± 1960.7) (r = 0.946) (P = 0.000) (Figure 1). The MPO concentrations were higher in serum vs. plasma and statistically significant (serum vs. lithium heparin P-value = 0.000; serum vs. EDTA P-value < 0.001; serum vs. sodium citrate P-value < 0.001) and were apparently higher in EDTA vs. the other plasma tubes (Table 2) but not statistically significant (lithium heparin vs. EDTA P-value = 0.951; EDTA vs. sodium citrate P-value = 0.246; lithium heparin vs. sodium citrate P-value = 0.291). A weak correlation was seen when MPO concentrations in serum samples determined by Quantikine kit (samples n = 19 paired serum and plasma samples were quantified by Quantikine kit) were compared with MPO concentrations in EDTA plasma (r = 0.307) (P = 0.201), lithium heparin plasma (r = 0.567) (P = 0.011), and sodium citrate plasma (r = 0.133) (P = 0.586). However, a good positive correlation was seen between MPO concentrations in EDTA plasma (n = 19) and MPO concentrations in lithium heparin (n = 19) and sodium citrate plasma (n = 19) (Figures 2 and 3), respectively. A weak correlation was seen when MPO concentrations in lithium heparin plasma were compared with MPO concentrations in sodium citrate plasma (Figure 4).
Correlation between MPO concentrations determined by in-house MPO assay and Quantikine kit in serum samples of ACS patients. MPO concentrations in different types of samples by Quantikine MPO ELISA. MPO: myeloperoxidase; EDTA: ethylenediaminetetraacetic acid. Correlation between MPO concentrations determined by Quantikine MPO ELISA in lithium heparin and EDTA samples of ACS patients. Correlation between MPO concentrations determined by Quantikine MPO ELISA in EDTA and sodium citrate samples of ACS patients. Correlation between MPO concentrations determined by Quantikine MPO ELISA in lithium heparin and sodium citrate samples of ACS patients.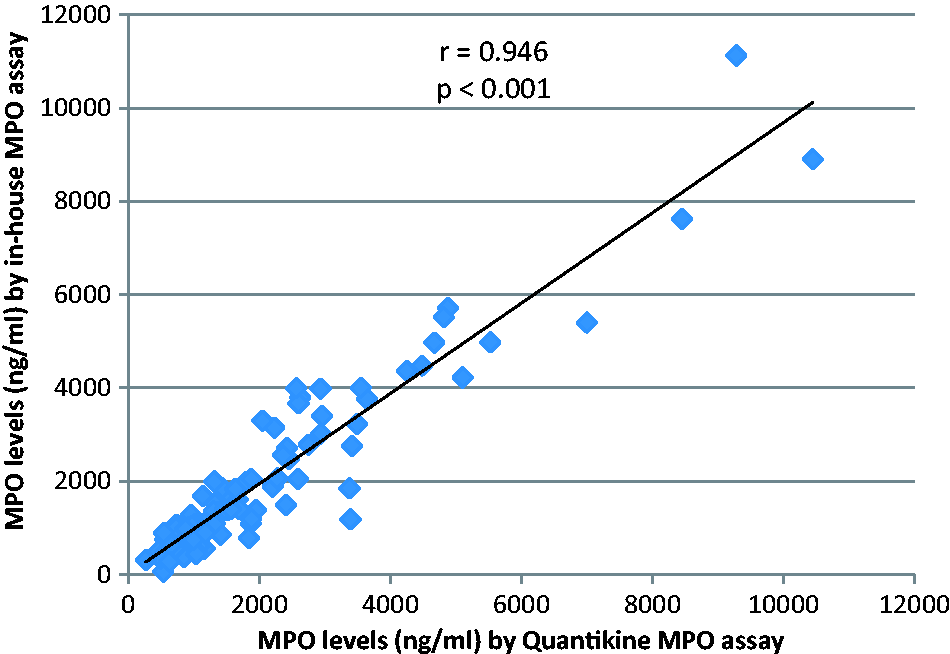
For stability of samples, the correlation between MPO concentrations by in-house assay after first freeze–thaw cycle and MPO concentrations after fifth freeze–thaw cycle was found to be r = 0.448 (Figure 5). This shows that samples are not stable over multiple freeze–thaw cycles. Rapid decrease in correlation was observed at fifth cycle so further freeze–thawing was not done.
Drop in correlation between MPO concentrations determined by in-house MPO assay after first and fifth freeze–thaw cycle in serum samples of ACS patients.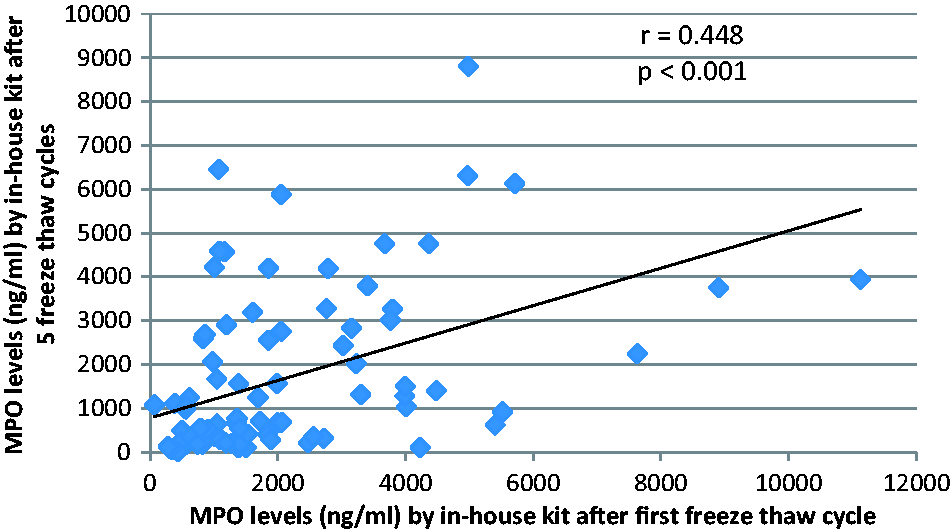
Discussion
Recent studies have linked increased concentrations of circulating MPO with increased risk for CAD development stratification of increased risk in patients with ACS and in the prognosis of heart failure patients.9–12,14 However, few studies have investigated the effect of preanalytical handling on MPO concentrations. Studies have shown different results due to variations in preanalytical handling, quantifying methods and storage conditions.15–17
Data about effect of multiple freeze–thaw cycles on MPO concentrations are scarce. Shih et al. 15 reported, less than 10% decrease in MPO concentrations after three freeze–thaw cycles. In our study, significant variation was observed in MPO concentrations after five freeze–thaw cycles. There was a drop in correlation (r = 0.946 to r = 0.448) between MPO concentrations determined by in-house MPO ELISA after first and after fifth freeze–thaw cycle. Multiple freeze–thaw cycles shall be avoided while quantifying MPO concentrations in order to avoid variation in results.
The impact of type of collection tube on MPO concentrations is a well-recognized fact; however, sufficient data are not available in this area. 18 In the current study, MPO concentrations were found to be the highest in serum samples and were significantly different from MPO concentrations in lithium heparin, EDTA and sodium citrate plasma samples. This could be due to the combined effect of serum samples and that serum samples were not kept on ice. Recommended temperature for blood clotting is room temperature (lower temperatures can affect the clotting process); therefore, serum samples were not kept on ice. Whereas among the plasma samples, MPO concentrations were slightly elevated in EDTA plasma, followed by MPO concentrations in lithium heparin and sodium citrate plasma samples, respectively. The difference between the MPO concentrations of all the three types of plasma samples was insignificant. These results are inconsistent with the results obtained by Shih et al., 15 they reported that MPO concentrations were constantly higher in samples (of ACS patients) collected in serum (918 pmol/L) and heparin (841 pmol/L) tubes compared with samples collected in EDTA (314 pmol/L) and citrate tubes (301 pmol/L). This variation in results may be due to different preanalytical handling protocols, the type of quantification method, the temperature at which centrifugation was carried out and duration of contact of serum/plasma with cells after centrifugation. In that study, samples were stored at room temperature before centrifugation, except EDTA samples, which were stored at 2–8℃ as whole blood for up to 24 h before centrifugation and MPO concentrations were determined by an automated chemiluminescent microparticle immunoassay (ARCHITECT MPO), centrifugation temperature was not mentioned. 15 The reason for increased MPO concentrations in heparin samples in the study conducted by Shih et al. 15 may be due to the fact that heparin helps in stimulating release of MPO from leukocytes and activates neutrophils during blood coagulation. 5 Scheffer et al. 16 reported that MPO concentrations remained comparatively constant in heparin samples, when stored on ice, while storage of samples at room temperature for 2 h resulted in four-fold increase in MPO concentrations in heparin samples 16 (means temperature can cause an increase in MPO concentrations in heparin tubes).
Results of the present study are also inconsistent with the study conducted by Wendland et al. 17 (15 patients with cardiac disease and 25 normal healthy volunteers were enrolled), which revealed no significant difference between MPO concentrations of heparin (28.7 ± 12.3 ng/mL) and serum (28.9 ± 13.4 ng/mL) samples while showed that MPO concentrations in EDTA samples (51.4 ± 15.5 ng/mL) were significantly elevated compared with heparin and serum samples. In that study, samples were kept on ice bath instantly for no-longer than 30 min, until centrifugation and MPO concentrations were measured using the Bioxytech MPO-EIA Kit (OXIS Health Products, Portland, USA). Information about centrifugation temperature was not specified. 17 According to the Wendland et al., 17 the neutrophils experience morphological changes when blood is added in EDTA tubes after sampling. These changes ultimately result in de-granulation of neutrophils and the formation of vacuoles in the cytoplasm and in the nucleus of the cells. This de-granulation may contribute to the increase of MPO concentrations in EDTA plasma. Wendland et al. 17 suggested that in order to avoid in-accurate risk stratification further studies should investigate blood collection in EDTA tubes and the reference range of MPO concentrations in EDTA tubes shall be determined.
The main finding of our study is that no significant difference is present between MPO concentrations in three types of plasma collection tubes, i.e. EDTA, heparin and citrate tubes. Further studies are recommended to confirm that MPO concentrations are comparable in all three types of plasma tubes when samples are kept on ice bath immediately after collection, centrifuged in a refrigerated centrifuge machine, and plasma is separated immediately after centrifugation. Wendland et al. 17 reported that MPO release continues to take place even after centrifugation. Therefore, it is suggested that plasma must be separated from cell debris immediately after centrifugation to avoid false increase in MPO concentrations due to continuous release of MPO from cell debris into the plasma.
Another factor influencing MPO measurement is administration of anticoagulant to ACS patients. Marshall et al. 19 reported that administration of heparin caused a marked increase of plasma MPO in STEMI patients. Heparin was identified to increase endothelial nitric oxide bioavailability by liberating vessel-immobilized MPO.20,21 This effect leads to a dose-dependent increase of MPO plasma values in patients with or without symptoms of AMI.19,21 Preclinical blood sample collections before the administration of heparin could be an option for generating valid data. 22
Different studies have reported diverse results for correlations between MPO concentrations determined in different types of samples. A good positive correlation was reported by Wendland et al. 17 between MPO concentrations for heparin and serum samples (r = 0.79), but no correlation was seen between EDTA and heparin samples (r = 0.21). 17 Shih et al. 15 reported correlations of EDTA vs. citrate (r = 0.96), EDTA vs. heparin (r = 0.89), EDTA vs. serum (r = 0.82). 15 In the present study, a good positive correlation was seen between MPO concentrations in EDTA samples compared with MPO concentrations in lithium heparin and sodium citrate plasma. These differences may be due to quantification method and sampling handling variations in the three studies.
Future research
The measurement of MPO needs standardization in certain aspects. Probable factors that could interfere in altering MPO concentrations need to be defined, the type and stability of sample (serum or plasma) need to be further evaluated and reference ranges in plasma samples collected in lithium heparin, EDTA and sodium citrate tubes should be established.
Footnotes
Acknowledgements
We are grateful to all the patients for participating in the study and all the doctors and nursing staff of Coronary Care Unit, Shaikh Zayed Hospital Lahore for their cooperation.
Declaration of conflicting interests
SN has received grants from Pakistan Medical Research Council for Lab consumables. FG provided technical advice for performing Lab Tests.
Funding
This research was done as a substudy, the main project titled; ‘Validation of in-house MPO assay with commercially available kit’ was funded by Pakistan Medical Research Council. BBI Solutions, UK provided reagents for conducting this substudy.
Ethical approval
The Institutional Review Board of Shaikh Zayed Hospital Lahore, Pakistan approved this study (IRB no.: 1128).
Guarantor
SN.
Contributorship
SN and FG researched literature and designed the study. SN and IAI were involved in protocol development, gaining ethical approval, patient recruitment and data analysis. FG provided technical assistance in performing and interpreting laboratory tests. SN wrote the first draft of the manuscript. All authors reviewed and edited the manuscript and approved the final version of the manuscript.