
Abstract
Background
The current first-line screening test for primary hyperaldosteronism is the plasma aldosterone:renin ratio; however, renin assays have several disadvantages and the ARR is affected by medications and physiological factors. Angiotensin II is a key biologically active hormone in the renin-angiotensin-aldosterone system. It has been suggested that measurement of equilibrium levels of this peptide, involving an in vitro incubation of serum prior to analysis, may provide a better marker of renin-angiotensin-aldosterone system activity than renin.
Methods
An eqAng II LC-MS/MS assay was developed, optimized and validated. Serum samples were incubated at 37°C for 45 min prior to stabilization with cold EDTA solution, solid phase extraction and LC-MS/MS analysis. Stability in whole blood and the effect of cryoactivation were assessed. For comparison to the current screening test, 150 anonymized patients’ samples were analysed for eqAng II, renin activity and aldosterone (all by LC-MS/MS).
Results
The assay had good precision, minimal bias and acceptable recovery. EqAng II did not change significantly when whole blood samples were stored for up to 72 h, and cryoactivation was only observed for pregnant patients. EqAng II was significantly correlated with renin, and the aldosterone:eqAng II ratio had a strong positive correlation with the aldosterone:renin ratio.
Conclusions
An LC-MS/MS assay for eqAng II has been developed which shows promise as an alternative screening test for primary hyperaldosteronism. Compared to renin assays, it is quicker, simpler and less likely to be affected by anti-hypertensive medications. Further clinical validation in hypertensive patients would be required prior to implementation.
Keywords
Introduction
Primary hyperaldosteronism (PHA) is the leading cause of secondary hypertension. A recent study showed a prevalence of 5.9% in hypertensive patients in primary care, 1 with a higher prevalence in those referred for specialist assessment.2,3 As PHA is treatable, it is important to identify patients with this condition in order to reduce morbidity and mortality. 4 Current diagnostic pathways usually incorporate a screening test, followed by confirmatory testing such as saline suppression or fludrocortisone suppression testing. 5
The most common screening test utilized is the plasma aldosterone:renin ratio (ARR); patients with PHA typically have an increased ratio due to raised aldosterone and consequent suppression of renin release. Plasma renin can be analysed directly using mass assays (plasma renin concentration; PRC) or plasma renin activity (PRA) can be determined. 5 PRC is thought to be insufficiently sensitive at lower concentrations and there is a poor correlation with PRA. 6 Previously, radioimmunoassays were commonly used to quantify PRA; however, LC-MS/MS assays have more recently been introduced. Despite the methodological improvements brought by the use of this technology, PRA assays remain time consuming due to the long incubation step and suffer from poor precision at lower activity levels. 7 PRA is also heavily influenced by many anti-hypertensive medications as well as physiological factors such as posture, phase of menstrual cycle, and dietary salt intake; this can lead to erroneous results and missed or delayed diagnosis of PHA. 5
Angiotensin II (Ang II) is a key player in the renin-angiotensin-aldosterone system (RAAS) because it directly modulates aldosterone production; however, circulating levels are low and Ang II is relatively unstable compared to renin and aldosterone. Therefore, to date, Ang II measurement has not been utilized in the diagnosis of PHA. 8 However, a potential new way to screen for PHA has been developed commercially by Attoquant Diagnostics, alongside clinical research groups.9–11 This test utilizes the aldosterone:Ang II ratio, with the concentration of Ang II being determined by LC-MS/MS following an incubation step, in order to generate equilibrium levels of the peptide (eqAng II). The 37°C incubation takes place in the absence of any protease inhibitors, and therefore at the end of the time period, an equilibrium between Ang II formation and degradation is thought to be established (shown schematically in Supplemental Figure 1). This significantly simplifies the assay compared to PRA determination and means that a much shorter incubation time can be used. It provides a readout of the overall activity of the RAAS, and may therefore be more physiologically relevant than focusing on renin activity in isolation. 12 Additionally, it is claimed that the aldosterone:eqAng II ratio (AA2R) may not be affected by anti-hypertensive medications including ACE inhibitors, and that there is a larger diagnostic window, with greater ability to differentiate between patients with and without PHA.11,13,14 However, the methodological details, technical validation, and clinical validation of this assay have not been published in detail and it is therefore difficult to assess whether this test could be useful in clinical practice.
Materials and methods
Patient sample material
Anonymized surplus patient serum and EDTA plasma from routine clinical samples received into the laboratory were utilized for the method development and validation experiments. Samples were collected and analysed over a period of three months and were stored frozen prior to analysis. In accordance with Trust policy, ethical approval was not required for this study. Pooled serum was used to provide quality control (QC) samples.
Preparation of internal standard, Ang II standards and spiked QC samples
ClearPoint™ Angiotensin II, 13C and 15 N labelled (AS-64805, AnaSpec Inc., Fremont, California, US) was utilized as an internal standard (IS) to enable accurate quantification of Ang II. Working IS solution consisted of 5000 ng/L IS in 50% v/v methanol (Honeywell LC-MS Chromasolv; SLS, Nottingham, UK) and this was added to standards or samples at a 1:10 ratio following the incubation period (i.e. 20 µL working IS to 200 µL inhibited standard/sample).
To produce calibration standards, angiotensin II peptide (A9525, Sigma-Aldrich, Poole, UK) was reconstituted to 2 mg/L in phosphate-buffered saline (PBS; Sigma-Aldrich) containing 0.5% w/v bovine serum albumin (BSA; Sigma-Aldrich). This was further diluted in PBS/0.5% BSA to produce eight standards at the following concentrations: 0, 10, 25, 50, 100, 250, 1000, 2000 ng/L. Standards were then mixed 1:1 with 17.8 mmol/L EDTA solution (EDTA disodium salt dihydrate [AnalaR Normapur, VWR, Lutterworth, UK] in dH2O) prior to storage at −80°C, to match patients’ samples which were diluted 1:1 with EDTA solution following incubation.
Spiked QC samples were produced in the same way as calibration standards to give concentrations of 30, 150, and 750 ng/L. These were diluted 1:1 with EDTA solution as above and stored at −80°C.
Ang II reference material (National Institute for Biological Standards and Control [NIBSC] Non WHO reference material, Angiotensin II [2.5 µg], code 86/538; NIBSC, Potters Bar, UK) was reconstituted in 1 mL PBS/0.5% BSA and stored in aliquots at −80°C.
Development and optimization of eqAng II method
Incubation conditions
Aliquots of serum samples (100 µL) were incubated at 37°C for differing time periods in order to generate Ang II. Samples were added to a polypropylene round bottom 96 deep well plate (1.2 mL, Fisher Scientific, Loughborough, UK) and the plate was then heat sealed before incubation in an Eppendorf ThermoMixer C fitted with a SmartBlock DWP 1000 Thermoblock.
A 45-min incubation period was found to be optimal.
Requirement for protease inhibitors
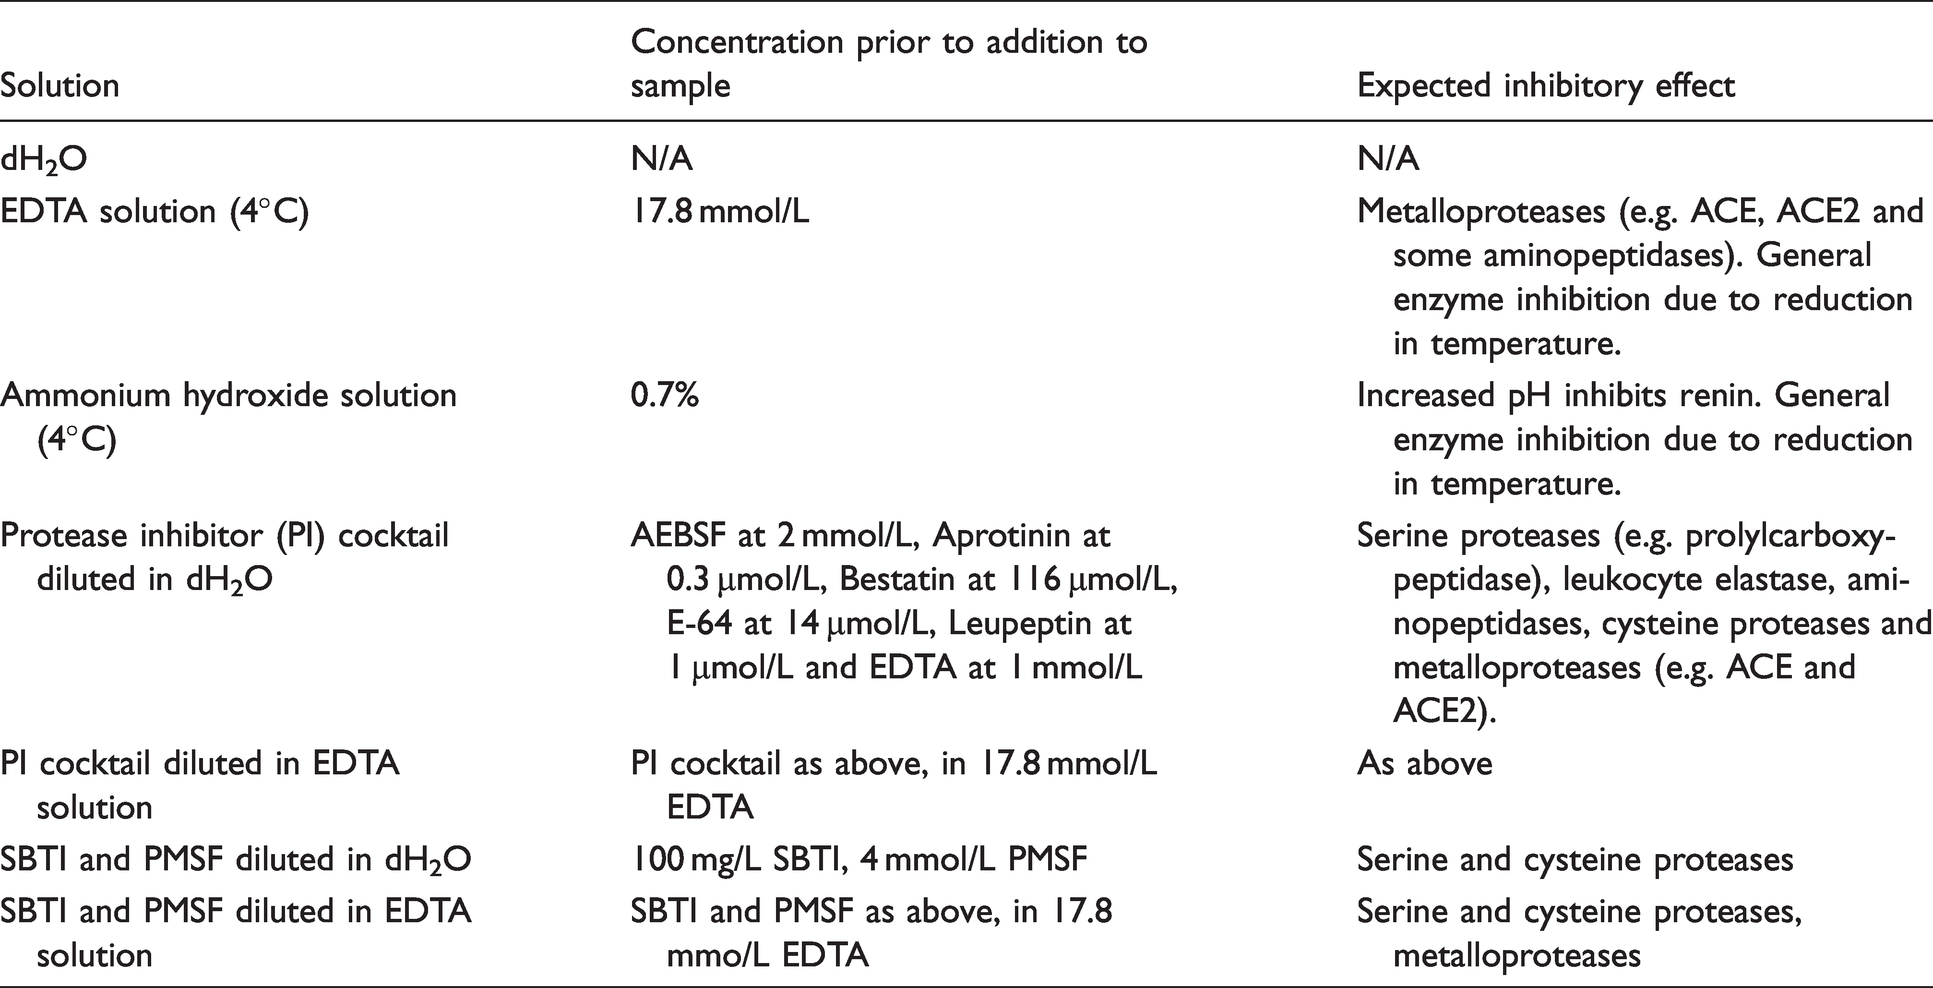
At the end of the incubation period, a solution to inhibit further generation or breakdown of Ang II was added at a 1:1 ratio with the sample. Inhibitor solutions consisted of one of the following: 17.8 mmol/L EDTA, stored at 4°C. Ammonium hydroxide solution 0.7% stored at 4°C (2 mL of 35% ammonium hydroxide solution [Fisher Scientific] added to 100 mL dH2O). Protease inhibitor cocktail (P2714; Sigma-Aldrich): 10× stock diluted 1 in 10 in dH2O or 17.8 mmol/L EDTA. 100 mg/L Soybean trypsin inhibitor (SBTI; N1876 Sigma-Aldrich) and 4 mmol/L phenylmethylsulfonylfluoride (PMSF; Sigma-Aldrich, stock solution stored at 200 mmol/L in propan-2-ol) in dH2O or 17.8 mmol/L EDTA. dH2O.
Samples were then left at room temperature for 2 h prior to extraction and analysis. The optimal inhibitor solution was determined to be 17.8 mmol/L cold EDTA solution.
Sample extraction procedure
Following incubation and addition of EDTA solution to serum samples, 200 µL of each calibration standard/spiked QC (ready diluted 1:1 with EDTA solution) was added to empty wells of the reaction plate. Ang II IS was then added to all wells.
Waters Oasis MAX 96-well plates (mixed mode anion exchange, 30 µm, 10 mg sorbent, part no. 186000375; Waters, Manchester, UK) were used for solid phase extraction. See Supplemental Methods for further details.
Liquid chromatography and mass spectrometry
Using a Waters Acquity UPLC®, 75 µL of reconstituted sample was injected onto an Xbridge Peptide BEH C18 column (130 Angstrom, 5 µm, 2.1 × 50 mm, part no. 186003574; Waters) with an attached guard column (SecurityGuard C18 Gemini column 4 × 2 mm part no. AJO-7596; Phenomonex, Macclesfield, UK). Mobile phase A consisted of 0.2% (v/v) formic acid (VWR) in dH2O and mobile phase B was 0.2% formic acid (v/v) in methanol. Initial conditions were 20% mobile phase B at a flow rate of 0.6 mL/min, and this was increased linearly to 50% mobile phase B over 0.9 min. At 1.1 min, the flow rate was increased to 0.75 mL/min and mobile phase B composition increased to 100%. After holding for 0.4 min, initial conditions were restored in order to re-equilibrate. Ang II was found to elute at approximately 1.14 min (Supplemental Figure 2(a)).
A Waters Xevo® TQ-S tandem mass-spectrometer with Z-spray ion source was used with MassLynx 4.1 software, using electrospray ionization in positive mode. The capillary was maintained at 0.9 kV, the cone voltage was 60 V, source temperature 150°C, desolvation temperature 600°C, and desolvation gas flow 850 L/h. The specific transitions monitored in multiple reaction monitoring mode were m/z 524 > 784.65 (Ang II) and 527.5 > 791.7 (Ang II IS), both with a cone voltage of 60 V and collision energy of 18 V. Calibration lines were produced by MassLynx TargetLynx™ software (Supplemental Figure 2(b)), using the ratio of analyte peak height to IS peak height, to allow calculation of unknown values.
Method validation
Imprecision, bias and lower limit of quantification
Spiked QC material at three different concentrations was used for assessment of the within-batch imprecision of the extraction process and LC-MS/MS analysis. In order to evaluate the within-batch imprecision for the entire assay procedure including the incubation step, pooled serum was used at three different concentrations (termed reaction QC). The coefficient of variation (CV) was then calculated from at least 10 replicates.
Between-batch imprecision was assessed over a period of several months using both spiked QC material and reaction QC with at least 10 replicates. Bias (%) was calculated using the between-batch spiked QC data, dividing the mean measured concentration by the expected concentration of spiked Ang II and multiplying by 100.
The lower limit of quantification (LLOQ) was determined using a solution of PBS/0.5% BSA (w/v) spiked with 10 ng/L Ang II, and the CV and bias were calculated using data from 10 replicates.
Recovery and matrix effects
Recovery of Ang II was assessed by spiking identical volumes of three different concentrations (40, 200, 1500 ng/L final concentration) of Ang II (or PBS/0.5% BSA blank) into PBS/0.5% BSA and into anonymized serum samples prior to addition of IS, extraction, and LC-MS/MS analysis. Measured Ang II was then compared to the expected concentration, taking into account endogenous Ang II as measured in the blank-spiked serum samples.
Ang II reference material was spiked into three separate patient serum samples at a concentration of 100 ng/L in order to assess recovery/bias. The samples were then analysed in triplicate and the recovery calculated by comparison of measured to expected Ang II, following subtraction of the endogenous concentration (determined by analysis of blank-spiked serum samples).
Matrix effects were investigated by spiking known concentrations of Ang II (40, 200, 1500 ng/L or blank) together with IS into the 20% methanol solution used to reconstitute extracted samples. Spiked solutions were analysed alone four times to generate a mean value for comparison. They were then used to reconstitute extracted samples consisting of PBS/0.5% BSA or five serum samples. The spiked, reconstituted extracts were then analysed and the Ang II peak heights were compared to the mean peak heights obtained for the reconstitution buffers alone, to generate a % recovery value. In the case of serum samples, the endogenous Ang II signal was subtracted prior to calculation of recovery.
Linearity and carry-over
The linearity of the assay within the range of the calibration line was assessed by recording the r2 values from a representative set of 12 runs and calculating the mean. LC-MS/MS carry-over was evaluated by injecting an extracted sample consisting of PBS/0.5% BSA spiked with a high concentration of Ang II (20,000 ng/L) followed by a blank PBS/0.5% BSA sample, and comparing the peak heights.
Sample type and stability
EqAng II was quantified in serum samples from five individuals and compared to lithium heparin plasma samples from the same individual. Whole blood sample stability was tested using clotted, unseparated samples (from 5 individuals) in BD Vacutainer™ serum gel tubes stored at room temperature for up to 72 h. At 0, 2, 24, 48, and 72 h post-collection, samples were centrifuged and the serum frozen prior to eqAng II analysis.
The concentration of eqAng II in aliquots stored at 4°C for 24 h was compared with aliquots from the same patient that were frozen on the day of collection without 4°C storage. Finally, the effect of an additional freeze-thaw cycle on eqAng II results was examined.
Comparison of eqAng II concentration with plasma renin activity, and ratios with aldosterone
Surplus patient serum and EDTA plasma samples (150 paired samples) from routine laboratory samples were anonymized and analysed for renin activity and aldosterone (EDTA plasma), and eqAng II (serum) using the procedures described above. The plasma renin activity and aldosterone assays are both established, in-house LC-MS/MS methods which are in routine use.15–17
The eqAng II concentration was compared to the renin activity in paired samples and the correlation between the results was assessed. In addition, the ARR was compared to the AA2R for each individual.
Statistical analysis
Statistical analyses were carried out using Analyse-it software for Microsoft Excel (version 5.30.2; Analyse-it Software Ltd, Leeds, UK). The Wilcoxon - signed-rank test was used to compare paired results as appropriate, and correlations were assessed using Spearman's rank correlation coefficient. The Shapiro–Wilk test was used to evaluate eqAng II data distribution.
Results
Development and optimization of the eqAng II method
Sample incubation conditions
The equilibrium level of Ang II in serum samples is hypothesized to provide an indicator of the overall activity of the RAAS. To reach equilibrium concentrations, an incubation period at 37°C is required. To determine the optimum incubation time, two pooled serum samples and five individual patient serum samples were incubated for varying time periods (0, 15, 30, 45 and 60 min) prior to the reaction being stopped with cold 17.8 mmol/L EDTA solution. Following extraction and LC-MS/MS analysis, the time course for Ang II generation could be plotted (Figure 1(a) and (b)).
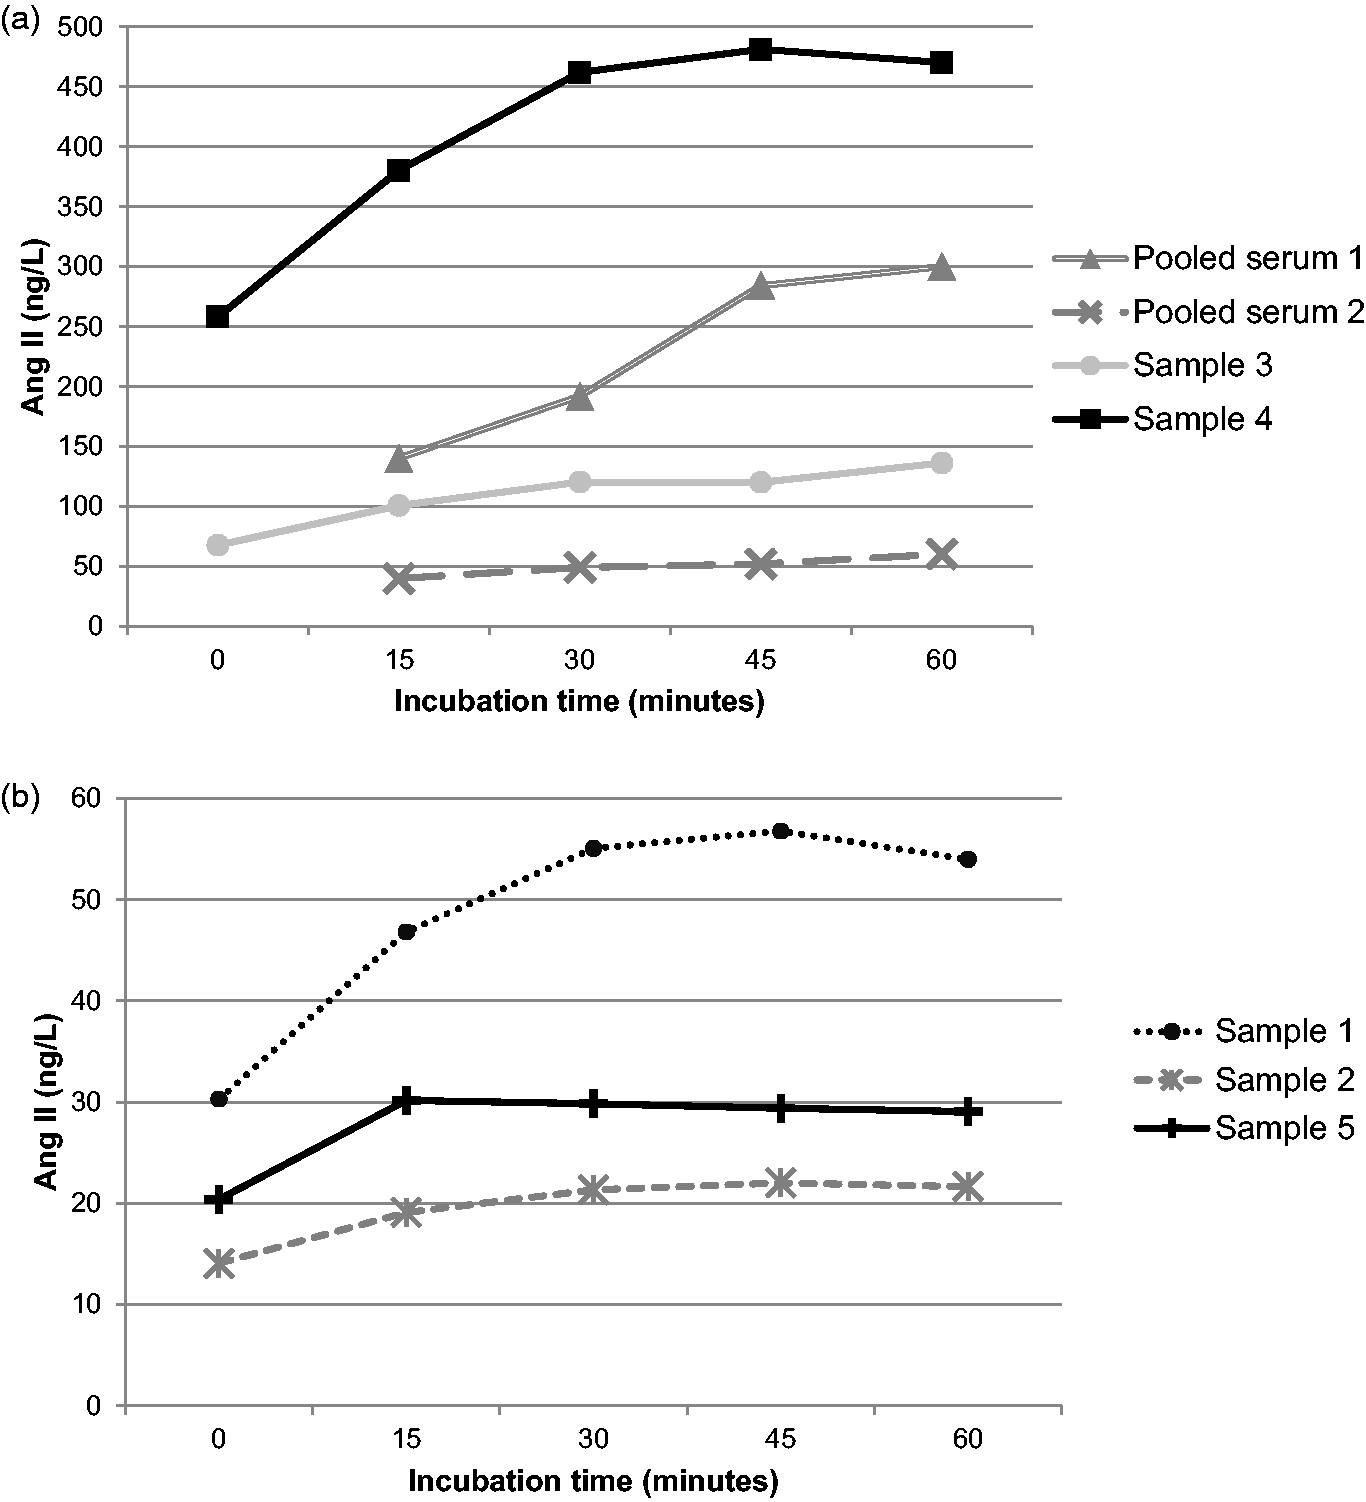
Time course of Ang II generation in serum samples; 100 µL aliquots of each sample were incubated for varying amounts of time before the reaction was stopped. Ang II was measured by LC-MS/MS analysis following extraction. (a) Samples with higher baseline concentrations of Ang II. (b) Samples with lower baseline concentrations.
Comparison of the Ang II concentrations at 45 and 60 min by Wilcoxon signed-rank test showed no significant difference (P = 0.6875; Table 1). Although the difference in Ang II concentration between the 30 and 60 min time points was also not significant (Wilcoxon signed-rank test), for one serum sample the time course showed a clear change between 30 and 45 min. Therefore, 45 min was chosen as the optimal time point to ensure equilibrium could be reached for all samples tested.
Comparison of Ang II concentrations following a 45 or 60-min incubation period.
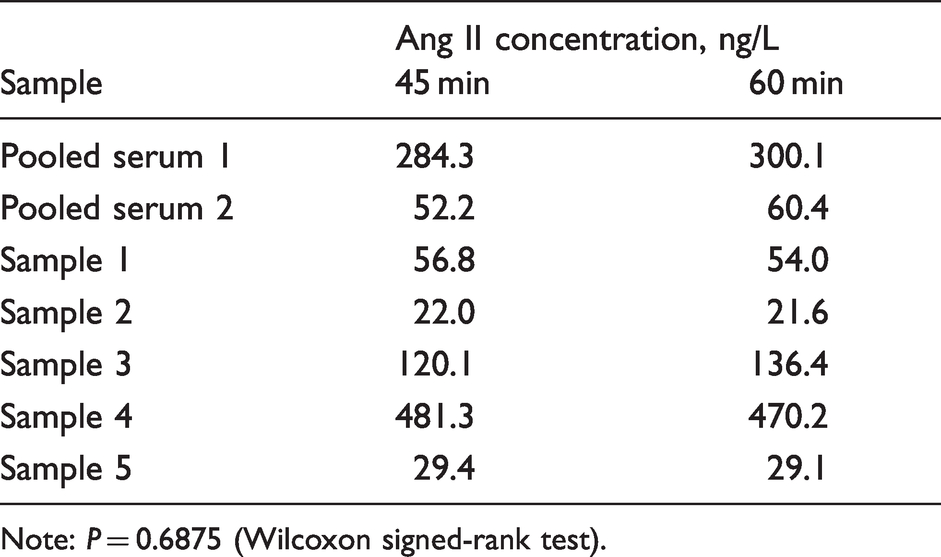
Note: P = 0.6875 (Wilcoxon signed-rank test).
To further assess the assay kinetics, 22 patient serum samples were incubated for 45 min and the eqAng II concentration was compared to the baseline Ang II in the same samples prior to incubation (Supplemental Figure 3). The mean fold increase was 2.11. Two samples showed a slight decrease in Ang II over the period and the largest increase was 3.6 fold.
Requirement for enzyme inhibitors
At the end of the incubation period, further generation or degradation of Ang II must be inhibited in order to preserve the equilibrium concentration. A range of inhibitors were tested in order to determine the optimum combination. Table 2 shows the solutions tested and their predicted inhibitory effect; all were added at a 1:1 ratio with the serum sample immediately following the incubation period, and samples were then left at room temperature for a further 2 h prior to analysis.
Inhibitory solutions tested and their expected effects.
Results are shown in Figure 2. The addition of dH2O alone resulted in the lowest concentration of Ang II for four out of the six samples tested, likely due to breakdown of the Ang II which had been generated. The highest levels of Ang II were seen with the addition of 17.8 mmol/L EDTA solution or 0.7% ammonium hydroxide (on average 229% and 257%, respectively when compared to the concentrations seen with dH2O alone). EDTA will inhibit ACE due to metal ion chelation, thereby preventing further Ang II generation, and it will also inhibit ACE2 and other metalloproteases such as aminopetidases which are known to degrade Ang II. Ammonium hydroxide increases the pH of the sample which would strongly inhibit renin activity, but it may not affect ACE activity in the same way and therefore the slightly higher levels of Ang II seen in the presence of 0.7% ammonium hydroxide could be due to continued generation of Ang II.
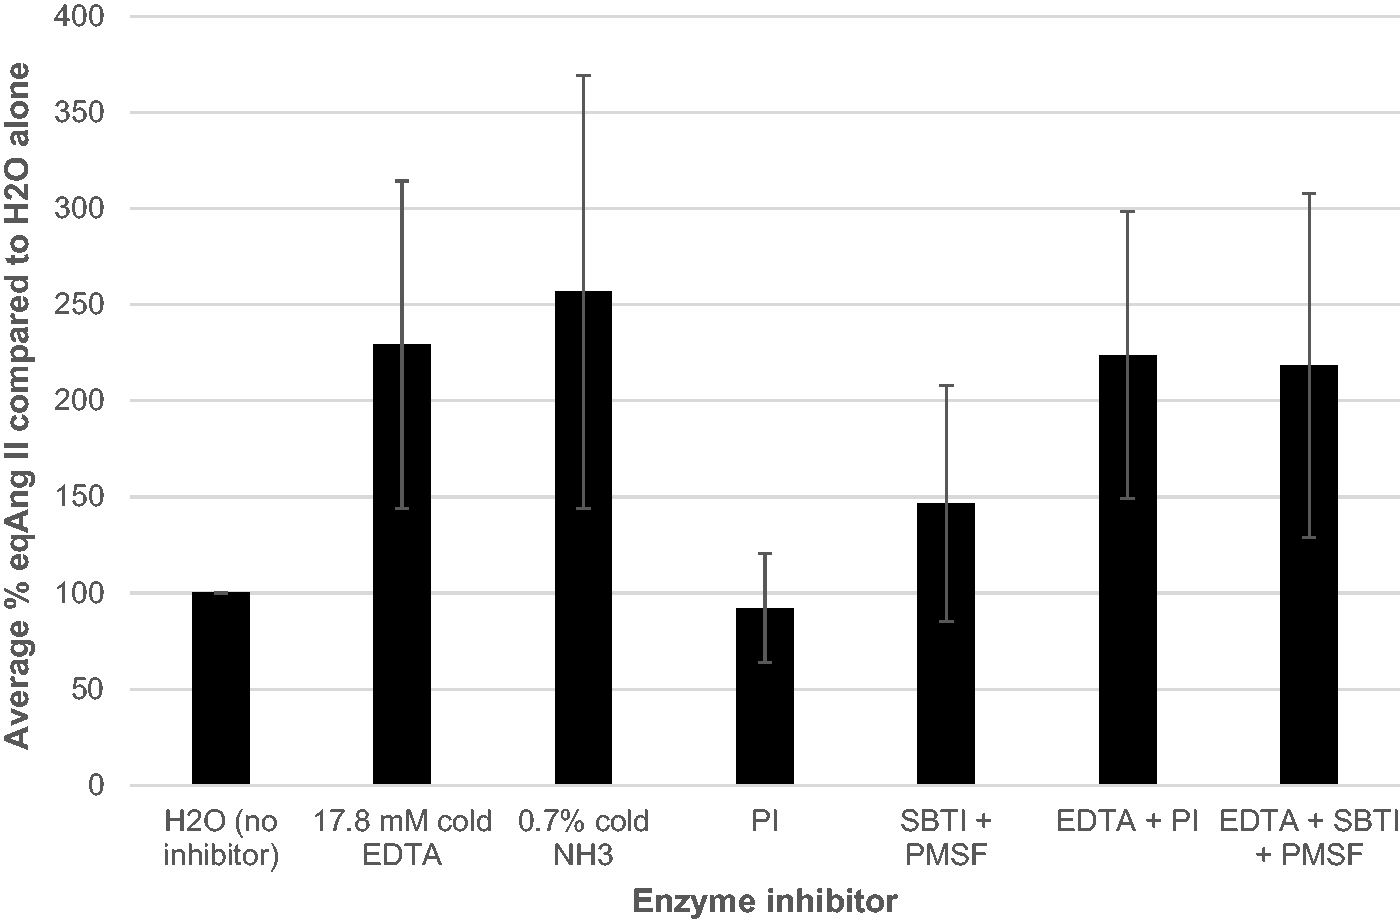
Effect of different enzyme inhibitor solutions on stabilization of eqAng II concentration following incubation. Six serum samples were tested using the combinations shown, and were extracted and analysed following 2 h at room temperature ± inhibitors. Data are presented as mean +/- SD for all six samples, using % eqAng II when compared to the concentration measured in the absence of inhibitors. PI: protease inhibitor; SBTI: soybean trypsin inhibitor; PMSF: phenylmethylsulfonylfluoride.
PI cocktail resulted in low concentrations of Ang II on a par with H2O alone; this may be due to inadequate inhibition of metalloproteases. In support of this, when PI was diluted in EDTA solution instead of dH2O, the Ang II concentrations mirrored that of EDTA alone. A similar effect was seen with SBTI and PMSF, indicating that cold EDTA is the only addition required in order to stabilize egAng II concentrations. The optimal inhibitor solution was therefore determined to be 17.8 mmol/L cold EDTA solution added at a 1:1 ratio to samples immediately following the incubation period.
Method validation
Imprecision, bias and LLOQ
Within- and between-batch imprecision were assessed using both spiked QC material (which did not undergo incubation) and pooled patient serum which underwent incubation prior to extraction. Imprecision data obtained using the QC material are a measure of the variability of the extraction and LC-MS/MS procedures, whereas pooled patient serum (termed reaction QC) demonstrates the imprecision of the entire assay. Spiked QC material was also used to calculate the assay bias. Table 3 shows the CV and bias values obtained.
Imprecision and bias data for eqAng II LC-MS/MS assay using spiked QC and reaction QC.
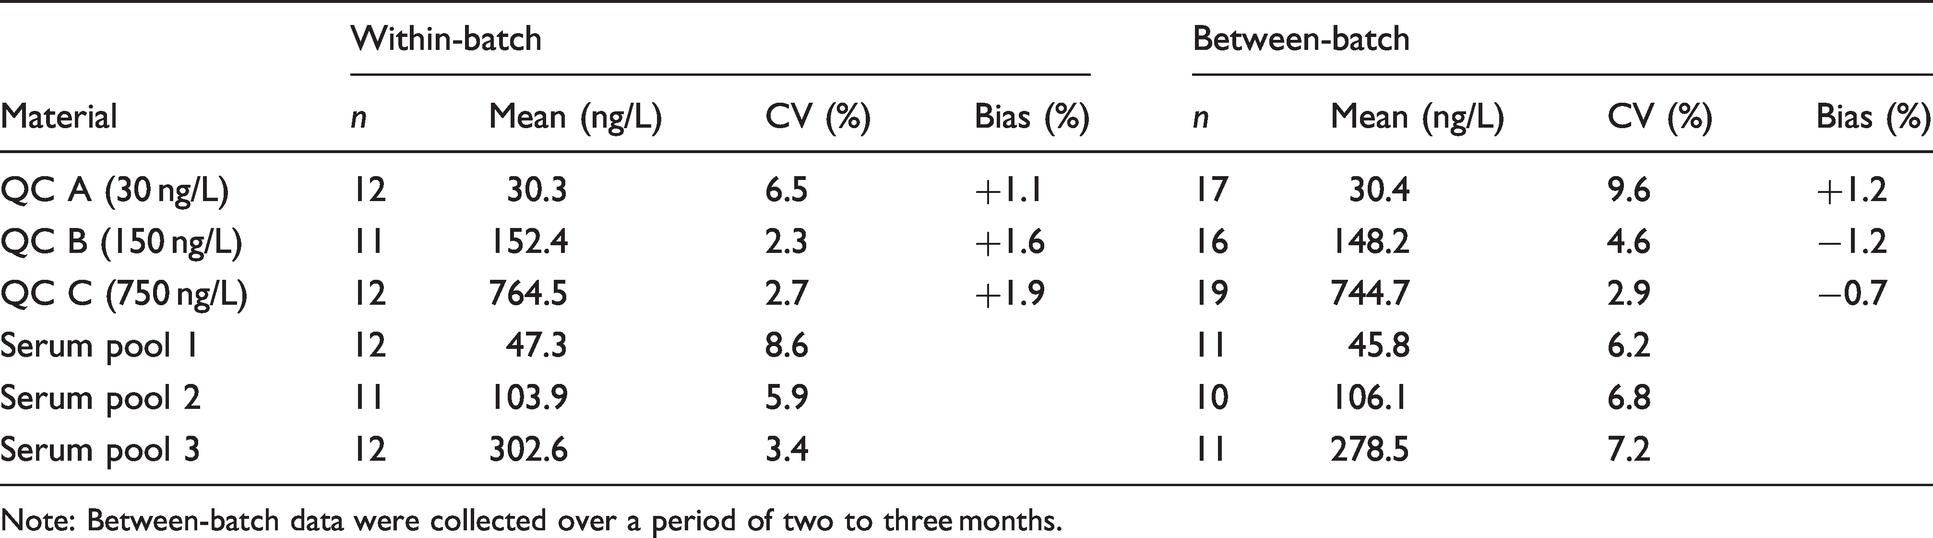
Note: Between-batch data were collected over a period of two to three months.
The LLOQ for an assay indicates the lowest concentration that can be measured with acceptable bias and precision, conventionally taken to be a CV/bias of less than 20%. In this case, the LLOQ was determined using PBS/0.5% BSA spiked with 10 ng/L Ang II, as human serum lacking endogenous Ang II is not available. The spiked solution was extracted and analysed 10 times in a single batch, and the CV was determined to be 7.0% with a bias of −6.9% (mean value 9.3 ng/L).
Recovery and matrix effects
Three different concentrations (40, 200, 1500 ng/L) of Ang II peptide (or blank) were spiked into PBS/0.5% BSA as well as into five anonymized serum samples prior to addition of IS, extraction and LC-MS/MS analysis. Ang II recovery was then calculated (Table 4).
Recovery data for eqAng II LC-MS/MS assay using spiked PBS/0.5% BSA and serum.
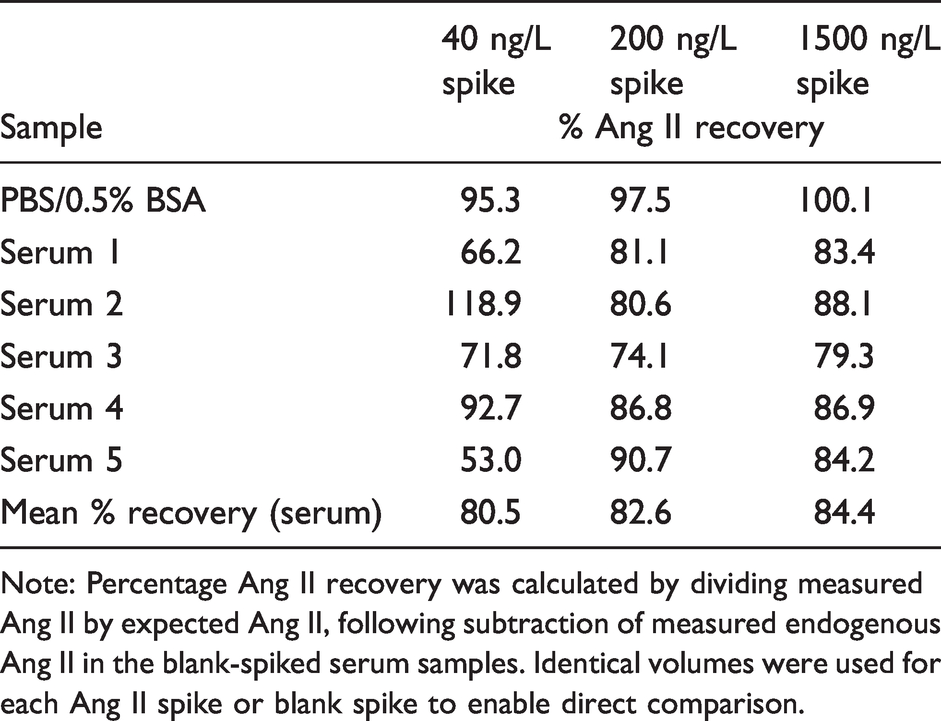
Note: Percentage Ang II recovery was calculated by dividing measured Ang II by expected Ang II, following subtraction of measured endogenous Ang II in the blank-spiked serum samples. Identical volumes were used for each Ang II spike or blank spike to enable direct comparison.
Recovery using an Ang II peptide reference material supplied by NIBSC was also assessed in the same manner. With 100 ng/L spikes of reference material into three separate patient serum samples, recovery was on average 109.0% after subtraction of endogenous Ang II.
In order to investigate the effect of sample matrix on the assay, reconstitution buffers containing four different concentrations of Ang II were used to reconstitute extracted PBS/0.5% BSA or five different extracted patient serum samples. Following LC-MS/MS analysis, recovery of the Ang II spiked into the reconstitution solutions was calculated.
Results are shown in Table 5. Compared to analysis of the spiked solutions alone, recovery of Ang II in the presence of extracted PBS/0.5% BSA ranged from 84% to 91%. However, in the presence of serum, recovery was significantly reduced. As Ang II IS was also added to the spiked reconstitution solutions, the IS signal could be used to correct for the clear matrix effect observed. When this was done (Table 5), recovery in the presence of serum was restored to >99% on average for all three Ang II concentrations tested.
Effect of sample matrix on measured Ang II.
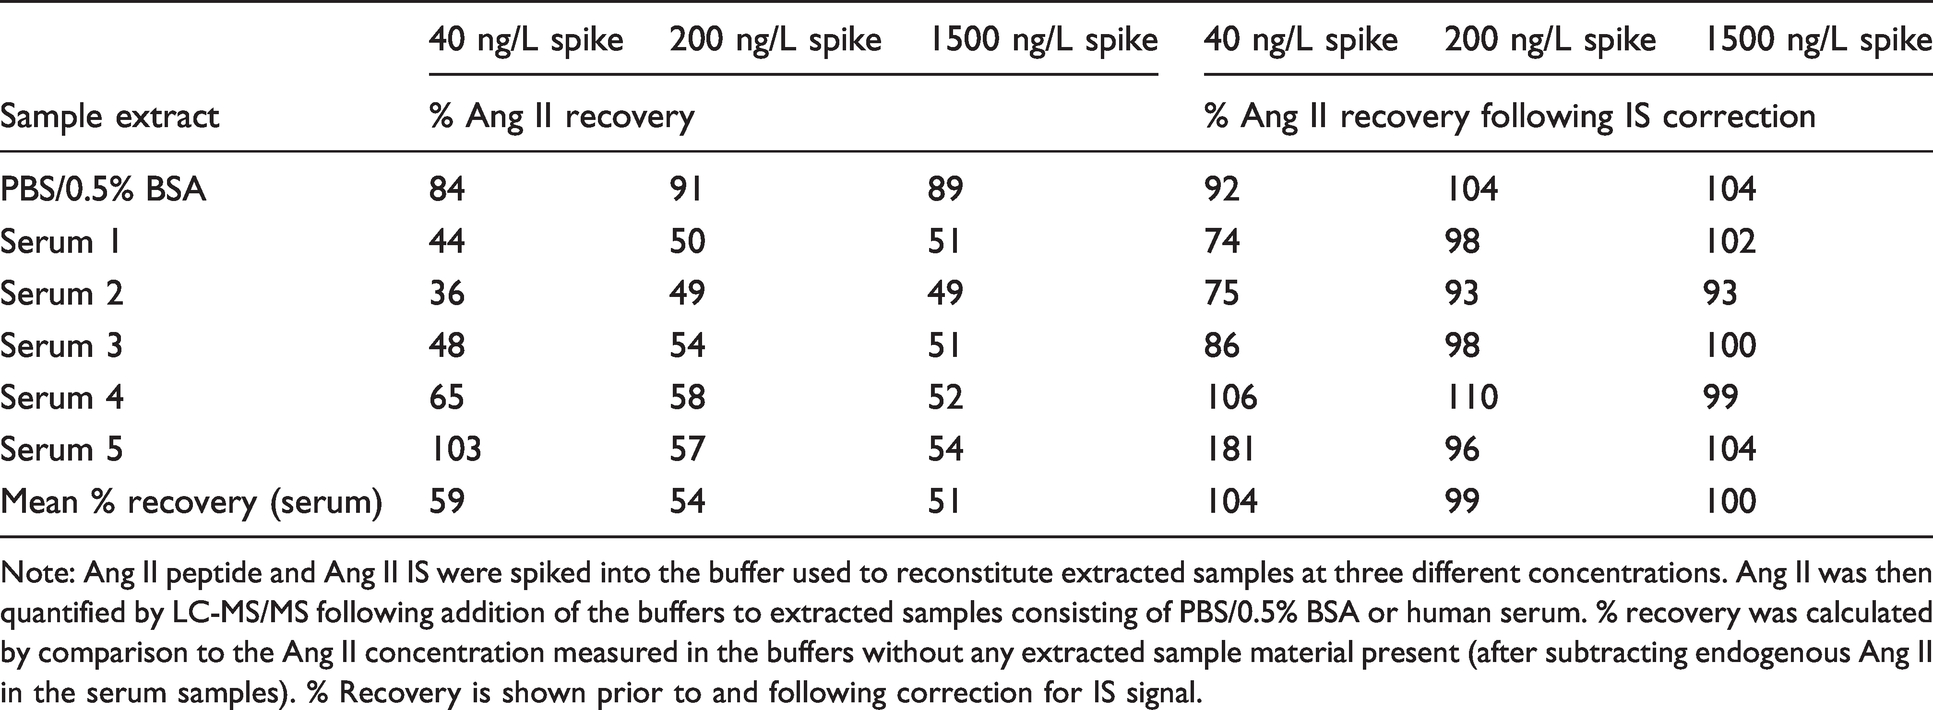
Note: Ang II peptide and Ang II IS were spiked into the buffer used to reconstitute extracted samples at three different concentrations. Ang II was then quantified by LC-MS/MS following addition of the buffers to extracted samples consisting of PBS/0.5% BSA or human serum. % recovery was calculated by comparison to the Ang II concentration measured in the buffers without any extracted sample material present (after subtracting endogenous Ang II in the serum samples). % Recovery is shown prior to and following correction for IS signal.
Linearity and carry-over
In order to assess linearity within the range of the standard concentrations used, a representative set of 12 experiments were evaluated. The mean r2 value from the calibration lines was calculated to be 0.9994; this indicates that the assay is linear up to at least 2000 ng/L Ang II. No patients’ samples with concentrations greater than 1000 ng/L were encountered during this study and therefore assessment of linearity beyond this point or sample linearity on dilution was not required.
Sample carry-over was investigated by analysing a sample spiked with 20,000 ng/L Ang II, followed by a blank sample and comparing the Ang II peak heights. The mean % carry-over (5 replicates) was 0.09%, demonstrating that carry-over is very unlikely to be an issue with this assay.
Sample type and stability
To assess whether lithium heparin plasma would also be a suitable sample type for determination of eqAng II, paired serum and plasma samples were obtained from five individuals and analysed side by side. The mean difference between the sample types was 0.0005% (range −9.1% to +10.7%), and the difference was not statistically significant (Wilcoxon signed-rank test, P = 0.8125).
Stability in whole blood samples was evaluated using five clotted, unseparated blood samples from five individuals, stored at room temperature. At 0, 2, 24, 48 and 72 h post-collection, samples were centrifuged and the serum frozen ready for analysis. Supplemental Figure 4 shows the eqAng II concentrations across the time course. Although small changes were observed, no overall trend could be identified, and when results from 72 h were compared with those from 0 h, the differences were not statistically significant (Wilcoxon signed-rank test, P = 0.1875).
Renin activity is known to increase when patients’ samples are stored at 4°C due to cryoactivation of prorenin to the active form, 7 particularly in samples from pregnant patients. The effect on eqAng II was tested by comparing serum aliquots stored for 24 h at 4°C with those frozen on the day of collection. In nine non-pregnant patients (males and females), the mean change in eqAng II following storage was +3.3% (Figure 3(a)). This change was not significant (Wilcoxon signed-rank test, P = 0.8203). However, for serum samples from pregnant females, eqAng II increased by a mean of +80.8% (Figure 3(b)), and this change was statistically significant (Wilcoxon signed-rank test, P = 0.0078).
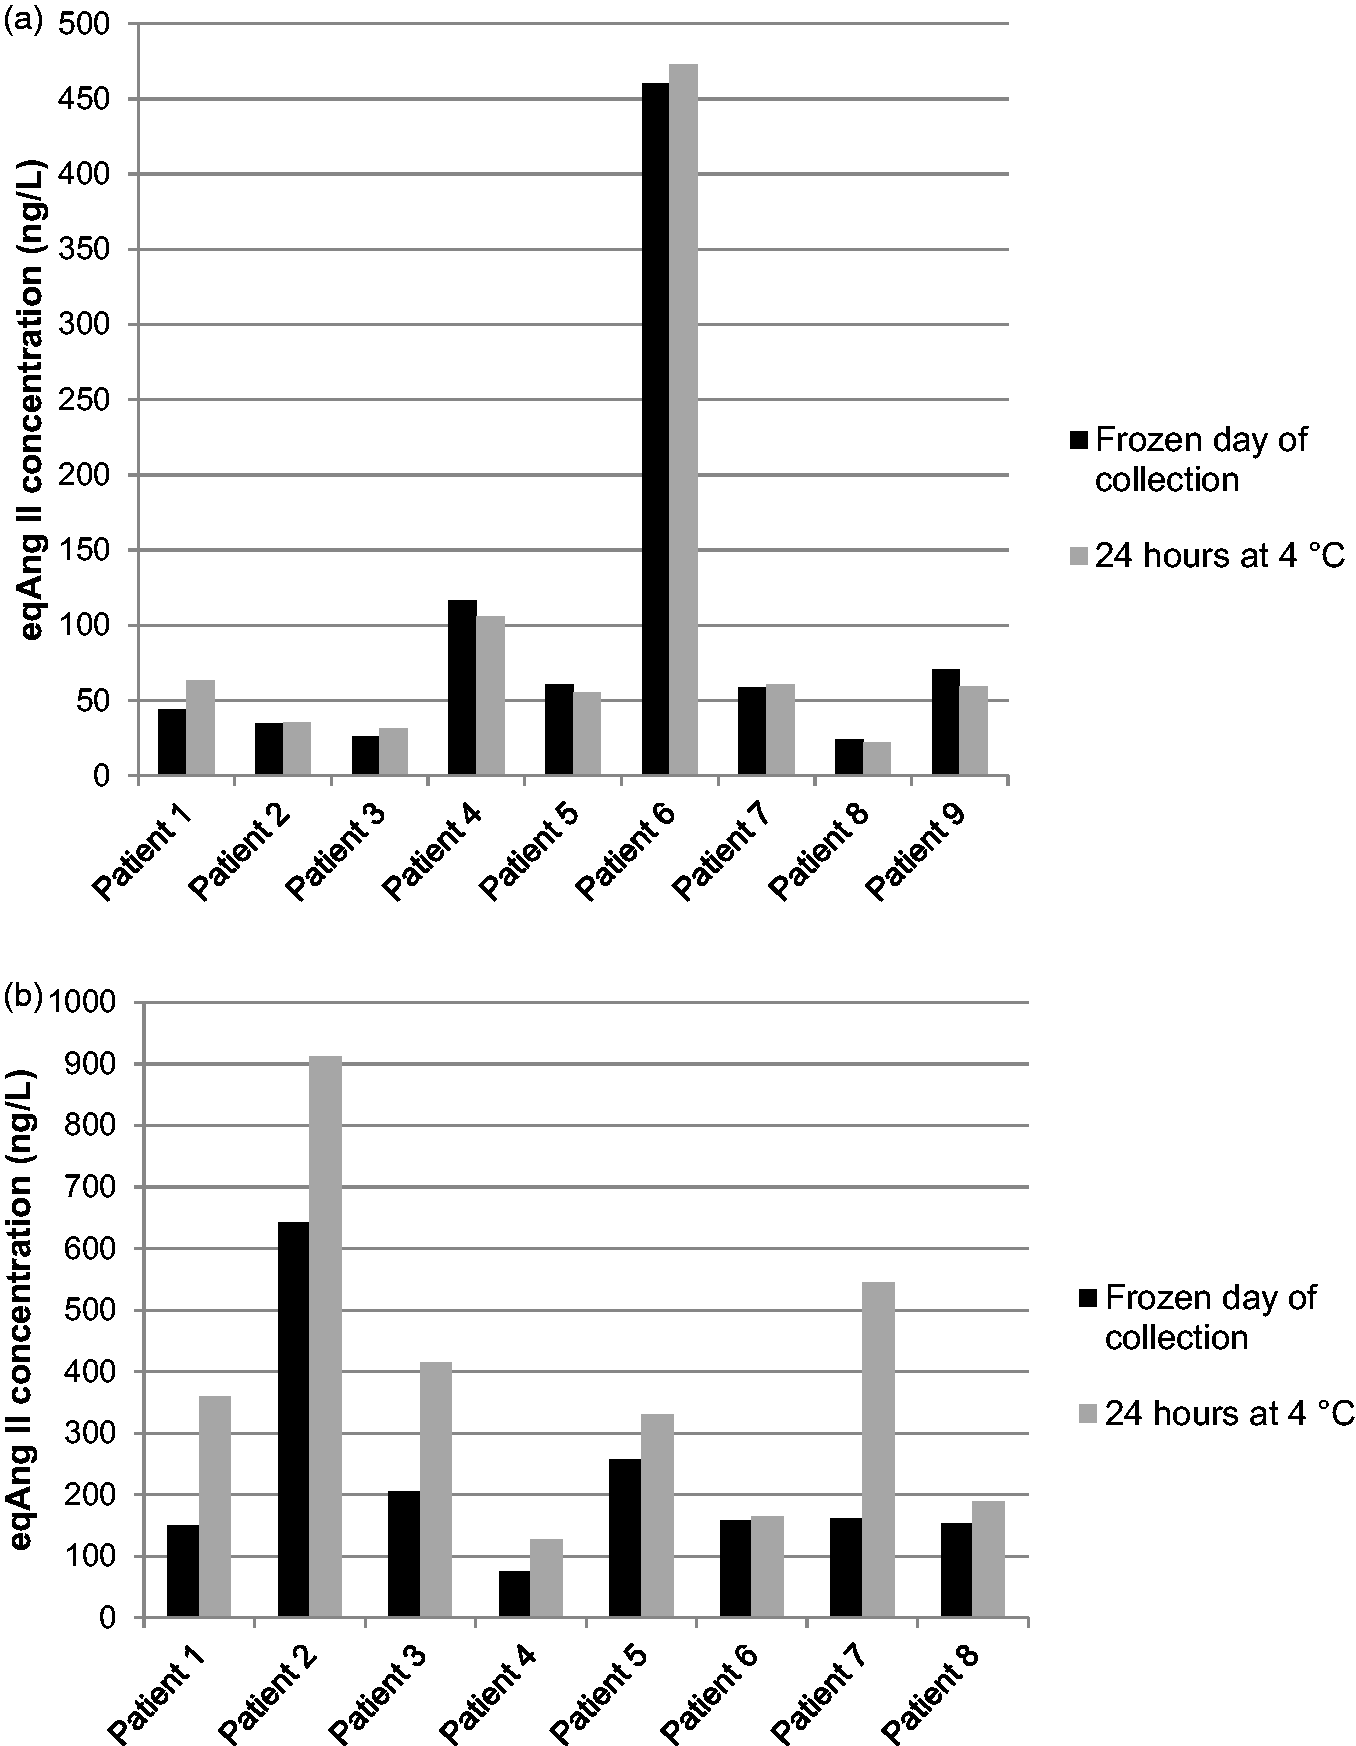
Effect of storage of serum at 4°C on measured eqAng II. Paired aliquots were either frozen on the day of collection or stored for 24 h prior to freezing and subsequent eqAng II analysis. (a) Serum from male and female patients (non-pregnant). (b) Serum from pregnant females.
Freeze-thaw cycles can also affect results for some analytes; therefore, the impact of one additional freeze-thaw on eqAng II results was tested using 17 patient serum samples. The difference seen was not statistically significant (Wilcoxon signed-rank test, P = 0.3778), with a mean change in eqAng II concentration of +1.3%.
Comparison of eqAng II concentration with plasma renin activity and of respective ratios with aldosterone
To enable assessment of the clinical utility of the assay, eqAng II concentration was compared with plasma renin activity. Initially 150 anonymized, paired serum and EDTA plasma samples were assayed for eqAng II using the serum, along with renin activity and aldosterone using the EDTA plasma.
Some samples were excluded from the comparison data due to renin or eqAng II results outside of the reportable range of the assays, and this left 134 patient results. The mean eqAng II concentration was 81.8 ng/L, and the median was 59.1 ng/L. The data were not normally distributed (Shapiro–Wilk test, P < 0.0001). The correlation between renin and eqAng II (Figure 4(a)) was assessed using Spearman’s rank correlation coefficient which revealed an Rs value of 0.739 (95% confidence interval [CI] 0.648 to 0.809) and a highly statistically significant positive correlation (P < 0.0001). From assessment of the data points and the trend in Figure 4(a), renin values > 5 nmol/L/h were considered to be potentially skewing the data. When these 13 data points were excluded (Figure 4(b)), the Rs value increased to 0.809 (95% CI 0.734 to 0.864) and P remained the same. Indeed, eqAng II showed a negative correlation with renin values > 5 nmol/L/h (Rs = −0.341, data not shown), although this was not statistically significant.
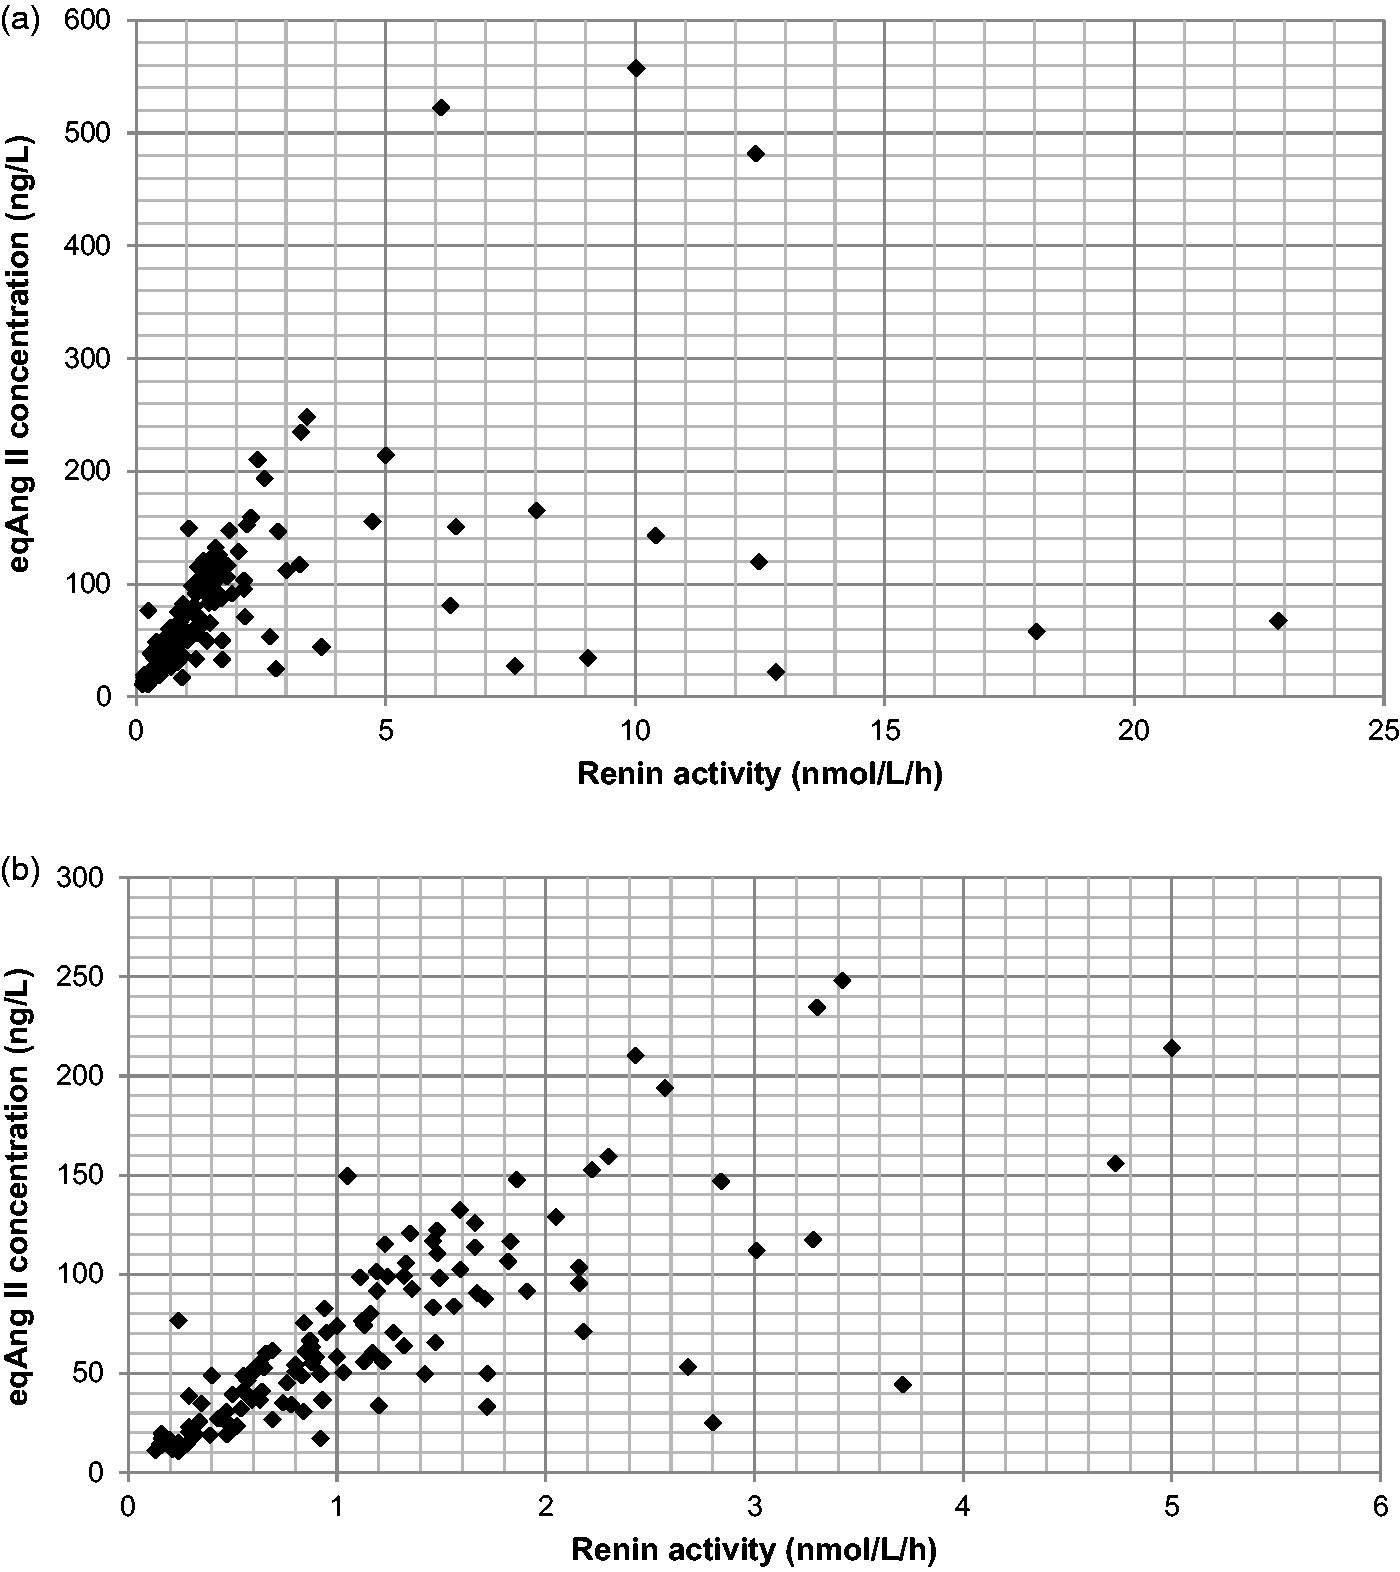
Comparison of serum eqAng II concentration with plasma renin activity in anonymized, paired patients’ samples. (a) All patient results within reportable range of the assays. (b) Samples with renin activity > 5 nmol/L/h excluded.
In current practice, the key parameter when reporting plasma renin activity (or renin mass) is the ratio with aldosterone, particularly for patients who are being investigated for possible PHA. Therefore, the ARRs for the patients’ samples were compared to the ratios between aldosterone and eqAng II (AA2R). When the ratios were compared for the 134 samples with quantifiable results (Figure 5), the positive correlation was highly significant (Spearman’s Rs = 0.811 [95% CI 0.741 to 0.863], P <0.0001).
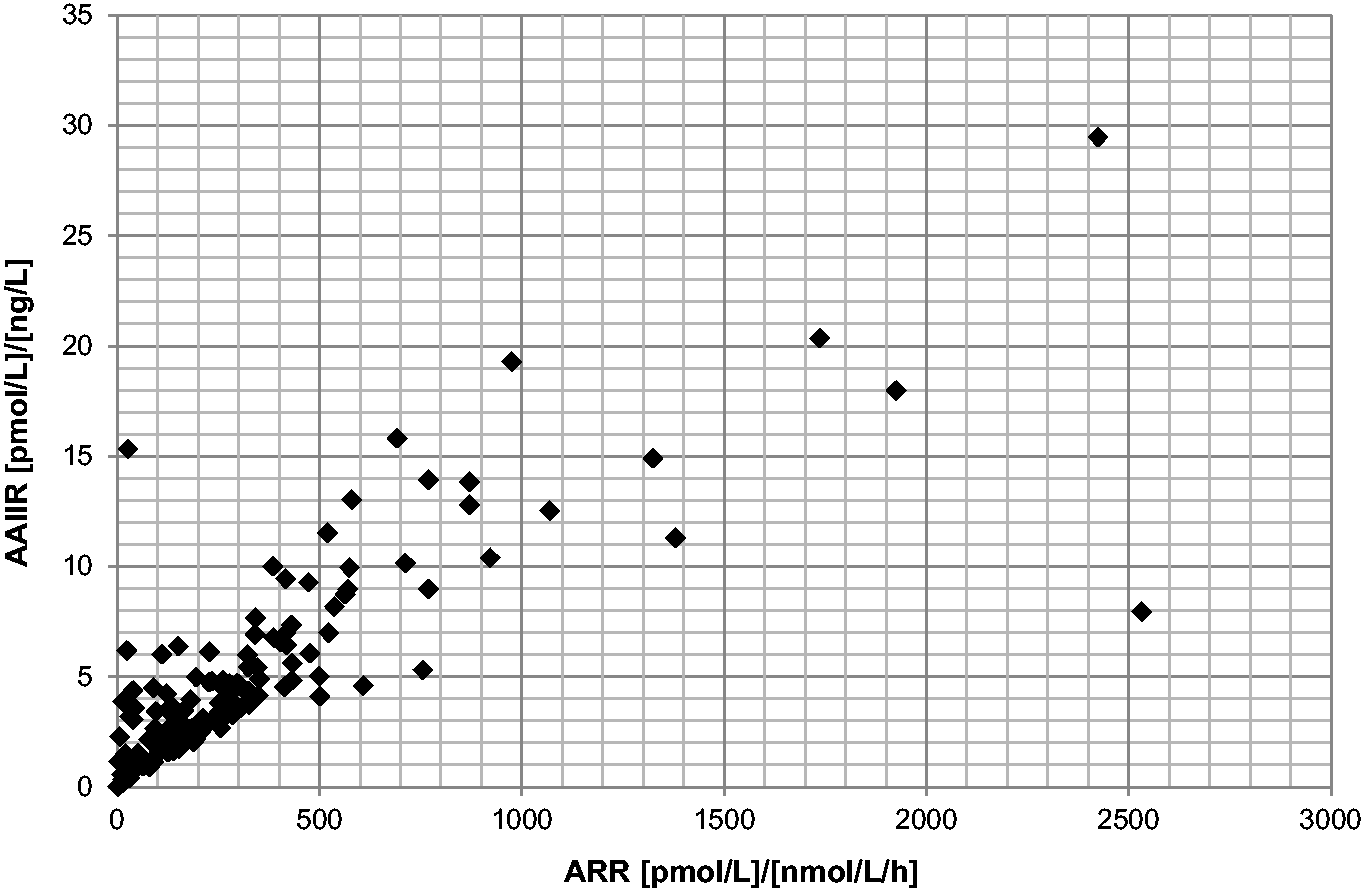
Comparison of AA2R with ARR for paired patients’ samples (n = 134). EqAng II was measured in serum samples, while EDTA plasma was used for renin and aldosterone analysis (LC-MS/MS).
It was possible to calculate ARR for 149 of 150 patients’ samples analysed in this study, whereas using AA2R meant 15 patients could not have an exact ratio calculated, due to eqAng II results of <10 ng/L. In those cases, a minimum AA2R can be determined by dividing the aldosterone concentration by 10. The mean calculable AA2R was found to be 5.2 [pmol/L]/[ng/L], and the median was 3.8. Based on ARR reference ranges, six patients had ARR results which were suggestive of PHA (ratio >2000 [pmol/L]/[nmol/L/h]. In those cases five of the six had an AA2R above 20 [pmol/L]/[ng/L]. Of 10 patients with an equivocal ARR (PHA not excluded), 9 had an AA2R higher than 10.
Discussion
In this study, an LC-MS/MS assay for eqAng II in human serum was developed and validated; in combination with aldosterone analysis, this could provide an alternative screening test to the current gold standard of ARR.
Clinical research groups in collaboration with a commercial company have developed a similar assay for eqAng II using a 60-min incubation period.9–11 The mean increase in eqAng II following incubation reported in our study is just over 2 fold; this is in contrast to data presented by Attoquant 18 where a 5–20 fold increase was demonstrated. However, the baseline Ang II in Attoquant’s study was measured in samples which were immediately stabilized with protease inhibitors following collection, whereas samples in this study had been separated and frozen prior to the addition of EDTA. Additionally, because the samples used were surplus clinical samples, time from collection to freezing was variable. These factors mean direct comparison is difficult.
The published eqAng II assay utilizes a cocktail of protease inhibitors to stabilize samples following incubation.9–11,19 In our study, only EDTA at 4°C was found to be necessary. Evidence of the requirement for additional protease inhibitors in eqAng II assays has not been published by other groups and it is possible that empirical testing has not previously been performed. Attoquant has analysed the activity of two plasma enzymes known to degrade Ang II; ACE2 and prolylcarboxypeptidase (PCP). Using spiked Ang II as a substrate, ACE2 was found to have over six times higher activity than PCP. 19 As a metalloprotease, ACE2 would be strongly inhibited by EDTA, whereas PCP (a serine protease) would not be affected. The predominance of ACE2 activity may explain why the lack of inhibition of PCP post-incubation does not significantly affect eqAng II concentrations in the time frame studied here.
The optimized extraction procedure for Ang II described here is relatively fast and simple. Solid-phase extraction was also used by Guo et al.; 11 however, a C18-based matrix was used, and full methodological details were not given. A full validation for an eqAng II assay has not previously been published. For our assay, the between-batch CVs for spiked QC material and patient material were all <10%. Bias was excellent; within and between-batch results were <2% using spiked QC material. The LLOQ tested was 10 ng/L using a spiked sample, with a CV and bias of 7.0% and −6.9%, respectively. As these values are below the conventional cut-off of 20% for a LLOQ, there is potentially room to report results lower than 10 ng/L; however, this would require further testing. In support of this, Guo et al. 11 report an LLOQ of 2.1 ng/L.
Recovery was found to be on average >80% for all three concentrations tested. Recovery in serum was lower than that in PBS/BSA, and this may reflect degradation of spiked Ang II peptide following addition to serum. As serum eqAng II is by definition an equilibrium concentration, recovery of spiked peptide may be not be very applicable to this assay.
Sample handling requirements were also investigated. The eqAng II concentration was not significantly affected when clotted whole blood in serum tubes was stored at room temperature for up to 72 h, which would mean patients could have blood collected at locations remote from the laboratory. It is well established that prorenin can undergo cryoactivation to the active form of the enzyme when stored at 4°C, due to a conformational change that exposes the active site. 7 In our study, cryoactivation was only observed in serum from pregnant patients (likely due to increased concentrations of prorenin 20 ) consistent with previously reported findings for renin assays. 21 Increased renin activity would then be expected to have downstream effects on the eqAng II concentration.
The mean eqAng II concentration in unselected patients’ samples was 81.8 ng/L, which is similar to the value of 92.9 ng/L reported by Attoquant in a smaller sample of healthy individuals. 19 Guo et al. 11 found a mean value of 64.5 ng/L in 22 hypertensive non-PHA patients (upright posture), while Burrello et al. reported a mean of 105.6 ng/L in 77 patients with essential hypertension. 10 Our data are for a larger number of samples but are limited because the patients are necessarily uncharacterized due to samples being anonymized. If this assay was adopted for clinical use, a reference range would need to be established from a larger population study.
When eqAng II concentrations were compared to renin activity for paired samples, a highly statistically significant correlation was found. Significant correlations between these parameters have also been reported by other groups.10,11 When renin results above 5 nmol/L/h were excluded from our data set, the correlation improved. High renin results such as these would not be expected in PHA patients and may occur in Addison’s disease, secondary hyperaldosteronism or in patients taking anti-hypertensive medications such as ACE inhibitors. Burrello et al. 10 also noted a number of patients’ samples in their study which were outliers in terms of the correlation between PRA and eqAng II, which they attributed to ACE inhibitor therapy in these patients.
When the correlation between ARR and AA2R was assessed, the result was highly statistically significant, with a better degree of correlation than that seen for eqAng II and renin alone, similar to the findings of other groups.10,11 Burrello et al. assessed the ability of AA2R to distinguish PHA from non-PHA in hypertensive patients. The receiver operator characteristic curve for AA2R showed an area under the curve of 0.937 which was similar to that for ARR in their study. 10 Overall, the consensus is that eqAng II correlates well with PRA and similarly for AA2R and ARR, indicating that these parameters show promise as a screening test for PHA.
There would be several advantages to moving to eqAng II/AA2R as a screening test in our laboratory. Serum samples can be used rather than EDTA plasma which can mean a reduction in the number of sample types collected from the patient. The eqAng II assay is simpler to perform and has a shorter incubation time than the PRA assay. In addition, the upper limit of the assay is likely to be sufficient for the vast majority of patients, in contrast to PRA where results higher than the top standard are frequently encountered. Finally, published data10,11,14 indicate reduced interference by ACE inhibitors, a common medication in hypertensive patients. Further clinical validation in patients with and without PHA would be required prior to introduction of the eqAng II assay into routine use.
Supplemental Material
sj-pdf-1-acb-10.1177_00045632211008923 - Supplemental material for An LC-MS/MS assay for analysis of equilibrium angiotensin II in human serum
Supplemental material, sj-pdf-1-acb-10.1177_00045632211008923 for An LC-MS/MS assay for analysis of equilibrium angiotensin II in human serum by Laura Bernstone, Joanne E Adaway and Brian G Keevil in Annals of Clinical Biochemistry
Supplemental Material
sj-pptx-2-acb-10.1177_00045632211008923 - Supplemental material for An LC-MS/MS assay for analysis of equilibrium angiotensin II in human serum
Supplemental material, sj-pptx-2-acb-10.1177_00045632211008923 for An LC-MS/MS assay for analysis of equilibrium angiotensin II in human serum by Laura Bernstone, Joanne E Adaway and Brian G Keevil in Annals of Clinical Biochemistry
Footnotes
Acknowledgements
None.
Declaration of conflicting interests
The author(s) declared no potential conflicts of interest with respect to the research, authorship, and/or publication of this article.
Funding
The author(s) received no financial support for the research, authorship, and/or publication of this article.
Ethical approval
None required.
Guarantor
LB.
Contributorship
BGK conceived the study. LB and JEA carried out analytical work, and LB wrote the first draft of the paper. All authors reviewed and edited the manuscript and approved the final version.
Supplemental material
Supplemental material for this article is available online.
References
Supplementary Material
Please find the following supplemental material available below.
For Open Access articles published under a Creative Commons License, all supplemental material carries the same license as the article it is associated with.
For non-Open Access articles published, all supplemental material carries a non-exclusive license, and permission requests for re-use of supplemental material or any part of supplemental material shall be sent directly to the copyright owner as specified in the copyright notice associated with the article.