
Abstract
Background
1,25-Dihydroxy vitamin D3 (DHVD) is the active metabolite of vitamin D, required to maintain blood calcium concentrations. Measurement has proved challenging as it circulates in picomolar concentrations and must be differentiated from other dihydroxyvitamin D species. Clinically, it is essential to be able to determine the cause of hypercalcaemia, which may be due to DHVD excess.
Methods
The liquid chromatography-mass spectrometry (LCMS) assay which has been developed uses immunoextraction of 0.5 mL serum followed by Amplifex™ derivatization of the dried eluent, with the analysis using the SCIEX 6500+ instrument taking a run time of 11 min.
Results
The limit of quantitation was determined (15 pmol/L) and the method is linear up to at least 600 pmol/L. Repeatability ranged from 6.1% at 23 pmol/L to 2.5% at 172 pmol/L and intermediate imprecision was 15.6% at 26 pmol/L to 8.3% at 173 pmol/L. The method is unaffected by icterus, haemolysis or lipaemia. Good performance was achieved with the samples from the vitamin D external quality assessment scheme, demonstrating a negative bias compared with the all lab trimmed mean (average –13.8%) and the specific method group (average –7.75%). A negative bias was observed across the concentration range found in 78 patient samples in comparison to a commercial radioimmunoassay (mean –47.8%). This was not unexpected and is likely due to better specificity of the mass spectrometry assay and the lack of a commutable standard reference calibrator.
Conclusions
We have developed a sensitive and robust LCMS method for the analysis of DHVD in serum, utilizing immunoextraction and derivatization to provide specificity.
Introduction
Vitamin D is either produced in the skin (under the influence of UV light) or taken up in the diet. The main circulating and storage form of vitamin D, 25-hydroxy vitamin D (25OHD), is formed in the liver. The hormone 1,25-dihydroxy vitamin D (DHVD) is formed in a second hydroxylation step in the kidney. The enzyme responsible, 1α-hydroxylase, is subjected to rigid control primarily through parathyroid hormone (PTH), and PTH activity is influenced by the serum concentrations of calcium and phosphate. 1
The serum concentration of DHVD, although it is the active form of the steroid, is therefore normally rapidly re-adjusted through feedback loops (circulating half-life is approximately 4 h), and deviations from the reference range must always be interpreted in the context of the bone profile and PTH results. The serum concentration of DHVD only decreases in the face of chronic and profound 25OHD deficiency. 2 Concentrations are more sensitive to homeostatic control than dietary influences. 3
Deficiency of DHVD occurs as a result of either genetic defects of 1α-hydroxylase (rare) 4 or kidney disease (more common). 5 Treatment of metabolic bone disease consists of the administration of DHVD (calcitriol) and its analogues or the prohormone, 1α-hydroxy vitamin D (alpha calcidol). 6
Overproduction of DHVD arises in granulomatosis disease (e.g. sarcoidosis), where extrarenal synthesis of DHVD by macrophages occurs. This can lead to hypercalcaemia.7,8 Increased concentrations of DHVD can be seen in the case of non-functional vitamin D receptors (very rare), 4 as well as a result of overproduction of PTH (primary hyperthyroidism). 9
DHVD circulates in picomolar concentrations and has proved difficult to separate and measure, with many immunoassay methods remaining subject to high cross-reactivity with other vitamin D metabolites. 10 Liquid chromatography-mass spectrometry (LCMS) methods have been developed but often have poor sensitivity due to the poor ionization efficiency of this hydrophobic molecule. 11 Derivatization methods have been assessed but frequently have lengthy sample preparation procedures requiring large sample volumes, long run times or complicated high-pressure liquid chromatography (HPLC) configurations.12–14 Other practical issues remain when clinical laboratories attempt to introduce LCMS methods which have been developed for DHVD such as lost instrument time when extensive flushing of the system is required on switching methods to clear lithium from the tubing.11,14
The LCMS assay described in this paper uses immunoextraction of 0.5 mL serum followed by Amplifex™ derivatization of the dried eluent, with the analysis carried out using the SCIEX 6500+ instrument (SCIEX, Warrington, UK) taking a run time of 11 min.
Materials and methods
Calibration standards and quality control material
A primary stock solution of DHVD was prepared by diluting a certified reference material of DHVD in ethanol (H-089, Cerilliant, Texas, USA; BP2818-100 ethanol from Fisher Scientific, Loughborough, UK). A series of dilutions was then prepared in phosphate buffered saline (PBS; BP1282-1680 Fisher Scientific) containing 10% w/v bovine serum albumin (BSA, BP9702-100, Fisher Scientific) to give final concentrations of 0, 15, 30, 75, 150, 300 and 600 pmol/L, stored in aliquots at –80°C until use. Use of six calibrators to generate standard curves is in line with recommended practice. 15
Three levels of commercial quality control material (IAS3113, IAS3114, IAS3115, Randox, Crumlin, UK) were used to provide an independent material from any prepared in house.
Internal standard
Deuterated (d3) DHVD (5154, Isosciences, Pennsylvania, USA) was diluted in ethanol to be used as a stock solution to prepare working internal standard for the assay with a further 1 in 1000 dilution in laboratory grade water (2.38 nmol/L).
Sample extraction and derivatization
To 500 μL patient serum, standards or QC, 100 μL internal standard was added in an immunoextraction tube (kit KM1100, Immunodiagnostik, Bensheim, Germany). The tubes were inverted three times to ensure mixing, before being further mixed end-over-end for 1 h at room temperature. After this incubation, the immunotubes are washed three times (wash solution provided in the kit) and then eluted into glass tubes (elution reagent provided in the kit) for drying down under nitrogen. Fifty microlitres of Amplifex™ reagent (Kit 5037804, SCIEX, Massachusetts, USA) were added and the tubes were incubated for 30 min at room temperature before 100 μL of laboratory grade water was added, and the solution transferred to vials suitable for the LCMS autosampler.
Chromatography
Chromatography was performed on a SCIEX ExionLC™ system (SCIEX, Warrington, UK). Sample (35 μL) was injected onto a SecurityGuard ULTRA C18 column (AJO 8782, Phenomenex, Macclesfield, UK) coupled to a Kinetex C18 1.7 μm, 100 Å column (00D-4475-AN, also Phenomenex). Mobile phase A contained 0.1% v/v formic acid in water and mobile phase B, 0.1% v/v formic acid in acetonitrile. Initial conditions were 95:5 (v/v) mobile phase A:B with elution being performed by means of a gradient increasing to 35% B over the first 30 s, 55% over the next 6.5 min and 99% for 2 min. Following this, the column was re-equilibrated back to initial conditions and held for 2 min prior to the next sample injection. The mobile phase flow rate was held constant at 0.35 mL/min and the column temperature was maintained at 45°C.
Mass spectrometry
Eluate from the analytical column was injected directly into a SCIEX 6500+ tandem mass spectrometer (SCIEX, Warrington, UK) operating in ESI + mode. Electrospray voltage was 4500 V; curtain gas flow and source temperature were maintained at 20 psi and 475°C, respectively. Ion source gas flow 1 and 2 were set at 25 and 70 psi, respectively, and the declustering and entrance potentials were 90 and 10 V, respectively.
DHVD, DHVD-d3 and DHVD qualifier ions were detected in multiple reaction monitoring mode (MRM) with a dwell time of 125 ms per channel between 3.8 and 5.5 min. The MRM transition for the quantifier ion was 748.4 to 689.34 at collision energy (CE) of 50 V and collision cell potential (CXP) 30 V. The transition for the qualifier ion was 748.4 to 217.06, CE 71 V and CXP 22 V and for the internal standard 751.34 to 692.32, CE 47.5 V and CXP 25 V. Analyst software version 1.6.3 was used to operate the mass spectrometer and process the data. Linear least squares regression and 1/x weighting were used to generate standard curves; peak area was used for all peak integrations.
Validation
The LCMS method was validated for precision, accuracy, recovery, linearity, sensitivity, specificity and sample stability according to published acceptance criteria.15–17
Imprecision
Assay imprecision was assessed using quality control material. Samples were analysed repeatedly (n = 10) within a single analytical run to determine repeatability (within-batch imprecision) and across 19 analytical runs over the validation period, with two lot numbers of material, to determine intermediate imprecision (between-batch imprecision). Imprecision was assessed as a function of the variation (%CV).
According to the validation guidelines, imprecision is deemed acceptable if %CV values do not exceed 15% or 20% at the lower limit of quantification (LOQ). 15
Accuracy and recovery
To assess recovery, stock calibration solutions were used to spike five patient serum samples. These samples had endogenous DHVD concentrations between 80 and 107 pmol/L and were spiked to have an expected (additional) range of concentrations, 25 to 100 pmol/L. % Recovery was calculated from the measured compared to the expected concentration. Recovery was deemed acceptable, if it was >90%. These experiments were repeated using the IQC material, which is also a human serum matrix.
External quality assurance (EQA) samples (n = 60) from the DEQAS scheme were stored at –80°C for analysis and compared with the all lab trimmed means (ALTM) and the mass spectrometry-specific targets (MSTM). Accuracy was assessed as a function of % deviation from these target values. The scheme organizer’s limits for acceptable performance were adopted (DEQAS: within 30% of the target value).
Linearity
Linearity of the assay was assessed by analysis of 14 different calibration curves analysed in separate batches. Concentration ranged from 0 to 600 pmol/L. Linearity of the assay was confirmed by weighted linear regression, if the correlation coefficient r2 value was ≥0.998. The 95% confidence intervals (CI) for each calibration point were also calculated.
Furthermore, a patient serum pool was spiked with DHVD, assayed neat and then over a range of dilutions using both 10% w/v BSA in PBS and laboratory grade water as the diluent. Measured DHVD concentrations were compared with expected concentrations.
Limit of quantitation
The limit of quantitation (LOQ) was determined using aliquots of 10% w/v BSA in PBS spiked with decreasing concentrations of DHVD (n = 4), as sufficient quantities of patient serum at low concentrations were unavailable at the time of validation. Concentrations in each sample were measured 10 times in a single analytical batch and the %CV and deviation from the theoretical target value were determined. The LOQ was assigned to the lowest concentration with both a %CV and mean value from the theoretical target of <20% which is within the published guidelines. 15
Specificity
Potential interference from haemolysis, icterus and lipaemia are traditionally assessed in the biochemical assays. Pools of patient serum sample were prepared with increasing concentrations of haemoglobin, bilirubin and triglycerides. The concentration of DHVD in each pool was determined before and after spiking with 145 pmol/L DHVD in the same analytical run, and recovery was calculated from the measured compared with the expected concentration. Recovery was deemed acceptable if it was >90%.
24,25-Dihydroxy vitamin D3 is a metabolite of DHVD; this was spiked into 10% w/v BSA in PBS and put through the extraction and analysis process to determine whether a significant signal would be seen which may potentially add to the apparent concentration of DHVD determined.
A potential replacement therapy, 1α calcidol, was spiked into 10% w/v BSA/PBS and put through the extraction and analysis process to determine whether a significant signal would be seen which may potentially add to the apparent concentration of DHVD determined.
Stability
It was necessary to confirm that the results are commutable between serum, lithium heparin plasma and EDTA plasma. Pools of patient samples were prepared where each individual had one of each sample type concurrently sent to the lab for analysis (Sarstedt tubes). The samples were stored as aliquots at –80°C before use. Our laboratory requires serum to be transported frozen before analysis. The effect of repeat freeze–thaw cycles was also determined to check a sample which defrosted in transit would still be suitable for analysis. Aliquots were removed from the freezer, defrosted and all returned to the freezer except one. In this way, each aliquot was analysed in a separate analytical run after an increasing number of freeze–thaw cycles. A change from baseline ≤10% was deemed acceptable. 16
Effect of patient matrix
Current consensus regarding matrix effects in mass spectrometry methods which employ a stable isotope internal standard is that any ion suppression or enhancement should be negated. The signal from the internal standard and analyte will be affected to the same degree. We analysed the variation in internal standard peak area across nine analytical runs when analysing between 5 and 31 patient samples in one run to ascertain this. A %CV ≤15% was deemed acceptable.
Method comparison
A total of 78 patient samples were available to compare with the results from a commercial radioimmunoassay (RIA, Immunodiagnostic Systems Ltd, Boldon, UK). 18 The assay is in routine clinical use at a neighbouring NHS Trust, demonstrating acceptable performance to peers according to DEQAS data. Concentrations determined by each method were compared by Regression and Bland-Altman analysis using the statistical tools available in Microsoft Excel™.
Results
Both DHVD and d3-DHVD had retention times of 4.74 min with the peak clearly defined in comparison with the zero calibrator (Figure 1). Total chromatographic run time was 11 min and total injection-to-injection cycle time was 11.5 min.
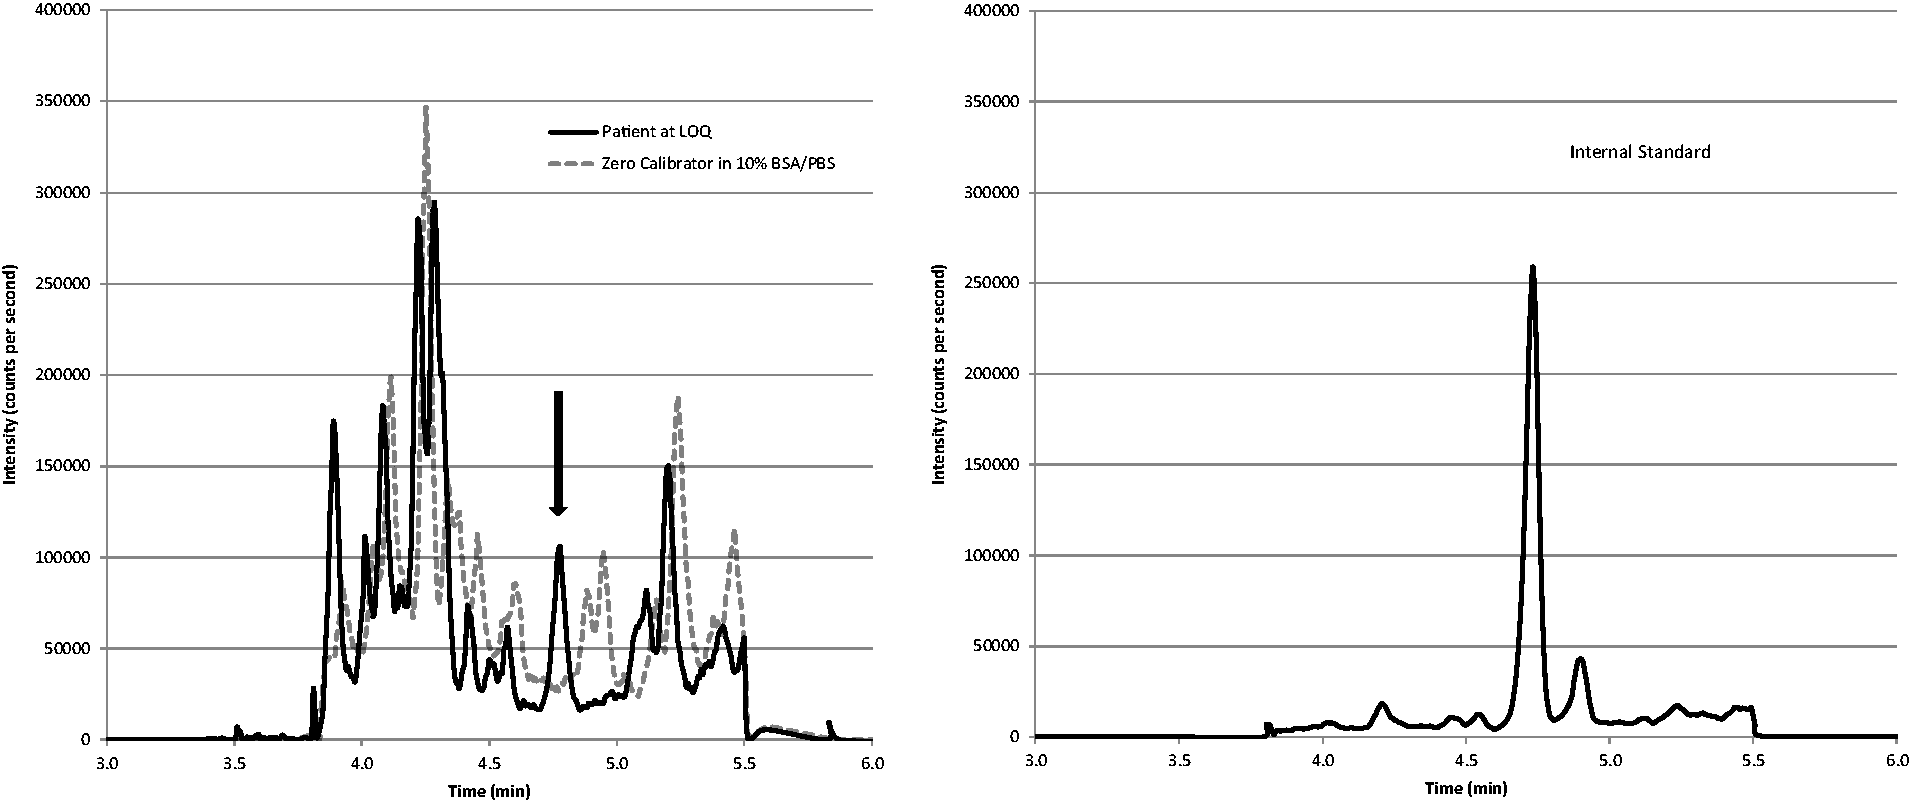
DHVD for a patient, determined as 12 pmol/L (left pane quantifier, right pane internal standard).
Repeatability (within batch imprecision) was determined from one lot of QC and one operator and intermediate imprecision (between batch) from two operators and two lots of QC using different batches of mobile phases. Only the instrument and the analytical column remain unchanged. The %CV for the quantifier peak ranged from 2.5 to 15.6% at three mean concentrations approximately 25, 106 and 175 pmol/L (Table 1).
Summary of imprecision data.
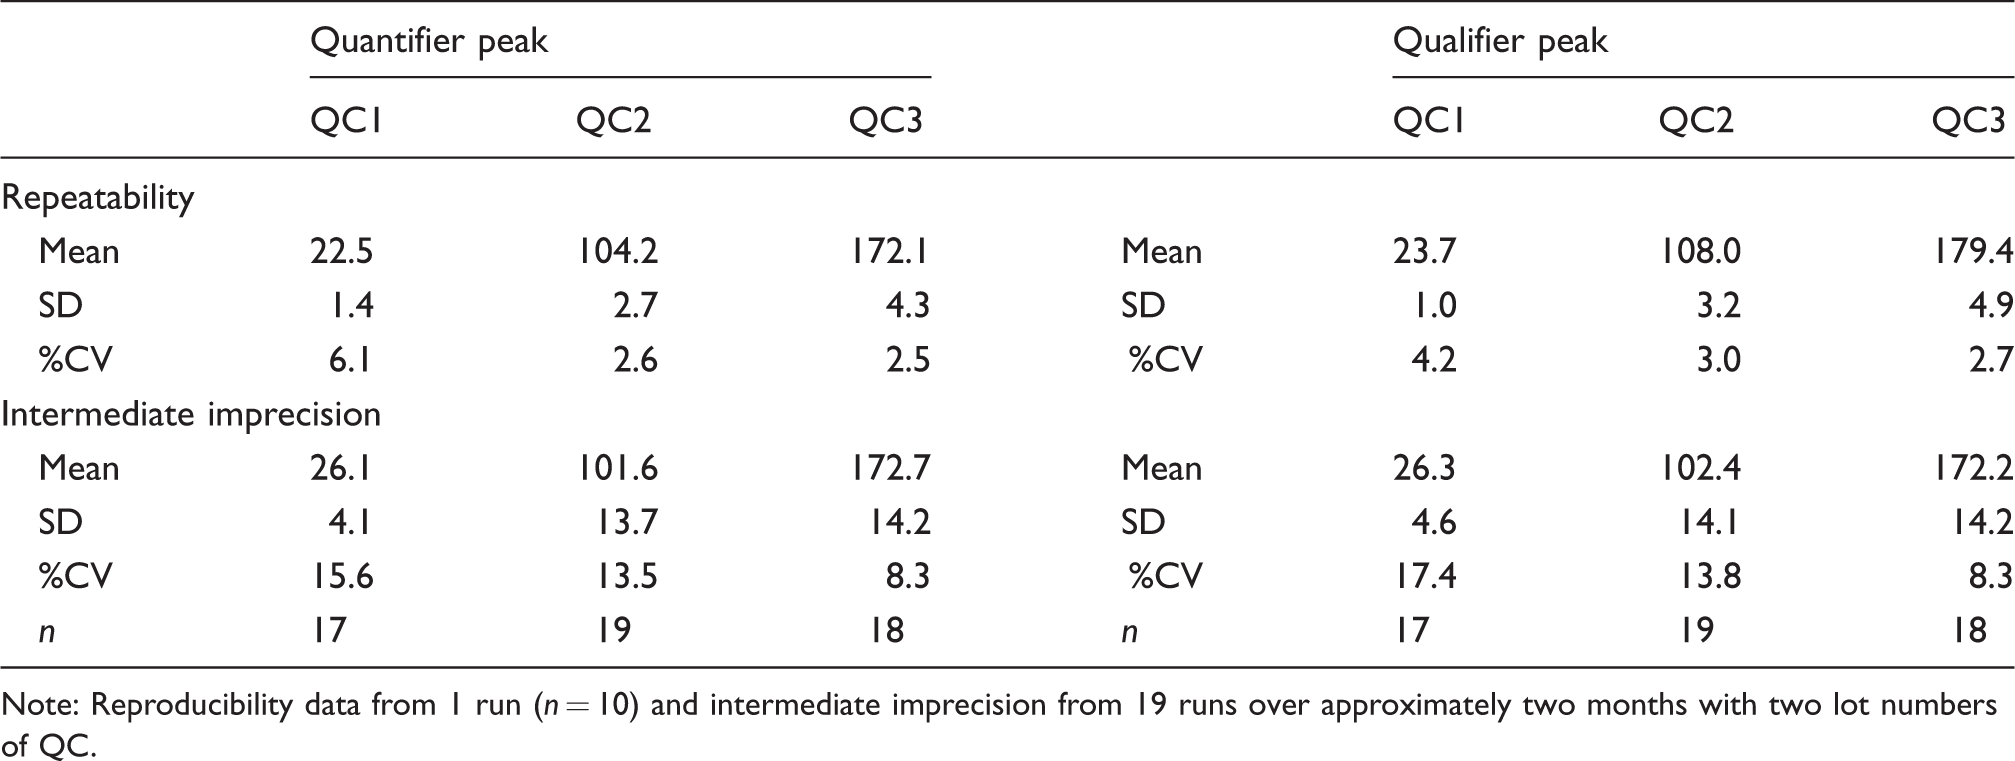
Note: Reproducibility data from 1 run (n = 10) and intermediate imprecision from 19 runs over approximately two months with two lot numbers of QC.
The spiked recovery experiments demonstrated that DHVD was adequately recovered with a mean of 111.2% across the three concentrations tested after extraction, derivatization and analysis. Just one of the five patient serum samples apparently over-recovered at all three concentrations (25 pmol/L spike mean = 108.8%, range 92 to 140% 100 pmol/L spike mean = 113.8, range 104 to 133%, 250 pmol/L spike mean = 111.0%, range 98 to 131%). These experiments were repeated using level 1 of the commercial human serum-based QC material (26 pmol/L) with the mean recovery of 96.3% (range 83.2 to 110.4%).
Accuracy was assessed using nine distributions of EQA material analysed (previously distributed between October 2015 and October 2017 and stored at –80°C). From 45 results, only three had ≥15% difference between the quantifier and the qualifier peak areas which would trigger repeat analysis under our criteria for the clinical service. The mean difference from the ALTM was –13.8% and –7.75% from the MSTM (Figure 2). Only three samples demonstrated a difference from the ALTM or MSTM >30% and would have been identified as poor performance in the scheme.
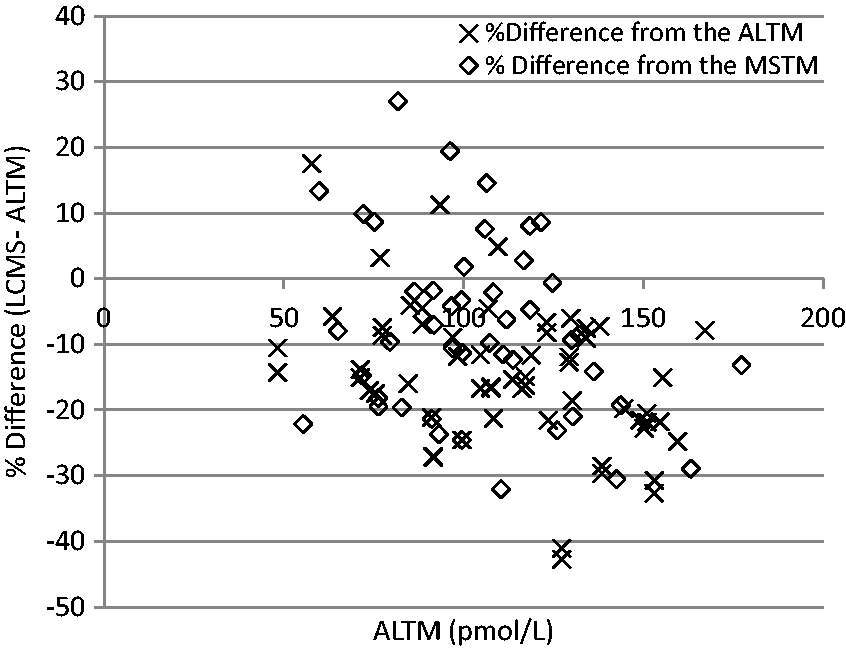
Comparison of the results for the EQA distributions with the ALTM and MSTM.
Data averaged from 14 individual calibration curves demonstrated that the assay was linear up to at least 600 pmol/L (r2 > 0.998). The 95% CI for these data were 1.35 pmol/L at a mean of 13.8 pmol/L, 1.43 pmol/L at a mean of 29.2 pmol/L and 75.5 pmol/L, 2.16 pmol/L at a mean of 152.4 pmol/L, 3.43 pmol/L at a mean of 309.1 pmol/L and 5.21 at a mean of 589.9 pmol/L. Differences in concentration as little as 6 pmol/L can be reliably quantified. Serial dilutions of patient serum samples (neat concentration 120 pmol/L and 750 pmol/L) or DHVD in 10% w/v BSA in PBS (10 to 25 pmol/L) also demonstrated good linearity whether laboratory grade water or 10% w/v BSA in PBS was used as the diluent (r2 > 0.991).
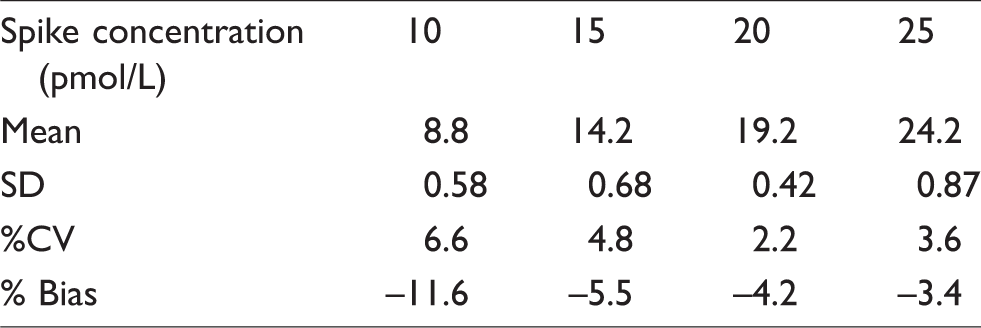
LOQ was determined as 15 pmol/L based on a %CV of <20% and bias <20% from the assigned concentration when a series of aliquots of 10% w/v BSA in PBS spiked with decreasing concentrations of DHVD was analysed (Table 2). This was also confirmed by plotting a precision profile using the %CV from the calibration curves.
Spiked 10% w/v BSA in PBS samples (n = 10) used to calculate LOQ.
There was no significant interference from haemolysis (index 59 to 104 as measured on Roche 8000 instruments), icterus (total bilirubin 56 to 415 μmol/L) or lipaemia (triglycerides 4.2 to 25.2 mmol/L) as recovery was always >90% (haemolysis 94 to 112%, icterus 92 to 104% and lipaemia 91 to 113%).
When 24,25-dihydroxy vitamin or 1α calcidol was spiked into a serum pool, no significant interference was observed at three increasing concentrations of each compound (variation in DHVD concentration –8.5 to 8.1% at 111 pmol/L).
Lower apparent concentrations of DHVD were measured in serum compared with plasma with lithium heparin anticoagulant or potassium EDTA (mean [SD] of four replicates DHVD concentration 109.8 [1.3] pmol/L, 126.5 [3.7] pmol/L and 122 (1.8) pmol/L, respectively). Up to three freeze–thaw cycles had an acceptable effect on the concentration of DHVD (maximum change in concentration 9.4% from initial value).
We analysed the variation in internal standard peak area across nine analytical runs when analysing between 5 and 31 patient samples in one run as a measure of the effect of different patient matrices. The maximum variation in the internal standard peak area was 15.1%, deemed acceptable (%CV range 8.4 to 15.1%).
A total of 78 patient samples were available to compare with the results from a commercial RIA (Immunodiagnostic Systems Ltd, Boldon, UK, Figure 3(a)). The LCMS method demonstrated a negative bias compared with the RIA (mean –53.3 pmol/L, –47.8% Figure 3(b)).
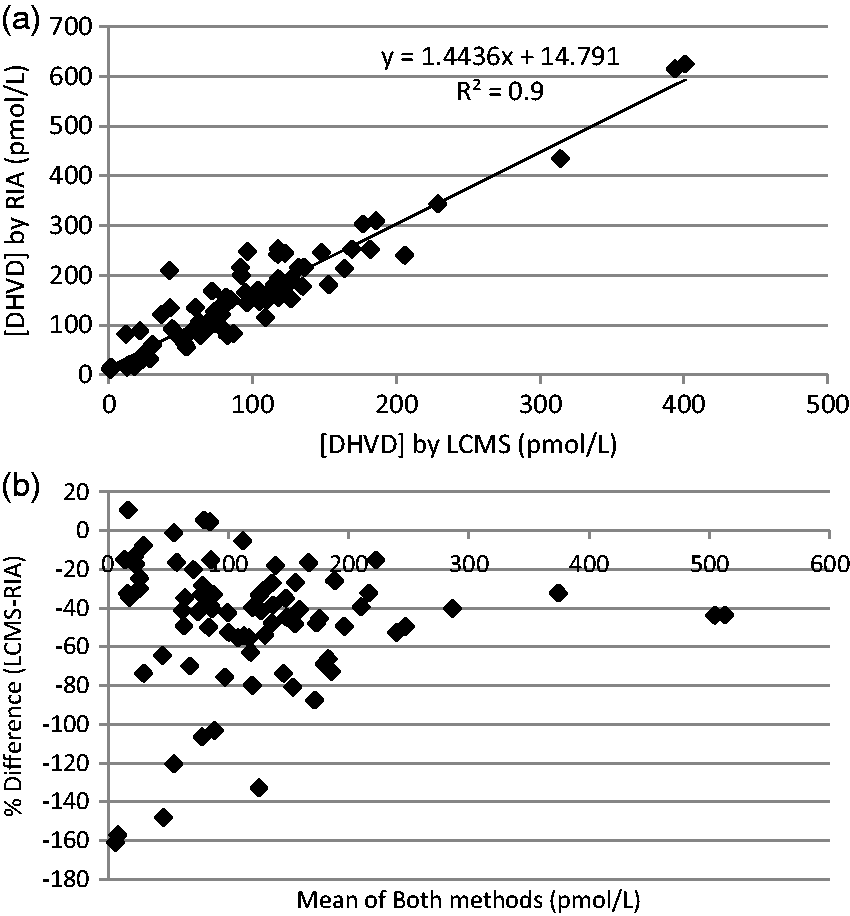
Comparison of DHVD concentrations determined by LCMS or an RIA in routine clinical use (n = 78).
Discussion
Clinically, the need for a DHVD assay exists despite the short half-life of the molecule in circulation, as the result could determine whether replacement therapy is required in those patients with vitamin D-dependent rickets or chronic kidney disease as well as helping to elucidate the cause of hypercalcaemia and hypophosphataemia.6,7,19
Previously published methods have not proved ideal for routine service laboratories due to the extensive extraction procedure, 12 limited linear range, 13 inadequate sensitivity,13,20 long derivatization period, 21 complex nature of the chromatography 14 or interference from isobaric compounds. 11 We previously tried to reproduce Casetta’s method 14 but found that the washout period to clear any lithium from the system impinged on its use for other assays.
The method preparation described by Strathmann et al. 12 describes a batch preparation of 7.5 h, including 1.5 h protein precipitation, 5 h for immunoextraction and 1 h for derivatization and resuspension. A comparable batch size to that described in Strathmann's paper12 can be ran on the instrument in around 4h using our method (no protein precipitation step, 0.5 h assay preparation (allowing reagents to reach room temperature, labelling tubes, etc., 1.5 h immunoextraction procedure including washes and elution, 20 min drying down eluents and 45 min derivatization/resuspension. Ultimately, Strathmann’s method achieved a much lower LOQ (3 pmol/L), but they elected to use the lowest calibrator concentration as the LLOQ (12 pmol/L) which was not dissimilar to our own. 12
The method we have developed requires a relatively large volume of serum, a concern for paediatric patients in particular; however, the dilution experiments demonstrated adequate imprecision to reliably dilute samples to achieve the volume necessary for use with the immunoextraction tubes. One of the earliest published methods required 1 mL sample and was unable to achieve a comparable LLOQ without a derivatization step (48 pmol/L), and achieved relatively low recovery (<60%). They were unable to report imprecision data for human serum sample in their study. 13 More recently described methods (including the manual immunoassays) all use similar11,12,18,20,21 or lower sample volumes.14,22,23
The properties of Amplifex™ selectively allow stable derivatives to be formed with better stereochemistry, fewer fragmentation products, less likely to have isobaric interference, increased polarity and increased ionization efficiency in comparison to 4-phenyl-1,2,4-triazoline-3,5-dione (PTAD). 22 The most abundant fragments generated during ESI were selected to give very good sensitivity producing a lower LOQ of 15 pmol.
Dai et al. 21 describe their decision to continue with PTAD in preference to Amplifex™ based on cost and shorter run time; however, the incubation time required with PTAD is four times as long as that described in our paper and we consider the run time a less significant issue as samples are frequently run overnight, so a shorter analysis time was not a priority. They did achieve a comparable LLOQ (12 pmol/L) to our method by including methylamine in the mobile phase. As Amplifex™ is undoubtedly more expensive than PTAD, we assessed our cost per test including all reagents and consumables, a component for staff time, instrumentation and maintenance. The final figure is comparable to our peers (using an RIA method). We have not surveyed other laboratories offering this test to ask about their costs (aware of only one more offering the test in the UK).
The wide linear range (up to 600 pmol/L) and low imprecision across the measurement range demonstrated very good performance for a clinical service assay, allowing reliable and reproducible analysis comparable with other mass spectrometry users in the vitamin D external quality assessment scheme (DEQAS). The linear range was selected based on a survey of the samples received in our laboratory in the last four years (2015 to 2018 inclusive), around 10% of the 840 specimens had a DHVD concentration >250 pmol/L, over 1 nmol/L for one patient. This would have increased our cost per test and turnaround time, as a number of repeat analyses on dilution would have been required had a narrower range of calibrators been used.
The negative bias observed in the DEQAS sample comparison is likely due to the predominance of the EQA scheme with immunoassay methods, with which all LCMS users show a negative bias and ours is well within the DEQAS allowable limits. Of the methods referenced in this paper, only Dirks et al. have reported a comparison with DEQAS ALTM, and demonstrate a negative bias across the concentration range. 23 Heureux summarizes the cross-reactivity of the antibodies used in the immunoassays for the D2 form which ranges from 39 to 108%. 24 A review of a typical DEQAS report shows a huge spread of values submitted by LCMS users (n = 14 of 162), e.g. sample 411 (October 2017 distribution) method mean = 111.1 ± 19.4 pmol/L, –11.6% from the ALTM leading to the conclusion that the greatest contributor to the bias must be the variation in calibration as we all believe we are reporting accurate and precise concentrations.
Historically haemolysis, icterus and lipaemia are assessed for their potential interference in spectrophotometric detection methods and were anticipated to have no effect on the mass spectrometry. They may have still interfered with antibody binding in the immunoextraction step, but this was not evident from the recovery experiments.
The potential interference from other dihydroxyvitamin D species was not extensively investigated, as SCIEX had performed these studies in terms of the derivatives formed and mass spectrometry detection 25 and the specificity of the antibody in the immunoextraction step had been well characterized. 26 We determined that should samples be collected shortly after the administration of 1α calcidol or in the presence of high concentrations of the major metabolite, 24,25-dihydroxy vitamin D3, then the quantification of DHVD would not be compromised.
Many laboratories will accept plasma (from lithium heparin or EDTA tubes) as an alternative sample type to serum. Our experiments revealed that levels may be up to 20% higher in plasma, so serum was chosen to remain as the preferred matrix. We determined that sample stability was unaffected by up to three freeze–thaw cycles, and several authors have reported good stability in serum at room temperature, 4°C 27 or –20°C (DEQAS, personal communication, October 2017). This has the advantage that samples can be transported between laboratories by first class post.
The HPLC columns have proved capable of reproducible performance up to 1000 injections. Variation in internal standard peak areas for calibrators, quality control and patient samples demonstrate minimum effect from matrix on the analysis, being within acceptable limits across nine batches during the validation period (166 samples in total).
We elected not to pursue quantification of the D2 form of DHVD, as our extensive experience with 25-hydroxy vitamin D analysis by mass spectrometry has indicated very few patients have detectable concentrations of the D2 form of this vitamin D metabolite (<5% of more than 800 samples per week). However, the negative bias seen in comparison to DHVD values determined by RIA may be partly explained by the presence of D2, as the antibody in the RIA has a 91% cross reactivity with the D2 form. 18 We investigated specific cases where there appeared to be a significant bias, specifically looking at the treatment they may be receiving. This was not always possible as a number of specimens were from other laboratories where the information was not available (9 of 78). Overall, the use of D2 containing vitamin D replacement seemed to account for any discrepancy (11 of 69 samples), and unfortunately, the samples could not be subsequently re-analysed by ourselves for D2. When the results were reviewed in terms of the clinical interpretation, the negative bias would not have changed the outcome in 48/69 cases. Other methods do quantify the D2 form,11,12,20,22,23 and as a certified reference material is available, we may pursue including this in the calibration. In addition, the performance of this particular RIA in the DEQAS scheme typically runs with a positive bias, e.g. from the October 2017 distribution, sample 411 method mean = 152.3 ± 24.0 pmol/L, +29.9% from the ALTM, so our method would have probably appeared to have a lower negative bias in comparison with a different RIA or another LCMS user as demonstrated by others.11,12,14,23
In conclusion, we have described a robust and straightforward method for the quantification of DHVD in serum, appropriate for use in a busy service laboratory, allowing for timely reporting with minimum rejection of samples due to inadequate volume, haemolysis, lipaemia or icterus.
Footnotes
Acknowledgements
The authors thank the colleagues at the Royal Liverpool and Broadgreen University Hospital for carrying out the RIA analysis and Dan Blake and Francis Fung from SCIEX for their advice during the method development.
Declaration of conflicting interests
The author(s) declared no potential conflicts of interest with respect to the research, authorship, and/or publication of this article.
Funding
The author(s) received no financial support for the research, authorship, and/or publication of this article.
Ethical approval
Not applicable.
Guarantor
FMI.
Contributorship
FMI, EH and NH carried out the practical work for this report. FMI wrote the first draft of the article. All authors reviewed and edited the article and approved the final version of the article.