
Abstract
Background
We developed and compared two liquid chromatography methods, one with UV/Visible spectrophotometric detection (HPLC) and the other with mass spectrometric detection (LC-MS), for quantifying very-long chain fatty acids (VLCFA) in human plasma. Association of VLCFA with various cardiovascular risk factors were evaluated.
Method
Fasting blood samples were collected from 541 human volunteers (242 men and 299 women; mean age ±SD, 58.9 ± 12.4 years), including 429 and 112 individuals with and without hypertriglyceridemia, respectively. Esterified VLCFA were saponified and derivatized with 2-nitrophenylhydrazine. Separation of VLCFA species was achieved with C4 Mightysil column (HPLC) and Ascentis Express Phenyl-Hexyl column (LC-MS) followed by spectrophotometric and selected-reaction monitoring mode of mass spectrometric detection, respectively.
Results
The HPLC assay of VLCFA was precise with intra-assay imprecision of 2.5% to 6.9% and inter-assay imprecision of 3.2% to 9.5%. Moreover, there was an excellent correlation (r > 0.96) between HPLC and LC-MS methods. The 95 percentile reference intervals (RI; upper limit) of VLCFA were determined to be 41.3 µmol/L in healthy volunteers. Plasma VLCFA were significantly correlated with triglycerides (Spearman’s ρ = 0.306, P < 0.001) and total cholesterol (Spearman’s ρ = 0.251, P < 0.001). All species of VLCFA were significantly elevated in hypertriglyceridaemic individuals compared with control.
Conclusion
We established LC-based assays of VLCFA with either spectrophotometry or mass spectrometry as a detection system. Hypertriglyceridaemia is significantly associated with elevated concentration of each species of VLCFA.
Keywords
Introduction
Fatty acids (FA) are carboxylic acids with a hydrocarbon chain ranging from 4 to 36. They are an important structural component in living system and act as an additional or storage form of metabolic fuel. They can be classified into non-essential and essential FA based on the nutritional requirement, and into unsaturated and saturated FA on the basis of presence or absence of double bond on their hydrocarbon chain, respectively. FA can also be classified according to the length of its hydrocarbon chain into short-chain FA [C4–C6], medium-chain FA [C8–C12], long-chain fatty acid (LCFA) [C14–C20] and very long-chain fatty acid (VLCFA) [C22 or longer]. VLCFA usually comprises a minute fraction of total FA and are localized in specialized mammalian organs like brain, skin, testes, retina, meibomian gland, etc. functioning as skin barrier, maintenance of myelin, proper retinal function and sperm development.1,2
VLCFA can be formed by chain elongation of LCFA in the endoplasmic reticulum. Diet is another important source providing a considerable amount of VLCFA. 3 They are exclusively metabolized in peroxisome to decrease carbon chain to LCFA, which then follow the mitochondrial β-oxidation. Oxidation of VLCFA in peroxisome is similar to mitochondrial β-oxidation except that generated reducing equivalents (FADH2 and NADH) donates its electron directly to oxygen generating H2O2, which is then cleaved to water by catalase. Hence, no net ATP is produced and equivalent energy gets dissipated as heat. Therefore, peroxisomal disorders are associated with impaired utilization of VLCFA. Peroxisomal disorders are genetically heterogeneous groups resulted because of either defect in peroxisomal biogenesis or single peroxisomal protein defects.4,5 Zellweger syndrome (ZS), neonatal adrenoleukodystrophy (NALD) and infantile Refsum disease (IRD) are associated with impaired biogenesis of peroxisomes, while X-linked adrenoleukodystrophy (X-ALD) and peroxisomal β-oxidation-deficient (acyl-CoA oxidase1 deficiency and D-bifunctional protein deficiency) result due to mutation in peroxisomal protein.6–8 Clinical manifestations in these disorders are due to excessive accumulation of VLCFA in various tissues, particularly in the brain, liver, adrenal glands and kidney. Therefore, they are sometimes referred to as cerebrohepatorenal syndrome. Furthermore, there is increasing evidence that VLCFA are associated with the risk of atherosclerotic cardiovascular diseases (ASCVD); therefore, its measurement can be potentially useful to refine the risk stratification of ASCVD.9–11
Measurement of plasma VLCFA forms an important part of routine biochemical investigation in the diagnosis and management of peroxisomal disorders. Gas chromatography-mass spectrometry (GC-MS) is widely adopted in most clinical laboratories offering VLCFA measurement. However, GC-MS detection of FA with C > 24 is relatively inefficient. 12 Furthermore, in recent years, the use of liquid chromatography-tandem mass spectrometry (LC-MS)-based system is rapidly increasing in clinical laboratories. 13 Therefore, development of simple LC-based assay for the measurement of VLCFA that can be easily applicable in the routine clinical laboratory is desirable. Moreover, limited information is available, showing association of circulating VLCFA and metabolic profiles including triglycerides. Therefore, we aimed to develop a simple LC-based assay for the measurement of VLCFA in plasma that can be adopted with spectrophotometry or mass spectrometry (MS) as a detection system depending on the need and availability of resources in clinical laboratories. As metabolism of FA with C20 is closely related to VLCFA and many researchers prefer to refer it as VLCFA, we also included the analysis of arachidic acid (FA20:0). 9 Furthermore, we applied this assay in human plasma to determine the association of circulating VLCFA and triglycerides.
Materials and methods
Chemicals
Arachidic acid FA20:0, behenic acid (FA22:0), lignoceric acid (FA24:0), cerotic acid (FA26:0), non-adecanoic acid (FA19:0), 2-nitrophenylhydrazine hydrochloride (2-NPH·HCl) and 1–(3-dimethylaminopropyl)-3-ethylcarbodiimide hydrochloride (1-EDC·HCl) were purchased from Tokyo Chemical Industry Co., Ltd (Tokyo, Japan) and were of analytical grade. FA labelling reagents were obtained from YMC CO. (Kyoto, Japan). All solvents used for LC were from Wako Pure Chemical Industry (Osaka, Japan).
Synthesis of standards
We used 2-NPH-labelled FA20:0, FA22:0, FA24:0 and FA26:0 as standards while FA19:0 as internal standards (IS). The 2-NPH labelled FA were synthesized in our laboratory by the process described previously 14 and used for the identification and optimization of LC conditions.
Specimen
Fasting blood sample was collected from 541 human volunteers (242 men and 299 women; mean age ±SD, 58.9 ± 12.4 years, range: 35–79 years) who participated in a community-based epidemiological study, the DOSANCO Health Study in Suttsu town of Hokkaido, Japan after written informed consent.15,16 Basic characteristics of study participants were provided in Supplemental Data, Table S1. Out of 541 participants, 112 were hypertriglyceridaemic (68 men and 44 women). Institutional Review Committee for Ethical Issues of the Faculty of Medicine (16–007) and the Faculty of Health Sciences (16–10), Hokkaido University approved this study protocol.
Derivatization of VLCFA
Esterified VLCFA (FA20:0, FA22:0, FA24:0 and FA26:0) in the plasma were first saponified to release into free form and were derivatized with 2-NPH as described earlier.14,17,18 Briefly, 25 µL of serum was mixed with 10 µL of FA19:0 (IS, 2 nmol) and 100 µL of KOH (0.3 M in ethanol) and heated for 30 min at 80°C to ensure complete saponification of esterified FA present in the samples. This was followed by the addition of 200 µL of each 2-NPH·HCL (20 mM in ethanol), and 1-EDC·HCL (0.25 M in ethanol:pyridine 97:3) and further heated at 60°C for 20 min. After the addition of 200 µL of KOH (10%, w/v in methanol:water 50:50), the mixture was heated at 60°C for 15 min. The derivatized FA was extracted using 3 mL of hexane, which is then dried under vacuum (Tomy centrifugal concentrator, Tokyo, Japan). The residue was dissolved in 200 µL of methanol and filtered using a centrifugal filter device (Ultrafree®-MC-HV, PVDF 0.45 µm, Merck Millipore Ltd., Carrigtwohill, Ireland) and stored at –80°C until analysis.
High-performance liquid chromatography (HPLC)
Chromatographic analyses were performed with a Shimadzu Nexera X2 LC-30AD UHPLC (Shimadzu Seisakusho, Kyoto, Japan) equipped with a Shimadzu Nexera X2 SIL-30AC autosampler, CTO-20A Prominence column oven and SPD-M20A photodiode array detector. The absorbance was measured at 400 nm. A series of experiments were performed to select the optimal conditions with distinct high-resolution separation of VLCFA species without being affected by interfering substances in the sample. We synthesized 2-NPH-labelled FA20:0, FA22:0, FA24:0 and FA26:0 standards by the method described earlier. 14 These labelled standards were used for the identification of targeted peak during optimization of HPLC condition. Furthermore, serum samples spiked with FA species were used to determine the optimal separation of each peak of VLCFA. Samples without adding internal standard were analysed to make sure no interfering substance elutes along with IS. We found that C4 Mightysil reversed-phase column (150 mm × 4.6 mm i.d., particle size 5 µm, Cica Reagent, Kanto Chemical Co., Inc., Tokyo, Japan), maintained at 35°C showed the best efficiency for separating VLCFA. Gradient elution was performed with water (pH adjusted to 4.0 with trifluoroacetic acid, solvent A) and methanol (solvent B) at a flow rate of 1.0 mL/min. The HPLC gradient conditions were as follows: 0.00–0.50 min isocratic at 70% B, 0.5–22.00 min 70→95% B, 22.01–27.00 min isocratic at 100% B for washing and 27.01–32.0 min isocratic at 70% B to re-equilibrate the column. Ten microlitres of the extract was injected into HPLC. Typical chromatograms obtained from a mixture of standards and a sample were shown in Supplemental Data, Figure S1(a) and (b), respectively.
Liquid chromatography-tandem mass spectrometry (LC-MS)
LC-MS was performed using a Thermo Finnigan Surveyor HPLC-TSQ Quantum Quadrupole mass spectrometer system (Thermo Fisher Scientific Inc., Waltham, MA), using Ascentis® Express Phenyl-Hexyl column (5 cm × 2.1 mm i.d., 5 µm, Supelco, Inc., Bellefonte, PA) in the multiple-reaction monitoring (MRM) mode as described previously.19,20 The extracts (as described above) were diluted to 1:10 with methanol and 3 µL of the diluted sample were injected into the LC-MS. Quantification was carried out using Thermo Xcalibur 2.1 software (Thermo Fisher Scientific, Inc.). A total of 130 randomly selected samples were analysed by LC-MS. A typical chromatogram of VLCFA species obtained from a sample along with precursor and product ions were shown in Supplemental Data, Figure S1(c) to (g).
Preparation of standard curve
A stock solution (1.0 µmol/10 mL) of each FA in methanol was prepared gravimetrically by measuring its dry weight on an ultrasensitive electro-balance (Cubis® ultramicro balance, Sartorius, Goettingen, Germany). Working standards were prepared to give the final concentration of each 0.1, 1.0, 5.0, 10.0, 20.0, 40.0, 80.0, 200.0 µmol/L. The standard solutions were stored at –20°C and allowed to equilibrate at room temperature before use. Working standard solution is derivatized as mentioned above and the calibration curves were constructed by plotting the peak area ratio of each FA standard to the IS against its concentration.
Accuracy, precision and recovery
The analytical performance the VLCFA assay were evaluated by repeating analysis of human plasma spiked with known concentrations of FA20:0, FA22:0, FA24:0 and FA26:0 at three different concentration (5.0, 20.0 and 100.0 µmol/L) for six times in a run (intra-assay) for six consecutive days (inter-assay). Means, standard deviations (SD) and inter- and intra-assay coefficients of variation (CV) were calculated, and total and within-run precision were calculated according to the Clinical and Laboratory Standards Institute (CLSI) guidelines. 21 The spiked pooled serums were also run in parallel when performing VLCFA analysis in test serum as internal quality control material. Each batch of assay is validated when the result of QC serum lies within ±2 SD of the mean.
Definitions and statistical analysis
Sum of concentration of FA20:0, FA22:0, FA24:0 and FA26:0 were calculated as VLCFA. Diabetes mellitus (DM) was defined as per the recent American Diabetes Association (ADA) criteria as fasting blood glucose (FBG) ≥ 7.0 mmol/L or/and HbA1c ≥ 6.5%. 22 Serum triglyceride was classified into three groups, based on its concentration as; ‘Normal’ (<1.7 mmol/L), ‘Borderline high’ (1.7–2.27 mmol/L) and ‘High’ (≥2.28 mmol/L) and total cholesterol (TC) was classified into three groups, based on its concentration as; ‘desirable’ (<5.17 mmol/L), ‘Borderline high’ (5.17–6.19 mmol/L) and ‘High’ (≥6.2 mmol/L) as per NCEP ATP III guideline. 23 Low-density lipoprotein-cholesterol (LDL-C) was calculated using the Martin-Hopkins equation. 24 High sensitivity C-reactive protein (hsCRP) was categorized into three classes – ‘Low risk’ (<1.0 mg/L), ‘Moderate risk’ (1–3 mg/L), ‘High risk’ (3.0–10.0 mg/L) based on AHA/CDC Scientific Statement. 25 As per the guideline, seven samples with hsCRP greater than 10 mg/L were excluded from data analysis. Framingham Risk Score (FRS) and Suita score were calculated as described by Wilson et al. 26 and Nishimura et al., 27 respectively. On the basis of FRS and Suita score, participants were categorized into three groups as low (<10%), intermediate (10–20%) and high (>20%) 10-year predicted risk of coronary heart disease (CHD). The estimated glomerular filtration rate (eGFR) was calculated using the MDRD equation modified with the Japanese coefficient. 28 Statistical Package for Social Service (SPSS for Windows version; SPSS, 11.5, Inc., Chicago, IL) were used for data analysis. Value of VLCFA and triglycerides are expressed in median and interquartile range. Statistical difference in the median concentration between different groups was analysed by Kruskal-Wallis test with post hoc comparison (Dunnett). Spearman’s rank-order correlation was used to measure the association of VLCFA with triglycerides and other cardiovascular risk factors. Reference interval (RI) was calculated by non-parametric percentile method as per the CLSI C28-A3 guideline using MedCalc software (Ostend, Belgium).
Results
Assay performance of HPLC
The calibration curve of each VLCFA species, as determined by linear regression analysis, showed good linearity with the coefficient of determination (r2) above 0.998 (Supplemental Data, Figure S2). The limits of detection (LOD) were 1 pmoL for all FA at signal-to-noise ratio (S/N) of 4:1. The lower limit of quantitation (LOQ) was 3 pmoL for each FA at S/N 5:1 per injection to the column. The data of the inter-assay and intra-assay variations for the FA analysis are shown in Supplemental Data, Table S2. The CV of imprecisions were within 10% for all VLCFA in both inter- and intra-assay run. Reproducibility (within-run) imprecision varied from 2.5% to 6.9%, while analytical recovery ranged from 97.0% to 106.3%. Therefore, this method has acceptable analytical performance and suitable for clinical use to measure VLCFA in the plasma.
Comparison between HPLC and LC-MS assay
After the derivatization and extraction of lipids, the extracts were analysed by both HPLC and LC-MS methods. A statistical comparison of the results obtained by HPLC is well correlated with the LC-MS method with a correlation coefficient (r) above 0.96 for all VLCFA species (P < 0.0001) (Figure 1). Comparison of the HPLC vs. LC-MS methods by Bland-Altman plot showed mean difference of –0.2 µmol/L (FA20:0), 0.5 µmol/L (FA22:0), 0.1 µmol/L (FA24:0) and 0.06 µmol/L (FA26:0) (Supplemental Data, Figure S3). The plot showed no significant bias with over 95% measurement within the limits of agreement as defined as the mean difference ± 1.96 SD of difference. Since the line of equality is within the 95% CI of the mean difference of VLCFA determined by HPLC and LC-MS, these two methods were considered to be in agreement and can be used interchangeably. Therefore, either of the spectrophotometry or MS detection system can be used following LC separation for the measurement of VLCFA depending on the availability.
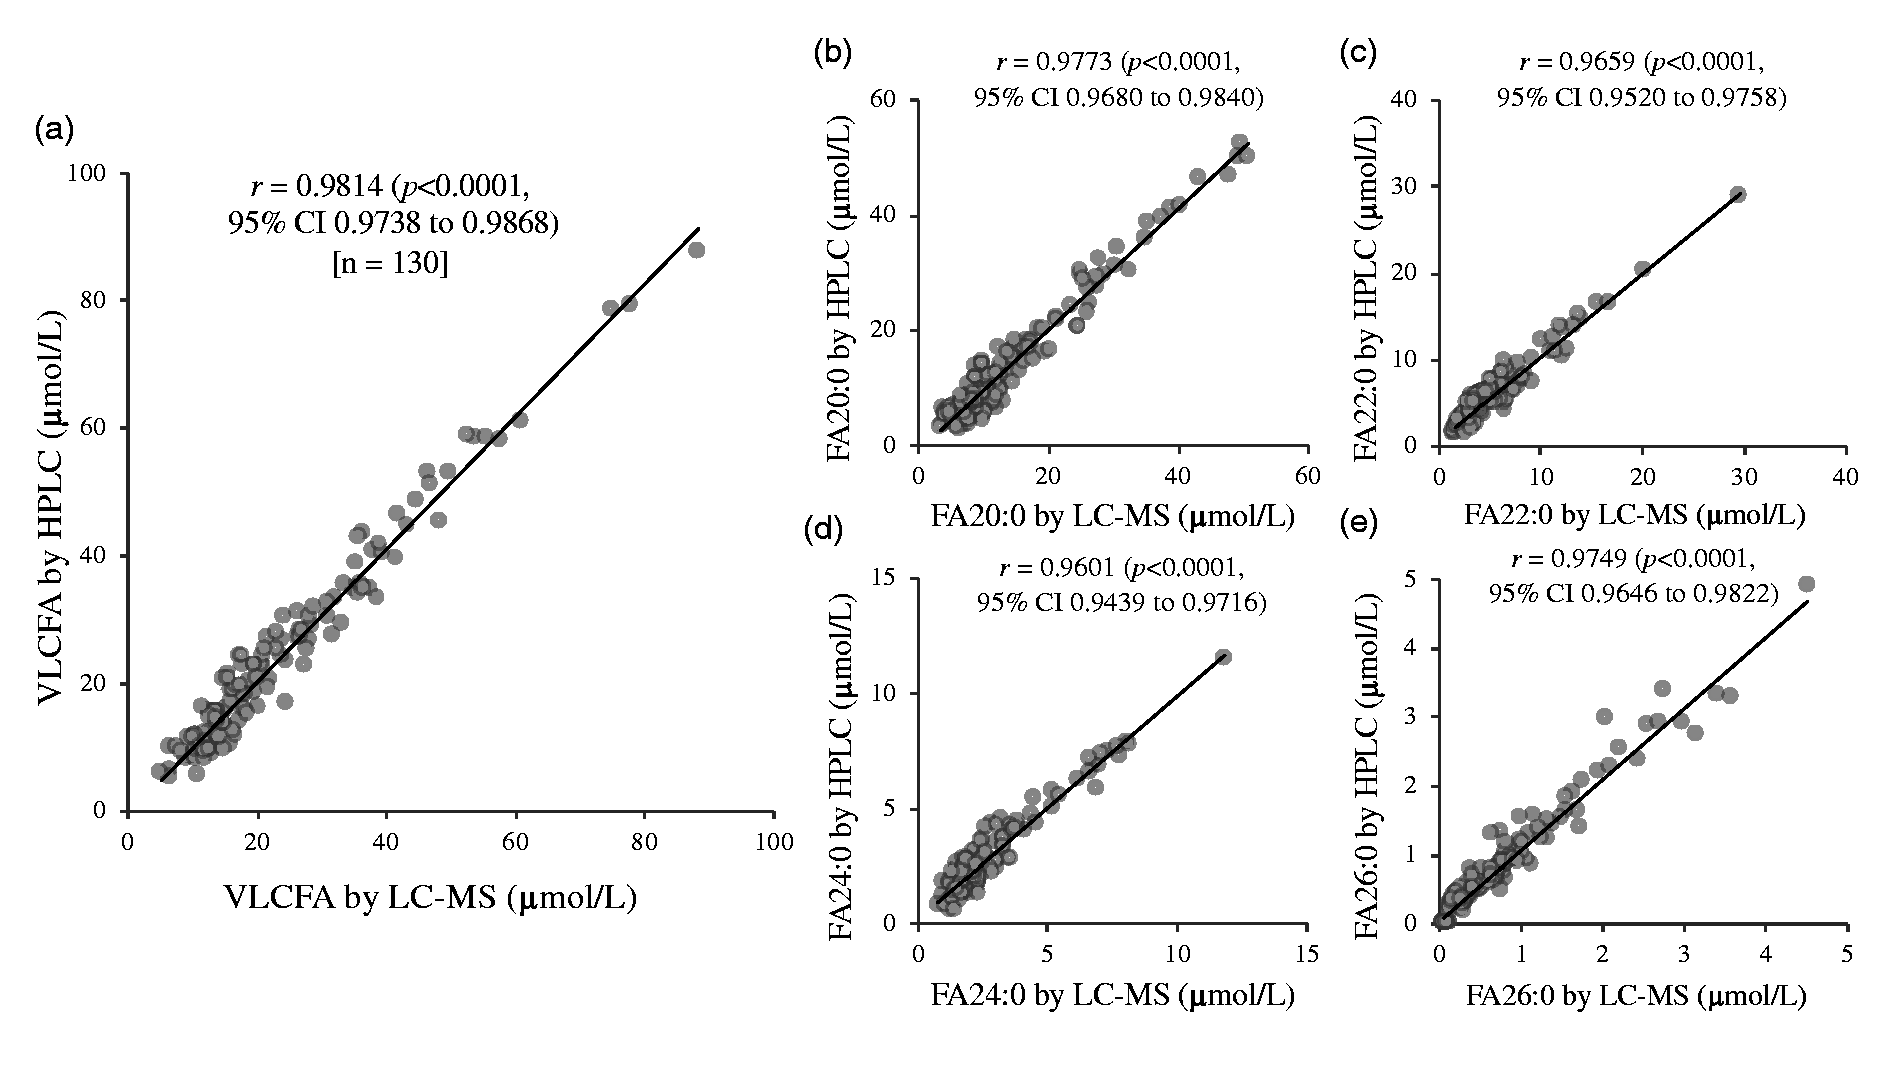
Correlation analysis between measurement of very-long chain fatty acids (VLCFA) using liquid chromatography-mass spectrometry (LC-MS) and high-performance liquid chromatography (HPLC) revealed that there was a statistically significant correlation between the two assays. (a) Total VLCFA; (b) arachidic acid, FA20:0; (c) behenic acid, FA22:0; (d) lignoceric acid, FA24:0 and (e) cerotic acid, FA26:0.
VLCFA in human plasma
Median (interquartile range) concentration of VLCFA as determined by HPLC was found to be 14.8 (11.55–19.1) µmol/L. Median (interquartile range) concentration of each species – FA20:0, FA22:0, FA24:0 and FA26:0 were 7.6 (6.0–11.05), 4.0 (3.2–5.2), 2.2 (1.6–2.8), 0.5 (0.2–0.8) µmol/L, respectively. Gender-specific concentration of VLCFA and its species were given in Supplemental Data, Table S1. We observed no statistical difference in the mean concentration of total VLCFA and its species between men and women.
VLCFA in hypertriglyceridemia
We found a moderate yet statistically significant correlation between circulating VLCFA concentration and serum triglycerides concentration with Spearman’s correlation coefficient (⍴) of 0.306 (p < 0.0001, 95% CI 0.228 to 0.381) (Figure 2). Except for FA26:0, the remaining species of VLCFA were significantly positively correlated with serum triglycerides (Figure 2(b) to 2(e)). However, when correlation was measured between FA26:0 and triglycerides among 112 hypertriglyceridaemic individuals, there was a significant positive correlation with correlation coefficient (⍴) of 0.224 (P = 0.0175, 95% CI 0.0402 to 0.393). The correlation was stronger in the hypertriglyceridaemic group compared with individuals with normal triglycerides concentration (Supplemental Data, Table S3). Among 429 individuals with normal triglyceride concentration, the median concentration of VLCFA was 13.7 (interquartile range 10.97–17.50). The median concentration of VLCFA was significantly elevated in individuals with hypertriglyceridaemia (Figure 3). Out of 112 individuals of hypertriglyceridaemia, 60 were at borderline-high and 52 were with high serum triglycerides concentration. The median concentration of VLCFA in borderline-high and high triglycerides categories were 16.4 (interquartile range 13.35–19.35) and 23.3 (interquartile range 18.6 34.5) µmol/L, respectively, which were significantly higher compared with control (P < 0.001). The median concentration of all species of VLCFA – FA20:0, FA22:0, 24:0 and 26:0 were significantly elevated in hypertriglyceridaemia compared with normotriglyceridaemic individuals (Figure 3(b) to 3(e)). Similarly, all the species of VLCFA were significantly positively correlated with total FA, total saturated FA, total monounsaturated FA and total polyunsaturated FA. Only FA26:0 was significantly positively correlated with total non-esterified (free) FA (Table 1).
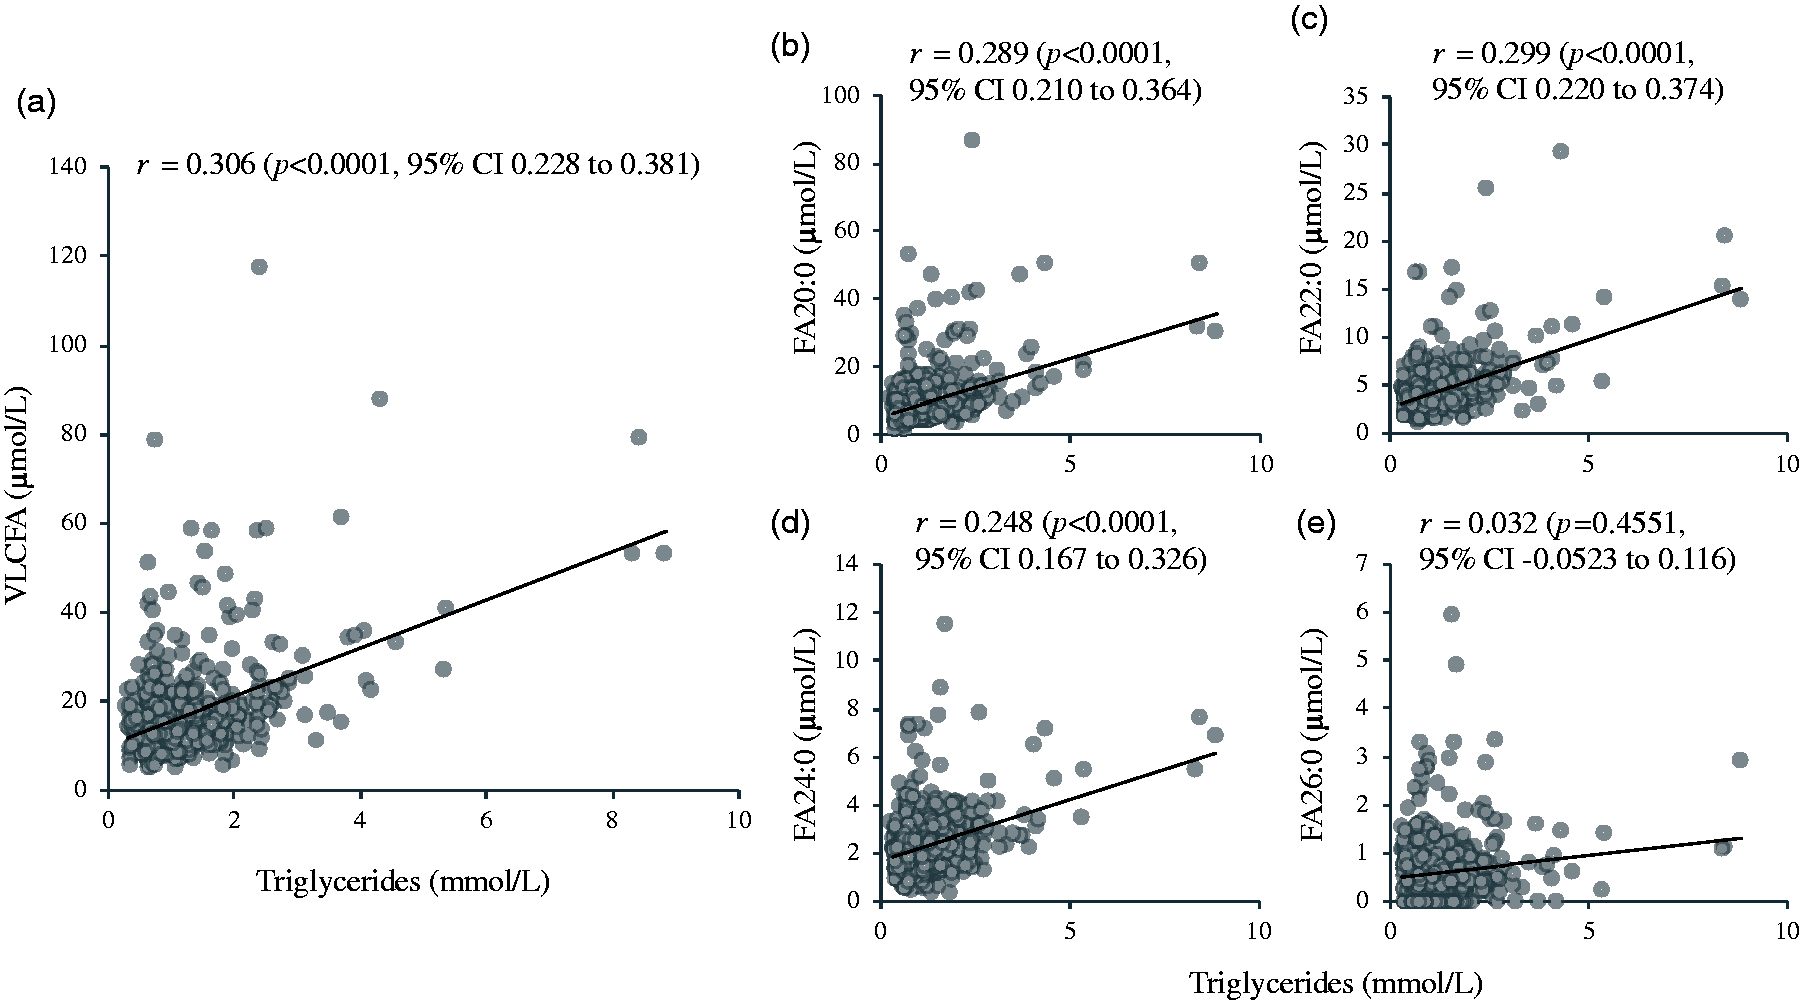
Spearman’s correlation of very-long chain fatty acids (VLCFA) to serum triglycerides measured in 541 human serum samples. (a) Total VLCFA; (b) arachidic acid (FA20:0); (c) behenic acid (FA22:0); (d) lignoceric acid (FA24:0); (e) cerotic acid (FA26:0). Statistically significant correlation was observed between serum triglyceride with total VLCFA, FA 20:0, FA22:0 and FA24:0.
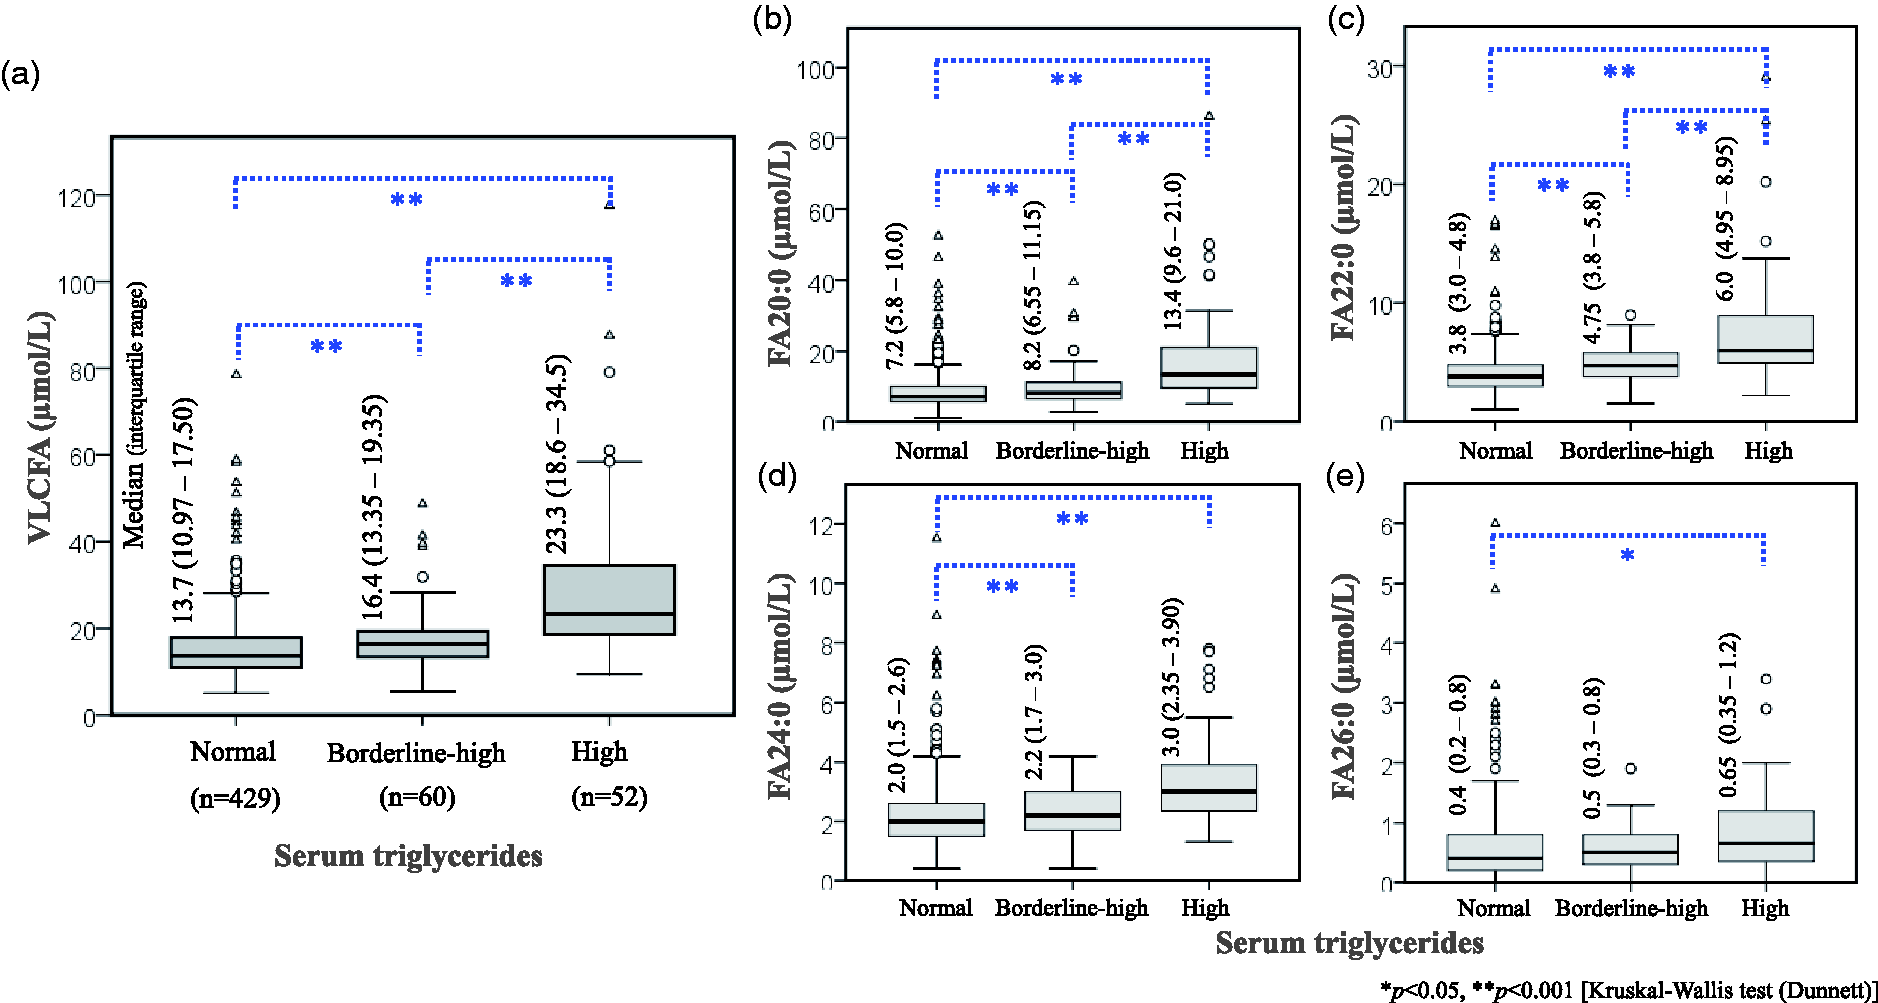
Comparison of median and interquartile range of (a) total very-long chain fatty acids. VLCFA; (b) arachidic acid, FA20:0; (C) behenic acid, FA22:0; (d) lignoceric acid, FA24:0 and (e) cerotic acid, FA26:0 between hypertriglyceridaemic individuals and controls. All VLCFA species were significantly elevated in individuals with borderline-high and high triglyceride.
Spearman's correlation of very-long chain fatty acids species with serum lipids and cardiometabolic risk factors.
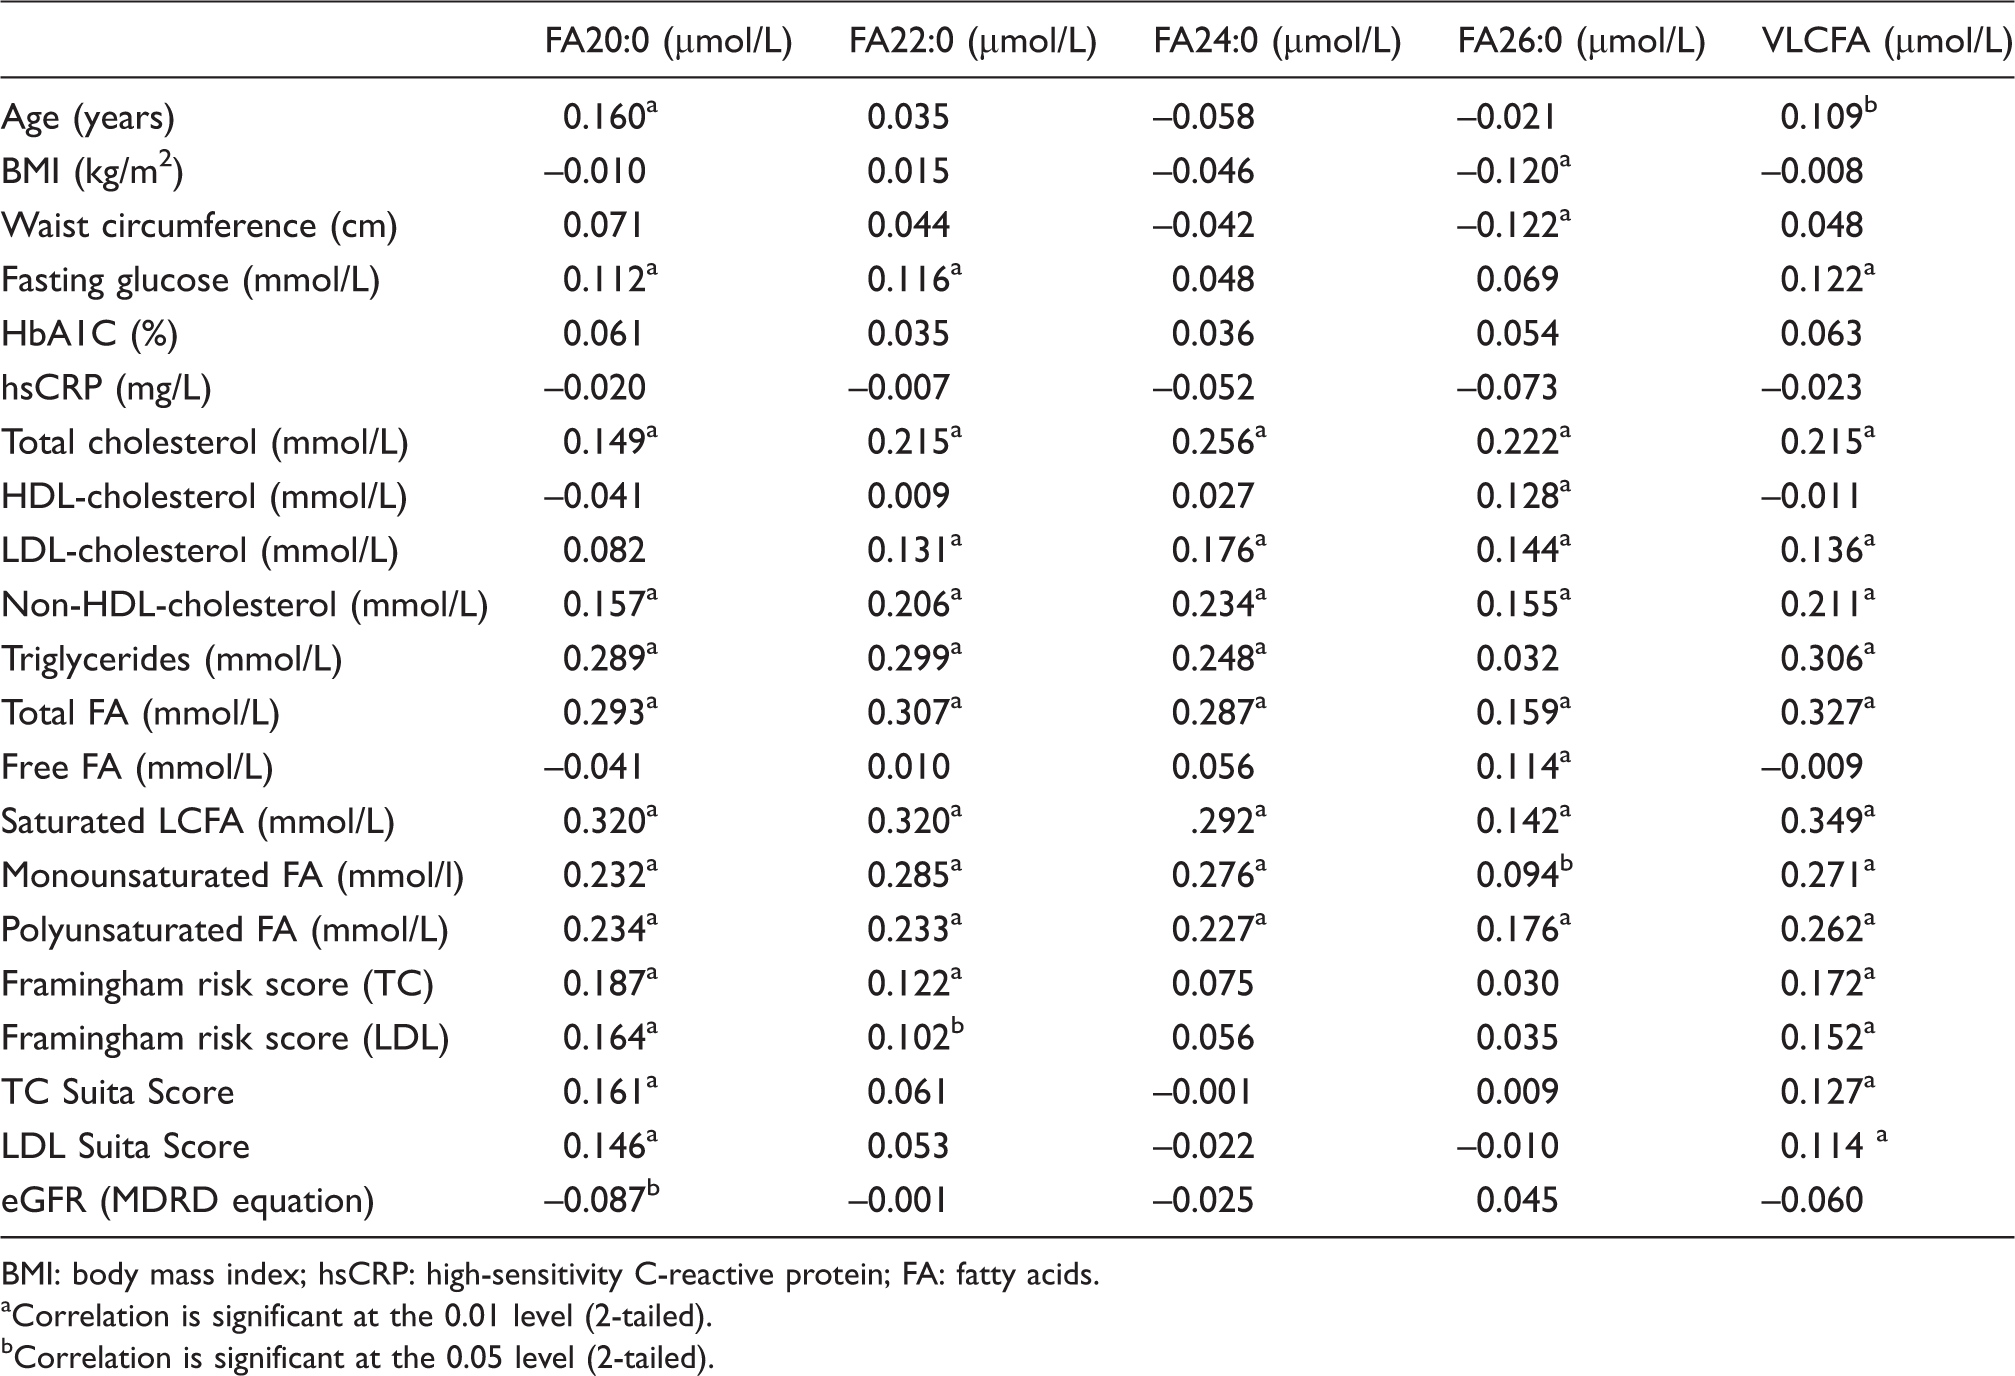
BMI: body mass index; hsCRP: high-sensitivity C-reactive protein; FA: fatty acids.
Correlation is significant at the 0.01 level (2-tailed).
Correlation is significant at the 0.05 level (2-tailed).
VLCFA and other cardiovascular risk factors
Serum concentration of VLCFA was positively correlated with various cardiovascular risk factors including age, fasting glucose, TC, LDL-C, non-high-density lipoprotein-cholesterol (non-HDL-C) and total FA concentration (p < 0.05) (Table 1). There was a significant positive correlation of FA22:0, FA24:0 and FA26:0 with TC and LDL-C, while only FA26:0 correlated with HDL-C. Also, the median concentration of VLCFA was significantly elevated in individuals with borderline-high and high cholesterol level compared with individuals with normal cholesterol level (Figure 4). Except for FA20:0, all VLCFA concentrations were elevated in hypercholesterolaemia (Figure 4(b) to 4(e)). FBG concentrations showed a significant correlation with VLCFA (Table 1), and there was a significant increase in median concentration of FA20:0 and total VLCFA in diabetic and prediabetic individuals compared with healthy controls (Supplemental Data, Figure S4). We found no correlation and association of VLCFA with hsCRP, an inflammatory cardiovascular risk factor and no significant difference in median concentration was observed between low-, moderate- and high-risk groups based on hsCRP level (Supplemental Data, Figure S5). We also determined 10-year CHD risk of study participant based on FRS and Suita score. The concentration of serum VLCFA is positively correlated with FRS and Suita score determined using total cholesterol as well as LDL points (Table 1). Among species of VLCFA, only FA20:0 and FA22:0 showed statistically significant correlation with FRS. Also, median concentration of total VLCFA and FA20:0 were significantly elevated in individuals with >20% 10-year CHD risk as predicted by FRS (Supplemental Data, Figure S6). The concentration of FA20:0 is negatively correlated with eGFR (Table 1).
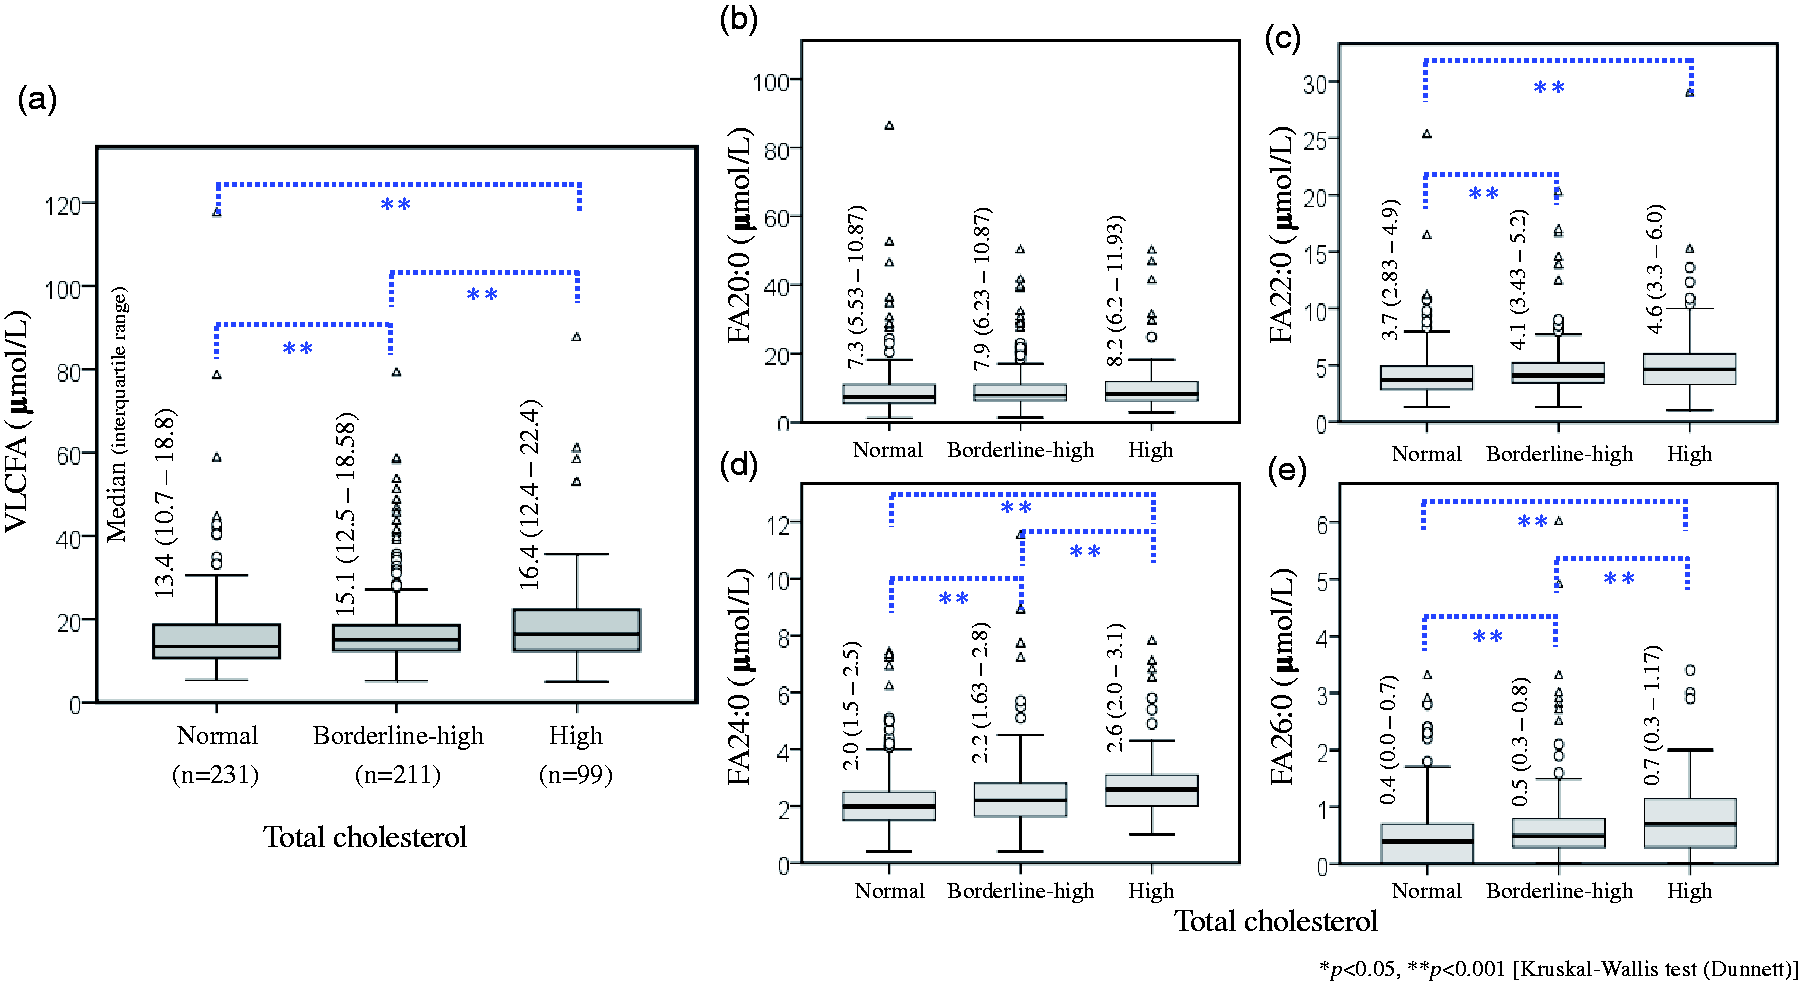
Comparison of median and interquartile range of (a) total very-long chain fatty acids, VLCFA; (b) arachidic acid, FA20:0; (c) behenic acid, FA22:0; (d) lignoceric acid, FA24:0 and (e) cerotic acid, FA26:0 between hypercholesterolaemic individuals and controls. FA22:0, FA24:0 and FA24:0 were significantly elevated in individuals with borderline-high and high serum total cholesterol.
Reference interval of VLCFA
When RI for VLCFA measured by HPLC was calculated from 373 healthy individuals using the non-parametric percentile method recommended by CLSI C28-A3 (Supplemental Data, Figure S7), 95 percentile RI (lower to upper limit) was 6.97 to 41.28 µmol/L. RIs for each species of VLCFA were 3.24 to 27.89 (FA20:0), 1.64 to 8.47 (FA22:0), 0.80 to 5.56 (FA24:0) and 0.0 to 2.47 µmol/L (FA26:0). Considering these as RI, a considerable number of hypertriglyceridaemic individuals (13.4%) exceeded upper limit. However, 95 percentile RI (upper limit) of VLCFA calculated from 112 hypertriglyceridaemic individuals was found to be 80.6 µmol/L. Only 2 out of 112 hypertriglyceridaemic volunteers exceeded this upper limit.
Discussion
In this study, we developed a simple LC-based assay for the measurement of VLCFA in plasma. The assay can be well adopted with spectrophotometry or MS detection system depending on the need and availability of resources in clinical laboratories. We applied this assay for the measurement of VLCFA in normotriglyceridaemic and hypertriglyceridaemic serum samples. Our results showed that there is a significant positive correlation between VLCFA and serum triglycerides, and the concentration of VLCFA is significantly elevated in individuals with hypertriglyceridaemia.
Although FA are conventionally quantified using GC-MS with high sensitivity, the measurement of VLCFA is less efficient. 12 Furthermore, GC-MS is not commonly available in most clinical laboratories and the use of LC-MS is gaining more popularity.13,29 Therefore, LC-MS based assay for the measurement of VLCFA is a good alternative. Our method is relatively simple with adequate sensitivity and accuracy. We first derivatized the FA with 2-NPH that improve the specificity and sensitivity. The analysis is completed within 15 min including an additional 3 min of washing column. Importantly, since NPH derivatized FA can absorb light at 400 nm, HPLC with UV-Vis spectrophotometry detection system can also be used. The analytical performance of HPLC was assessed in this study, and we confirmed that it is suitable for the measurement of VLCFA with enough sensitivity, specificity and precision. Both intra- and inter-assay coefficient of variations were within acceptable range with satisfactory analytical recovery (Supplemental Data, Table S2). Moreover, there is a significant positive correlation between VLCFA as determined by HPLC and LC-MS with all correlation coefficients (r) greater than 0.96 (Figure 1). Therefore, HPLC method can be equally valuable and method of choice in the laboratories which are not equipped with LC-MS.
Since VLCFA are predominantly catabolized in peroxisomes, the accumulation of VLCFA in various tissues including the brain, kidney and adrenal glands are classical features in the peroxisomal disorders. Although the incidence of peroxisomal disorders is rare, measurement of VLCFA in plasma is an important laboratory investigation to aid the diagnosis and monitoring of the disorders. Plasma VLCFA increases in various peroxisomal disorders particularly in all patients homozygous for ZS, NALD, IRD and in patients with deficiencies of peroxisomal acyl-coenzyme A oxidase and 3-oxoacyl-coenzyme A thiolase, and the level of plasma VLCFA is correlated with clinical severity. 30 In addition, neurodegenerative disorders like Alzheimer’s disease and metabolic diseases related to oxidative stress and chronic inflammation are also associated with peroxisomal dysfunction leading to elevated concentration of VLCFA.31–34 Although GC-MS is being currently used in the measurement of plasma VLCFA, it is time consuming and not widely available. Derivatization and extraction procedures are laborious and thus prone to error. For instance, methyl ester derivatization of FA for GC-MS analysis needs incubation over 16 h. 35 More sophisticated method using multiwalled carbon nanotube-based surface-assisted laser desorption/ionization MS has been reported but cannot be easily adopted in clinical laboratory. 36 In contrast, our method is relatively simple and less time consuming with high sensitivity and specificity. Therefore, it can be easily applied in clinical laboratory for the screening, diagnosis and monitoring of the peroxisomal dysfunctions.
Our novel finding is that the level of VLCFA shows a significant positive correlation with serum triglycerides and increase concentration of all species of VLCFA were significantly associated with hypertriglyceridaemia (Figure 2). Among the VLCFA species, FA20:0, FA22:0 and FA24:0 also showed a similar significant correlation with serum triglycerides. Furthermore, we observed a significant difference in the median value of VLCFA among hypertriglyceridaemic and control (Figure 3). The concentration of all VLCFA species was significantly elevated in individuals with high serum triglycerides. This result implies that apart from the peroxisomal disorders, circulating VLCFA concentration may also be dependent on serum triglyceride value. Since unesterified (free) VLCFA was not detected in the plasma, it is likely that majority of VLCFA are esterified in triglycerides. However, considering low Spearman’s rank correlation coefficient between triglycerides and VLCFA species, the possible source of VLCFA from plasma phospholipid and plasmalogen cannot be neglected. Previous study has showed that VLCFA can be incorporated into the phospholipid of cell membrane and destabilizes its structure, which leads to neurological manifestations in peroxisomal disorders. 37 In this study, we did not determine the correlation of plasma VLCFA with phospholipids and plasmalogen, but it will be interesting to know if any association exist between them. The clinical utility of elevated VLCFA due to hypertriglyceridaemia is uncertain. However, our data suggest that the result of VLCFA should be carefully interpreted considering the value of serum triglycerides. For example, 95 percentile RI (upper limit) of VLCFA determined from 373 healthy control as per CLSI C28-A3 were found to be 41.3 µmol/L (Supplemental Data, Figure S7). VLCFA concentration of a considerable number of hypertriglyceridaemic individuals (13.4%) exceeds the RI.
Serum VLCFA is also associated with a number of cardiac risk factors. We found that circulating VLCFA is positively correlated with serum TC (Table 1). Individuals with high TC concentrations are associated with significant elevation of FA22:0, FA24:0 and FA26:0 (Figure 4). Similarly, a significantly positive correlation was observed between VLCFA and FBG. Among the species of VLCFA, only FA20:0 and FA22:0 showed a significantly similar correlation with FBG. Among VLCFA species, only FA20:0 is significantly elevated in diabetic and prediabetic group compared with non-diabetic individuals. However, we did not observe any significant association of VLCFA with an inflammatory biomarker of cardiovascular risk – hsCRP. A few reports are available indicating possible association of VLCFA with ASCVD. Miyazaki et al. reported that high level of FA26:0 in whole blood is an independent risk factor of coronary artery disease (CAD) in the Japanese population. 11 Another study from Tunisia also reported that VLCFA, particularly FA26:0 in whole blood were significantly higher in CAD group compared with control and is positively correlated with oxidative marker and vascular severity score. 10 Antoku et al. reported that elevated FA26:0 in the erythrocyte were associated with cardiovascular risk factors including age, TC and triglycerides. Erythrocytes FA26:0 were significantly and positively correlated with serum triglycerides, TC, LDL-C and negatively correlated with elevated HDL-C. 38 Another study by Matsumori et al. found that FA24:0 in erythrocytes is significantly correlated with atherogenic lipoprotein profiles and increased hsCRP. 39 Furthermore, VLCFA in whole blood are associated with metabolic syndrome in Japanese men. 40 Our analysis shows that increase in the concentration of VLCFA is associated with increase in 10-year CHD risk as predicted by FRS and Suita score. We found a strong correlation of total VLCFA and the CHD risk (Table 1). Both FA20:0 and FA22:0 are positively correlated with FRS. In contrast, some studies showed a negative correlation of VLCFA with ASCVD. Study in the US population by Malik et al. demonstrated that increase in both plasma and erythrocytes VLCFA were associated with a lower risk of ASCVD. They demonstrated that the plasma concentration of VLCFA (FA20:0, FA22:0 and FA24:0) were significantly low among 794 incident coronary heart disease compared with control. 9 Similarly, the Cardiovascular Health Study showed that plasma VLCFA were significantly associated with a lower risk of developing atrial fibrillation. 41 A nested case–control study from Australia reported that elevated level of FA24:0 in whole blood is inversely associated with risk of DM. 42 Therefore, more studies are required to clarify the association of VLCFA in atherosclerosis and its risk factors. The availability of simple assay for the quantification of VLCFA is crucial for prospective studies to determine its possible involvement in atherosclerosis and add value to the risk stratification for primary prevention of ASCVD.
One limitation of our study is that we did not determine the VLCFA in whole blood. It is believed that elevated level of VLCFA in erythrocyte membrane reflects the decrease peroxisomal function and associated with reduced membrane fluidity, which in turn can affects membrane receptor functions promoting atherogenic process in vascular endothelial cells. 34 It will be interesting to know the correlation between serum and erythrocytes VLCFA, and its association with other lipid profiles. Another limitation of this study is that we used FA19:0 as IS instead of using isotope-labelled IS for each component. Although, the use of isotope labelled IS is desirable, we selected to use FA19:0 as IS to keep the assay economically feasible for small-scale laboratories. There are many reports of using FA19:0 as IS because its concentration in plasma is negligible. Our RIs of VLCFA are comparatively lower than previous report using LC-MS/MS method. 12 We applied derivatization of VLCFA with NPH before subjected to LC-MS/MS analysis which can improve the specificity. Although the reported normal concentration of VLCFA widely varied among the different method used, our results were comparable with GC/MS with pentaflourophenyldimethylsilyl derivatization. 43 Finally, we did not determine the distribution of VLCFA among different lipoprotein species. VLCFA profiling in lipoprotein species may aid in a better understanding of the association of VLCFA in ASCVD and is our future interest.
Conclusion
First, we developed two simple LC-based methods for the measurement of VLCFA species in human plasma with spectrophotometry or tandem mass spectrometry as detection system which can be easily adopted in the clinical laboratories. Second, the concentration of circulating VLCFA was significantly positively associated with serum triglycerides and other metabolic profiles. Therefore, the measurement of VLCFA may assist the risk stratification of ASCVD.
Supplemental Material
sj-pdf-1-acb-10.1177_00045632211007157 - Supplemental material for HPLC with spectrophotometric or mass spectrometric detection for quantifying very-long chain fatty acids in human plasma and its association with cardiac risk factors
Supplemental material, sj-pdf-1-acb-10.1177_00045632211007157 for HPLC with spectrophotometric or mass spectrometric detection for quantifying very-long chain fatty acids in human plasma and its association with cardiac risk factors by Rojeet Shrestha, Zhen Chen, Zijun Gao, Yifan Chen, Emiko Okada, Shigekazu Ukawa, Takafumi Nakagawa, Koshi Nakamura, Akiko Tamakoshi, Hitoshi Chiba and Shu-Ping Hui in Annals of Clinical Biochemistry
Footnotes
Acknowledgements
We express our sincere gratitude to all study participants of DOSANCO Health Study and staff members who were involved in this study.
Declaration of conflicting interests
The author(s) declared no potential conflicts of interest with respect to the research, authorship, and/or publication of this article.
Funding
The author(s) disclosed receipt of the following financial support for the research, authorship, and/or publication of this article: This work is supported by the Japan Society for the Promotion of Sciences (JSPS) KAKENHI Grants – 17H01879, 17H04120, 17K09001, 18K07434, 19H03117, 19K07861, 16K15353 and JP26670322, and by Ministry of Agriculture, Forestry and Fisheries, Japan, Research for Agriculture and Interdisciplinary Fields (14538261).
Ethical approval
Institutional Review Committee for Ethical Issues of the Faculty of Medicine (16–007) and the Faculty of Health Sciences (16–10), Hokkaido University approved this study protocol.
Guarantor
SPH.
Contributorship
RS, SPH, AT and HC researched literature and conceived the study. EO, SU, TN, KN, HC, SPH and AT were involved in study design, specimen collection and discussion. RS, ZC and ZG were involved in HPLC and LC-MS analysis and other laboratory work. YC was involved in statistical analysis. RS wrote the first draft of the manuscript. All authors have accepted responsibility for the entire content of this article and approved submission.
Supplemental material
Supplemental material for this article is available online.
References
Supplementary Material
Please find the following supplemental material available below.
For Open Access articles published under a Creative Commons License, all supplemental material carries the same license as the article it is associated with.
For non-Open Access articles published, all supplemental material carries a non-exclusive license, and permission requests for re-use of supplemental material or any part of supplemental material shall be sent directly to the copyright owner as specified in the copyright notice associated with the article.