
Abstract
Background
Sulfatides are found in a variety of tissues and serum lipoproteins. Sulfatide is a molecular species composed of various sphingoid bases, fatty acids and sugar chains; therefore, rapid analysis of the qualitative structure is important in clinical assessment.
Methods
In this study, sulfatide-rich fractions were isolated from serum lipids, and the sulfatide species were analysed by negative ion mode using matrix-assisted laser desorption ionization time-of-flight mass spectrometry (MALDI-TOF MS).
Results
Sulfatide species identified in human serum included two different sugar chains, eight sphingoid molecules and various fatty acid side chains including hydroxy fatty acids. In total, 64 galactosyl sulfatides (SM4s) and 49 lactosyl sulfatides (SM3) were identified. Quantitatively, the amount of SM3 was less than 1% of the amount of SM4s. The fatty acids of SM4s of healthy serum (n = 8) were predominantly C16:0 and a hydroxylation C16:0 (C16:0h), followed by very long chain fatty acids (VLCFAs) predominant species, and SM3 was a major component of VLCFAs.
Conclusion
This present study described a simple method of human serum sulfatide analysis using MALDI-TOF MS. This method is suitable for clinical laboratories and is likely to increase the understanding of the roles of sulfatide species in both physiological and disease states.
Keywords
Introduction
A sulfatide is a glycosphingolipid containing a sulphate ester on a sugar chain. Galactosyl sulfatide (SM4s) and lactosyl sulfatide (SM3) have galactose and lactose as sugars, respectively. 1 Sulfatides are found in a range of human tissues, plasma lipoproteins and peripheral blood cell membranes. SM4s is mainly found in the brain, nervous system, kidney and gastrointestinal tract and is associated with renal function, Langerhans islet function, nervous system and immune system, thrombosis and virus infection.2,3 In humans, SM3 is restricted to the kidney and liver tissues,4,5 and functions for cell adhesion. 6 Sulfatide in serum lipoprotein is mainly synthesized in the liver and then secreted into the circulation. 7 Sulfatide concentrations in serum have been reported to correlate with arteriosclerosis, terminal renal insufficiency and type-2 diabetes mellitus.8–11 Sulfatide concentrations in serum may be a marker of abnormal organ metabolism and tissue disorders.
Sulfatide species vary in terms of their sphingoid base and fatty acid composition, and species distribution in the body is tissue specific. SM4s containing a C22: 0 fatty acid, SM4s (d18: 1 C22: 0), is abundant in the human kidney, 12 whereas SM4s (d18: 1 C24: 0) is mostly found in the human brain. 13 Concentrations of SM4s (d18: 1 C22: 0 and C24: 0) are higher in human serous papillary ovarian carcinoma tissues than normal ovarian stromal tissue. 14 In rats, SM4s (t18: 0 C24: 0h) containing hydroxyl fatty acids was found in the stomach, while that containing phytosphingosine was found in the colon. 15 Although sulfatide species differ in terms of fatty acid and sphingoid base, the functional significance of these differences remains unclear.
A number of sulfatide analysis methods have been reported, including liquid chromatography mass spectrometry (LC-MS). Although LC-MS analysis obviates the need for sample pre-processing, it requires a customized analysis system and is a complicated procedure. In contrast, matrix-assisted laser desorption/ionization time-of-flight mass spectrometry (MALDI-TOF MS) has the advantage of a simple and rapid protocol for lipid analyses. MALDI-TOF MS can be applied to clinical assessments.
The present study was performed to develop a simple and sensitive method for identifying sulfatide species in human serum using MALDI-TOF MS. The procedure involved lipid hydrolase treatment, partial purification by hydrophobicity chromatography and two stages of MALDI-TOF MS.
Materials and methods
Materials
Healthy volunteers were recruited from the medical department of our university. The subjects gave informed consent for participation. The subjects (n = 8) were 20.4 ± 0.5-year-old women. Body mass index (BMI) of subjects was 20.3 ± 1.7 (mean ± standard deviation; SD).
Blood was collected from healthy volunteers after overnight fast and allowed to clot at room temperature. Samples were then centrifuged at 1000 g for 10 min and serum was collected and stored at –30°C until analysis. The study protocol was approved by the Ethical Review Board of Shinshu University School of Medicine, and included volunteer anonymity.
Serum lipids and glucose concentrations were measured enzymatically using commercial reagent kits (Sekisui Med, Co., Ltd, Tokyo, Japan and Mizuho Medy Co., Ltd, Saga, Japan) by a biochemistry autoanalyzer (JCA-BM6070; JEOL Ltd, Tokyo, Japan). Concentrations of high-density lipoprotein-cholesterol (HDL-C) and low-density lipoprotein-cholesterol (LDL-C) were measured using direct (or homogeneous) method. Triglyceride was measured using glycerol removal method. Glucose was measured using hexokinase method. Total cholesterol, HDL-C, LDL-C, triglyceride and glucose (mean ± SD) were 181.5 ± 20.6, 70.8 ± 11.9, 89.0 ± 14.9, 55.0 ± 29.7 and 86.4 ± 7.2 (mg/dL), respectively.
Chemical reagents
Chloroform and methanol (HPLC grade), phospholipase A2 (PLA2) (Type I from Crotalus adamanteus; 510 U/mg), calcium chloride (CaCl2) and hydrochloric acid (HCl) were purchased from Wako Pure Chemical Co. (Osaka, Japan). Tris-base and 9-aminoacridine (9-AA) were purchased from Sigma-Aldrich Co. (St. Louis, MO). Phenyl-Sepharose gel was purchased from Pharmacia Fine Chemicals (Uppsala, Sweden). The internal standard material (IS) (SM4s [d18: 1 C12: 0]) was purchased from Avanti (Alabaster, AL).
PLA2 treatment of serum
To 500 μL of serum was added 250 μL of Tris-HCl buffer (45 mM, pH 8.0, containing 10 mM CaCl2) and 10 μL PLA2 (0.56 U/mL). The mixture was then sealed under N2 gas and incubated for 20 h at 37°C.
Extraction of lipids
Following PLA2 treatment, 5 mL of chloroform/methanol solution (C/M, 2:1 v/v) was added to the sample solution (760 μL), and the mixture was shaken vigorously for 1 min. Distilled water (1.0 mL) was then added, the suspension was centrifuged at 855 g for 10 min, and the lower phase was collected and placed in a glass tube. The lower phase was dried by centrifugation under vacuum, after which the lipid residue was dissolved in 950 μL of C/M (9:1 v/v) and sonicated for 1 min.
Preparation of a sulfatide-rich fraction
Lipid samples were added to a Phenyl-Sepharose gel (bed capacity: φ5 × 10 mm) equilibrated with C/M (9:1 v/v), and the unbound fraction was eluted using three column volumes of C/M (9:1 v/v). The sulfatide-rich fraction was eluted in two stages, the first using C/M (85:15 v/v) and the second using 100% methanol (five column volumes for each stage). The two eluted sulfatide-rich fractions were combined and dried by centrifugation under vacuum. That lipid was then dissolved in 10 μL of matrix solution (10 mg 9-AA in 1 mL of isopropanol/acetonitrile, 3:2 v/v).
Mass spectrometry
Mass spectrometric measurements were performed using a MALDI-TOF mass spectrometer (ABSCIEX TOF/TOF TM5800 system) in reflector mode. The lipid sample (0.2 μL) was applied to the metal sample plate, which was then inserted into the MALDI-TOF MS analyzer. The following parameters were used for analysis: negative ion mode, 1600 shots/spectrum and 3800–4600 absorption laser intensity. In addition, measurements were made in the MS/MS mode at 5600 absorption laser intensity.
Sulfatide species in serum
The IS material (1 μg/mL, 50 μL) was added to serum obtained from healthy volunteers (n = 8) after overnight fast, and the samples were pretreated with PLA2 as described above. After delipidation of each serum sample, sulfatide-rich fractions were partially purified by Phenyl-Sepharose gel chromatography, and then sulfatide species were measured by MALDI-TOF MS. The SM4s species were measured quantitatively with the IS material, and then the peak ratios of SM4s and SM3 were calculated independently.
Results
Mass spectrum of partial purified sulfatide
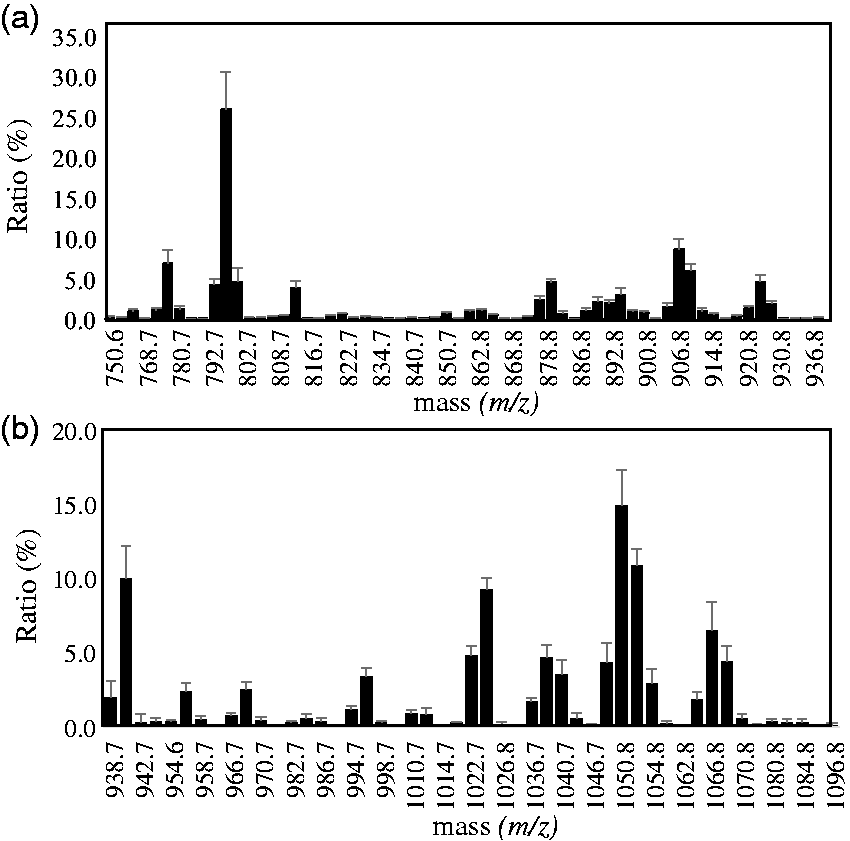
To increase of the measurement sensitivity of mass spectrometry, sulfatide species in serum were partially purified by hydrophobic interaction chromatography and Phenyl-Sepharose gel chromatography. The sulfatide-rich fraction prepared from serum lipid (serum: 500 μL) by Phenyl-Sepharose gel chromatography was measured in the region of m/z 710–1100 by MALDI-TOF MS in negative ion mode. We detected major peaks at m/z 750.6–936.8, and very small peaks were detected at m/z 938.7–1098.8 (Figure 1). The IS peak was observed at m/z 722.5. Subsequently, we divided the measurement region into m/z 750–937 and m/z 930–1100 and re-analysed the peaks (Figure 2(a) and (b)). The results indicated 64 ion peaks in the m/z 750–937 region, with another 49 peaks in the m/z 930–1100 region (Tables 1 and 2).
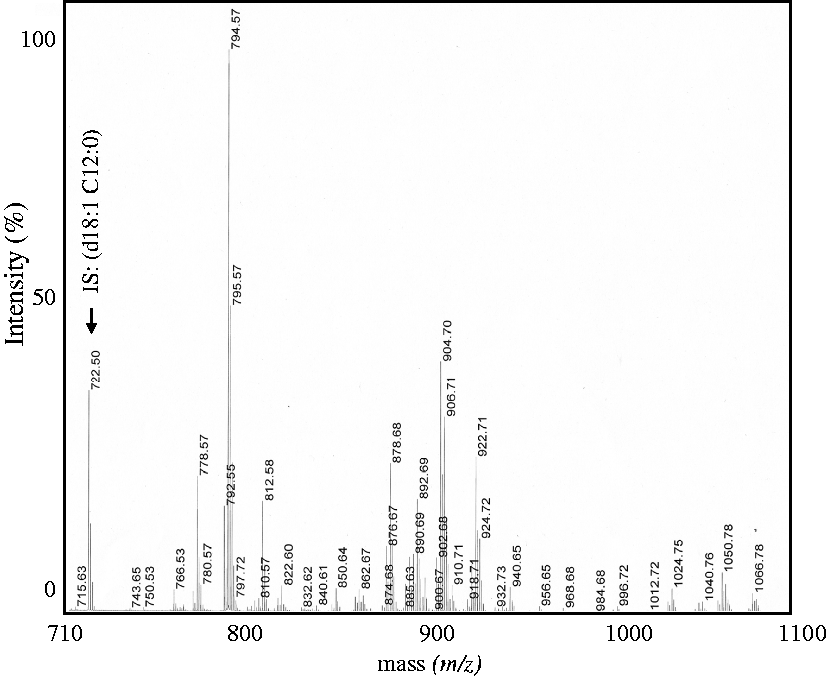
Mass spectrum analysis of sulfatides in human serum.
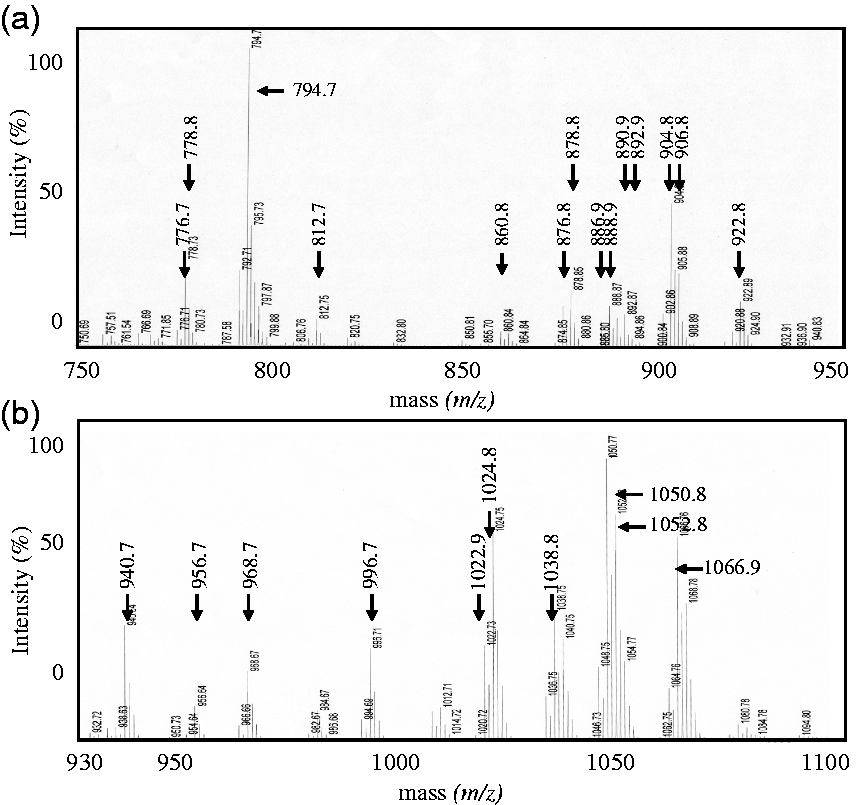
Mass spectrum at extended measurement range. (a) Peaks observed in the range m/z 750–937. (b) Peaks observed in the range m/z 930–1100.
Identification of galactosyl sulfatide species in human serum.
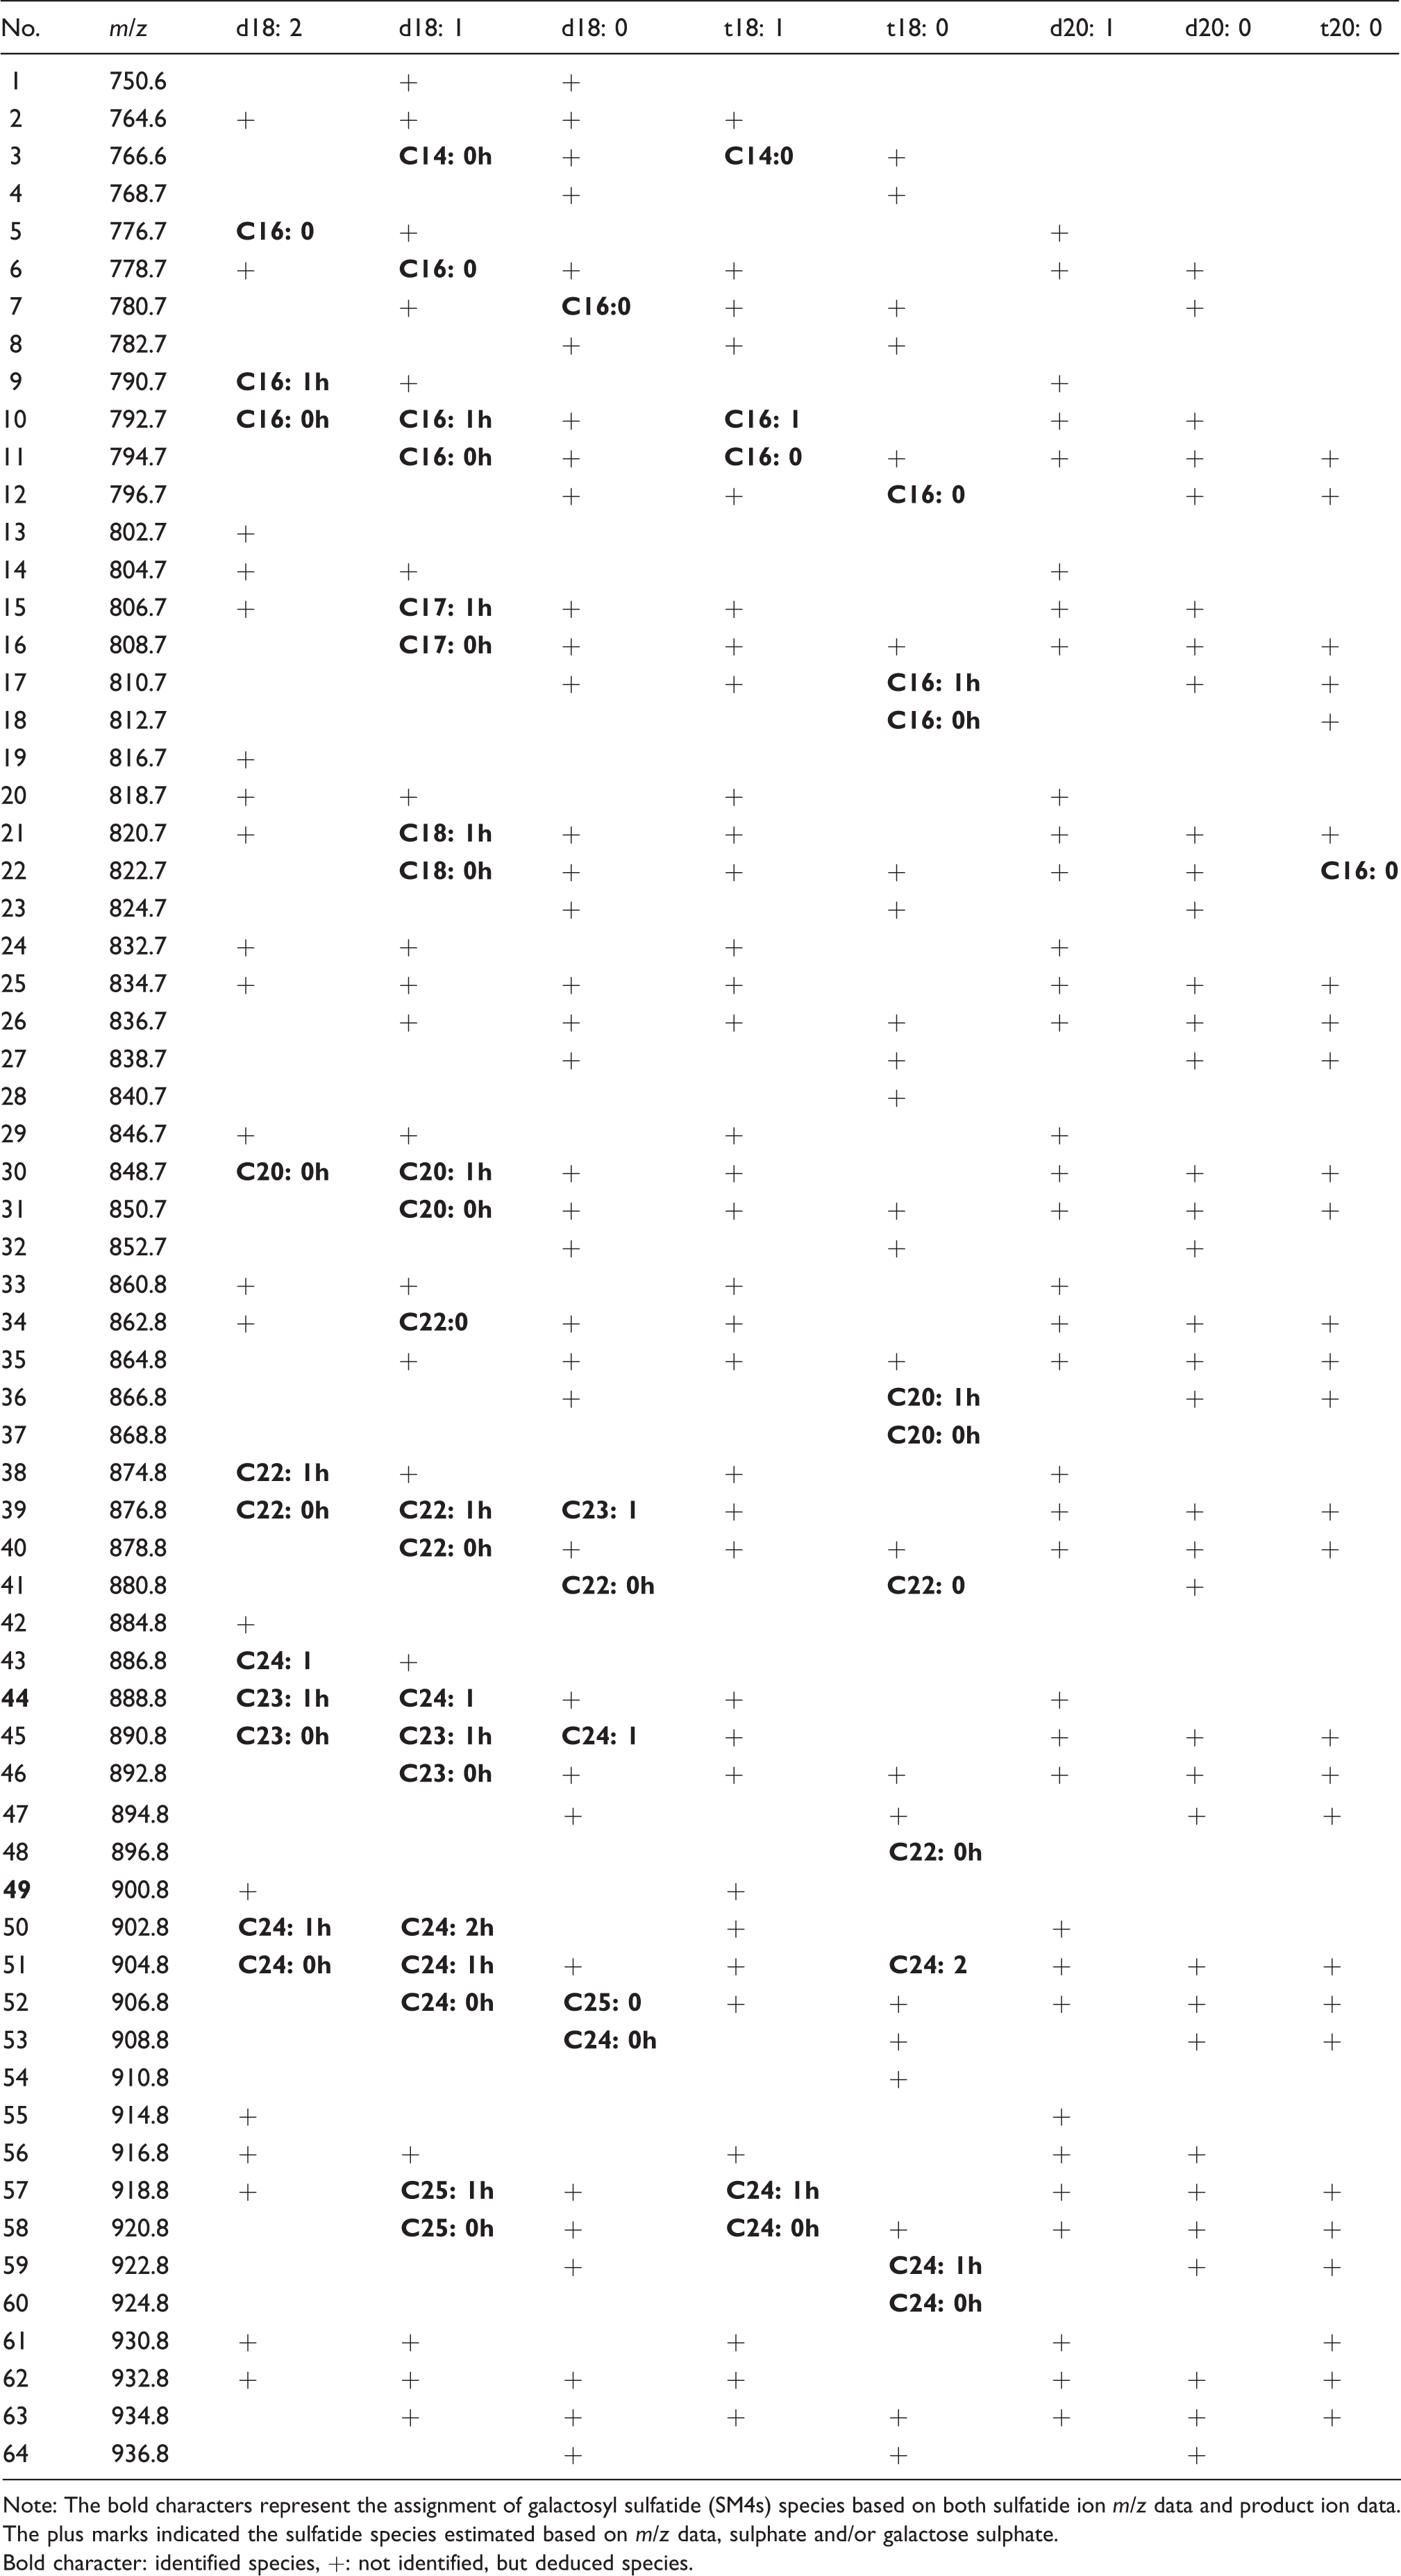
Note: The bold characters represent the assignment of galactosyl sulfatide (SM4s) species based on both sulfatide ion m/z data and product ion data. The plus marks indicated the sulfatide species estimated based on m/z data, sulphate and/or galactose sulphate.
Bold character: identified species, +: not identified, but deduced species.
Identification of lactosyl sulfatide species in human serum.
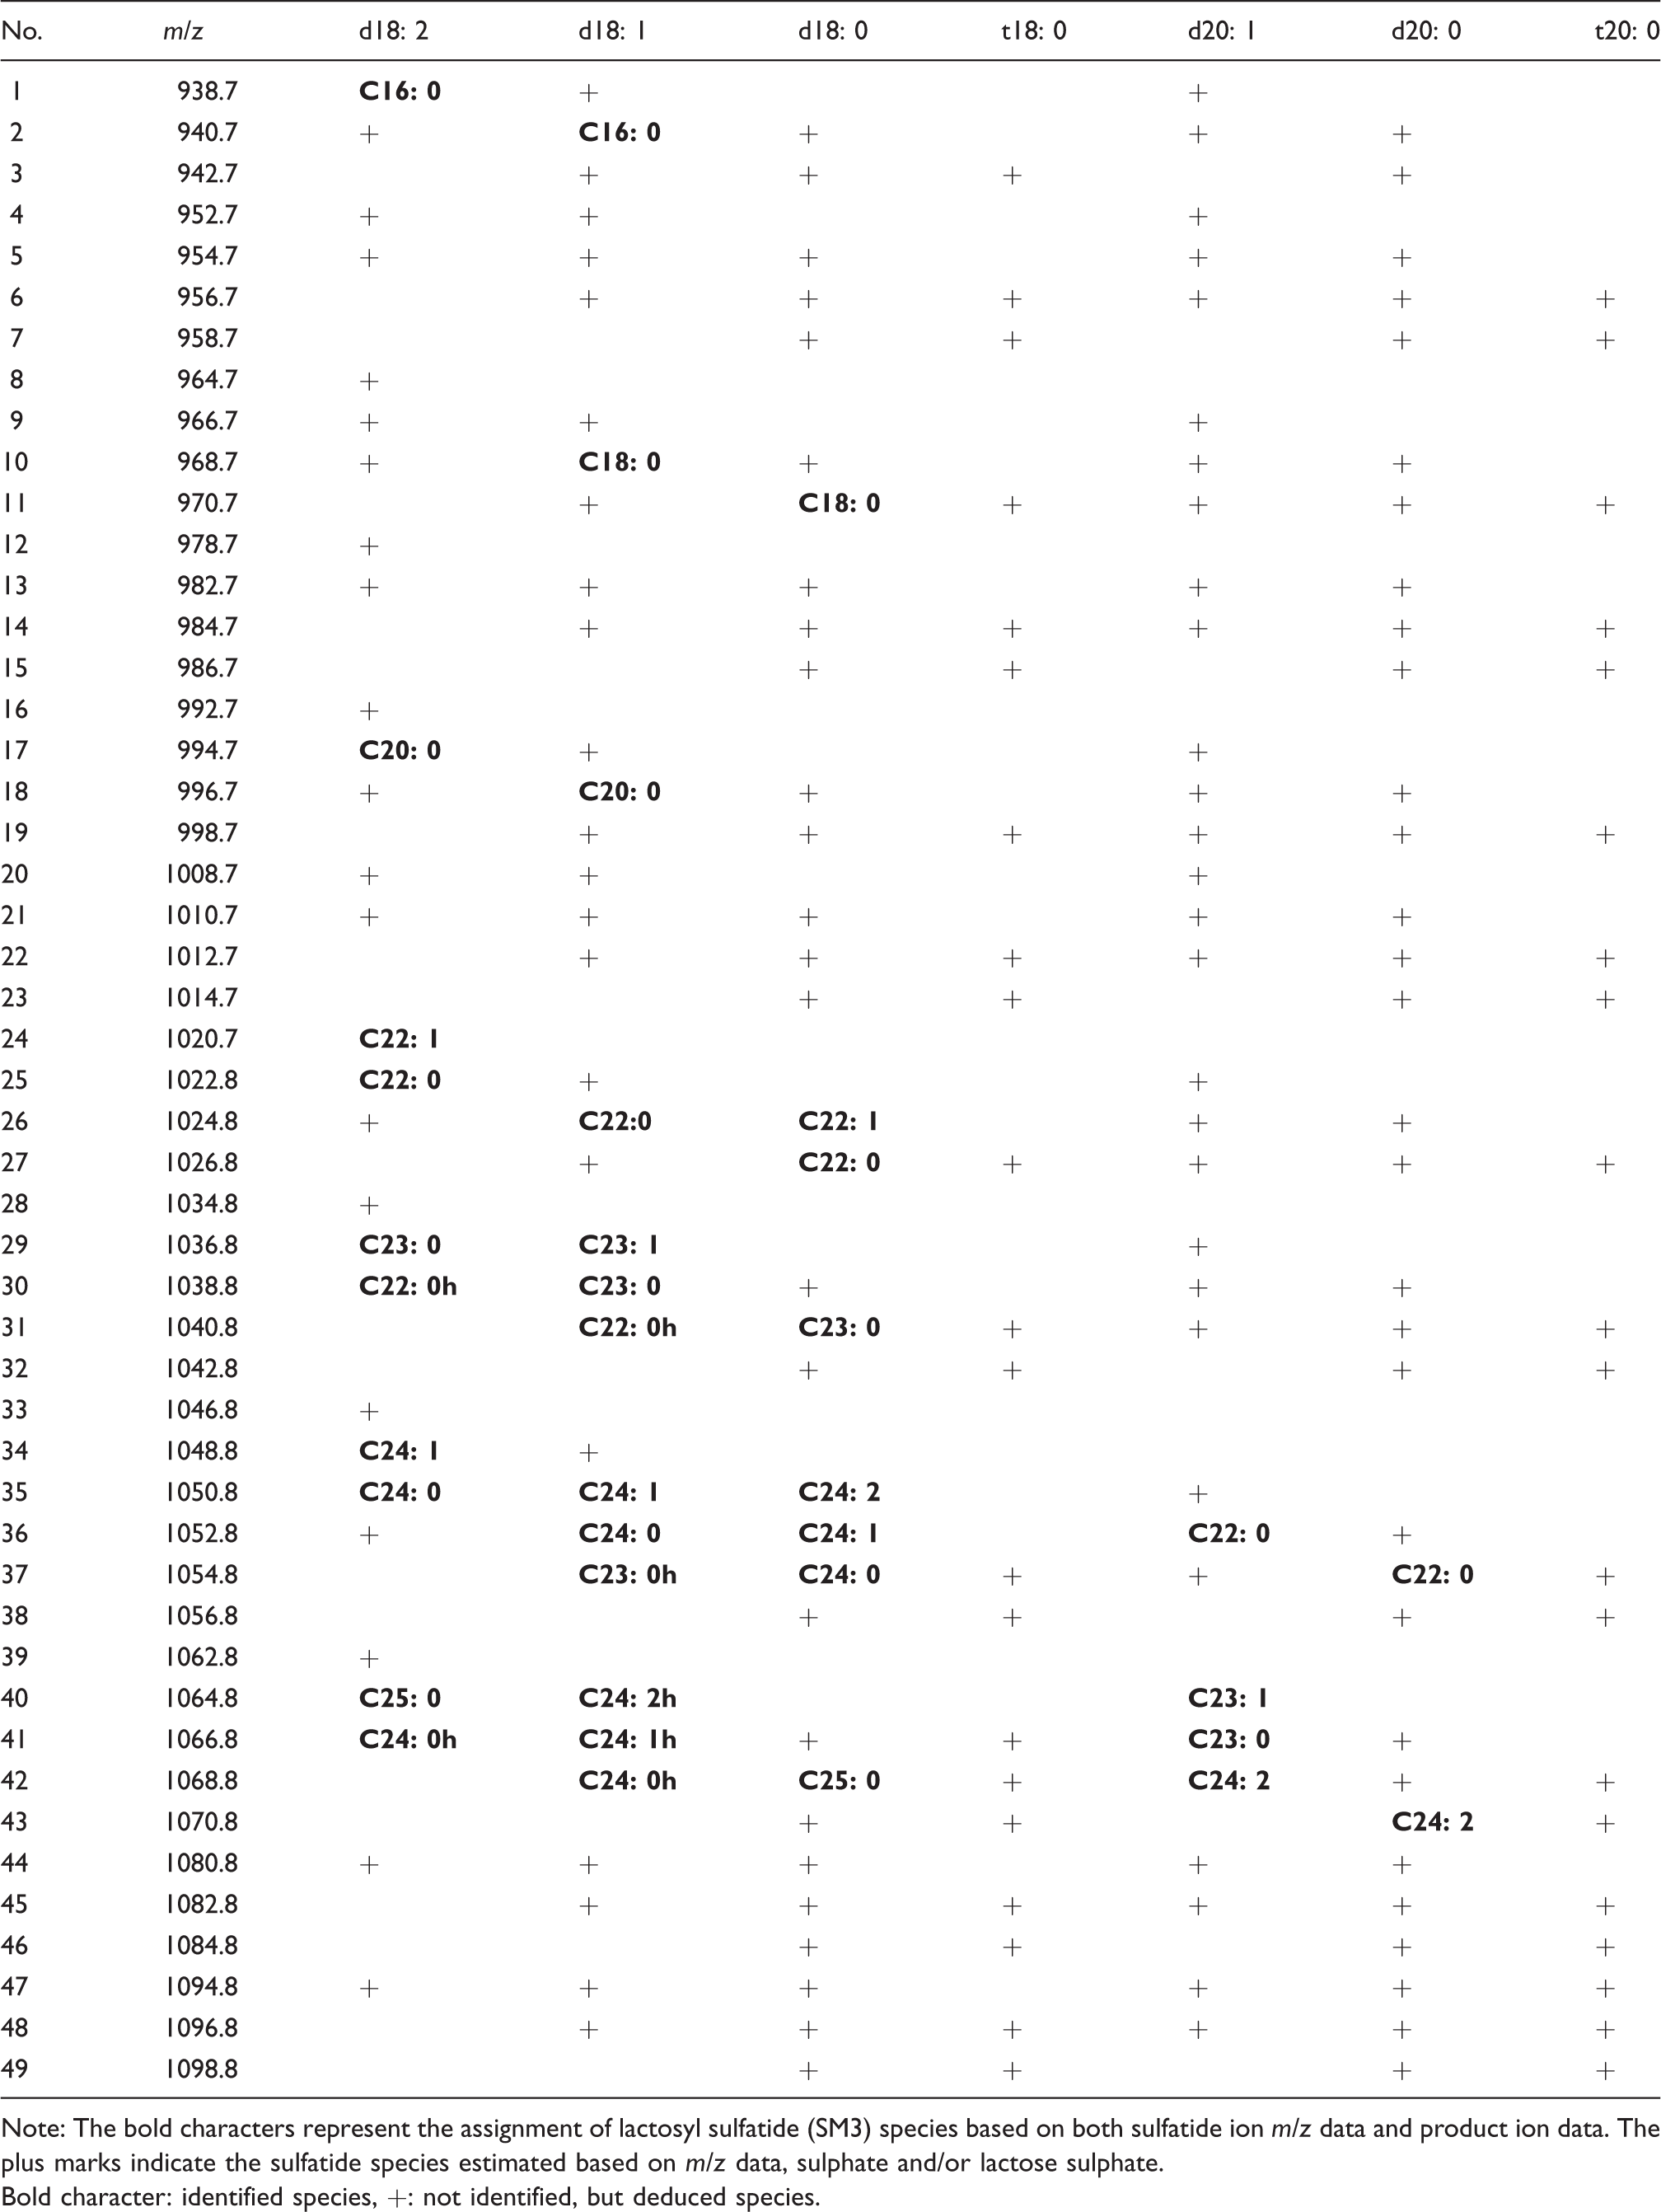
Note: The bold characters represent the assignment of lactosyl sulfatide (SM3) species based on both sulfatide ion m/z data and product ion data. The plus marks indicate the sulfatide species estimated based on m/z data, sulphate and/or lactose sulphate.
Bold character: identified species, +: not identified, but deduced species.
Product ion analysis of sulfatide
Product ion analysis was performed to obtain information regarding the types of sugar sulphate and sphingoid base (including phytosphingoid base), and fatty acids present in the various sulfatide species by MALDI-TOF/TOF MS (MS/MS). The m/z 794.7 peak in Figure 2(a) shows peaks at m/z 97.0, 119.1, 241.1 and 259.1 on product ion analysis (Figure 3). The peaks at m/z 97.0 were product ions comprising sulfatides with the ions HSO4–. The peak at m/z 119.1 was NaSO4- ion. The peaks at m/z 241.1 and 259.1 were product ions consisting of the dehydrated galactose sulphate anion and the hydrated galactose sulphate anion, respectively. Based on these findings, we assigned the ion peak at m/z 794.7 as SM4s. Further analysis indicated the peaks in m/z 750–937 region and m/z 930–1100 region to represent different species of SM4s and SM3, respectively, according to whether the sugar sulphate ion was a monosaccharide or disaccharide. In a similar way, 113 peaks were estimated to be sulfatide with detection of sulphate and sugar sulphate ions.
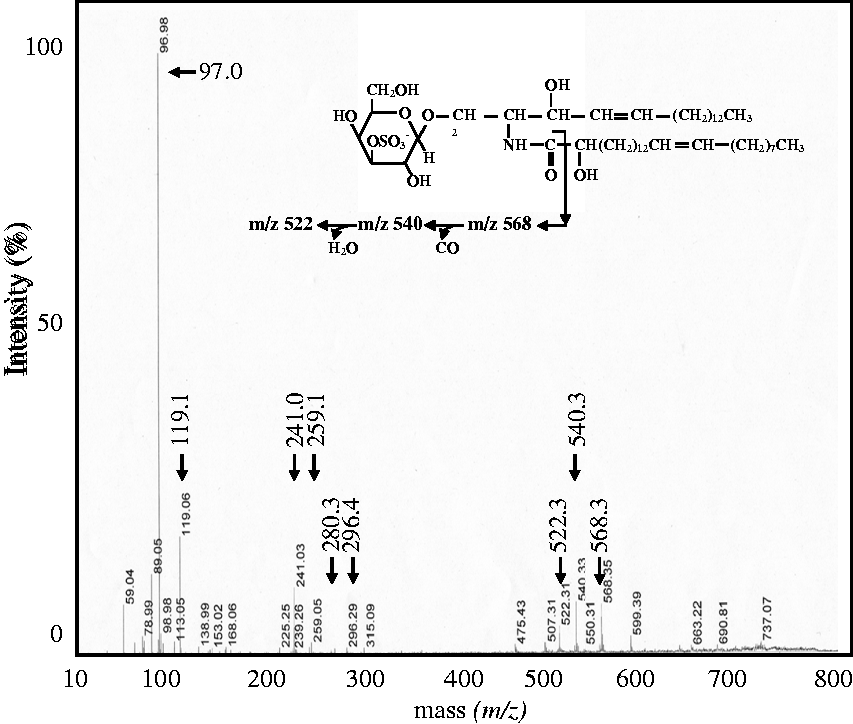
Product ion analysis of sulfatides. The peak at m/z 794.7 of the maximal ion strength peak of sulfatides in serum was chosen to undergo product ion analysis. The peaks at m/z 97.0 and 119.1 represented HSO4– and NaSO4–, and the peaks at m/z 241.1 and 259.1 corresponded to the dehydrated and hydrated galactose-sulphate moieties, respectively. The peaks at m/z 280.3 and 296.3 represented product ions of non-hydroxy fatty acid (C16: 0) and hydroxy fatty acids (C16: 0h), respectively. The peaks at m/z 522.3, 540.3 and 568.3 were fragment ions of sphingosine (d18: 1) containing hydroxyl fatty acid and its degradation products. The molecular degradation process is shown in the insert. The peak at m/z 794.7 was identified as SM4s from the mass spectrum and product ion composition.
Product ion analysis of the m/z 794.7 peak revealed peaks at m/z 280.3 and 296.4 other than the ion mentioned above (Figure 3), and these corresponded to ion peaks of fatty acids (C16: 0) and (C16: 0h), respectively. In addition, other peaks were observed at m/z 522.3, 540.3 and 568.3 (Figure 3). This set of peaks corresponded to sulfatide species containing types of sphingosine (d18: 1). The peaks at m/z 522.3, 540.3 and 568.3 were fragment ions of sphingosine (d18: 1) containing hydroxyl fatty acid and its degradation products. The molecular degradation process is shown in the insert of Figure 3.
Assignment of sulfatide species
Table 1 shows the SM4s species assigned to the various m/z peaks and Table 2 shows the SM3 species assigned to the various m/z peaks. The assignments were mainly made based on the m/z, sulphate, sphingoid base and fatty acid data. In the tables, bold characters represent sulfatide species assigned based on both m/z and product ions, sphingoid base and sulphate data. The plus symbol marks indicate the sulfatide species estimated based on m/z data and sulphate data. The ratio shows the average of composition ratios of SM4s and SM3 species, respectively.
Sulfatide species in human serum
Reproducibility in a well of the sample plate and linearity of measurement of the main 15 molecular species of sulfatide in serum were acceptable. 16 The precision check was used pool serum from healthy volunteers. The between-day assay was examined for four days with dual measurements. The reproducibility of the eight major molecular species (ionic strength ratio of 3.5 to 17.7% and 5.5 to 12.7%, respectively) of SM4s and SM3 were CV 3.5 to 17.7% and CV 4.9 to 14.1%, respectively, We constructed sulfatide species in serum based on our assignments from healthy young volunteers (n = 8) (Figure 4). The SM4s species were bound to C16 fatty acid most dominantly, and secondarily long chain fatty acid of C24 and then C22. The SM4s species with C16 fatty acids (d18: 1 C16: 0h), (d18: 1 C16: 0), (d18: 1 C16: 1h), (t18: 0 C16: 0) and (t18: 0 C16: 0h), accounted for approximately 25.9%, 6.9%, 4.2%, 4.6% and 3.9% (average) of the total SM4s, respectively, and then (d18: 1 C24: 1h), (d18: 1 C24: 0h), (d18: 1 C24: 1), and (d18: 1 C22: 0h) accounted for approximately 8.6%, 6.0%, 2.2%, and 4.6%, respectively.
Galactosyl sulfatide and lactosyl sulfatide species of healthy human serum. (a) Galactosyl sulfatide (SM4s). (b) lactosyl sulfatide (SM3).
In contrast, SM3 including the very long chain fatty acids (VLCFAs), C24 and C22 were more dominant than C16 fatty acids. The SM3 species at m/z 1050.8 and 1052.8 accounted for approximately 14.9% and 10.9% (average) of the total SM3, respectively and were assigned as (d18:2 C24:0, d18: 1 C24: 1 and d18: 0 C24: 2) and (d18: 2 C24: 0, d18: 0 C24: 1, d20: 1 C22: 0), respectively. That of (d18: 1 C16: 0) at m/z 940.7 accounted for 10.0%. The fatty acids of SM4s were predominantly C16: 0 and hydroxyl C16: 0h, and SM3 was the major component of VLCFAs.
Discussion
We have demonstrated the presence of a wide variety of sulfatide species of 64 SM4s and 49 SM3 in serum by negative ion mode analysis using MALDI-TOF MS. SM4s was the major sulfatide, SM3 was present in trace amounts (approximately 1% of sulfatides in serum) and the fatty acid profile of both was different.
One previous report described the use of MALDI-TOF MS to analyse sulfatides in serum; 17 the authors analysed the sulfatides in serum as lysosulfatides produced by alkali treatment with saponification, since the sulfatide peaks on negative ion mode were obscured by glycerophospholipid peaks and the matrix reagent, 2,5-dihydroxybenzoic acid (2,5-DHB). This approach allowed identification of the sulfatide sphingoid bases but not the various fatty acid molecular species. We were able to measure sulfatide species by partial purification of serum followed by negative ion mode analysis with 9-AA matrix using MALDI-TOF MS. MALDI-TOF MS methods for molecular analysis are relatively easy, and the separation performance sensitivity of ion peaks is very high.
After the collection of serum, the procedure began with hydrolysis of glycerophospholipids with PLA2 in order to avoid overlap of glycerophospholipid peaks. Furthermore, to increase the measurement sensitivity of mass spectrometry, sulfatides were partially purified by Phenyl-Sepharose gel chromatography. Using this procedure, we were able to identify sulfatide species that differed based on sphingoid bases (d18: 0, d18: 1, d18: 2, t18: 0, t18: 1, d20: 0, d20: 1 and t20: 0), sugars (galactose or lactose) and various fatty acids, differing in carbon chain length, hydroxyl base addition and fatty acid saturation. In product ion analysis, the HSO4– ions, the NaSO4– ions, dehydrated galactose sulphate anion and galactose sulphate anion detected at m/z 97.0, 119.1, 241.1 and 259.1, respectively, were ionic species corresponding to universal ion peaks for sulfatide molecular species, and these have been identified as SM4s. The ion peaks detected at m/z 403.1 and 421.1 corresponded to the dehydrated lactose sulphate anion and the lactose sulphate anion, respectively, and these mass spectrum peaks were identified as SM3. In addition, we showed that the sphingoid base ions in the sulfatide species with a 2-hydroxy-fatty acid were detected at m/z 522.3, 540.3 and 568.3, but no fragment ions were detected in the sulfatide species without hydroxy fatty acid. The fragment ion at m/z 568.3 represented the 2-hydroxy fatty acid dissociated from the sulfatide, and subsequently, the dissociation of the ketone base resulted in the m/z 540.3 fragment ion, and finally dehydration produced the m/z 522.3 fragment ion, 18 as shown in the insert of Figure 3. The main sulfatide sphingoid bases were sphingosine (d18: 1), and small quantities of sphingoid bases (d18: 2), (d18: 0), (d20: 1), and (d20: 0) were detected or assigned. In addition, phytosphingoid bases (t18: 1), (t18: 0) and (t20: 0) were detected using MS/MS analysis.
The major sulfatide in serum, SM4s, is present in the body as a result of biosynthesis in the liver and dietary absorption across the small intestine and accounts for the major lipoprotein glycosphingolipid. SM4s in serum is present at a concentration of 0.64 nmol/mL in serum, and serum concentrations are reported to be reduced in renal insufficiency patients 19 and elevated in arteriosclerosis. 20 In the present study, SM4s in serum was found to have a high proportion of saturated and monounsaturated fatty acids from C16 to C24, of which about half had a hydroxyl fatty acid, but not including polyunsaturated fatty acids. Kyougashima et al. reported that the ratios of SM4s species differed in rat spinal cord, lung, colon and stomach. 15 Similarly, Cheng et al. found different SM4s species ratios in mouse plasma, liver, muscle, kidney cortex, kidney medulla, cortex, spinal cord and sciatic nerve, and detected SM4s (d18: 1 C22: 2h) in mouse plasma and kidney, but not in other samples. 21 In relapsing-remitting multiple sclerosis, concentrations of SM4s C18: 0 and C24: 1 in plasma correlated with disease status. 22 The present study identified SM4s (d18: 1 C16: 0h) and SM4s (d18: 1 C24: 1h) species, neither of which has been reported as present in mouse plasma. Other groups reported that serum SM3 concentrations were approximately 2% of SM4s based on immunochemical techniques, 11 but the composition and functional details remained unknown. We showed that SM3 in serum was less than 1% of SM4s as calculated from ion peak ratios, and the fatty acid composition ratio was not similar between the two species. The analysis of the variation in sulfatide species in serum may contribute to different cell functions of various diseases.
It has been reported that hydroxylation at the C2 position of the fatty acid in glycosphingolipid is important for maintenance of the myelin sheath in the mammalian nervous system, and is also highly developed in the digestive organs and kidney and skin cells.23,24 The variation of sulfatide species in serum including hydroxy fatty acid may be useful to understand the sulfatide metabolism in diseases of the above organs. It has also been reported that phytosphingoid bases are derived from yeasts, plants and mammalian tissues in vivo, and used as a biosynthetic material of the odd number fatty acids through 2-hydroxy palmitic acid. 25 Further, the detection of differences in sphingoid bases of serum may become a useful marker of cellular metabolism, because phytosphingoid bases species were thought to influence the cell membrane thickness and molecular spatial structure and hydrophilicity. 26 Recently, it was reported that sphingolipids with specific fatty acid compositions and frameworks function as ligands to receptors. 27 Our screening of numerous species of sulfatides in serum may help to determine the sulfatide species present and their associations with sulfatide metabolic disorders.
Hara and Taketomi have shown that concentrations of sulfatide in the serum of WHHL rabbit (121 nmol/mL), an animal model for human familial hypercholesterolemia, are much higher than in normal rabbit serum (3 nmol/mL). 7 Sulfatides in human serum are present on all lipoprotein fractions. Mizoue has reported that when LDL is incubated with a high concentration of sulfatide, the sulfatide concentration of LDL increases. 28 Sulfatide in serum is suggested to be associated with cholesterol metabolism, but little has been reported on the relationship between cholesterol and sulfatide species. Thus, the analysis of sulfatide species in serum will be helpful to elucidate cholesterol metabolism.
This present study identified various sulfatide species in healthy volunteer serum and revealed differences between SM4s and SM3. The use of this method permits enhanced understanding of the role of sulfatide species in both physiological and disease states.
Supplemental Material
Supplemental material for Characterization of galactosyl and lactosyl sulfatide species in human serum by MALDI-TOF mass spectrometry
Supplemental Material for Characterization of galactosyl and lactosyl sulfatide species in human serum by MALDI-TOF mass spectrometry by Atsushi Hori, Makoto Yamaura, Sunao Morita, Takeshi Uehara, Takayuki Honda and Hiroya Hidaka in Annals of Clinical Biochemistry
Footnotes
Acknowledgments
Declaration of conflicting interests
The author(s) declared no potential conflicts of interest with respect to the research, authorship, and/or publication of this article.
Funding
The author(s) disclosed receipt of the following financial support for the research, authorship, and/or publication of this article: This work was supported by JSPS KAKENHI Grant Numbers JP26460647 and 17K08980.
Ethical approval
The ethics committee at Shinshu University (Number of committee 3080) approved this study.
Guarantor
HH.
Contributorship
AH wrote the article and acquired and analysed the data; MY, SM and TU contributed to the design of this study; TH and HH supervised the study process.
References
Supplementary Material
Please find the following supplemental material available below.
For Open Access articles published under a Creative Commons License, all supplemental material carries the same license as the article it is associated with.
For non-Open Access articles published, all supplemental material carries a non-exclusive license, and permission requests for re-use of supplemental material or any part of supplemental material shall be sent directly to the copyright owner as specified in the copyright notice associated with the article.