
Abstract
Background
Thyroglobulin (Tg) assay in washout fluids of fine needles, after cervical lymph nodes aspiration, is used for detecting metastases from differentiated thyroid carcinomas. Assay methods are the same as for Tg in serum. However, with non-serum samples, methods require extensive validation to notably check for the absence of matrix effect. This study fits this context. Our objectives were to assess analytic performances, in washout fluid, of eight different Tg assay methods and to compare them to validated data in serum.
Methods
Eleven medical laboratories participated in this study. The matrix tested was phosphate-buffer saline containing 1% bovine serum albumin (PBS-1% BSA). Samples used were dilutions, in this buffer, of Certified Reference Material (CRM 457). We verified, for all methods, the limit of detection, precision, linearity, trueness and accuracy.
Results
In PBS-1% BSA, the functional sensitivities (FS) were comparable to those expected for serum. All the methods were linear. The relative biases of trueness were between –24.5 and 10.2% around 1 µg/L. Total analytical error was ≤40% near the functional sensitivity values.
Conclusion
No quantitatively important matrix effect was observed. All the methods showed their ability to measure Tg in PBS-1% BSA, over the concentration range of interest, with acceptable total analytical error. We validated the functional sensitivity value as a decision threshold in thyroidectomized patients after treatment and with low concentrations of serum Tg.
Introduction
The diagnosis of cervical lymph node metastasis in differentiated thyroid carcinoma is often complex because of frequent inflammatory lymphadenopathies in this region. Indications for carrying out fine-needle aspiration (FNA) biopsy and thyroglobulin (Tg) measurement in FNA washout fluids (FNA-Tg) have been published.1–4 FNA-Tg measurement was first introduced in 1992 by Pacini et al. 5 to improve the sensitivity of sometimes inconclusive cytology. The usefulness of FNA-Tg measurement has now been extensively documented and acknowledged. Yet, despite the very good diagnostic performances,6–8 several authors have reported that FNA-Tg can be undetectable in poorly differentiated thyroid carcinomas. 9 , 10 Therefore, the good practice guidelines recommend that FNA-Tg measurement be used in combination with FNA-cytology.1–3 To generate FNA washout fluid, a small volume of physiological saline solution, Tg-free serum or buffer is used to wash the needle used for biopsy. Pacini et al., who first proposed measuring FNA-Tg, used Tg-free serum. 5 Since then, physiological serum has often been chosen for practical reasons. Currently, there is neither American nor European consensus on the choice of washout fluid. In France, an assay buffer (kit component, assay-specific) is recommended to limit the matrix effect. 1 , 11 When an assay buffer is not used, the matrix effect should be evaluated. A diluent volume of 1 mL and expressing results in ng/FNA rather than ng/mL (or µg/L) are also recommended. 1
Numerous immunoassays have been approved for serum Tg but none for FNA-Tg. The aim of the present multicentre study was to evaluate the analytic performances of eight methods of FNA-Tg measurement and determine their ability to provide results with sufficient precision and trueness. As assay buffers are not commercially available for every method, the non-serum matrix tested was phosphate-buffer saline (PBS) containing bovine serum albumin (BSA).
Materials and methods
Immunoassays and analysers
Eight methods (immunoassay + analyser if automated method) were evaluated by 11 medical laboratories (named from A to K). Two were first-generation methods, and the others were second generation (Table 1). We used commercial methods distributed by the following six manufacturers: Beckman Coulter (Villepinte, France), CIS Bio International, a member of the Curium group (Saclay, France), Diasorin (Antony, France), Roche Diagnostics (Meylan, France), Siemens Healthineers (Siemens Healthcare, Saint-Denis, France) and Thermo Scientific (Asnières sur Seine, France). All methods were calibrated against Certified Reference Material 457 (CRM 457). Samples were measured according to the manufacturers’ instructions for serum.
Limit of detection (LoD), functional sensitivity (FS) and Tg value for total error 40% (TE 40%) in µg/L for each method.
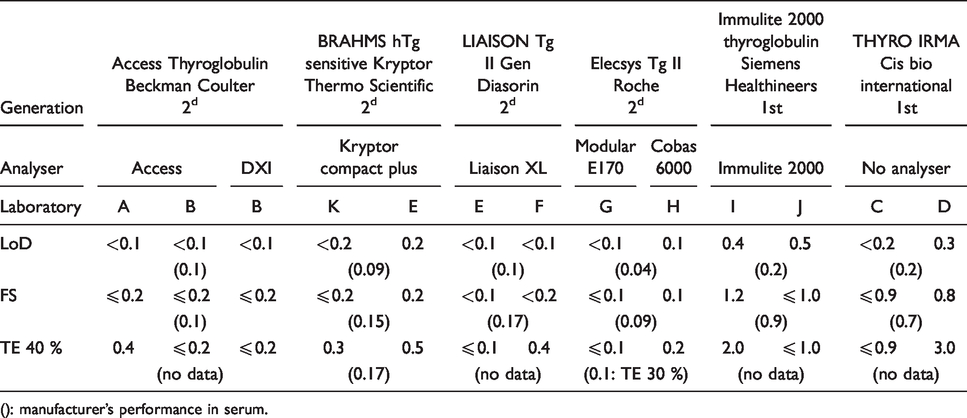
(): manufacturer’s performance in serum.
Sample preparation
Samples were prepared with CRM 457. This reference material, certified by the Community Bureau of Reference in Belgium, is commercialized in lyophilized form by Sigma-Aldrich (Saint-Quentin-Fallavier, France). It was reconstituted following the instructions for use supplied with the reagent. Concentration of the CRM solution was 324 ± 18 mg/L. Serial dilutions of this concentrated solution were made in order to obtain a stock solution with an expected concentration of 100 µg/L. Dilutions were carried out in PBS containing 1% BSA. PBS-1% BSA was obtained from 10X PBS-10% BSA (Sigma-Aldrich). In order to verify the final CRM concentration, dilutions of iodine 125 were carried out in the same way. Iodine 125 was measured four times with a gamma counter before and after dilutions, and recovery percentages were calculated. Using the iodine mean recovery (R), the stock solution concentration of CRM (C) was estimated (C = R × 100 µg/L).
The stock solution was sent to all sites. Ten working solutions were prepared from this stock solution in each laboratory by serial dilutions (from 1:1 to 1:800) in PBS-1% BSA. The working solutions were divided into working samples that were stored at –20°C until assayed.
Repeatability, intermediate precision and functional sensitivity
Repeatability (within-run precision) and intermediate precision (between-run precision) were evaluated up to approximately 10 µg/L by carrying out six replicate measurements of working samples on five different days, under varied conditions. With one exception (the Liaison Tg II Gen Diasorin method), at least two lots of reagents and at least two calibrations were used during the testing period. For the evaluation of the Diasorin method, only one lot of reagent was used, but three analyser calibrations were carried out.
Precision was expressed in terms of coefficients of variation (CVs). Functional sensitivity (FS) was defined from the imprecision profile (graphic representation of the intermediate precision CVs over the range of sample concentrations) as the lowest concentration with a CV ≤ 20%.
The repeatability and intermediate precision variances were evaluated, at several levels of concentration, by one-way analysis of variance (ANOVA), as already described. 12 ANOVA requires that the variances of the five runs be equal. In this study, the homogeneity of variance was assessed using Levene's test. To meet the homogeneity of variance assumption, the P-value for this test should be > 0.05. From the ANOVA, the between-day mean square and within-day mean square were obtained. Within-day variance, which is repeatability variance, was estimated by the within-day mean square. Between-day and intermediate precision variances were calculated.
Between-day variance (Sb 2 ) was: Sb 2 = (between-day mean square–within-day mean square)/number of replicates per days.
Intermediate precision variance was the sum of between-day variance and within-day variance.
Linearity
Linearity was evaluated by measuring all working samples from three to six times in one run. The six less concentrated samples were measured six times. Blank (PBS-1% BSA) was analysed in 30 replicates in the same run, and the limit of detection (LoD) was calculated. The relationship between measured concentrations (from LoD) and theoretical CRM concentrations was analysed using least squares linear regression. The 95% confidence interval for the y-intercept and slope was calculated.
Trueness
Mean concentration, obtained from the intermediate precision study, was used to calculate the relative bias of trueness. Relative bias = (mean concentration–theoretical concentration)/theoretical concentration ×100.
For each sample, the median of all observed concentrations was calculated.
Limit of detection
Limit of detection (LoD) was defined as: loD = t (SDb/b), where b is the linear regression slope of the curve instrument response versus concentration, SDb is the standard deviation of the blank signal and t is the t-test value for 1% alpha risk (t = 3).
Accuracy
Total error (TE) was calculated from the intermediate precision CV and the absolute value of the bias of trueness: TE = 1.65 × CV (%) + |Bias| (%). A limit of quantification (LoQ) based on TE = 40% was determined.
Data analysis
Data analysis was carried out using Microsoft Excel 2010 and an online Levene’s test (available at: http://www.anastats.fr/outils.php) to assess the equality of variances. Levene’s test tested the null hypothesis (homogeneity of variance).
Performance criteria
The performance characteristics were compared with data in serum from the manufacturers or the literature. The acceptance criterion for linearity was a determination coefficient (R2) ≥ 0.99.
Results
Limit of detection
The results are reported in Table 1. LoD varied from < 0.2 µg/L to 0.5 µg/L for the first-generation methods and from < 0.1 µg/L to 0.2 µg/L for those of the second generation.
Precision
In 4/66 cases, repeatability and intermediate CVs could not be calculated. In three out these four cases, the null hypothesis of variance homogeneity (Levene’s test) was rejected and therefore ANOVA could not be performed. In all three cases, this concerned a sample at 5.3 µg/L. The fourth case concerned Tg results lower than the LoD (laboratory F). In the 62 other cases, repeatability and intermediate precision were evaluated. Results are presented in Table 2. The six unevaluated CVs are noted as ‘not estimated’ (NE), in this table, when Levene’s test failed. The not evaluated CVs at 0.1 µg/L (laboratory F) are noted as undetermined (UD). For the first-generation methods, only results ≥ 0.8 µg/L were taken into account. All results for FS are presented in Table 1. Figure 1 shows the imprecision profiles for each method. FS was ≤ 1.2 µg/L and ≤ 0.2 µg/L for the first- and second-generation methods, respectively.
Repeatability CV (CVr %) and intermediate precision CV (CVIP %), for each method, at different Tg concentrations in µg/L.
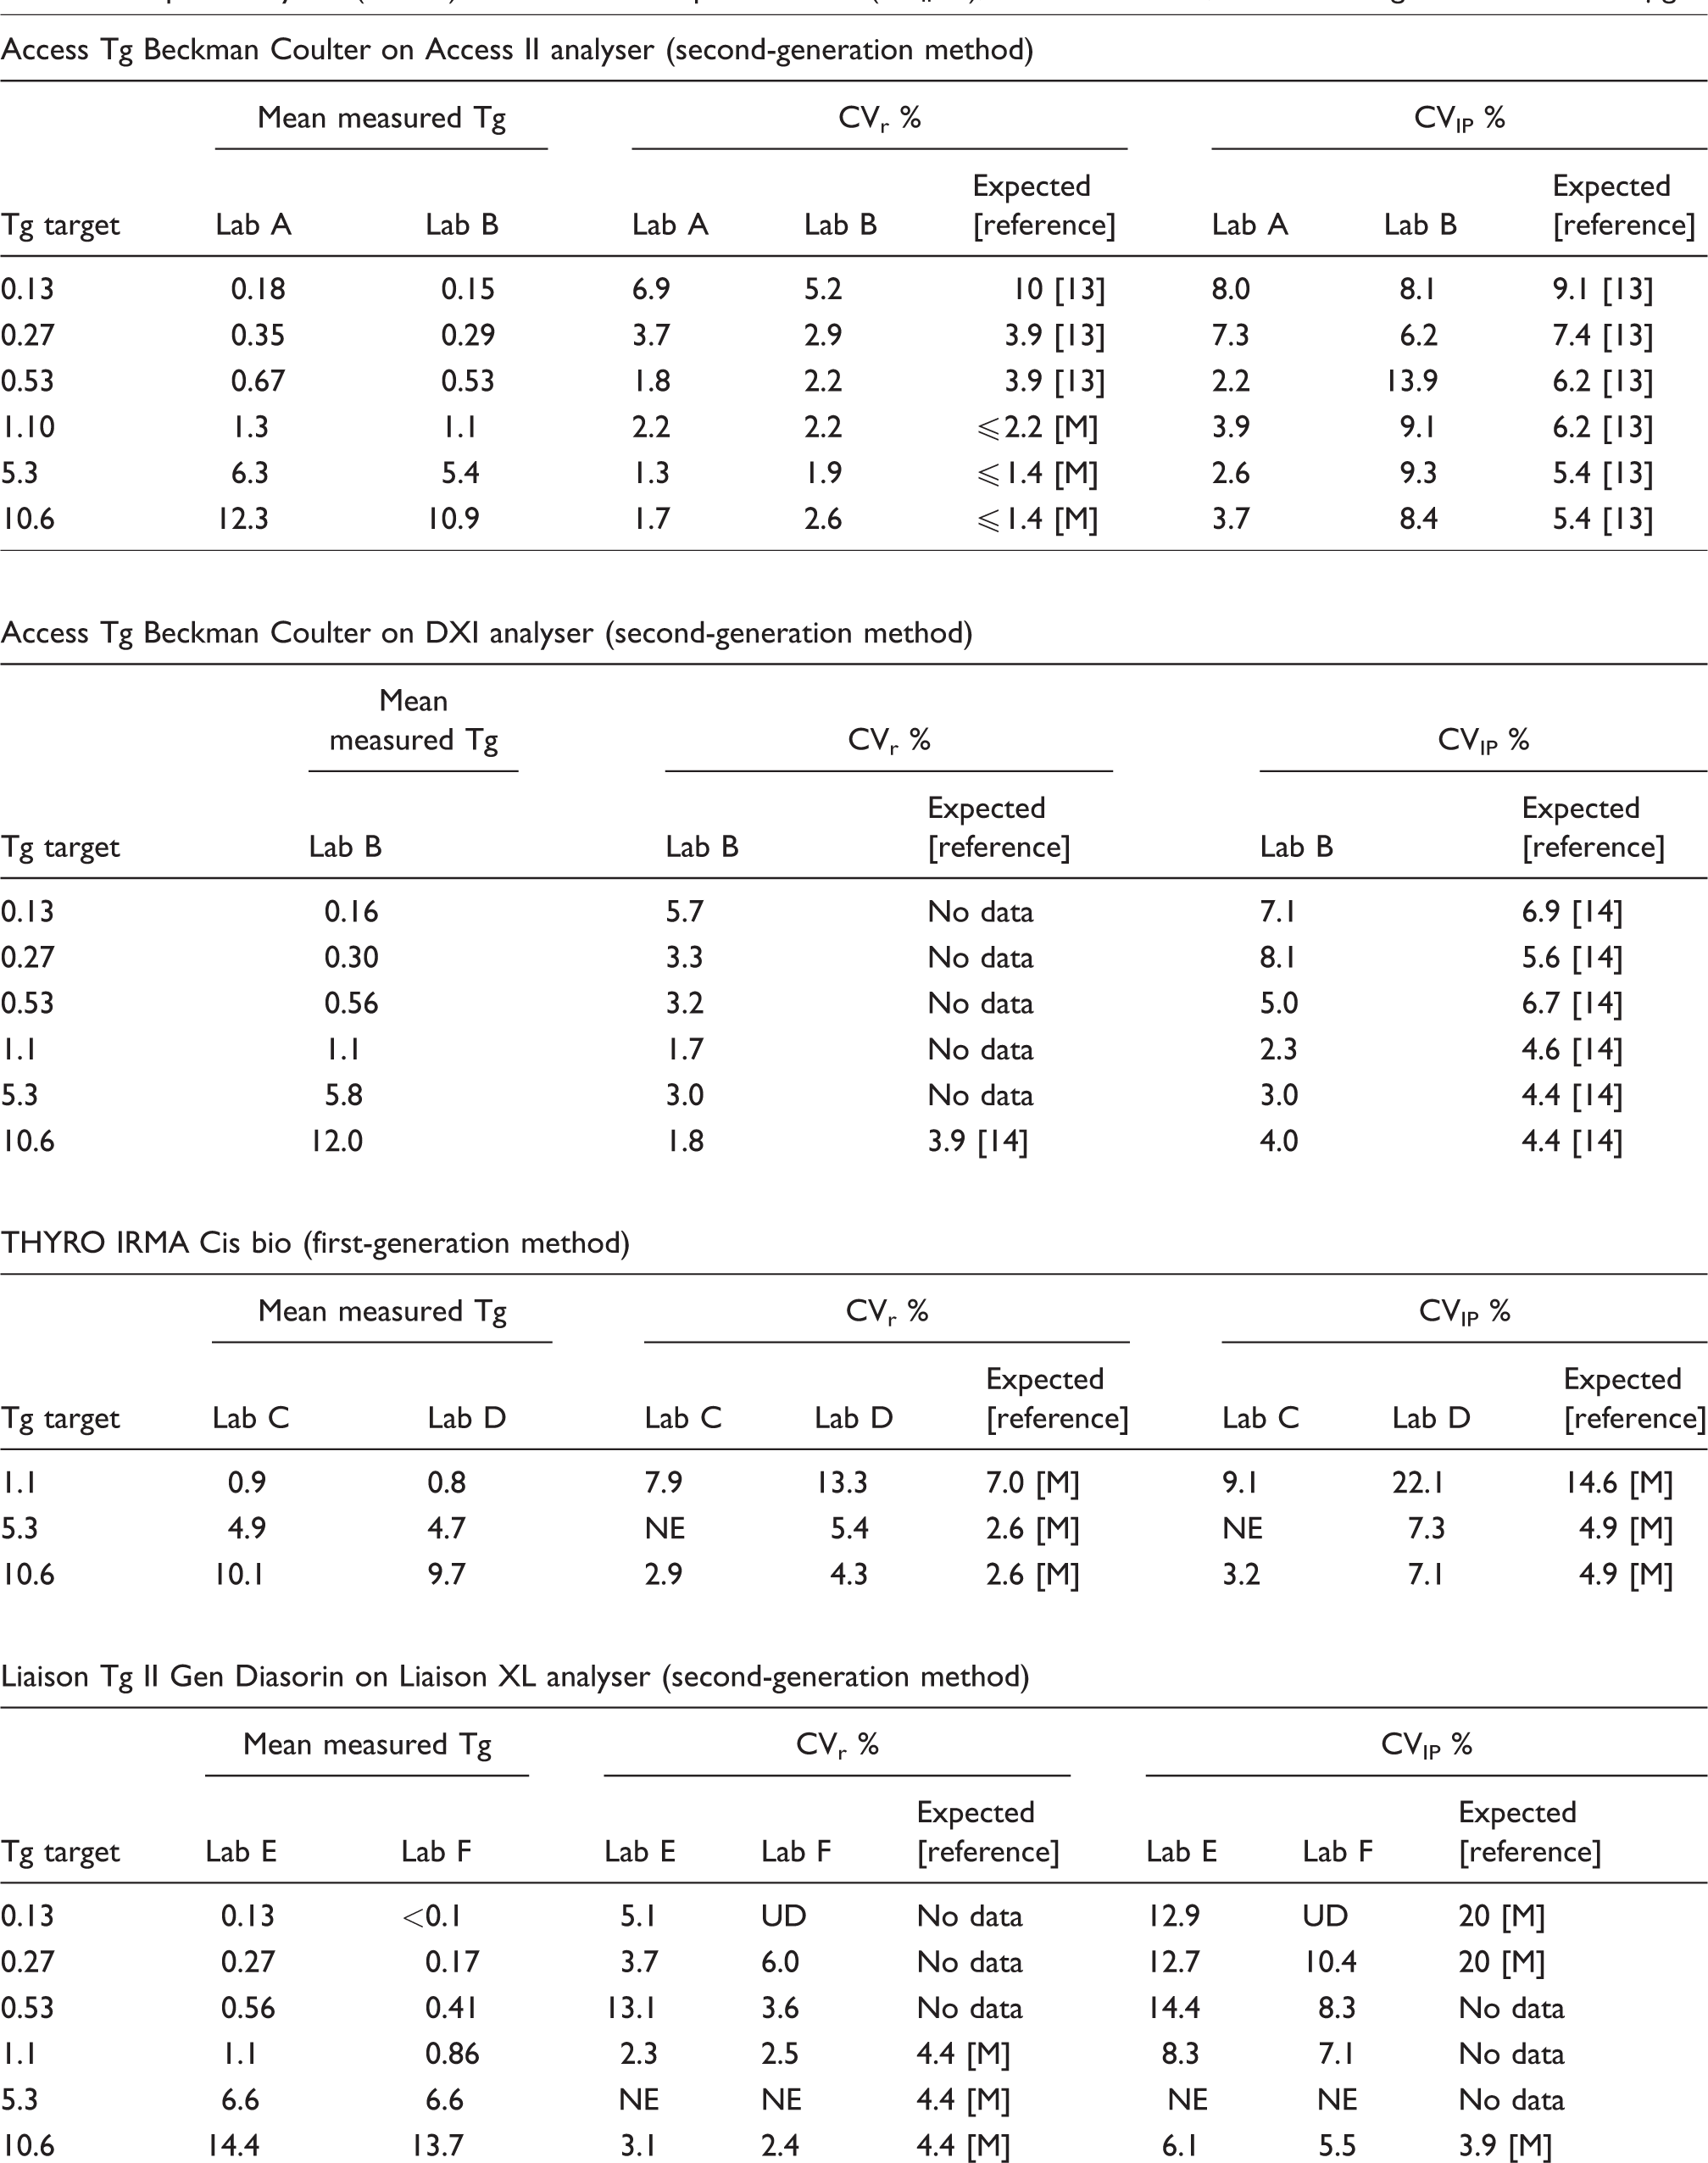
Lab: laboratory; M: manufacturer; NE: not estimated; UD: undetermined
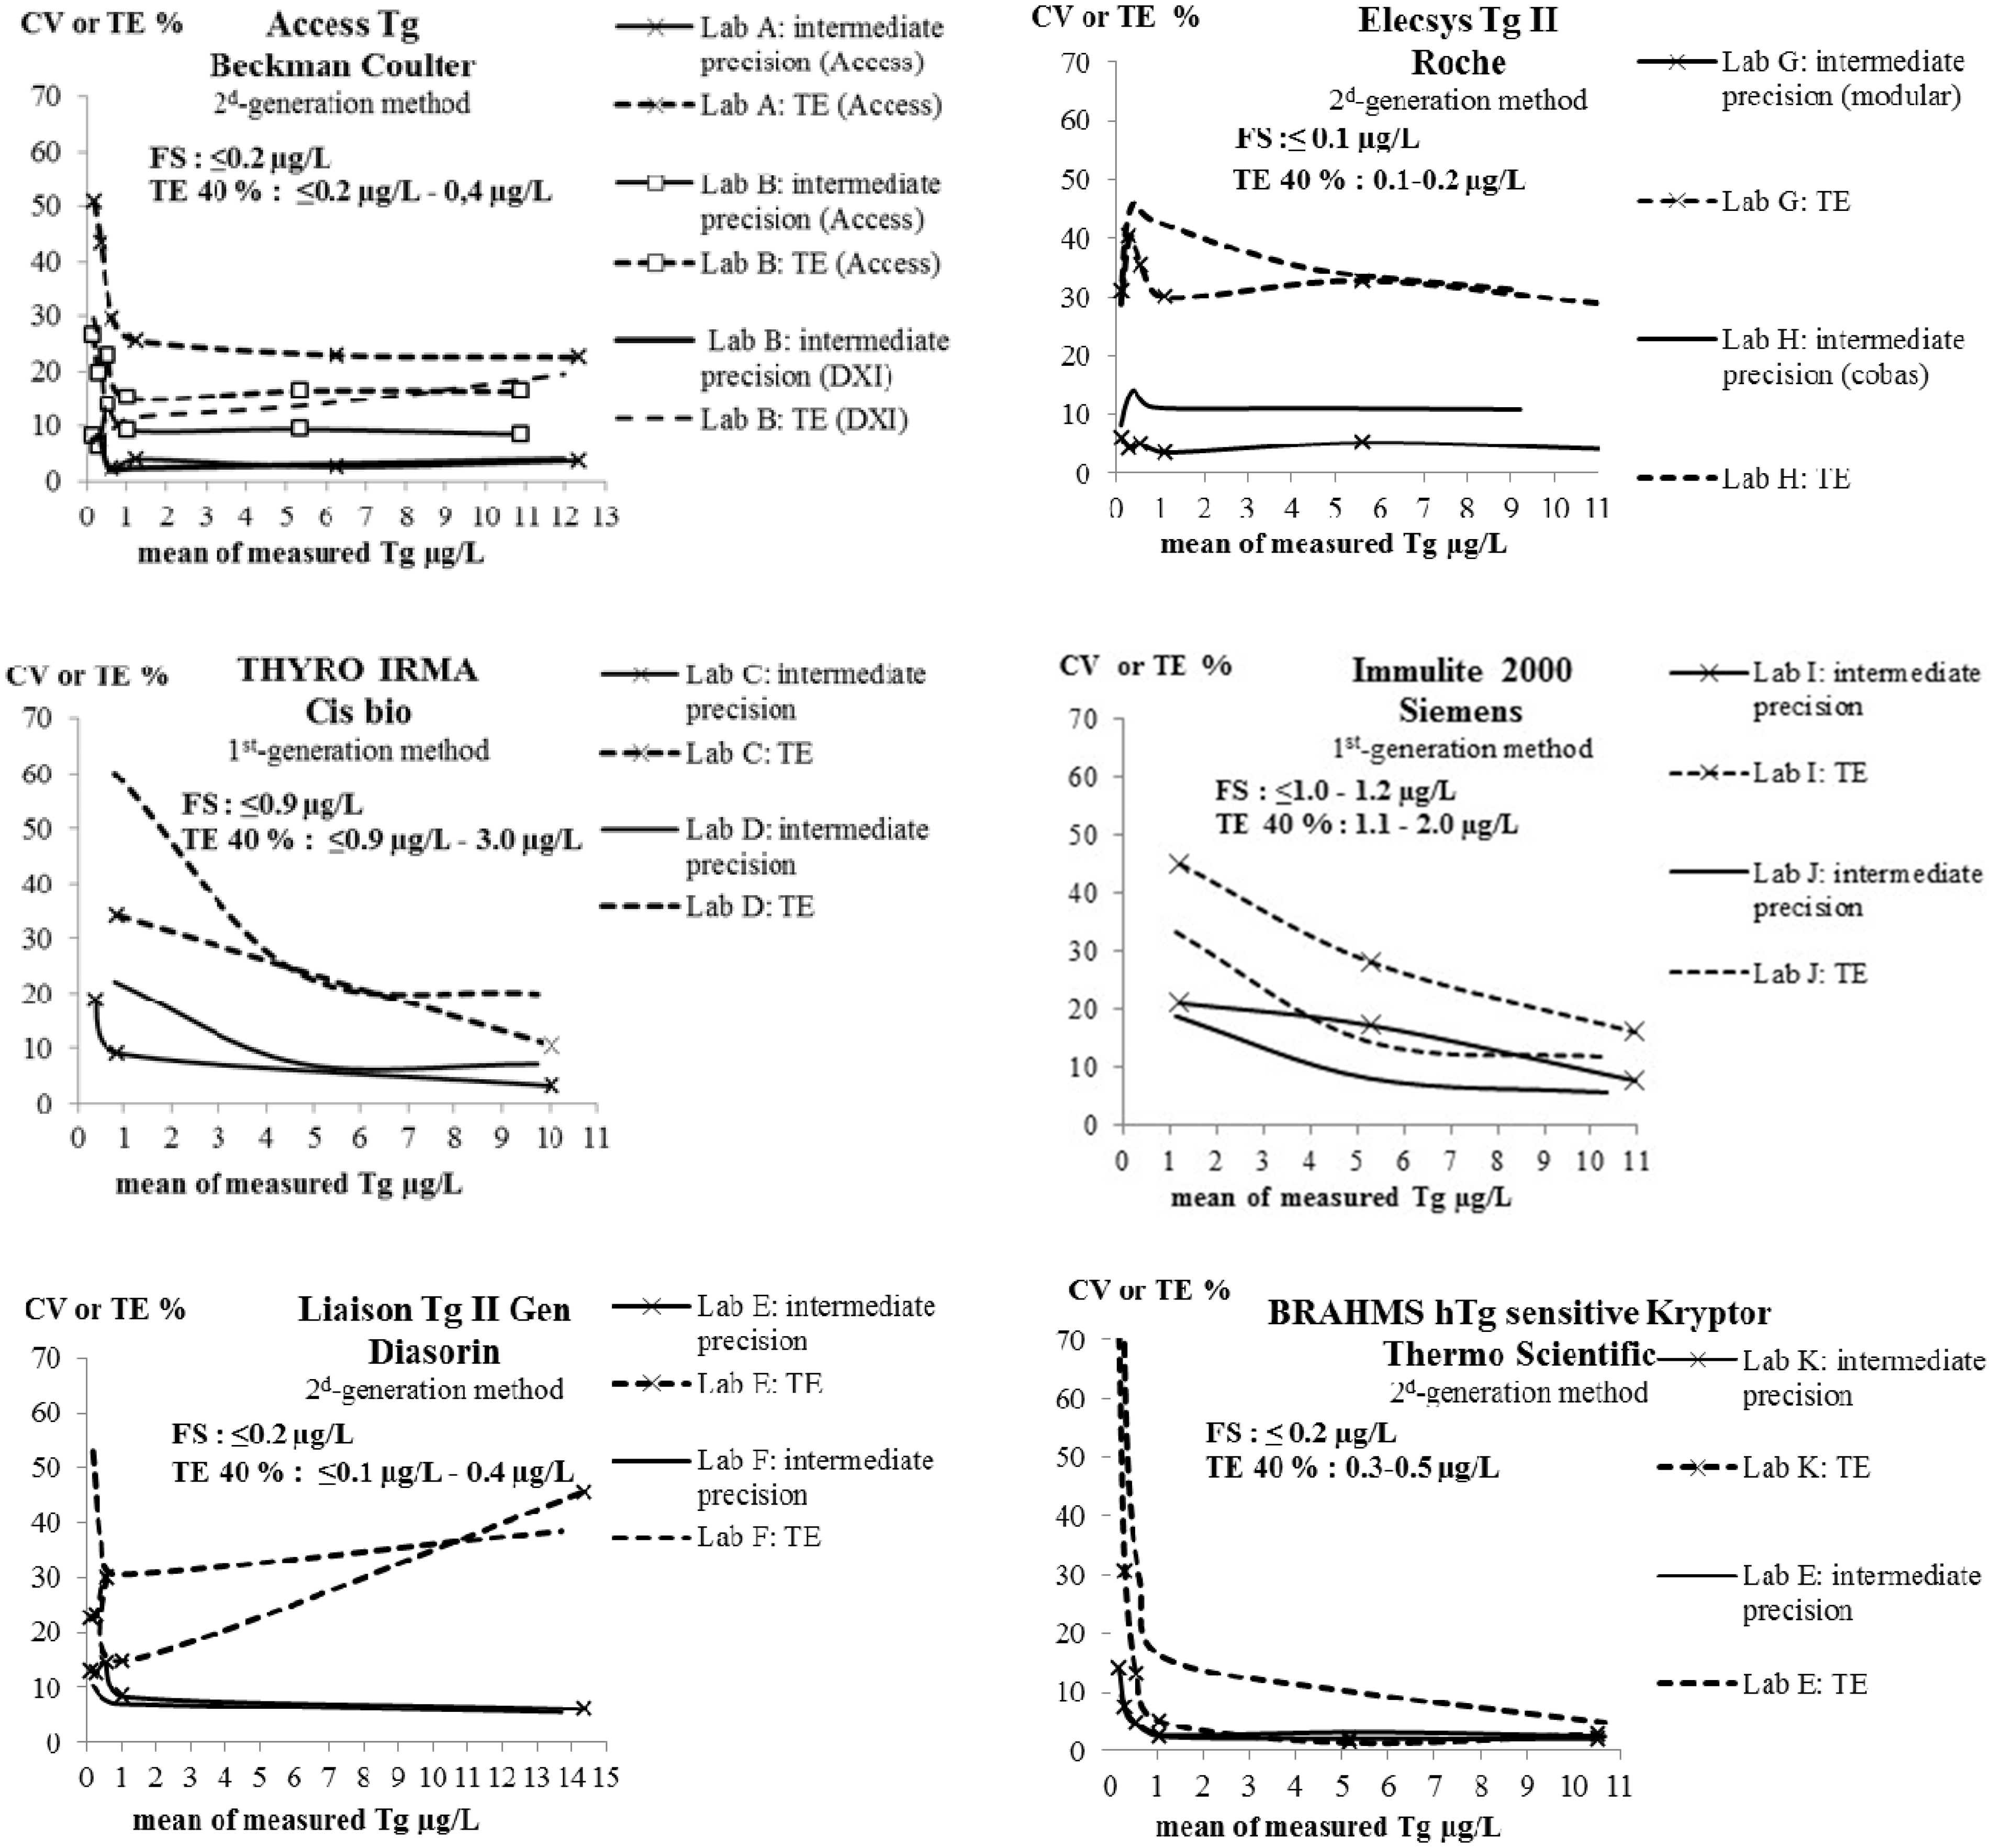
Intermediate precision CVs and total errors (TE), over the range of samples concentration, for each method.
Linearity and trueness
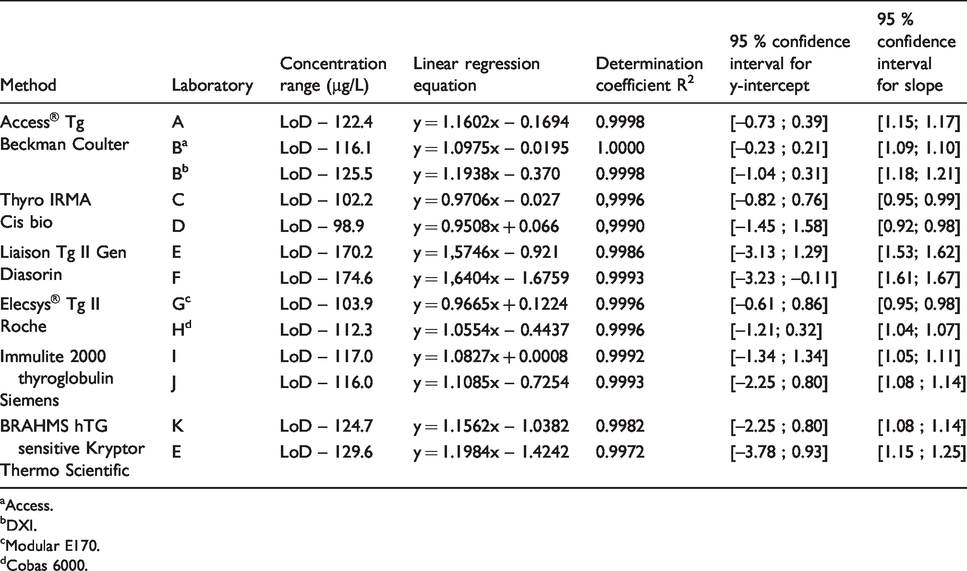
The recovery test with iodine 125 was used to estimate the stock solution concentration at 106.1 µg/L. Its measured concentration was > 170 µg/L (170.2 and 174.6) with the Liaison Tg II Gen Diasorin method. When we excluded this method, the measured concentration of stock solution varied from 98.9 to 129.6 µg/L depending on the method and laboratory. The inter-laboratory CV was 8.8%.The results for the linear regressions between measured concentrations and theoretical concentrations are presented in Figure 2 and Table 3. For all methods, the coefficients of determination R2 were ≥ 0.99. With one exception (laboratory F, Diasorin method), all confidence intervals for the y-intercept contained 0. Confidence intervals for slope never contained 1.
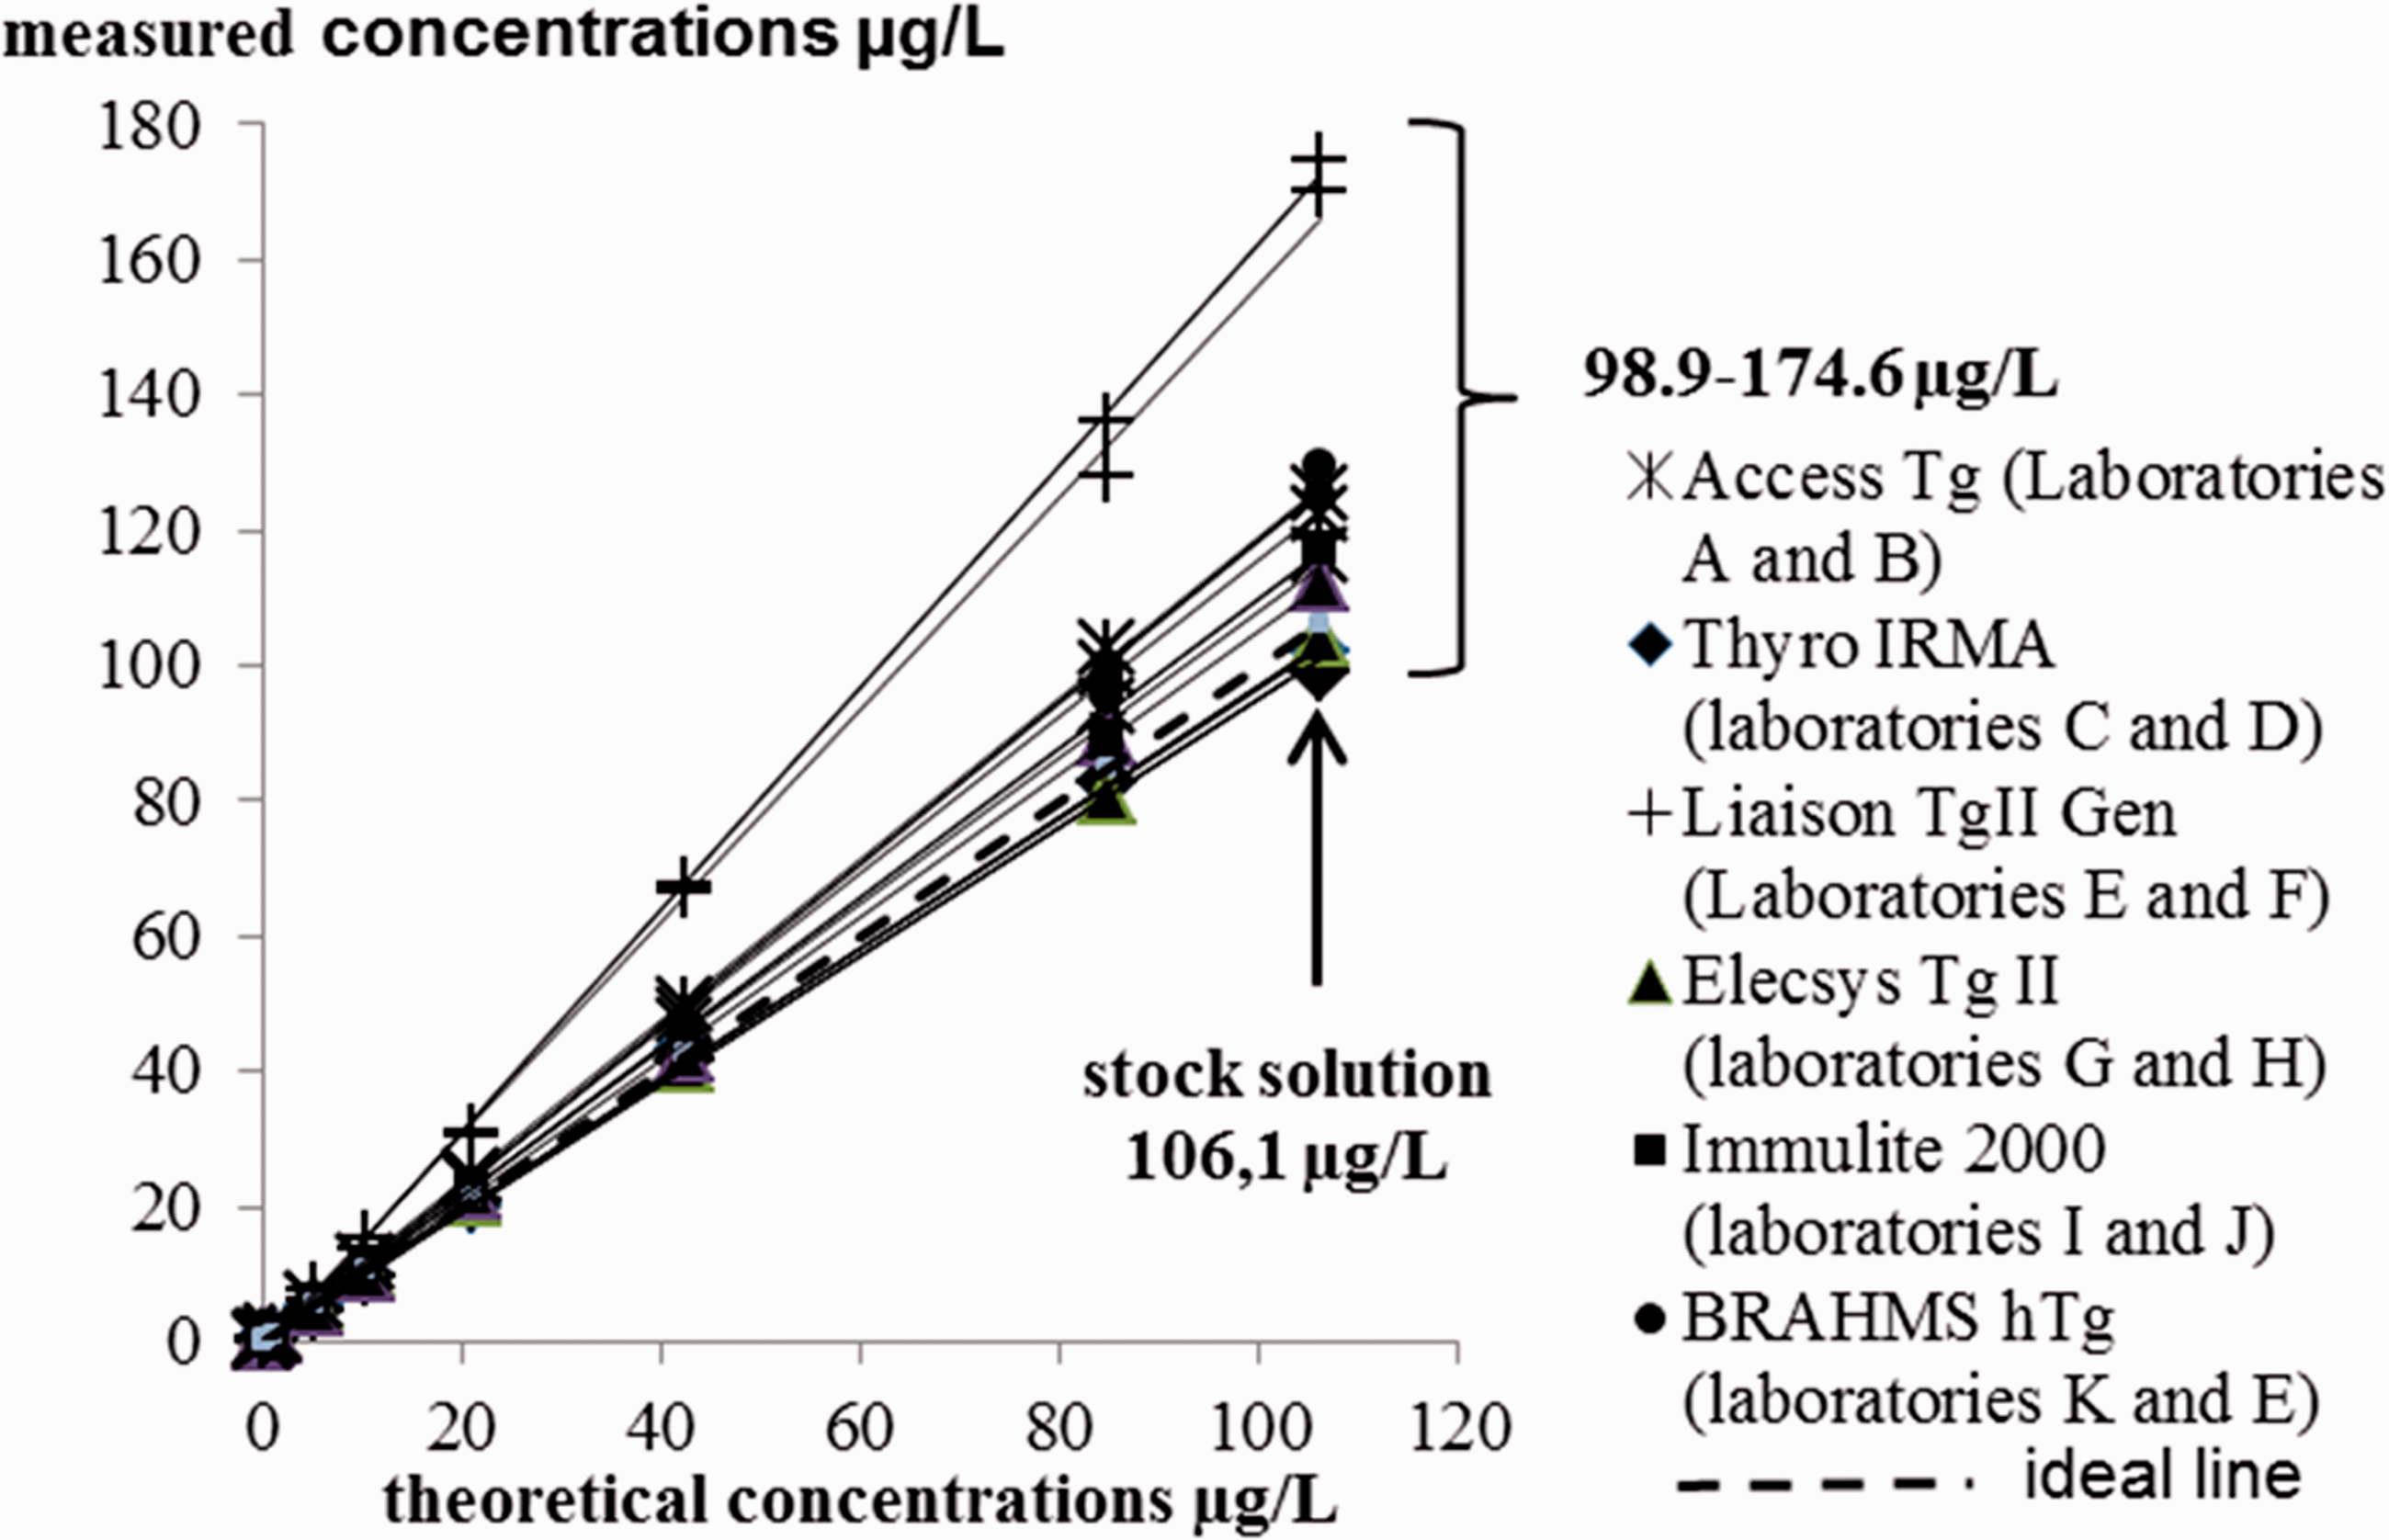
Linearity and relation between measured concentrations and theoretical CRM concentrations in each laboratory. Indicated are the assay used, regardless of the analyser, the linear regression line (solid line) and the 1:1 ideal line (dotted line).
Parameters of linear regression analysis (between measured concentrations and theoretical CRM concentrations) in each laboratory. Indicated are the assays used and the analyser if different between laboratories.
aAccess.
bDXI.
cModular E170.
dCobas 6000.
For the theoretical concentration in working samples of 0.13, 0.26, 0.53, 1.1, 5.3 and 10.6 µg/L, the results from all laboratories were distributed around median values of 0.15, 0.30, 0.56, 1.1, 5.3 and 10.8 µg/L, respectively. With regard to the best performances achieved with each method, biases of trueness were between –13.2 and 29.6% for a concentration of 10.6 µg/L. They were ≤ ±13.2%, for the same concentration, if the Diasorin method was not taken into consideration. All results are shown in Figure 3.
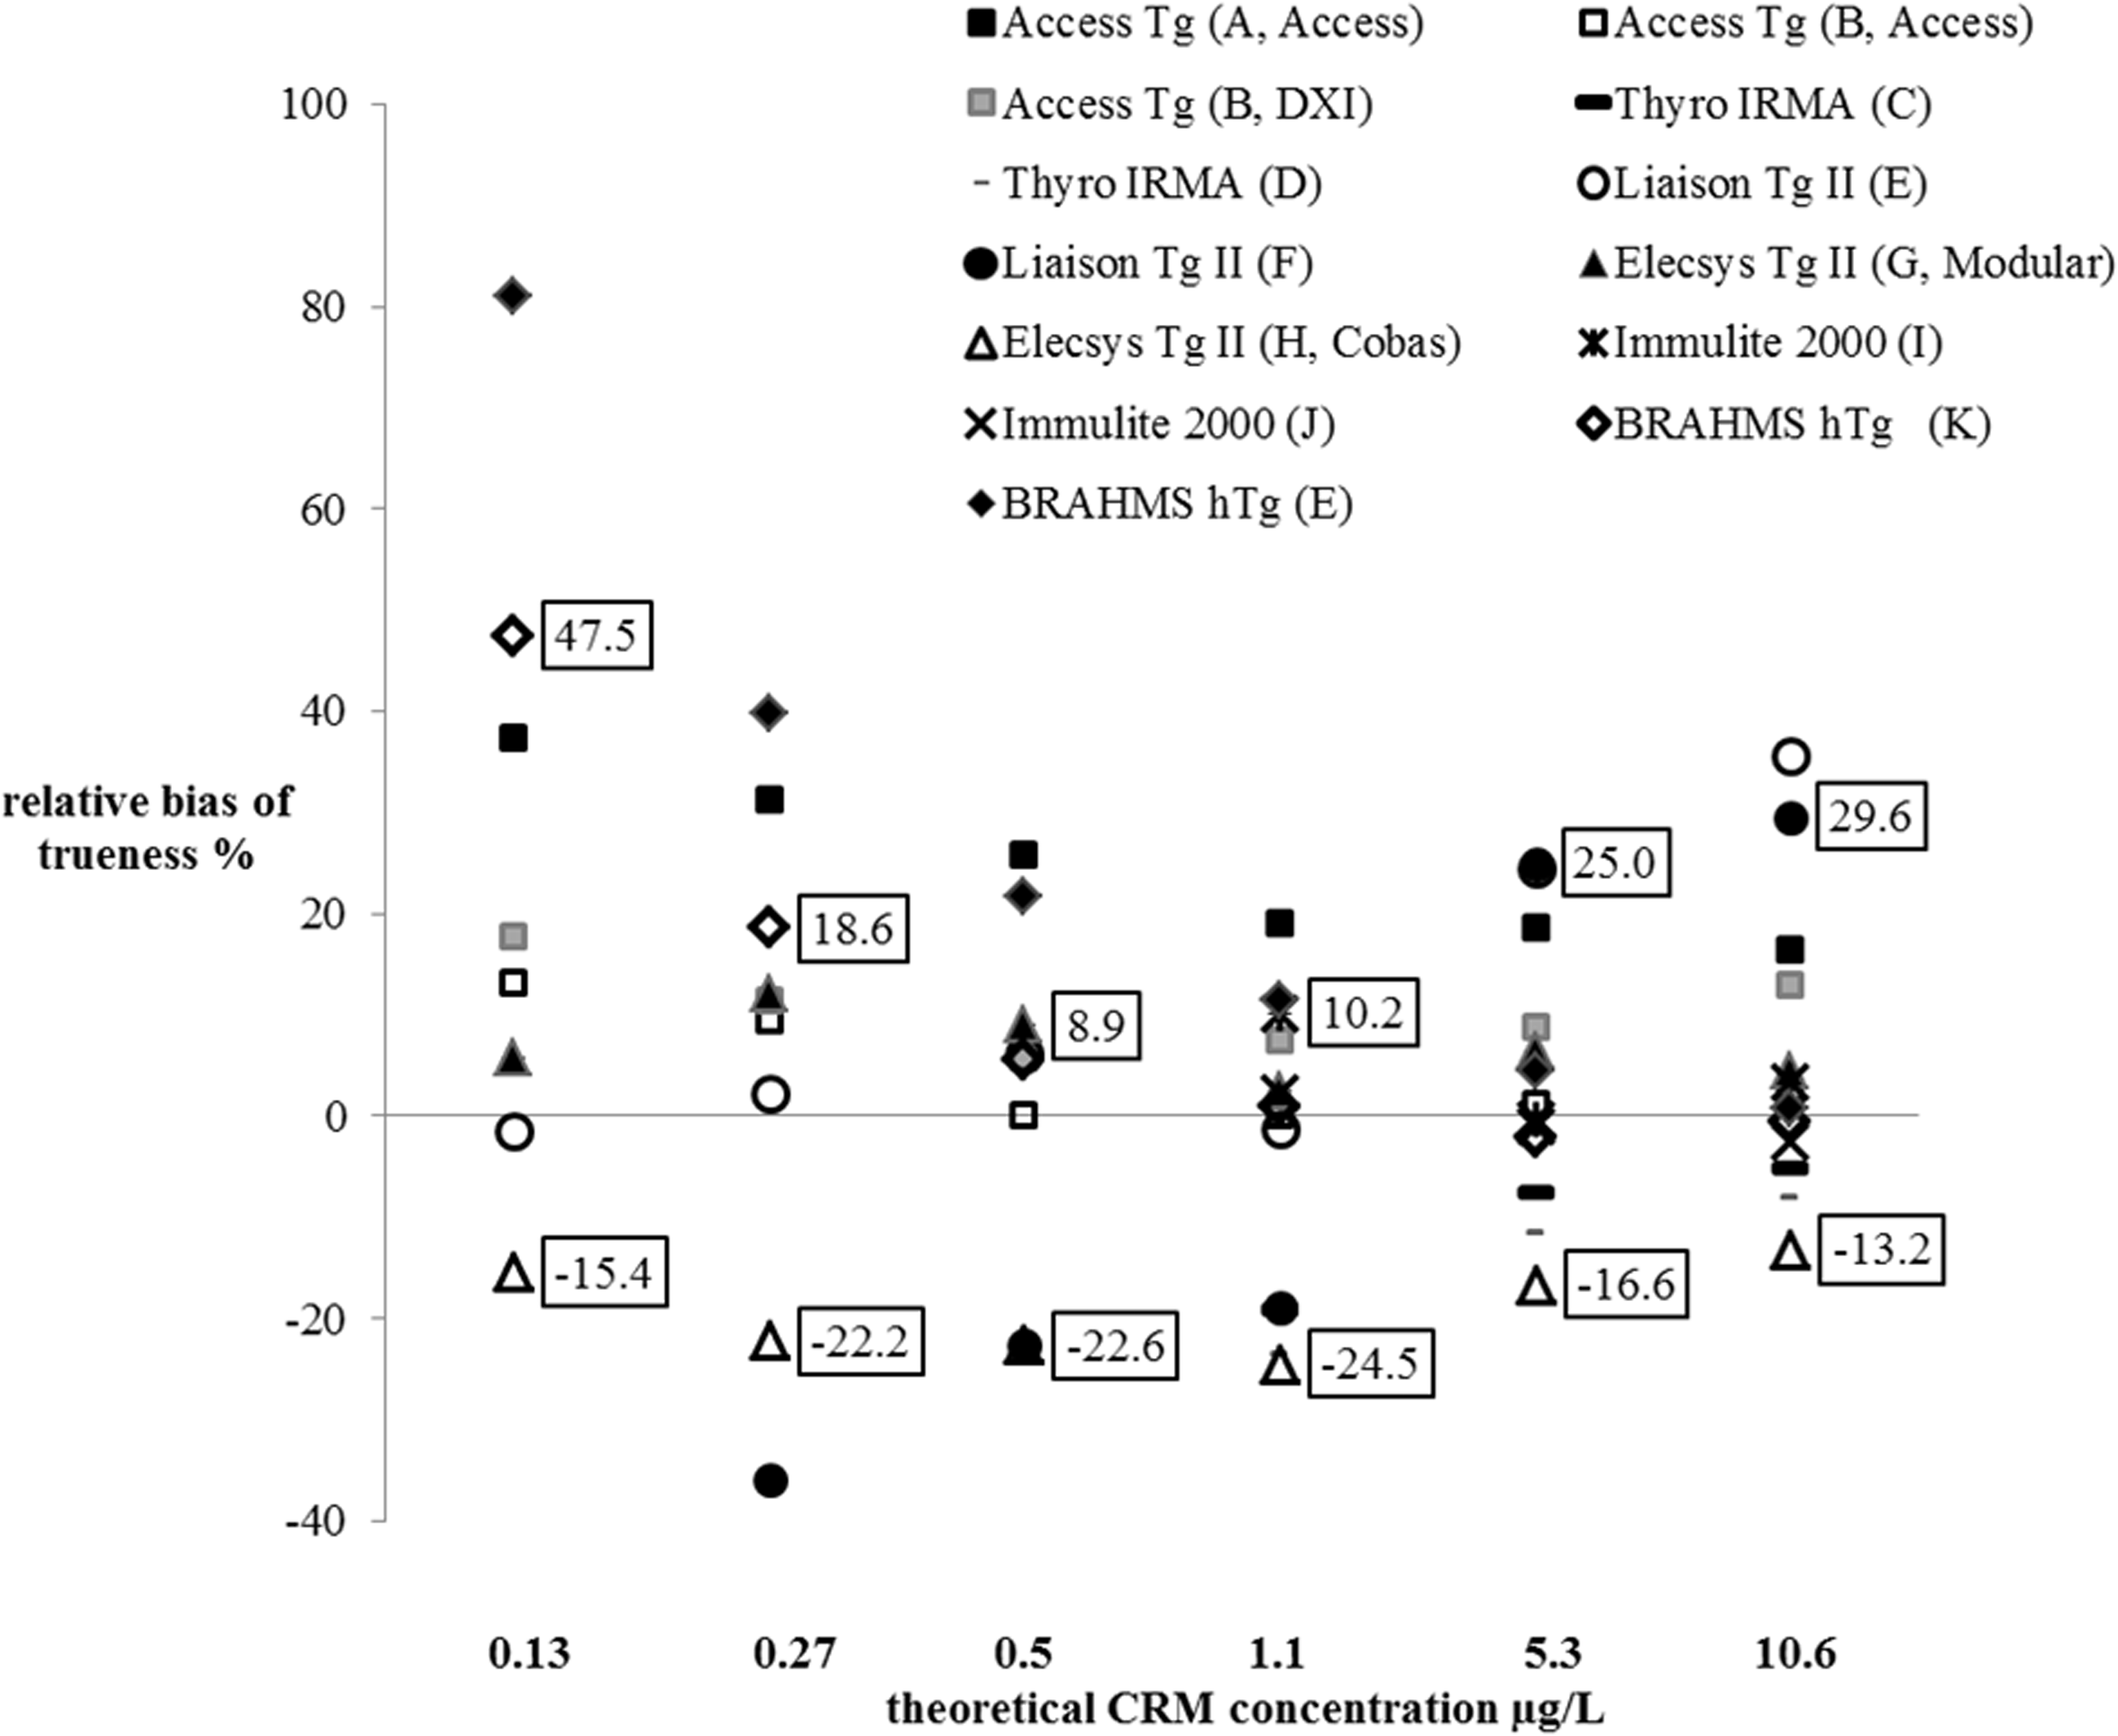
Relative biases of trueness evaluated by the 11 laboratories at several levels of concentration (Indicated are minimum and maximum relative bias, taking into consideration the best performance for each method. For the first-generation methods, are shown only the biases for CRM concentrations ≥1.1 µg/L. For the second-generation methods, one bias at 0.1 µg/L (laboratory F) is missing).
Accuracy
All results for TE are illustrated in Figure 1. LoQs (TE 40%) are presented in Table 1. Across all laboratories, they varied between ≤ 0.9 and 3 µg/L for the first-generation methods and between ≤ 0.1 and 0.5 µg/L for the second-generation ones.
Discussion
In compliance with the accreditation of medical laboratories (ISO 15189), methods used outside their intended scope require extensive validation. This multicentre study fits this validation context. The evaluation protocol included precision, functional sensitivity, linearity, trueness and accuracy. In the absence of relevant published data, performances could only be compared with manufacturer specifications or published results from evaluations in serum.13–17 Eight methods (assay + analyser if automated method), calibrated against CRM 457 as recommended, 1 were evaluated at 11 sites. The Access Thyroglobulin Beckman Coulter on DXI method and the Elecsys Tg II Roche on Modular and Cobas methods were evaluated in only one laboratory, whereas the other methods were independently evaluated in two laboratories.
The tested non-serum matrix was buffer containing BSA. Each laboratory prepared samples by dilutions of a shared stock solution of CRM 457 in this buffer. In France, using a kit-specific diluent as washout fluid is recommended. 1 Unfortunately, this diluent is not available separately from the assay kit for every method. We could have carried out these analytical validations with a physiological saline solution, which is often used to wash the biopsy needles. However, prior to this study, we investigated the effect of the sample matrix on Tg stability. 18 We observed that Tg concentrations in saline solution could rapidly and significantly decline over time, whatever the storage conditions. Interestingly, we noted that this decrease only concerned samples with an initial concentration below 200 µg/L. For these samples, Tg concentrations decreased, after 3 h at room temperature, from –34 to –53% depending on the sample. For the same storage time, concentrations varied from –28 to –47% under refrigerated conditions (2–8°C) and from –61 to –75% below –18°C. These previous findings are similar to those reported by Piotrkowski-Viale et al. 19 who showed a decrease of up to –76% after one day at –20°C. In contrast, we and others have observed stability in the Tg concentrations, in protein matrix, for the same storage conditions. 18 , 19 In this matrix, according to our previous experiment, no significant change occurs in the Tg concentrations after 24 h at room temperature or under refrigerated conditions, nor after one year at a storage temperature < –18°C. 18 In addition, we demonstrated that the concentration decrease, in the physiological saline solution, was due to the non-specific adsorption of Tg on the storage tubes. We indeed observed that, up to a threshold, a characteristic y = axb relation 20 linked the quantity of unmeasured Tg with the concentration of Tg initially present in the sample. According to these investigations, this threshold would be around 200 µg/L. 18 The adsorption of molecules on a solid phase is a known effect, due to hydrophobic interactions between proteins and solid phases. This adsorption is critical when very small amounts of analyte need to be measured in matrix containing a very low protein concentration. In practice, contamination of FNA washouts with serum proteins occurs and, consequently, samples contain small amounts of proteins. However, Borel et al. demonstrated that this contamination is negligible. 9 The amount of serum proteins in samples is probably insufficient to prevent Tg non-specific adsorption in all cases. We assume that this phenomenon could potentially lead to erroneous interpretations of Tg results. Like Piotrkowski-Viale et al., 19 we believe that the reliability of the FNA-Tg measurement can only be preserved by using a ‘stabilizing’ washing liquid (i.e. kit diluent or, failing that, BSA solution). As an alternative to the kit diluent, we chose BSA-enriched buffer for the present study. The investigations performed by Piotrkowski-Viale showed that the ‘stabilizing’ effect of 4% BSA in physiological saline solution was comparable to that of the commercial kit diluent. 19 According to our previous data, 0.2% BSA concentration in sample is sufficient to ensure Tg stability over time. 18 We therefore chose PBS-1% BSA, especially since it is commercially available and can therefore be used routinely in care units as a washout fluid. We also speculated that this buffer might limit the matrix effect.
In the laboratories concerned by the same method validation, we observed relatively good agreement between LoDs. More diluted samples would have been useful to better assess LoDs in a few cases. With two exceptions (Elecsys II method on Cobas 6000 and Immulite 2000 method from Siemens), all the methods, in the non-serum matrix we tested, showed that they could reach performances, in terms of LoD, relatively comparable to those reported by the manufacturers. For the same immunoassay used, we noted different performances between the Modular and the Cobas analysers from Roche. The poorer performances than expected with the Cobas analyser are discussed below. Concerning the Immulite method, we were unable to determine whether the poor agreement between the observed and expected LoDs was due to a different method used to determine this analytical limit, a matrix effect at low Tg concentrations, or the two combined.
Both precision and trueness were evaluated at three to six levels of concentration according to assay generation. These concentrations covered the concentration range of interest for FNA-Tg, 1 i.e. from FS to 10 µg/L.
The repeatability and intermediate precision variances were evaluated by ANOVA. 12 The advantage of ANOVA for evaluating precision is that it allows a relatively small number of runs (five in our study). However, it also requires between-runs variance homogeneity. We verified the homogeneity of the variances using Levene’s test. The test showed inhomogeneous variances (P < 0.05) in only 3/66 cases, and CVs could not be calculated. The missing CVs for a concentration at 5.3 µg/L did not impact the precision evaluation for the concerned method.
The recommendations of the National Academy of Clinical Biochemistry (NACB) guidelines are to estimate the FS in serum using two different lots of reagents and calibrators over 6- to 12-month period. 21 This period of 6–12 months is representative of the clinical interval for monitoring patients with differentiated thyroid cancer. 22 In order to be able to interpret two consecutive Tg measurements, during this period, it is indeed important to evaluate the possible deterioration in precision over time in low-range concentrations. This potential deterioration in precision is due to changes in analytical conditions (i.e. changes in reagent lots and calibrators, and other factors notably linked to instrumentation). Nevertheless, in the context of an FNA-Tg assay, there are no consecutive Tg measurements to compare, even though precision, at low concentration, must be rigorously evaluated. In this study, intermediate precision was evaluated over a period of less than six months but by spacing out the measurement days in such a way that calibrations and reagent lot numbers changed, as recommended by the NACB. As the Liaison Tg II Gen Diasorin method had only recently become commercially available, assays were performed using only one batch of reagents. However, three analyser calibrations were carried out. The 20% cut-off CV used for determining FS is the recommended one. 21
Inhomogeneous CVs were sometimes observed in the laboratories validating the same method or the same assay with different analysers. We cannot explain the poorer than expected performances with the Elecsys II method on Cobas 6000. It might have been just a one-off problem with the analyser in this laboratory. With this one exception, if we take into account the best performances achieved with each method, precision was satisfactory in PBS-1% BSA. In all cases, the FS were those expected even with the Elecsys II method on Cobas 6000 (0.1 versus 0.09 µg/L for this method).
The limit of trueness assessment can be uncertainty about the concentration assigned to the samples because of the CRM dilution processes. The first potential source of bias may be an error in the assigned concentration of the stock solution. However, the recovery test with iodine 125 helped bring the stock solution concentration closer to its real concentration. With only one exception (Liaison Tg II Gen Diasorin method), the concentration measured in the stock solution was indeed close to the assigned concentration. The second potential source of bias may be due to interlaboratory variations in the sample preparation. As the results from all the laboratories were distributed around median values very close to the theoretical concentrations, we assumed that dilution errors could generally be regarded as negligible. The concentration assigned to the samples was considered to be acceptably close to the true value.
After showing that the methods were linear, trueness was first overall estimated by analysing the equations of regression lines. Ideally, regression lines should have a slope of 1 and y-intercept of 0. As deviation from the ideal values estimates overall systematic error (constant and relative), we calculated the confidence interval around the slopes and y-intercepts. With one exception, all laboratories showed zero within the confidence interval. Therefore, no method seemed to present constant error. On the other hand, for all methods, the confidence intervals for slopes never contained 1. All methods therefore seemed to present a trueness error proportional to the concentration, with one exception (Liaison Tg II Gen Diasorin method) that was relatively low (<20%). To better assess trueness at low concentrations, we compared the means from 30 measurements with expected concentrations of Tg. Our investigations revealed more or less homogenous biases according to concentration. They were more dispersed at Tg concentrations < 0.27 µg/L than at higher concentrations, particularly for the same method. This was possibly due to small dilution errors in sample preparation, as previously discussed. We also noted that biases were higher than others with the BRAHMS Tg-sensitive Kryptor Thermo Scientific method and the Liaison Tg II Gen Diasorin method, at the limit of the measurement range for the first method and around 10 µg/L for the second. We cannot confirm either a matrix effect or no effect, with the buffer we used, because we do not know the trueness bias in serum matrix. Today, interchangeability and standardization between Tg assays have not yet been achieved. The term ‘standardization’ indeed encompasses the reference measurement procedures and reference materials (here the CRM 457). In the absence of reference measurement procedures, Tg assays could at best be harmonized. Although using the CRM 457 reference material reduced intermethod variability, notable differences are still observed between Tg concentrations when the same serum sample is measured by different methods. 17 ,23–25 Spencer et al. reported data taken from the United Kingdom National External Quality Assessment Service (UKNEQAS) for Tg surveys. 25 These data showed the magnitude of the between-method variability of Tg values for serum samples, without anti-Tg antibodies, from 51 laboratories using 10 different methods. There was more than a two-fold difference in the concentrations of Tg across the methods. The lack of agreement between immunoassays has little clinical impact with high concentrations of serum Tg. In contrast, at low concentrations, intermethod variability is a problem when monitoring patients with differentiated thyroid carcinoma. In order to ensure reliable interpretations, the European Consensus recommendations, in this case, are therefore to use the same laboratory and the same serum Tg assay. 22 Today, manufacturers generally try for intermethod harmonization in the concentrations of clinical interest, particularly around 1 µg/L. As the Liaison Tg II Gen Diasorin method is new, we assume that this harmonization has been achieved. We are unable to say whether the overestimation at high concentrations observed with this new method was due to a matrix effect. However, the Tg overestimation was only confirmed for concentrations > 5.3 µg/L. The relative biases of trueness, around 1 µg/L, were not greater than those of the other methods. All these observations lead us to believe that the Liaison Tg II Gen Diasorin method was perhaps miscalibrated at high concentrations but correctly calibrated at about 1 µg/L.
In this study, with the Liaison Tg II Gen Diasorin method exception and taking into account the best performances obtained with each method, relative biases of trueness, at 10.1 µg/L, were <± 13.2 %. These results, obtained with non-serum matrix, seemed satisfactory when compared with the maximum acceptable bias in serum, according to the Westgard site, i.e. ± 16.4 %. 26 Moreover, the reported magnitude of the between-method variability from the UKNEQAS 25 far exceeded the between-method variability of Tg values observed in this study. We therefore concluded that using PBS-1% BSA, over the concentration range of interest for FNA-Tg, does not seem to notably affect the trueness. The matrix effect, if it exists, appeared to be not very significant.
In the literature, the reported decision threshold for Tg interpretation in the FNA washouts varied across studies. Differences in clinical context, assays employed, matrix type, washout volume, sample management and methods for determining the cut-off value are at the origin of the wide range of FNA-Tg concentrations used as the decision threshold, from less than 1 µg/L to 50 µg/L. 6 , 9 However, the European guidelines recommend applying a decision threshold linked only to the FS of the assay on the population of thyroidectomized patients after treatment. 2 In patients with low concentrations of serum Tg, a detectable concentration of FNA-Tg in a cervical mass indicates the presence of thyroid cells. Indeed, in these cases, it is assumed that serum Tg has negligible effects on FNA-Tg results. 9 In thyroidectomized patients with very high circulating Tg, however, FNA-Tg may be contaminated by the Tg. But, in this context, patients generally have obvious metastases and FNA-Tg is considered of limited interest. 9 In practice, FNA-Tg tests must therefore be able to distinguish metastatic lymph nodes with detectable Tg from non-metastatic lymph nodes with undetectable Tg. Therefore, laboratories must use the most relevant LoQ for the method. We wondered whether acceptable precision (i.e. FS) was a sufficient objective for determining the threshold, or whether we needed additional requirements for accuracy. We therefore evaluated total error, which is the combination of bias of trueness and imprecision. 27 Given that the desirable total error is 21.9%, based on specifications on Westgard’s website for Tg in serum, 26 we assumed that 40% would be an acceptable LoQ for FNA-Tg. This value is the one chosen by some manufacturers (e.g. BRAHMS in this study) as LoQ in serum. Taking into account only the best performances achieved, we demonstrated that this limit was close to the FS with each method. Although FNA-Tg can be undetectable using first-generation assays and detectable using second-generation assays, in clinical practice, the added utility of second-generation methods has not yet been demonstrated.
Full analytical method validation requires evaluating possible interferences. The relevant question is whether the substances that usually affect Tg measurement are present in the FNA washout. As contamination with serum is negligible, 9 evaluation of conventional interferences like bilirubin, haemoglobin and triglycerides is irrelevant. Furthermore, even though the interference of anti-Tg antibodies is a problem with serum Tg immunoassays, several authors have demonstrated that these antibodies have a negligible effect on FNA-Tg measurement. 9 , 10 , 28 , 29 The French Society of Endocrinology position is not to assay anti-Tg antibodies in FNA washouts. 1 Last, with very high concentrations of Tg in FNA washouts, a ‘hook effect’ can occur, resulting in an artificially low value of Tg. Managing these samples does not differ from managing those from serum.
In conclusion, all the methods evaluated in this study showed their ability to measure FNA-Tg in PBS-1% BSA, over the concentration range of interest, with acceptable total analytical error. In all cases, the manufacturers’ specification for FS in serum seemed to be an appropriate decision threshold.
Footnotes
Declaration of conflicting interests
The author(s) declared no potential conflicts of interest with respect to the research, authorship, and/or publication of this article.
Funding
The author(s) received no financial support for the research, authorship, and/or publication of this article.
Ethical approval
Not applicable.
Guarantor
FBC.
Contributorship
Each author evaluated at least one method. FBC wrote the first draft of the manuscript with contribution from both RB and VM. All authors reviewed and approved the final version of the manuscript.