
Abstract
Background
Differentiating between true and pseudohyperkalaemia is essential for patient management. The common causes of pseudohyperkalaemia include haemolysis, blood cell dyscrasias and EDTA contamination. One approach to differentiate between them is by checking the renal function, as it is believed that true hyperkalaemia is rare with normal function. This is logical, but there is limited published evidence to support it. The aim of this study was to investigate the potential role of the estimated glomerular filtration rate in differentiating true from pseudohyperkalaemia.
Methods
GP serum potassium results >6.0 mmol/L from 1 January 2017 to 31 December 2017, with a repeat within seven days, were included. Entries were retrospectively classified as true or pseudohyperkalaemia based on the potassium reference change value and reference interval. If the initial sample had a full blood count, it was classified as normal/abnormal to remove blood cell dyscrasias. Different estimated glomerular filtration rate cut-points were used to determine the potential in differentiating true from pseudohyperkalaemia.
Results
A total of 272 patients were included with potassium results >6.0 mmol/L, with 145 classified as pseudohyperkalaemia. At an estimated glomerular filtration rate of 90 ml/min/1.73 m2, the negative predictive value was 81% (95% CI: 67–90%); this increased to 86% (95% CI: 66–95%) by removing patients with abnormal full blood counts. When only patients with an initial potassium ≥6.5 mmol/L were included (regardless of full blood count), at an estimated glomerular filtration rate of 90 ml/min/1.73 m2, the negative predictive value was 100%. Lower negative predictive values were seen with decreasing estimated glomerular filtration rate cut-points.
Conclusion
Normal renal function was not associated with true hyperkalaemia, making the estimated glomerular filtration rate a useful tool in predicting true from pseudohyperkalaemia, especially for potassium results ≥6.5 mmol/L.
Introduction
Hyperkalaemia is a potentially life-threatening disturbance that can require immediate medical intervention. Clinical manifestations include muscle weakness or paralysis, cardiac arrhythmias and death. 1 The importance of hyperkalaemia is reflected in the UK by the Royal College of Pathologists’ critical communication document, which requires that all potassium results ≥6.5 mmol/L be communicated within 2 h. 2 Hyperkalaemia is most commonly caused by reduced urinary excretion of potassium which is frequently seen in patients with renal disease. 3 As ∼98% of the body’s potassium is in the intracellular space, any process that leads to an increased shift from the intracellular to extracellular space will also lead to hyperkalaemia, examples include rhabdomyolysis, acidosis and insulin deficiency. 4 Other less common causes of serum hyperkalaemia have been reported and include the use of medications known to interfere with the renal clearance of potassium (such as potassium-sparing diuretics) and patients with excessive potassium intake. 5 , 6 The above causes of hyperkalaemia can be thought of as ‘true hyperkalaemia’, as the serum potassium reflects the in vivo picture.
An additional cause of hyperkalaemia that cannot be overlooked is pseudohyperkalaemia, which is an in vitro increase in serum potassium. Unlike true hyperkalaemia, pseudohyperkalaemia does not reflect pathological in vivo changes. There are multiple causes of serum pseudohyperkalaemia. The first was described in 1958 when it was demonstrated that the serum potassium concentration in patients with thrombocytosis was greater than plasma, due to the intracellular release of potassium from platelets during the clotting process. 7 Leukocytosis and erythrocytosis can also cause pseudohyperkalaemia by similar mechanisms related to white and red blood cell fragility. 8 , 9 A number of additional causes of pseudohyperkalaemia have now been identified and it is well documented that the preanalytical phase is the point at which most causes of pseudohyperkalaemia are introduced. 10 Examples include familial pseudohyperkalaemia, prolonged tourniquet application, repeated fist clenching during phlebotomy, sample haemolysis, potassium-EDTA or potassium-oxalate contamination, vigorous tube inversions, use of pneumatic tube transport, delay in sample centrifugation and seasonal cold temperatures. 11
The distinction between true and pseudohyperkalaemia must be made in order to avoid patient anxiety, out-of-hours phone calls to GPs, unnecessary hospital admission and at worst, inappropriate treatment. 12 , 13 Pseudohyperkalaemia should be considered as a differential diagnosis in an asymptomatic patient, especially if they have normal ECG findings. A pragmatic approach to identify pseudohyperkalaemia can be made by laboratory staff before hyperkalaemic results are released. This involves checking for haemolysis, a delay in processing and signs of EDTA contamination and inspecting the associated full blood count (FBC) to identify thrombocytosis, leukocytosis or erythrocytosis. 14 In theory, this approach should identify the more common causes of pseudohyperkalaemia. However, it will fail to identify rarer causes such as familial pseudohyperkalaemia, prolonged tourniquet application or repeated fist clenching, which are extremely difficult to identify based on laboratory results alone. One proposed way to distinguish between true and pseudohyperkalaemia is to check the patient’s renal function. As the kidneys are the main organ involved in potassium homeostasis, it is a commonly-held belief that it is extremely rare to develop true and severe hyperkalaemia in the absence of impaired renal function. 15 The rationale behind this is logical, but to our knowledge, there is no direct evidence-based publication to support it.
The aim of this study was therefore to investigate the association between renal function and true/pseudohyperkalaemia using the estimated glomerular filtration rate (eGFR). We have retrospectively collected one year’s worth of GP hyperkalaemia data and included all entries with an initial serum potassium result of >6.0 mmol/L and a repeat within seven days. To classify the event as true hyperkalaemia or pseudohyperkalaemia, reference change values (RCV) were used, which provide an objective tool for assessing the significance of differences in serial results from the same individual. 16 The eGFR at different cut-points was then used to differentiate pseudohyperkalaemia from true hyperkalaemia. To further increase the potential of the eGFR, only patients with a ‘normal’ FBC were included and the data re-analysed. The above process was then repeated with all GP potassium results of ≥6.5 mmol/L to evaluate the Royal College of Pathology’s critical communication guideline.
Methods
Ethical approval
This was a retrospective observational study that only employed data already collected in the department’s Laboratory Information Management System. No additional tests were added on at the time of sample collection or in retrospect, and all data were anonymized. For these reasons, formal approval from a Research Ethics Committee was not required, but the study was registered as a clinical audit.
Laboratory setting
This study was performed in the department of Chemical Patholgy at Epsom and St Helier University Hospitals NHS Trust. The biochemistry laboratories at the trust have one Laboratory Director, follow the same standard operating procedures and are ISO 15189 accredited. All Biomedical Scientists and Clinical Scientists are state registered with The Health and Care Professional Council (HCPC). The laboratories follow a strict programme of internal quality control (IQC) and external quality assurance. Both laboratories use the same Laboratory Information Management System – Telepath.
Sample analysis
Blood samples for potassium and creatinine were collected into BD vacutainer SST II Advance tubes and centrifuged at 2700 RCF for 7 min at room temperature using Hettich Rotanta 460 R centrifuges to isolate the serum. Potassium and creatinine were measured on Abbott Architect c16000 chemistry analysers. Potassium was measured by the on-board indirect ion selective electrode ICT module which has an intra-assay imprecision coefficient of variation (CV) of 0.4% and inter-assay imprecision CV of 0.5% at 6.4 mmol/L. Creatinine was measured using an enzymatic method with an intra-assay imprecision CV of <0.3% and inter-assay imprecision CV of <1.5% at 57.5, 161.7 and 583.4 µmol/L. Randox Liquid Chemistry Premium Plus IQC material was run three times a day at two levels for both the potassium (mean values of 2.5 and 6.1 mmol/L) and creatinine (mean values of 55 and 410 µmol/L) assays over the period of data collection. The eGFR was automatically calculated by Telepath using the CKD-EPI formula (race set as ‘other’) with a reportable range of 1–90 ml/min/1.73 m2. 17 When eGFR was reported as >90 ml/min/1.73 m2, the exact eGFR was calculated using the CKD-EPI formula to allow statistical analysis. 18 Blood samples for FBCs were collected into BD vacutainer K2E tubes containing K2-EDTA. Thrombocyte, leukocyte and erythrocyte counts were made using Sysmex XE-5000 analysers.
Data collection and exclusion
The list function was used in Telepath to capture all potassium results reported by the two laboratories from the 1 January 2017 to the 31 December 2017. Potassium results were not reported on samples that were haemolysed (defined as an Abbott haemolysis index of ≥1.0) or suspected as having potassium EDTA/potassium oxalate contamination (as judged by the reasoning of HCPC registered laboratory staff), so they would not appear in the list. All requests for potassium fall under the ‘U&Es’ test code so sodium, urea, creatinine and eGFR were simultaneously reported. FBC results are reported on the same specimen number as U&Es (when both tests are requested). The list was configured to gather the following information for each reported potassium result: specimen number, request location, date and time of sample collection, date and time of sample receipt in the lab, potassium result, creatinine results, calculated eGFR, white cell count (WCC), platelet (PLT) count, haemoglobin (Hb) concentration, patient age, hospital number and sex. The gathered information was saved to a text file, which was then imported to Microsoft Excel. Once in excel, the data were filtered to only include patients ≥18 years of age and request made from GP practice locations. The data were then filtered further to only potassium results >6.0 mmol/L or ≥6.5 mmol/L. The following exclusion criteria were then applied to generate the >6.0 mmol/L and ≥6.5 mmol/L ‘final databases’:
(1) If the time of sample collection and receipt in the laboratory were recorded, and the elapsed time was found to be >6 h, the sample was not included in the final data-set. This exclusion criteria was in place as serum potassium results change by statistically significantly values between 4 and 8 h of collection when stored at various ‘room temperatures’ prior to centrifugation. 19 , 20 If the time of collection or receipt was not recorded, and therefore the elapsed time is not known, the event was still included; this is a recognized limitation and is elaborated on in the discussion.
(2) For each of the remaining entries, the database was searched for a repeat potassium results up to seven days after the initial raised potassium result. If a repeat was available, then the lab number, potassium result and repeat location were added to the database. If no result was available, or if the repeat result was >6 h upon arrival in the lab (as explained above), the entry was removed.
(3) If a single patient (as identified by the hospital number) had more than one entry, a second entry was only permitted if there was a gap of >30 days between the repeat potassium result and the next entry. This exclusion criterion was in place to prevent the same hyperkalaemia event being included in the database more than once.
Classification as true or pseudohyperkalaemia
The potassium reference interval (3.5–5.3 mmol/L) was used in combination with the RCV to classify all included entries in the ‘final databases’ as true or pseudohyperkalaemia. RCV were calculated by combining the analytical (CVA) and intra-individual (CVi) imprecision using: RCV (%) = 21/2 × 1.65 × (CVA2 + CVi2)1/2. When calculated over a six-month period using IQC material, the CVA of the serum potassium analysers used across the trust at a mean concentration of 6.0 mmol/L was 1.0%. The CVi of serum potassium in ‘healthy’ individuals is reported as 4.1%, by the EFLM Working Group on Biological Variation. 21 When these two values are combined, the RCV for potassium would be 12%. A patient was classified as having pseudohyperkalaemia if the difference between the repeat potassium and original sample was >RCV and the repeat was within the reference interval. If the difference was ≤RCV or the repeat potassium was above the reference interval, the patient was classified as having true hyperkalaemia.
Classification as a ‘normal’ FBC
Each entry in the ‘final databases’ was checked for concurrent FBC results (WCC, PLT and Hb). They were classified as having a ‘normal’ FBC with WCC ≤50 × 109/L, PLT ≤500 × 109/L and Hb ≤145 g/L if female or ≤170 g/L if male. These WCC and PLT cut-offs are above the upper laboratory reference intervals (10 × 109/L for WCC and 400 × 109/L for PLT) but were chosen as it has been demonstrated that concentrations above these values are associated with increased rates of pseudohyperkalaemia.22–24 The Hb cut-offs are the same as the sex-specific upper laboratory reference interval and were chosen because although erythrocytosis is known to causes pseudohyperkalaemia, the Hb threshold associated with increased rates of pseudohyperkalaemia has not been elucidated. 9
Statistics
Statistical analysis and graphing (box plots and receiver operating characteristic [ROC] curves) was performed using Microsoft Excel and the Analyse-it software add-on (Analyse-it software Ltd, Leeds, UK). Pearson’s chi-square test of independence was used to examine the relation between sex and the classification as true or pseudohyperkalaemia. Normal distribution of data was assessed using the Shapiro-Wilk test. If both groups had a normal distribution, the parametric Student’s t-test was used to determine if they were from the same population. If one or both groups had a non-normal distribution, the non-parametric Mann-Whitney U test was used. For ROC curve analysis, the method of Hanley and McNeil was used to compare the area under the curve (AUC) with 0.5 and the method Delong et al. to compare two AUCs with pairwise deletion. 25 , 26 For all statistical tests, P <0.05 was used to reject the null hypothesis. Confidence intervals (CI) for sensitivity and specificity were calculated using the ‘exact’ Clopper-Pearson method and for predictive values using the standard logit confidence intervals. 27
Results
GP potassium results >6.0 mmol/L
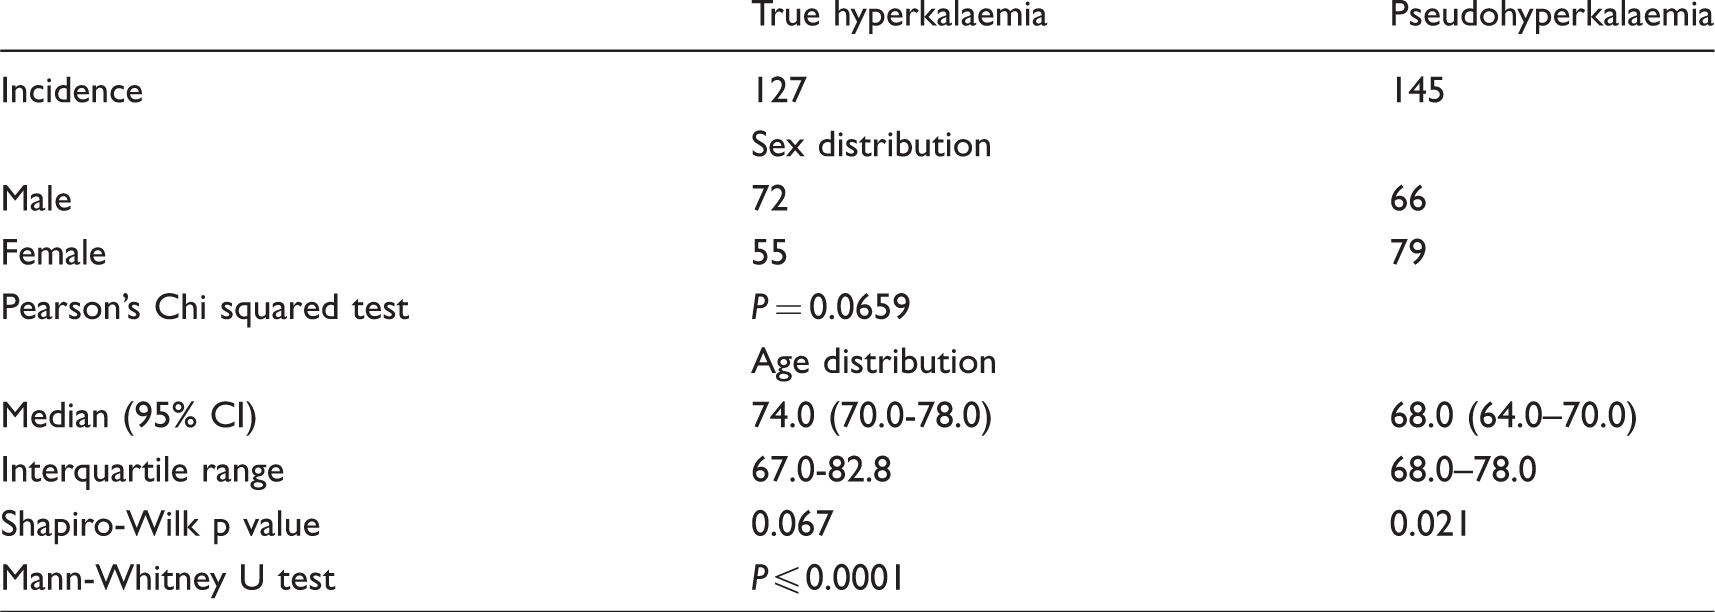
There were 449,231 serum potassium results reported by the biochemistry laboratory in 2017. Of these, 211,456 (47.1%) were requested by GP locations and 419 of them were >6.0 mmol/L (0.20% of all GP requests). After applying the exclusion criteria, 272 entries from 262 patients (10 patients had 2 entries) were included in the final database, with 127 of them being classified as true hyperkalaemia and 145 as pseudohyperkalaemia. There was no statistically significant association between sex and true/pseudohyperkalaemia (Table 1). Age was normally distributed in the true hyperkalaemia group but had a negatively skewed distribution in the pseudohyperkalaemia group. There was a statistically significant difference between the two samples, with true hyperkalaemia associated with older age (Table 1). Of the 272 patients, 176 had concurrent FBC results with 147 of them being classified as ‘normal’ (12 removed due to raised Hb, 16 with raised PLT and 1 with raised Hb and PLT). Sixty-five of the ‘normal’ FBC entries were classed as true hyperkalaemia and 82 as pseudohyperkalaemia. For the full patient demographic breakdown, see Supplemental Table 1.
Patient demographic data for all patients with an initial potassium of >6.0 mmol/L included in the final data-set.
Location of repeat potassium samples
One hundred and fifty-seven of the 272 final entries had their repeat potassium taken at a GP practice location and 115 at Hospital emergency departments (A&E or acute medical units). For initial potassium results of 6.1–6.2 mmol/L, the majority of repeats were taken at GP practice locations (67%), whereas for results ≥6.3 mmol/L, there was a fairly even split between the two locations (Figure 1(a)). Of the samples that had a repeat taken at a GP practice location, 51% were classed as true and 49% as pseudohyperkalaemia with a relatively similar divide for those classified as true or pseudohyperkalaemia across all reported initial potassium results (Figure 1(b)). For the samples repeated at emergency departments, 41% were true and 59% pseudohyperkalaemia. Of the initial potassium results between 6.1 and 6.2 mmol/L that were repeated in an emergency department, 76% were pseudohyperkalaemia, whereas for results ≥6.3 mmol/L, there was a relatively equal share between true and pseudohyperkalaemia (Figure 1(c)).
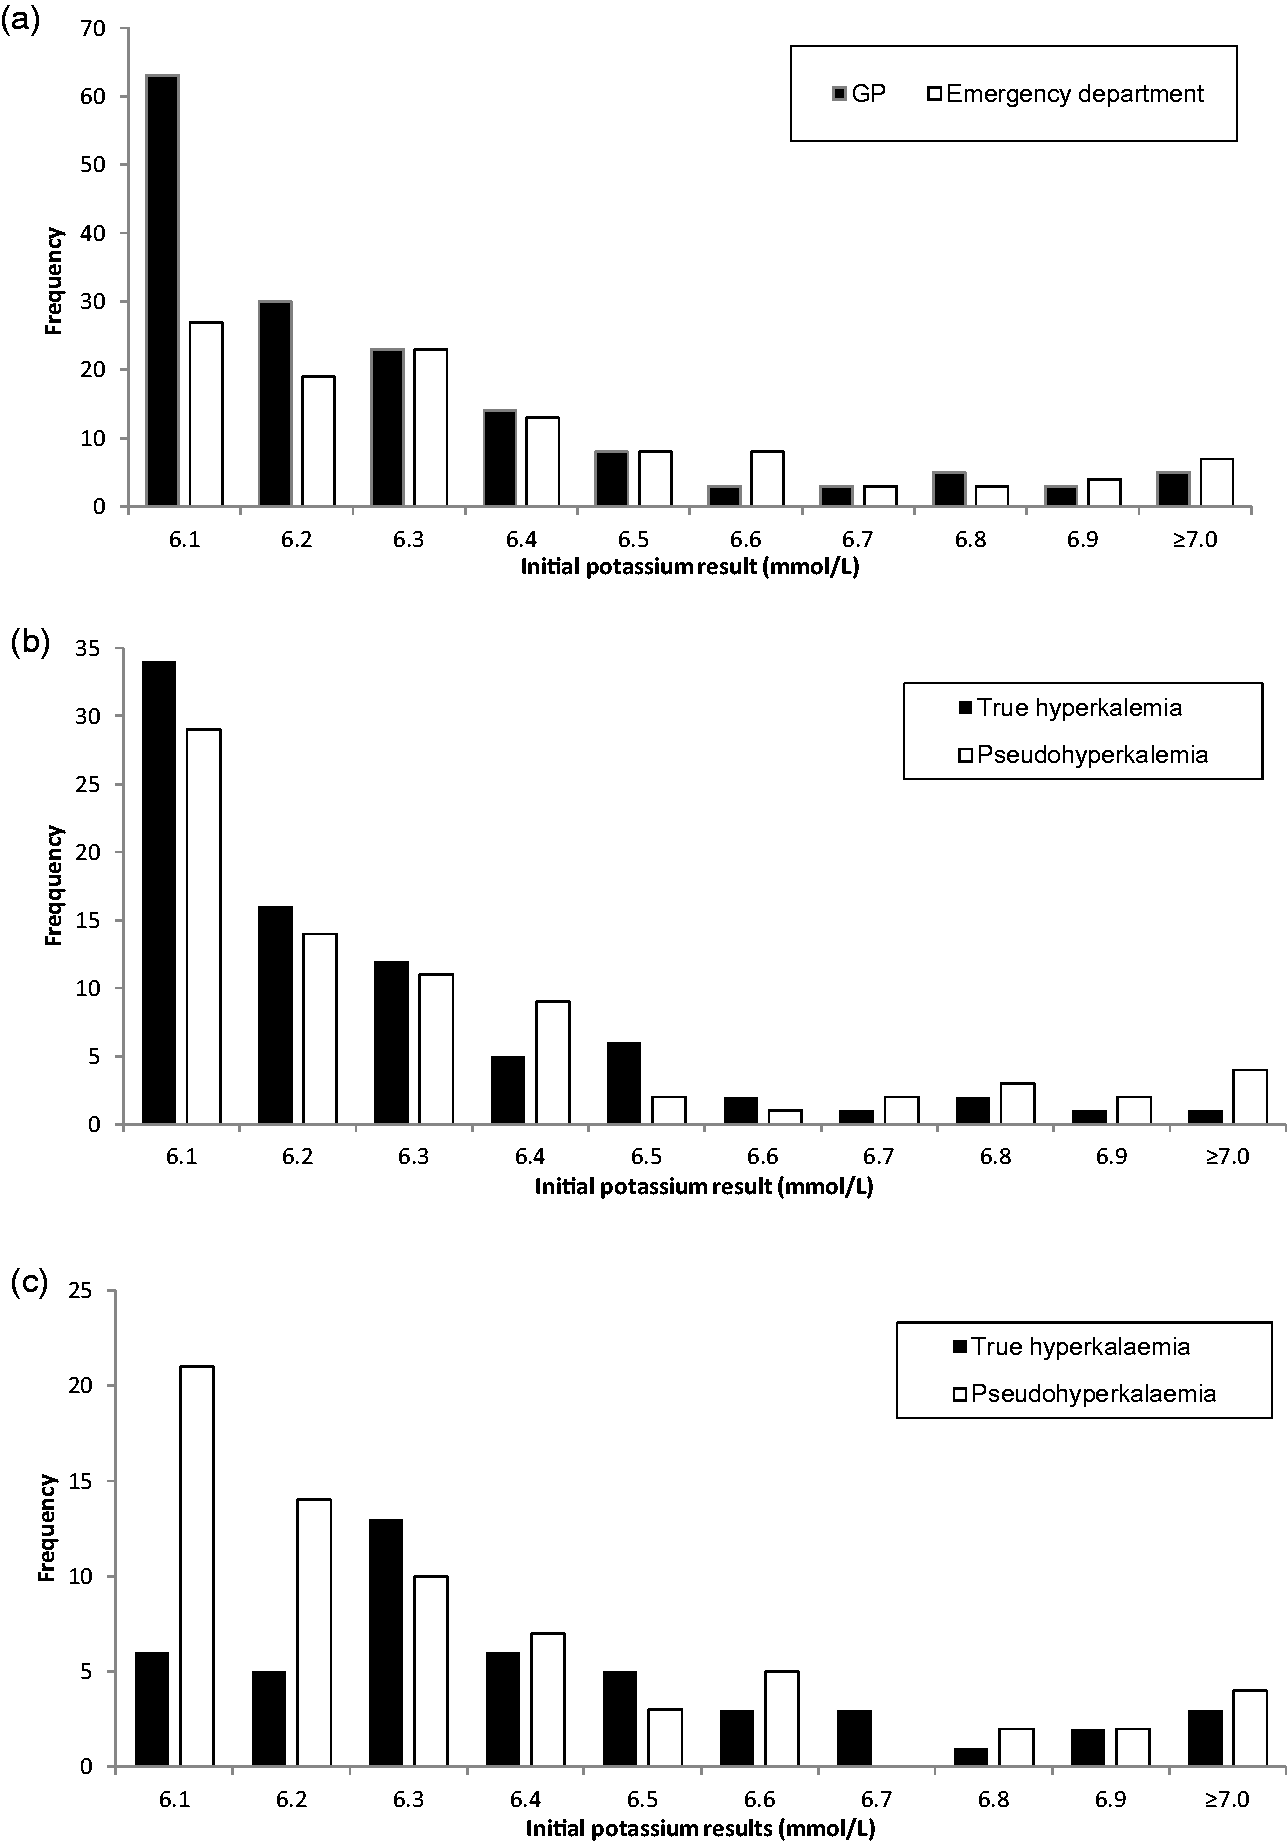
(a) Frequency of GP and emergency department location repeats for initial numerical potassium result. Frequency of true or pseudohyperkalaemia classifications for repeat samples taken at (b) GP or (c) emergency department locations for initial numerical potassium results.
Potential role of the eGFR in patients with an initial potassium >6.0 mmol/L
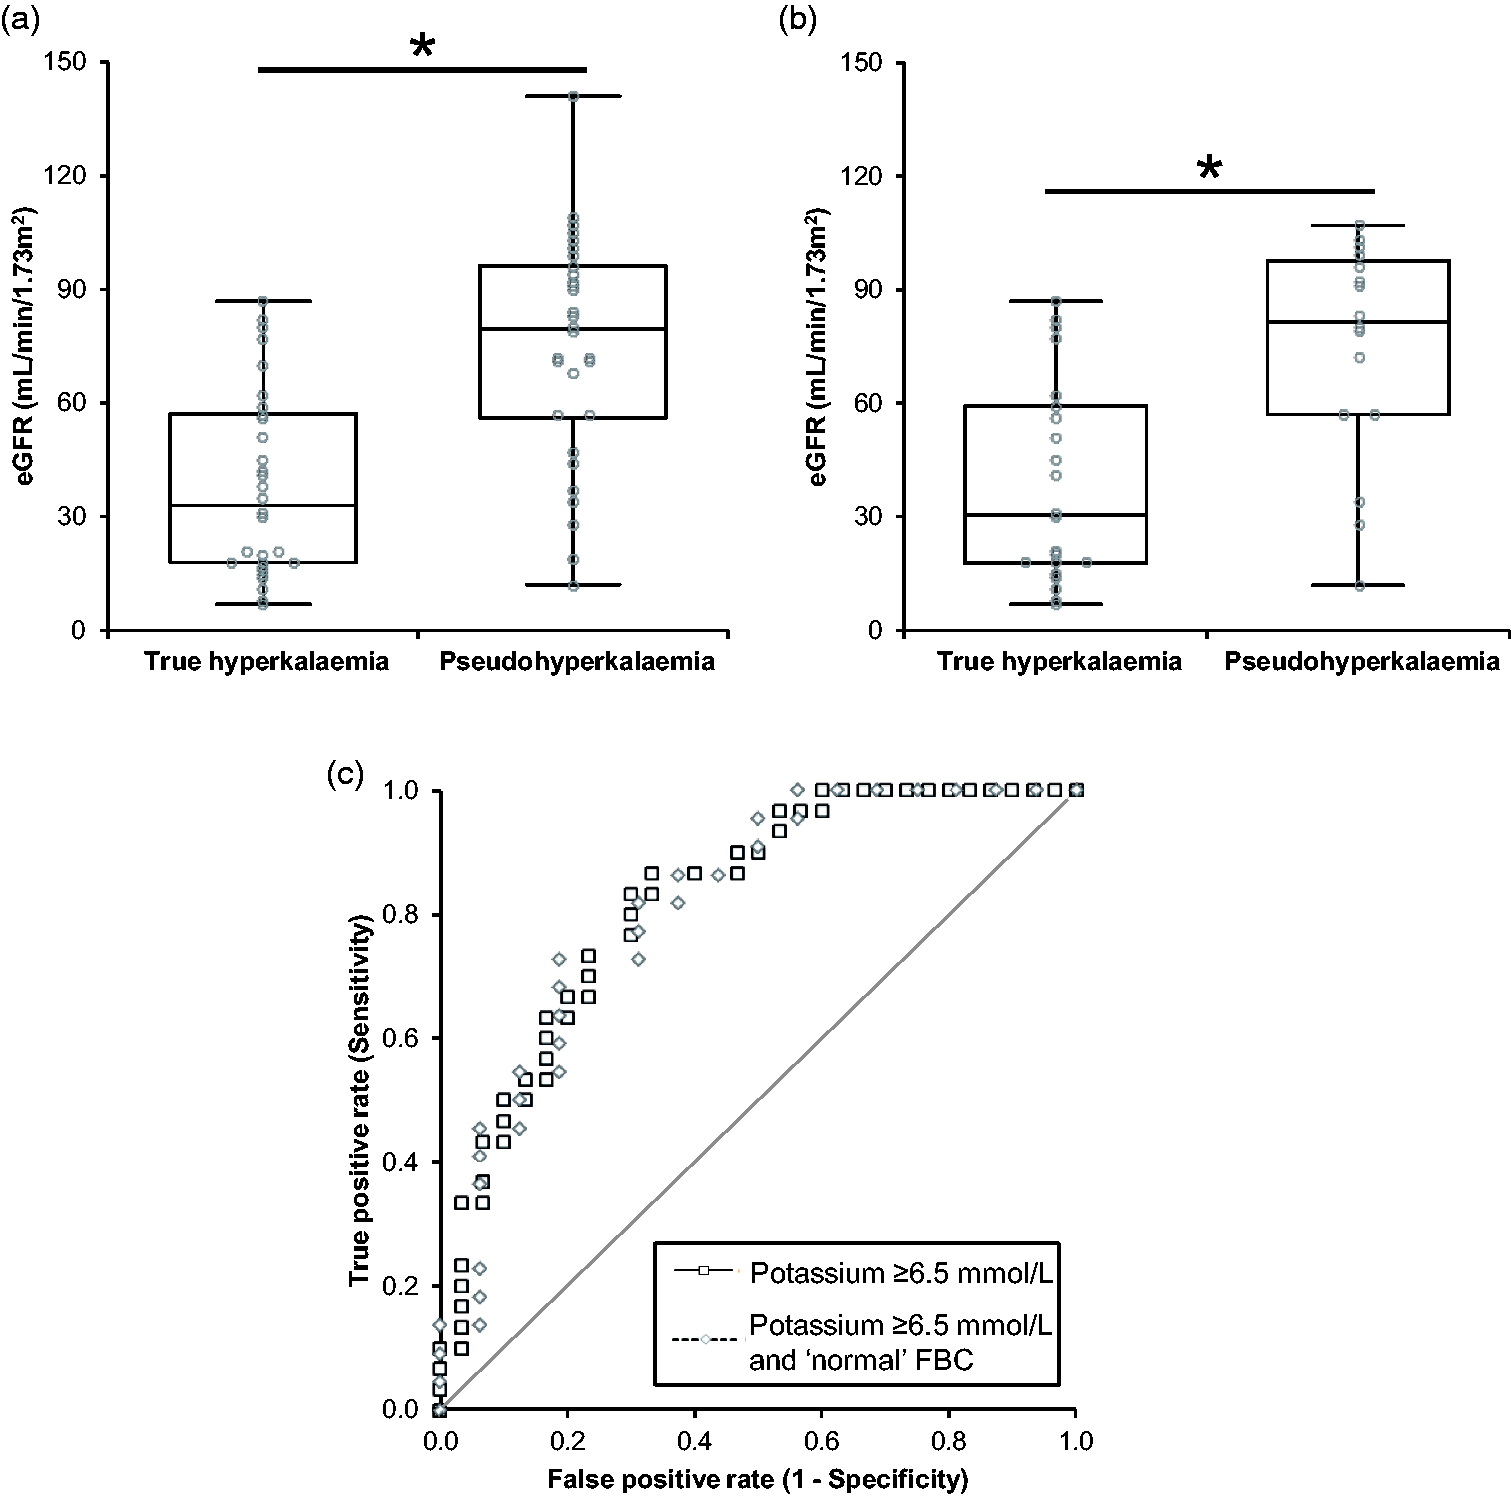
The distribution of eGFR results in all 272 entries of hyperkalaemia >6.0 mmol/L is shown in Figure 2(a). The true hyperkalaemia data were non-normally distributed (P <0.0001), with a median eGFR of 40.0 ml/min/1.73 m2 (95% CI 34.0–47.0) and an interquartile range (IQR) of 41.8 ml/min/1.73 m2. The pseudohyperkalaemia data had a median eGFR of 71.0 ml/min/1.73 m2 (95% CI 62.0–76.0) and an IQR of 43.7 ml/min/1.73 m2. The pseudohyperkalaemia data were normally distributed (P = 0.082) but described as median and IQR to allow data comparison, which demonstrated that there was a statistically significant difference between the two groups (P ≤ 0.0001). When plotted on a ROC, the AUC was 0.72 (95% CI 0.66–0.78) and was statistically significant from 0.5 (P < 0.0001).
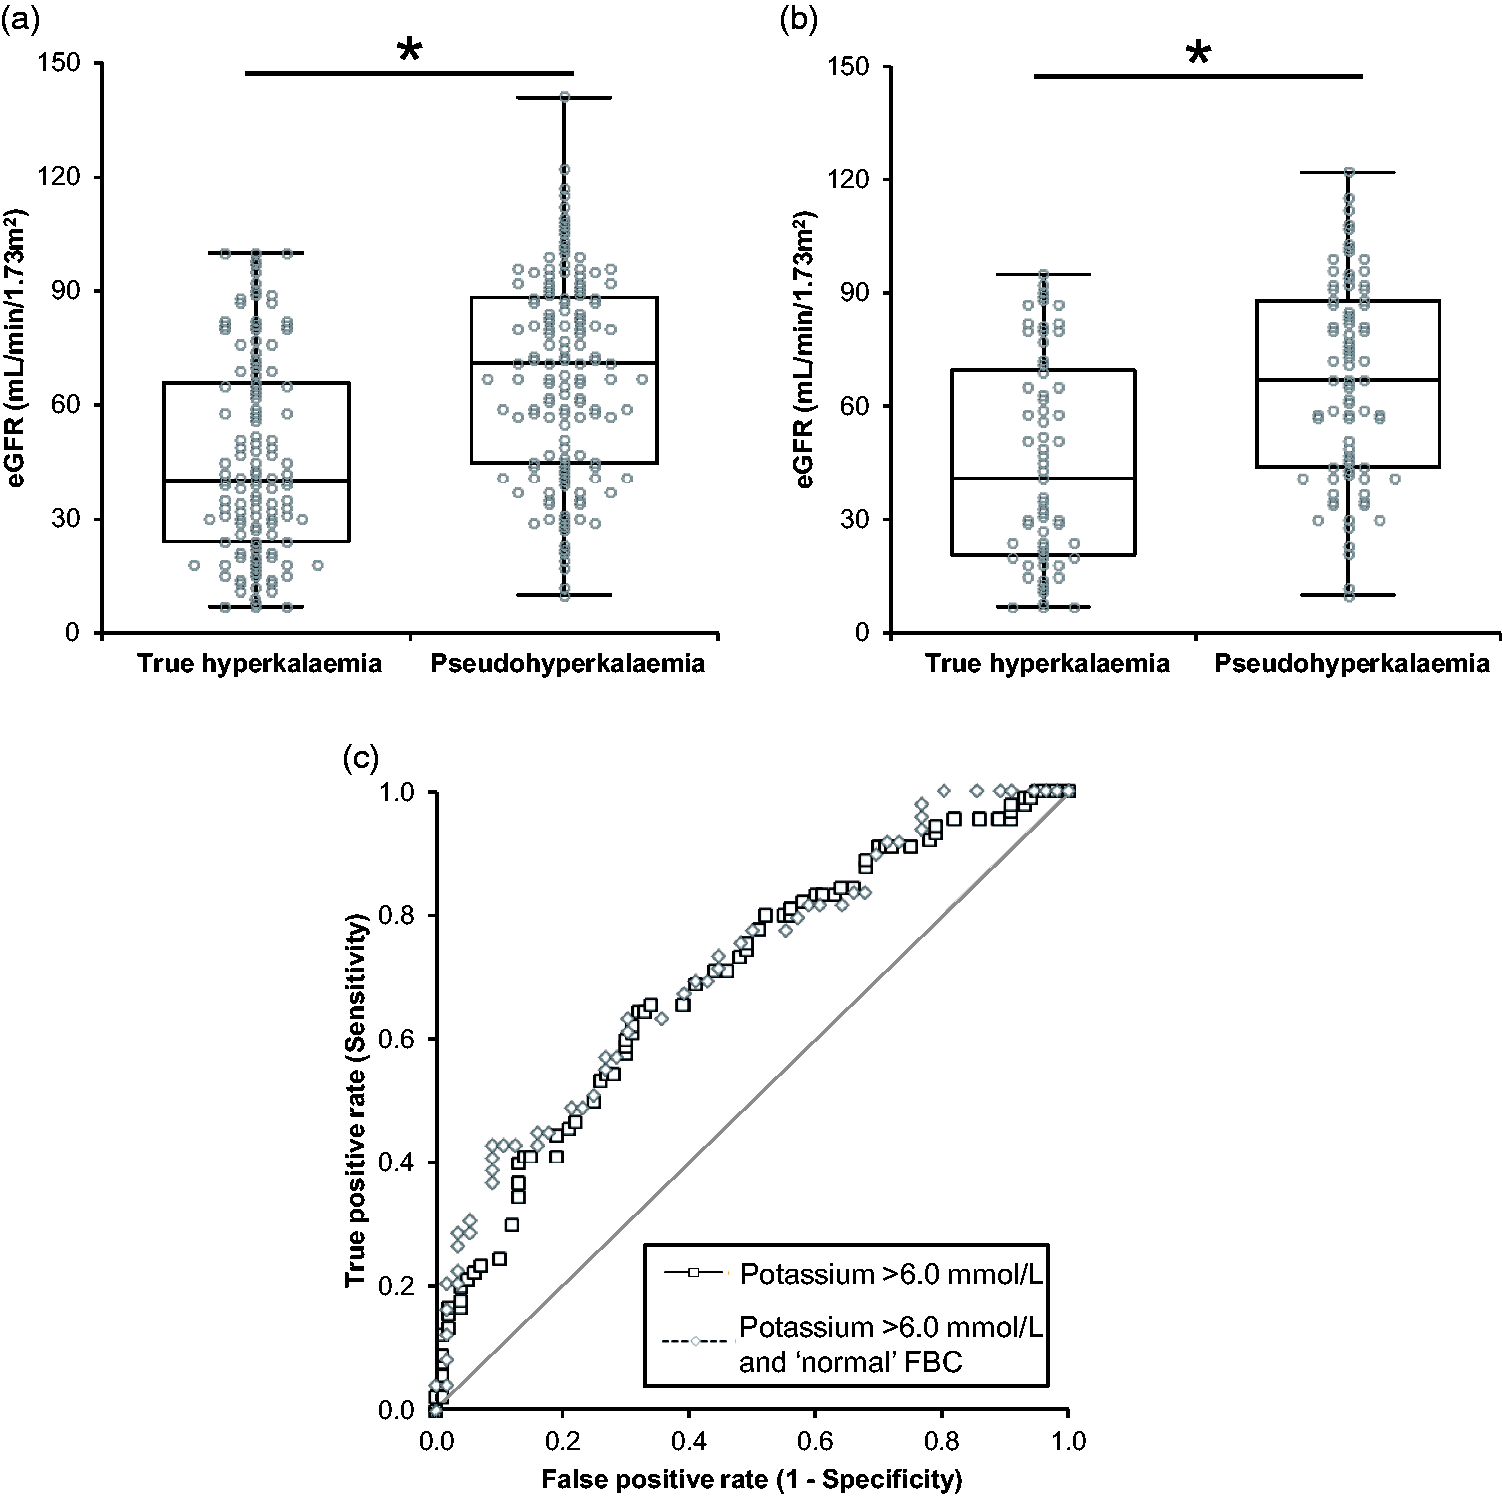
Distribution of the eGFR in (a) all patients with an initial potassium >6.0 mmol/L and (b) all patients with an initial potassium >6.0 mmol/L and a ‘normal’ FBC. Median values are indicated with the horizontal line, boxes represent the inter quartile range and the whiskers the full range of results. * Indicates a statistically significant difference, P <0.05. (c) ROC curves for all patients with an initial potassium >6.0 mmol/L and an initial potassium >6.0 mmol/L and a ‘normal’ FBC.
Figure 2(b) shows the distribution of eGFR in patients with a ‘normal’ FBC. The true hyperkalaemia data were non-normally distributed (P = 0.001) and had a median eGFR of 41.0 ml/min/1.73 m2 (95% CI 29.0–56.0) with an IQR of 49.0 ml/min/1.73 m2. The pseudohyperkalaemia data were normal distributed (P = 0.208) with a median of 67.0 ml/min/1.73 m2 (95% CI 58.0–79.0) and an IQR of 44.1 ml/min/1.73 m2. There was a statistically significant difference between the two groups (P ≤ 0.0001). The AUC for the data was 0.71 (95% CI 0.63–0.80) and statistically significant from 0.5 (P < 0.0001). When using pairwise deletion to compare the hyperkalaemia >6.0 mmol/L and hyperkalaemia >6.0 mmol/L with a ‘normal’ FBC ROC curves (Figure 2(c)), there was no statistically significant difference (P = 0.1577).
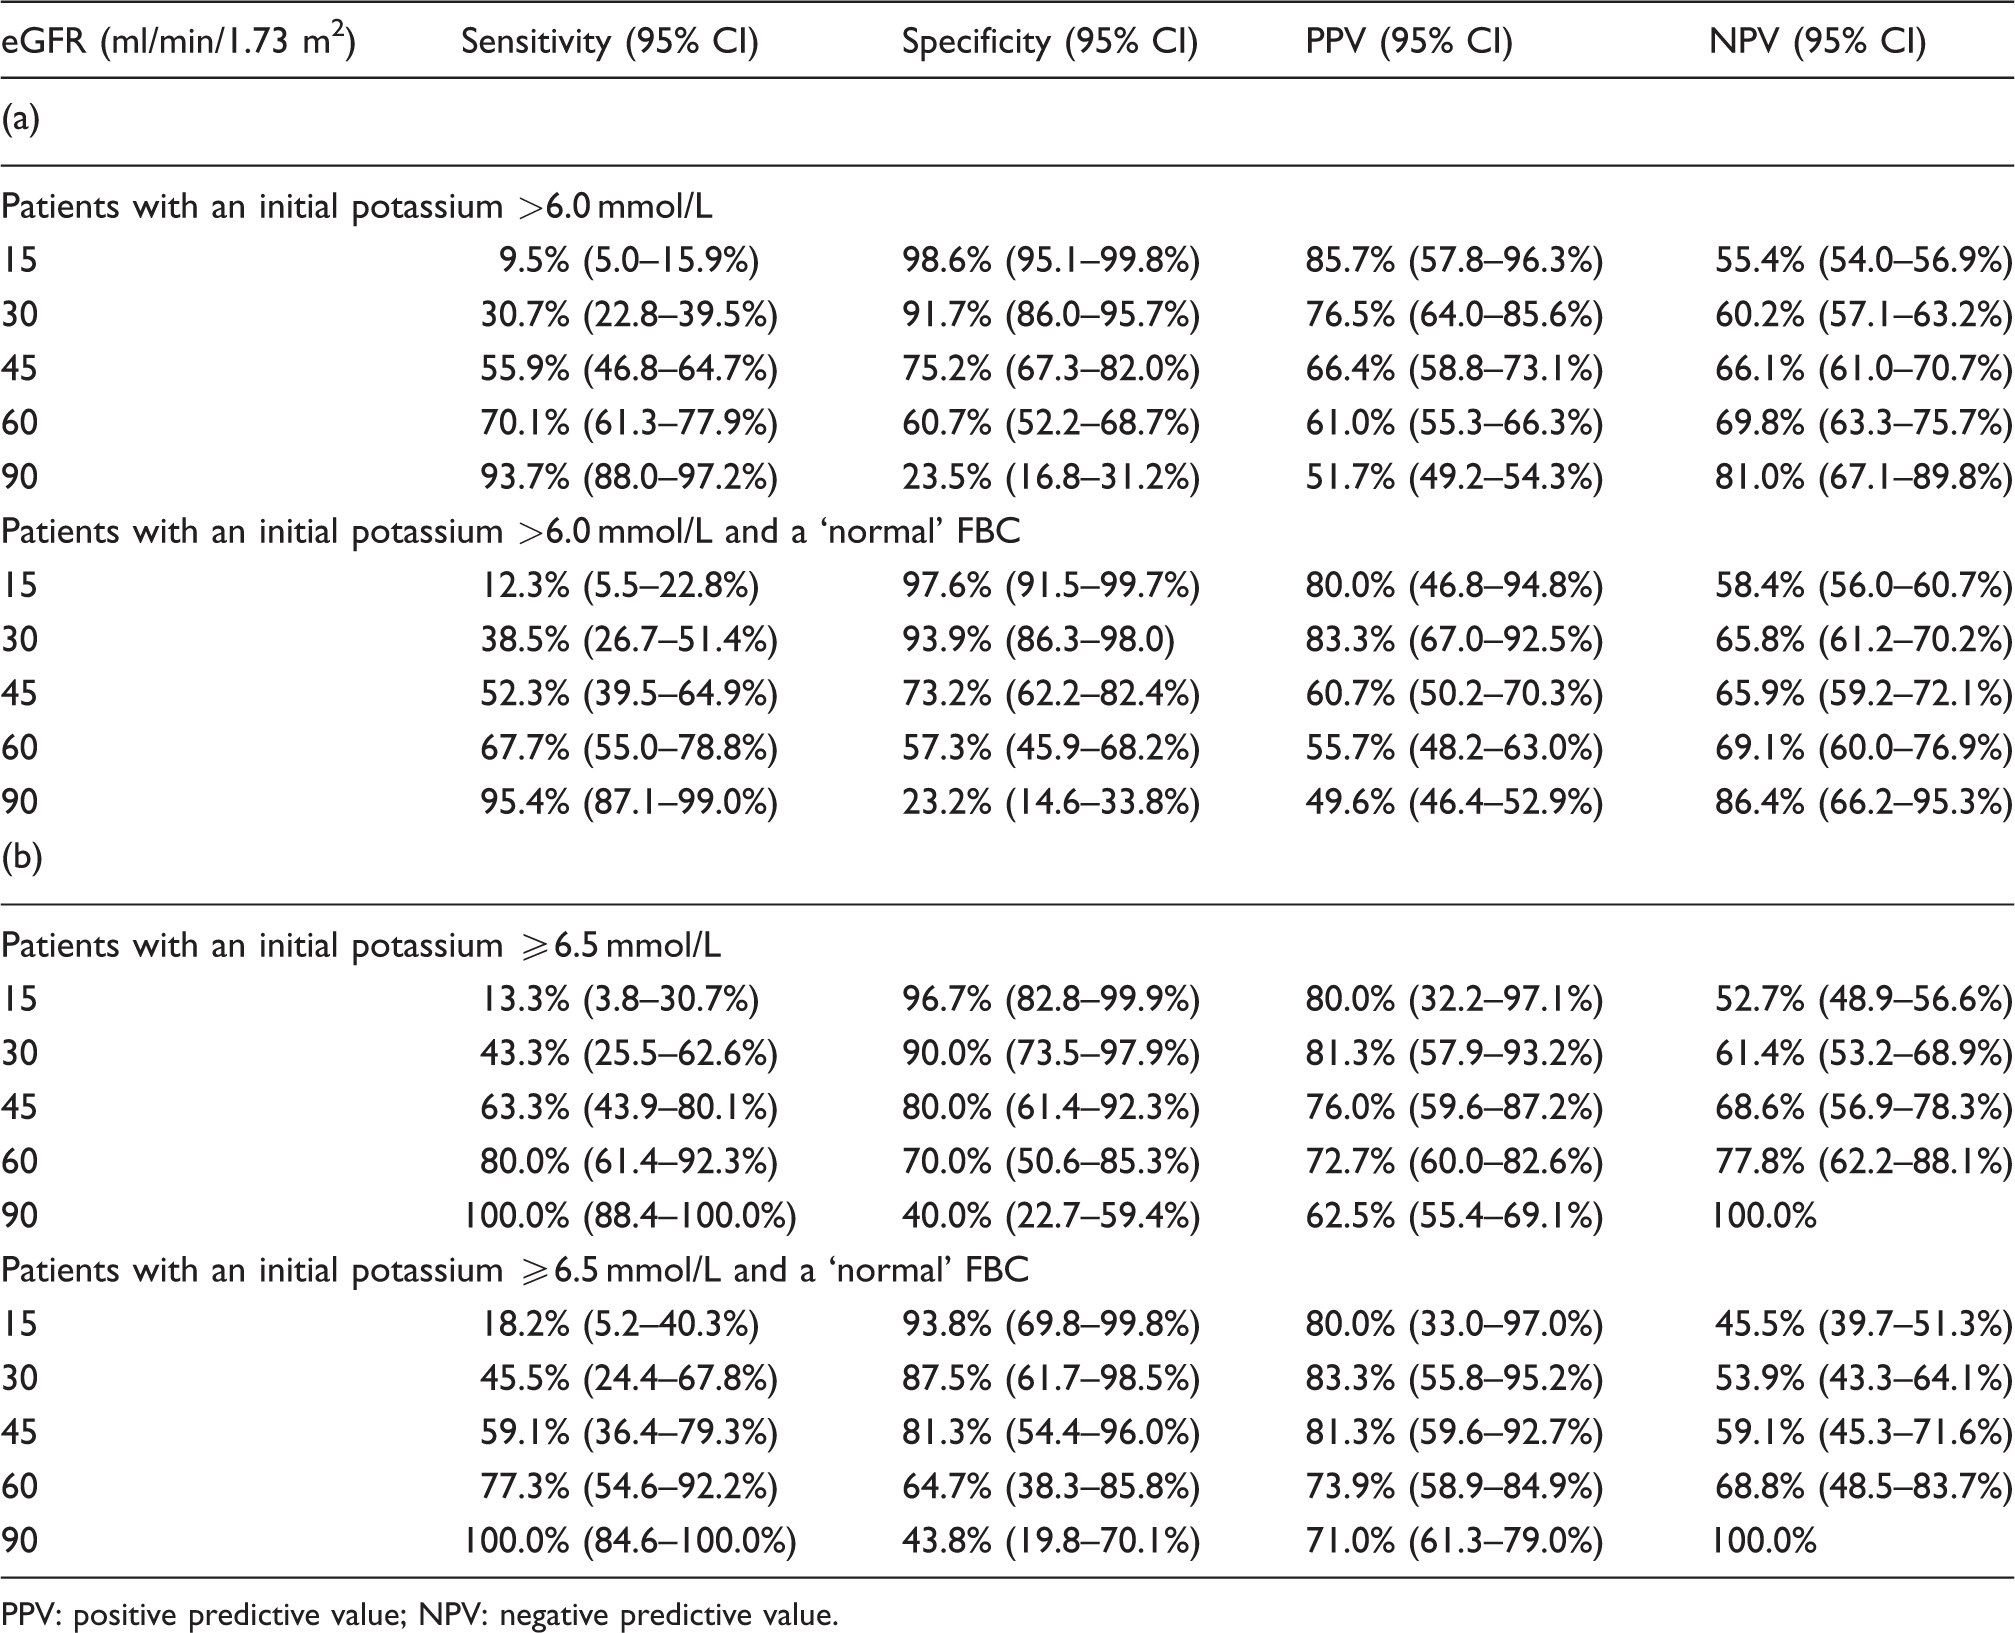
Different cut-points were used to determine the eGFR’s potential in predicting true from pseudohyperkalaemia in all incidences >6.0 mmol/L (Table 2a). At an eGFR of 90 ml/min/1.73 m2, 93.7% of patient with true hyperkalaemia had an eGFR of <90 ml/min/1.73 m2 (sensitivity) and 81.0% of patients with an eGFR of >90 ml/min/1.73 m2 had pseudohyperkalaemia (NPV). Lower sensitivities and NPVs were seen at decreasing eGFR cut-points, but the specificity and positive predictive value (PPV) increased. When only patients with a ‘normal’ FBC were analysed at an eGFR of 90 ml/min/1.73 m2, the sensitivity and NPV increased to 95.4% and 86.4%, respectively (Table 2a). The same pattern of change for sensitivity, NPV, specificity and PPV was seen at decreasing eGFR cut-points.
Performance of the eGFR in classifying true and pseudohyperkalaemia in (a) patients with an initial potassium of >6.0 mmol/L and (b) ≥6.5 mmol/L.
PPV: positive predictive value; NPV: negative predictive value.
GP potassium results ≥6.5 mmol/L
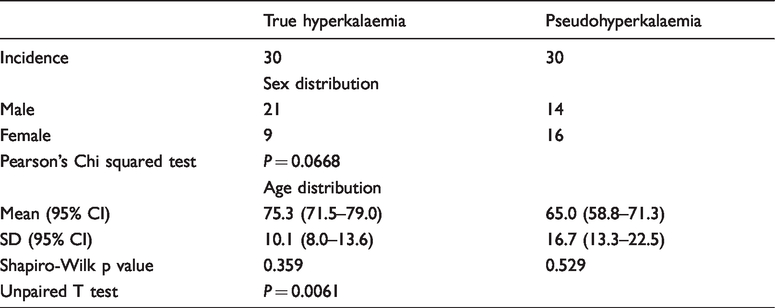
There were 90 reported potassium results ≥6.5 mmol/L from GP locations in 2017 (0.04% of all GP requests). After applying the exclusion criteria, 60 entries from 60 different patients were included in the final data-set with 30 classified as true hyperkalaemia and 30 as pseudohyperkalaemia (Table 3). There was no significant association between sex and true/pseudohyperkalaemia. Age was normally distributed in both groups and there was a statistically significant different between them, with true hyperkalaemia being associated with older age (Table 3). Forty-two of the 60 entries had a concomitant FBC and 38 were classified as being normal (2 removed due to raised Hb, 1 with raised PLT and 1 with raised Hb and PLT). Of those with a ‘normal’ FBC, 22 were classified as true hyperkalaemia and 16 as pseudohyperkalaemia. For the full patient demographic breakdown, see Supplemental Table 2.
Patient demographic data for all patients with an initial potassium of ≥6.5 mmol/L included in the final data-set.
Potential role of the eGFR in patients with an initial potassium ≥6.5 mmol/L
The distribution of eGFR results in all 60 entries of hyperkalaemia ≥6.5 mmol/L is shown in Figure 3(a). The true hyperkalaemia data were non-normally distributed (P = 0.015) with a median eGFR of 33.0 ml/min/1.73 m2 (95% CI 18.0–51.0) and an IQR of 39.3 ml/min/1.73 m2. The pseudohyperkalaemia data were normally distributed (P = 0.476) with a median eGFR of 79.5 ml/min/1.73 m2 (95% CI 68.0–92.0) and an IQR of 40.1 ml/min/1.73 m2. There was a statistically significant difference between the two groups (P ≤ 0.0001). The AUC on the ROC curve was 0.83 (95% CI 0.72–0.93) which was statistically significant from 0.5 (P < 0.0001).
Distribution of the eGFR in (a) all patients with an initial potassium ≥6.5 mmol/L and (b) all patients with an initial potassium ≥6.5 mmol/L and a ‘normal’ FBC. Median values are indicated with the horizontal line, boxes represent the inter quartile range and the whiskers the full range of results. * Indicates a statistically significant difference, P <0.05. (c) ROC curves for all patients with an initial potassium ≥6.5 mmol/L and an initial potassium ≥6.5 mmol/L and a ‘normal’ FBC.
Figure 3(b) shows the distribution of eGFR in patients with an initial potassium ≥6.5 mmol/L and a ‘normal’ FBC. The true hyperkalaemia data were non-normally distributed (P = 0.021) with a median eGFR of 30.5 ml/min/1.73 m2 (95% CI 18.0–59.0) and an IQR of 41.5 ml/min/1.73 m2. The pseudohyperkalaemia data were normally distributed with a median eGFR of 81.5 ml/min/1.73 m2 (95% CI 57.0–99.0) and an IQR of 40.8 ml/min/1.73 m2. There was a statistically significant difference between the mean of two samples (P = 0.0009). When plotted on a ROC, the AUC was 0.82 (95% CI 0.68–0.96) which was statistically significant from 0.5 (P <0.0001). When using pairwise deletion to compare the hyperkalaemia ≥6.5 mmol/L and hyperkalaemia ≥6.5 mmol/L with a ‘normal’ FBC ROC curves (Figure 3(c)), there was no statistical difference between the them (P = 0.9542).
The potential role of the eGFR in differentiating true from pseudohyperkalaemia at different cut-points in patients with an initial potassium ≥6.5 mmol/L is shown in Table 2b. At an eGFR of 90 ml/min/1.73 m2, the sensitivity and NPV were 100% when all patients and then only those with a ‘normal’ FBC were included. The sensitivity and NPVs dropped with lower eGFR cut-points, while the specificity and PPV increased.
Discussion
The purpose of this study was to retrospectively investigate the effect of renal function on differentiating true from pseudohyperkalaemia. The major findings of our study are:
Around 50% of all GP hyperkalaemia results >6.0 mmol/L are caused by pseudohyperkalaemia True hyperkalaemia, especially when severe (≥6.5 mmol/L), is not associated with normal renal function
Our findings are important as they provide details on the incidence of pseudohyperkalaemia in primary care and demonstrate the association between true hyperkalaemia and renal function. These findings will add value to how hyperkalaemia results are interpreted by laboratory and clinical staff.
There are no other reports of the incidence of pseudohyperkalaemia in primary care, so we cannot compare these figures. However, it is probable that the incidence of pseudohyperkalaemia will differ significantly across the country, as the factors that contribute to pseudohyperkalaemia (time to centrifugation, geographical seasonal temperature changes and phlebotomy practice) will no doubt be variable in different settings. The majority of patients with an initial potassium of >6.0 mmol/L had their repeat sample taken at a GP location rather than an emergency department. The reason why a patient goes to an emergency department for a repeat and not a GP practice is probably not based on a single factor but many, such as the numerical potassium value, if the result was unexpected and the paired eGFR result. It is therefore difficult to fully elucidate why certain patients have GP repeats and others have emergency department repeats. Nevertheless, we observed some interesting patterns, for example 67% of samples with potassium of 6.1–6.2 mmol/L had repeats at GP locations. This may be because at these concentrations of potassium GPs may feel that the result is not immediately life-threatening, so an emergency department admission was not warranted. Another interesting observation was that of those that had emergency department repeats for initial potassium results of 6.1–6.2 mmol/L, 76% were classified as pseudohyperkalaemia. Are GPs therefore using the emergency departments as a rapid way to confirm spurious results in unexpected cases? The answer to this question is difficult to determine, but what is clear is that there needs to be a better way to differentiate between true and pseudohyperkalaemia, and we believe renal function can help.
Our present study has shown that in patients with potassium >6.0 mmol/L and an eGFR of ≥90 ml/min/1.73 m2, the NPV is 81%. This finding therefore demonstrates that true hyperkalaemia is not associated with normal renal function. However, given that the NPV is not 100%, a small fraction of patients will have true hyperkalaemia, so some degree of caution must be applied at this concentration of hyperkalaemia. It has long been stated that true hyperkalaemia is exceedingly rare in patients with normal renal function. 15 However, the only previous evidence we could find that directly supports this claim was a small study involving 45 patients which demonstrated that haemolysed potassium results need not be repeated in patients with an eGFR of ≥60 ml/min, as the repeat potassium is almost always within the reference interval. 28 Our study has therefore help confirm this association further. Patients classified as true hyperkalaemia were older than those with pseudohyperkalaemia. As renal function declines with age, this is consistent with the notion that true hyperkalaemia is rare in patients with normal renal function. 29
By removing patients with ‘abnormal’ FBCs, the NPV increased to 86% at an eGFR cut-point of 90 ml/min/1.73 m2, providing stronger evidence that true hyperkalaemia is not associated with normal renal function. Of all the patients with an eGFR of ≥90 ml/min/1.73 m2 and a ‘normal’ FBC, only 3 out of the 22 incidences were classified as having true hyperkalaemia. When looking at the repeat results of these patients, all three had potassium results of 5.4 mmol/L, so they only just met our true hyperkalaemia criteria. There was no overall improved potential of the eGFR, as judged by the AUC, when patients with an ‘abnormal’ FBC were removed from the data-set. The only major impact was improving the NPV at a cut-point of 90 ml/min/1.73 m2, which demonstrates that patients with a blood cell dyscrasia and an eGFR of ≥90 ml/min/1.73 m2 were more often classified as having true rather than pseudohyperkalaemia.
We also analysed all patients with an initial potassium result of ≥6.5 mmol/L at an eGFR cut-point of 90 ml/min/1.73 m2 and found that the NPV was 100%. This was true when all patients were included and only those with a ‘normal’ FBC. The AUC was greater for the ≥6.5 mmol/L curves when compared with the >6.0 mmol/L curves, demonstrating that the eGFR is a more powerful potential marker at higher potassium concentrations. These data demonstrate that critical concentrations of true hyperkalaemia are not associated with normal renal function. This should have an impact upon the current Royal College of Pathology policy on urgent communication of critical potassium results, which is currently any result ≥6.5 mmol/L, regardless of normal renal function. 2 We believe that there is an argument that when a patient has a potassium of ≥6.5 mmol/L and an eGFR of ≥90 ml/min/1.73 m2, the results should not be communicated out of hours and patients should not be referred to the emergency department. Instead, the result should be phoned back to the requestor within next working day hours (9.00–5.30) and the patient asked to have a routine repeat potassium. In our data-set, 8 of the 11 incidences of pseudohyperkalaemia with an initial potassium of ≥6.5 mmol/L and an eGFR of ≥90 ml/min/1.73 m2 attended the emergency department for a repeat and seven of these were out of hours. There is a risk to this approached in that a true case of hyperkalaemia in a patient with normal renal function may be missed, but based on the evidence presented in this study, this did not occur. We suggest similar studies are done in other laboratories to further evaluate this approach. If the above is adopted, the economic benefits would be a dramatic reduction in the number of patients attending emergency departments and a reduction in patient anxiety and frustration.
As with any scientific study there are caveats. The first of our study is related to our exclusion criteria. We excluded samples if the elapsed time between sample collection and receipt was >6 h, but if the time of sample collection was missing and elapsed time not known, we included the sample. Unfortunately, it is a recognized problem that the time of sample collection is often missing, which is a particular issue when interpreting potassium results. 30 In our database, 88 initial and 58 repeat samples did not have times of sample collection. If we would have removed all samples with no collection time the number of entries would have fallen from 272 to 151. This would have drastically reduced the entries in our database and the power of our findings, so we have kept them in, but are aware that this is a flaw and may have led to ‘old’ samples being included in the data-set. A further point to add is that the time of receipt by the lab is not the same as the time of centrifugation. However, according to our internal audit results, samples are spun within 10–30 min of being booked in the reception, so we do not expect a large difference between them.
A further caveat of our classification system is that we cannot guarantee that patients did not have any form of intervention that may have lowered their potassium between the initial and repeat sample. To mitigate this, we only included GP patients, as it would be against best practice guidelines for these patients to be started on therapy before a repeat potassium result is available. 31 We did not include blood gas analyser results in our data-set, so there is a possibility that the patients who came to the hospital for their repeat potassium had it measured on a blood gas analyser and the first repeat sample received by the lab was the post-treatment sample. Although this is possible, we do not think it would have had a major impact, as only 43% of repeats were taken at emergency departments and local guidance is that blood gas results should be confirmed by a laboratory measurement before initiating therapy. A final caveat to the classification system is that we cannot rule-out that both the initial and repeat increases in potassium were due to spurious causes, leading to a false true hyperkalaemia classification. We would hope that this was not the case, as when a repeat potassium sample is taken for possible pseudohyperkalaemia, hospital policy is that all precautions should be taken to remove in vitro increases. Further to this, other results, such as creatinine or the FBC, may also have been spurious, although this is of a rarer occurrence. We therefore believe that although there are a number of caveats to our study, they are of a rare occurrence and should not have had a major impact on our final outcomes.
Also worthy of discussion is how we retrospectively classified patients as having true or pseudohyperkalaemia. We tried to take the most unbiased and statistically valid approach to this, so used RCVs in combination with the reference interval. We could have used the RCV alone and classified any patient with a repeat potassium >RCV as having pseudohyperkalaemia. However, if we used this approach, certain patients would have been classified as having pseudohyperkalaemia, even though they had two potassium results above the reference interval. For example, take a patient with an initial potassium of 6.4 mmol/L and a repeat of 5.6 mmol/L the next day. The delta change is greater than the RCV, but the patient has had two instances of hyperkalaemia in 24 h, so warrants being investigated further. For this reason, we combined the RCV with the reference interval so a patient would only be classified as having pseudohyperkalaemia if their repeat result was greater than the RCV and in the reference interval. If we would have taken the approach of using the RCV alone, then the significance of our results would have been greater. To calculate our RCV, we used a CVi of 4.2%, which is the biological variation of potassium in ‘healthy’ individuals. 21 A single study has shown that the CVi of potassium in ‘unhealthy’ post kidney transplant individuals is higher at 6.7%. 32 This would mean that ‘unhealthy’ patients would need a larger change in repeat potassium results to be classified as pseudohyperkalaemia. We chose to use the CVi of ‘healthy’ patients in our study, as we had no prior knowledge of health conditions, so we assumed all were healthy. This may have had an impact on our final classification system, but we hope that by combining the RCV with the reference interval we have reduced this impact.
To put the results of our study into perspective, a clinical audit was performed to examine the treatment of hyperkalaemia in our Trust, based on the Guidelines and Audit Implementation Network’s guidelines for the treatment of hyperkalaemia in adults. 31 The guidelines state that once pseudohyperkalaemia has been ruled-out by a repeat sample, urgent treatment is required if the serum potassium is ≥6.5 mmol/L. In our audit, we examined all cases of hyperkalaemia ≥6.5 mmol/L within Epsom and St Helier Hospitals in October 2018; approval was granted by the hospital clinical audit team. Twelve patients were included, 8 had an admission eGFR of <10 ml/min/1.73 m2 with the remaining patients having eGFRs of 27, 41, 44 and 71 ml/min/1.73 m2. The patient with an eGFR of 71 ml/min/1.73 m2 had hyperkalaemia secondary to increased lymphocyte turnover due to leukaemia. The cause of hyperkalaemia in the other 11 patients was linked to chronic kidney disease or an acute kidney injury. This is in-line with our major finding that true hyperkalaemia is not associated with normal renal function. During their admission, two patients were treated with pharmacological treatment, five patients with dialysis and two with pharmacological treatment and dialysis. The notes for one patient could not be located, and two patients were recognized to be dying so their management was switched to palliative care. Of the 12 patients, four died during their hospital admission of which two were palliative. This associated poor prognosis is in keeping with the literature. 33 , 34 The results of this audit demonstrate the clinical significance of hyperkalaemia and why being able to differentiate between true and pseudohyperkalaemia is so important.
In conclusion, this study has provided an initial evidence base to conclude that true hyperkalaemia is not associated with normal renal function. This finding has a number of potential implications, including the appropriateness of current urgent communication guidelines and how cases of hyperkalaemia and normal renal function are followed up. To build on this foundation further, similar studies will need to be performed by laboratories around the country to increase the sample size. If other laboratories use the same method and apply it to their local population, the findings in our study can be verified and combined to generate more robust data. If these data are in support of our findings, then we can consider implementing our approach regarding how to handle potassium results ≥6.5 mmol/L with normal renal function. If more data are generated, they will also allow us to weight up the clinical risks and economic benefits of this approach. In the age of Getting It Right First Time and reducing unwanted variations in services and practices, we believe that if other laboratories perform these studies and corroborate our findings, a unified approach to hyperkalaemia can be developed.
Supplemental Material
sj-pdf-1-acb-10.1177_0004563220966858 - Supplemental material for The potential role of the eGFR in differentiating between true and pseudohyperkalaemia
Supplemental material, sj-pdf-1-acb-10.1177_0004563220966858 for The potential role of the eGFR in differentiating between true and pseudohyperkalaemia by Thomas G Morris, Sushmita Lamba, Thomas Fitzgerald, Gary Roulston, Helen Johnstone and Mehdi Mirzazadeh in Annals of Clinical Biochemistry
Footnotes
Acknowledgements
We would like to thank Stephen Bunnage, Caren Dove and Lygia D'mello for data collection and processing.
Declaration of conflicting interests
The author(s) declared no potential conflicts of interest with respect to the research, authorship, and/or publication of this article.
Funding
The author(s) received no financial support for the research, authorship, and/or publication of this article.
Ethical approval
Not applicable.
Guarantor
MM.
Contributorship
All authors contributed to the design and execution of the study. All authors participated in manuscript drafting and critical revision.
Supplemental material
Supplemental material for this article is available online.
References
Supplementary Material
Please find the following supplemental material available below.
For Open Access articles published under a Creative Commons License, all supplemental material carries the same license as the article it is associated with.
For non-Open Access articles published, all supplemental material carries a non-exclusive license, and permission requests for re-use of supplemental material or any part of supplemental material shall be sent directly to the copyright owner as specified in the copyright notice associated with the article.